Supplemental Digital Content is available in the text
Keywords: body mass index, chronic kidney disease, obesity, waist circumference, waist-to-height ratio
Abstract
This study aims to investigate the association of body mass index (BMI), waist circumference (WC), and waist-to-height ratio (WHtR) with chronic kidney disease (CKD).
A cross-sectional survey was conducted in a nationally representative sample of 123,629 Chinese urban adults who participated in health examinations between 2008 and 2009. BMI, WC, and WHtR were measured, as well as serum and urine biochemical tests. CKD was defined as an estimated glomerular filtration rate (eGFR) <60 mL/min/1.73 m2 or urine protein positivity (proteinuria)≥1+ with dipstick testing.
WHtR had the largest areas under ROC curve for CKD in men and women, followed by WC and BMI. Higher levels of BMI, WC, and WHtR were each associated with an increased odds for CKD among men. For per unit size change, the multivariable-adjusted odds ratios (ORs) and 95% confidence intervals (CIs) of CKD were 1.19 (95% CI, 1.13–1.25) for BMI, 1.12 (95% CI, 1.08–1.16) for WC, and 1.13 (95% CI, 1.10–1.17) for WHtR. The corresponding values were significant in multivariable models among women aged 40 years and above. Using Chinese-recommended cutoffs for BMI (≥24 kg/m2), WC (≥85 cm for men, and ≥80 cm for women), and WHtR (≥0.05), WHtR was superior in the association with CKD than BMI for men, whereas WC was superior for women.
Increased obesity indices were positively associated with the odds of CKD. Central obesity, defined by WC and WHtR, may be more closely correlated with CKD for Chinese urban adults.
1. Introduction
The prevalence of chronic kidney disease (CKD) is substantially increasing over the past decades in many developed and developing countries, representing a global challenge for public health.[1] According to a national survey in China, approximately 10.8% of adults are suffering from CKD, and possibly at an increased risk for end-stage renal disease (ESRD), cardiovascular disease (CVD), and premature mortality.[2] Patients with kidney failure not only have a poorer life quality but also a huge economic burden for the demands of dialysis and transplantation treatment.[3] Early identification and management of the risk factors related to CKD can delay or alleviate progression to ESRD and cardiovascular complications.[4]
Notably, the rise of CKD parallels a rise in the prevalence of obesity in the recent years.[5] Obesity is recognized as a primary risk factor for diabetes, hypertension, and metabolic syndrome, all common risk factors of CKD.[6–8] Obesity is also reported as a direct contributor for CKD independent of traditional CVD risk factors in other studies.[9,10] Weight loss is benefit for obese adults with CKD 1 to 4 who are not being treated by dialysis.[4] The mechanism linking obesity and CKD incidence and progression may be related to hemodynamic and hormonal effects, insulin resistance, adipokine, low-grade inflammation, oxidative stress, and endothelial dysfunction.
BMI is a proxy for degree of obesity in epidemiological studies and clinic practice, defining overweight as a BMI of 25 kg/m2 or greater and obesity as a BMI of 30 kg/m2 or greater by WHO.[11] The Framingham Heart Study investigated the association between BMI and onset of stage 3 CKD, reporting that obese people had a 68% increased odds of developing stage 3 CKD, although the relationship was mediated by other CVD risk factors.[12] Several prospective studies have suggested that high BMI is associated with the increased risk of ESRD in Japanese men and Americans.[13,14] Central obesity defined by waist circumference (WC) is reported to increase CKD risk regardless of BMI in a cohort study.[15] Reports from the Atherosclerosis Risk in Communities (ARIC) Study and the Cardiovascular Health Study (CHS) demonstrated that waist-to-hip ratio (WHR), but not BMI, was positively correlated with a greater risk of incidence of CKD and mortality among individuals with stage 3 to 4 CKD.[16,17] In addition, cross-sectional studies have suggested that waist-to-height ratio (WHtR) is superior to WC as well as being superior to WHR in the discrimination of CKD and CVD risk factors in regional populations.[18,19] The classifications of obesity and central obesity vary across studies, genders, racial/ethnic, and diverse populations; it remains controversial, which is the simple and best index of obesity for predicting CKD among Chinese adults. In the present study, we determined the associations between different obesity indices, including BMI, WC, WHtR, and the presence of CKD, in particularly explored the relationships by sex and age groups in a large population-based cross-sectional study.
2. Methods
2.1. Study population
This cross-sectional study was conducted in 7 health examination centers, a completed national health survey aimed to determine the prevalence and related risk factors of chronic diseases in Chinese urban adults. The design, methods, and results of the study have been described in a previous study.[20] The 2-stage cluster sampling method was used to, first selected 7 cities according to geographical region and economic development (North: Beijing, Shijiazhuang, and Changchun; South: Chongqing, Changsha, Hangzhou, and Chengdu), and then randomly selected 1 local representative health examination center from each city. A total of 123,629 subjects (78,142 men and 45,487 women) who participated in annual health check programs between 2008 and 2009 were included in this study. Participants were excluded if they did not have information on participant demographics; personal characteristics, including weight, height, and WC; clinical characteristics, including blood pressure, blood glucose, lipid concentrations, uric acid, serum creatinine, and proteinuria. Subjects who reported a history of cancer or pregnancy or lactating were also excluded (details in Fig. 1). The Ethical Committee of the Chinese People's Liberation Army General Hospital and National Research Institute for Family Planning approved the proposal of this study and all participants gave informed written consents.
Figure 1.
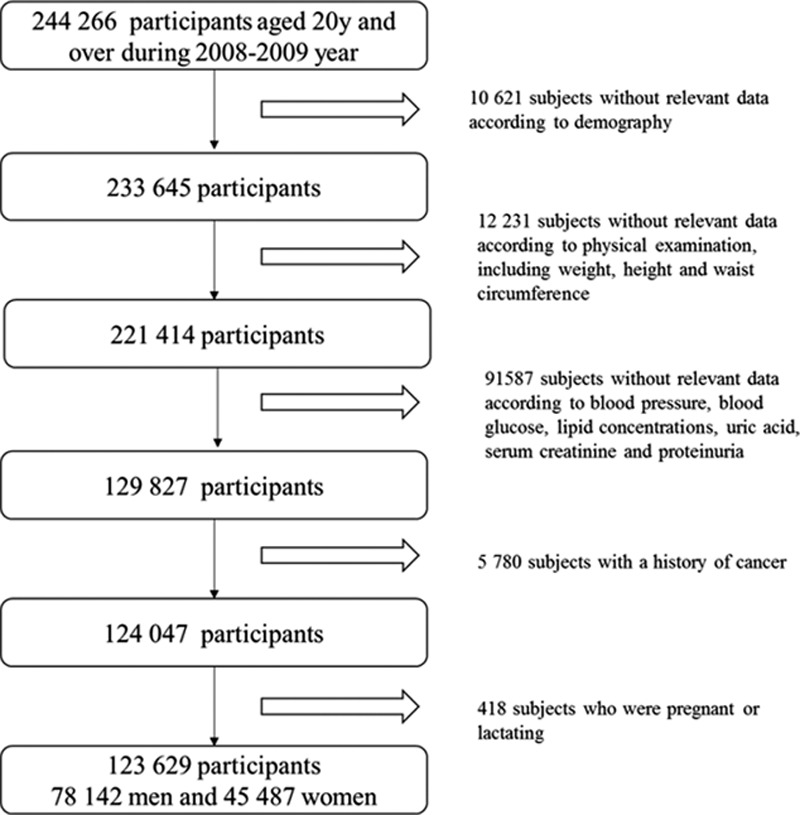
Flowchart of participant recruitment and derivation of the population used in the final analysis.
2.2. Measurements
All participants underwent anthropometric measurements in barefoot and light clothing. Body weight (measured to the nearest 0.1 kg) and height (measured to the nearest 0.1 cm) were collected and BMI was calculated by dividing weight (kg) by height squared (m2). WC (measured to the nearest 0.1 cm) was collected midway between the inferior margin of the last rib and the crest of the ilium in a horizontal plane. WHtR was calculated by WC (cm) divided by height (cm). Blood pressure was recorded using a recently calibrated electronic sphygmomanometer in the supine position with the right arm after 5 minutes rest. The anthropometric measurements were conducted by trained staff and standardized protocols. Blood samples were obtained after an overnight fast for measurement of blood glucose, total and high-density lipoprotein cholesterol (HDL-cholesterol), triglycerides, blood urea nitrogen (BUN), uric acid, and serum creatinine. Low-density lipoprotein cholesterol (LDL-cholesterol) was calculated using the Friedewald formula: LDL-C (mmol/L) = TC - [HDL-C +TG/2.2]. Serum creatinine was measured using Jaffe kinetic method. Urine protein was detected by dipstick method. GFR was estimated with an equation developed by adaptation of the Modification of Diet in Renal Disease (MDRD)[2] for Chinese people: eGFR (mL/min/1.75 m2) = 175 × [serum creatinine (mg/dL)]−1.234 × age–0.179 × 0 79 (if female). All blood samples were analyzed at a local laboratory in each city rather than a central laboratory. Because all the laboratories were affiliated with a top tertiary hospital and completed a standardized and certificated method for blood test, these results have been widely considered comparably across laboratories in China.
2.3. Definition
CKD was defined as an eGFR <60 mL/min/1.73 m2 or urine protein positivity (proteinuria) ≥1+ with dipstick testing. This definition is similar to that used in a recently published study.[21] Hypertension was defined as a systolic blood pressure ≥140 mm Hg and/or diastolic blood pressure ≥90 mm Hg or physician-diagnosed hypertension. Diabetes was defined as a fasting plasma glucose ≥7.0 mmol/L or physician-diagnosed diabetes. Dyslipidemia was defined as a total cholesterol levels ≥6.22 mmol/L and/or fasting triglycerides levels ≥2.26 mmol/L and/or LDL cholesterol levels ≥4.14 mmol/L and/or HDL-cholesterol levels <1.04 mmol/L.
2.4. Statistical analysis
Continuous variables were expressed as mean ± standard deviation (SD), and categorical variables as percentages where appropriate. Differences between groups were examined by Student t test or analysis of variance (ANOVA) for continuous variables and by Chi-square test for categorical variables, respectively. Correlations of anthropometric measurements with eGFR and metabolic parameter were examined by using Pearson correlation coefficients. The receiver operating characteristic (ROC) analysis was used to compare predictive validity and to determine the appropriate cutoff values for 3 obesity indices according to men and women. An area under ROC curve (AUC) of 1 indicates perfect prediction and an AUC of 0.5 indicates no predictive power of the test. The optimal cut-off point was defined as the point on the curve where maximizing the sum of sensitivity and specificity, and both sensitivity and specificity are more than 50%. The differences between the AUCs for BMI, WC and WHtR, and their 95% confidence interval (CI) were estimated by using the methods developed by Delong et al.[22] We also examined the independent associations between obesity indices and CKD by applying logistic regression models with adjustment for potential confounders, including age, hypertension, diabetes, and dyslipidemia. The anthropometric variables were modeled as continuous variables to calculate the odds ratios (ORs) per unit size of change in respective indicator (unit size for BMI: 5 kg/m2; for WC: 10 cm; for WHtR: 0.05). In addition, multivariate logistic regression models were explored using CKD as the dependent variable and obesity indices as predictors corresponding to the Chinese recommended cutoff values (BMI ≥24 kg/m2, WC ≥85 cm for men and ≥80 cm for women, and WHtR ≥0.5 for both sexes), with the normal subjects as the reference.[23] All statistical inference is based on 95% CIs and 5% P values. Data analyses were carried out using SPSS version 19.0 (IBM Inc, Chicago, IL) and Medcalc 11.4 (MedCalc Software, Mariakerke, Belgium).
3. Results
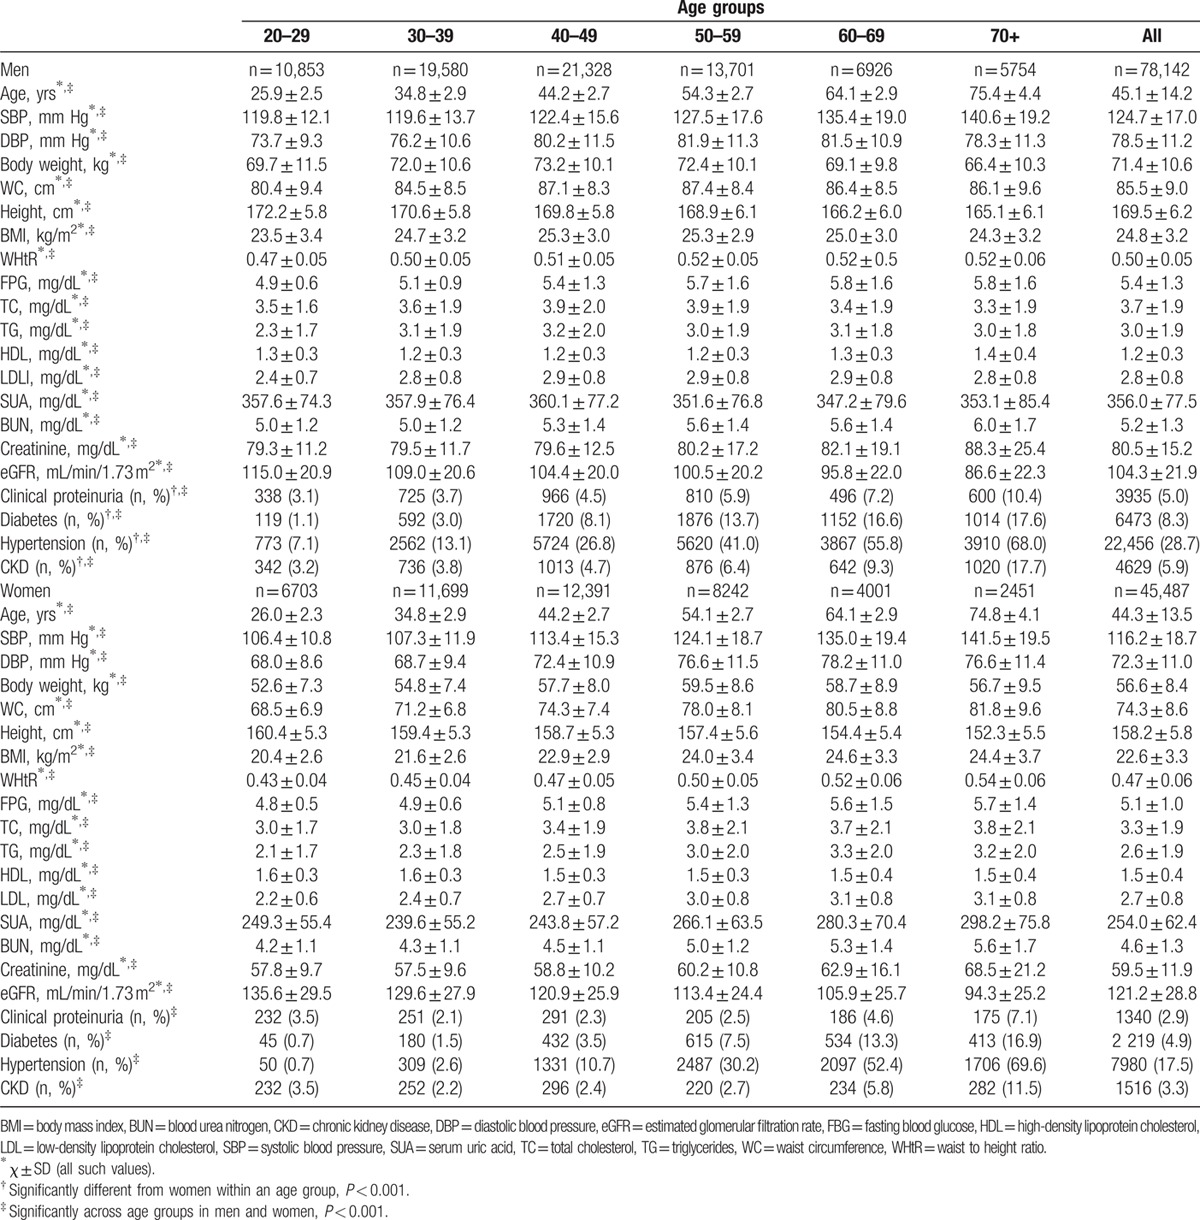
The general and clinical characteristics of study participants by sex and age groups are listed in Table 1. The values of BMI, WC, WHtR, SBP, and DBP increased with age. Levels of FPG, TC, TG, LDL-C, SUA, BUN, and serum creatinine were significantly greater for older groups, whereas HDL-C was significantly greater for younger groups (P < 0.001). The prevalence of CKD, diabetes, and hypertension increased with age in both sexes. Compared with women, a higher percentage of men had CKD and other CVD risk factors, including diabetes and hypertension (P < 0.001).
Table 1.
Baseline characteristics by gender and age groups.
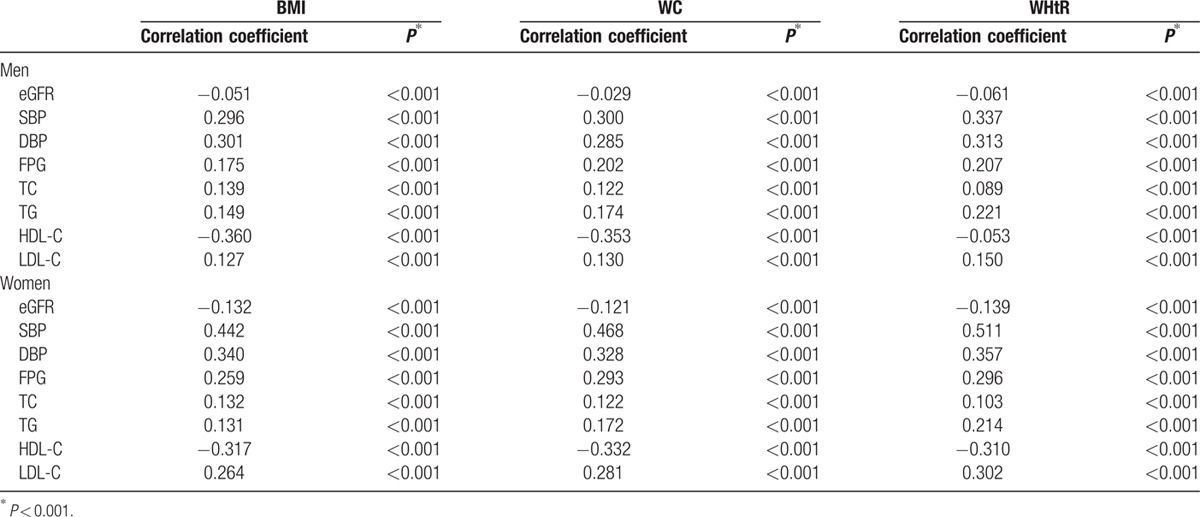
Negative Pearson correlation coefficients were identified between eGFR and BMI, WC, or WHtR. Also, negative correlations were seen between HDL-C and each obesity index in both men and women. The positive correlations existed between other metabolic parameters, including SBP, DBP, FPG, TC, TG, LDL-C, and either BMI, WC, and WHtR. For most metabolic parameters, a substantially stronger correlation with WHtR was observed in men and women. Generally, the correlations between anthropometric measurements and metabolic parameters were stronger in women than in men (Table 2).
Table 2.
Pearson correlation coefficient between BMI, WC, and WHtR versus eGFR and metabolic parameters and in men and women.
The area under the ROC for BMI, WC, and WHtR in relation to CKD is presented in Table 3. WHtR showed the largest AUCs for CKD in both sexes, followed by WC and BMI. For men, the optimal cutoff values were 25.4 kg/m2 for BMI, 87.5 cm for WC, and 0.52 for WHtR. At these cutoff points, the sensitivity and specificity were 50.3% and 59.7% for BMI, 50.3% and 59.7% for WC, and 50.1% and 66.0% for WHtR, respectively. For women, the optimal cutoffs were 23.1 kg/m2 for BMI, 75.5 cm for WC, and 0.49 for WHtR. The sensitivity and specificity were 51.3% and 61.3% for BMI, 52.8% and 60.5% for WC, and 51.3% and 65.5% for WHtR, respectively (Fig. 2). After stratified by age groups, AUC for the relationship between WC and CKD was significantly larger than those for BMI and WHtR in younger and middle age groups, whereas AUCs for WC and WHtR were significantly larger than that for BMI in older age groups.
Table 3.
Estimates of AUCs of obesity indicators for CKD stratified by sexes and age groups.
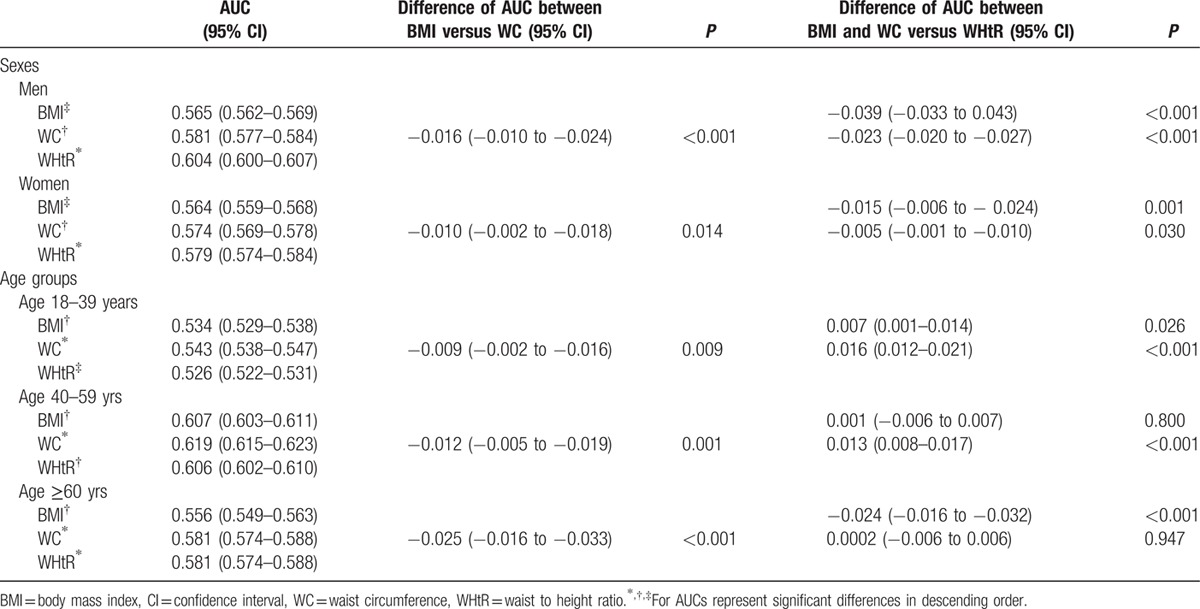
Figure 2.
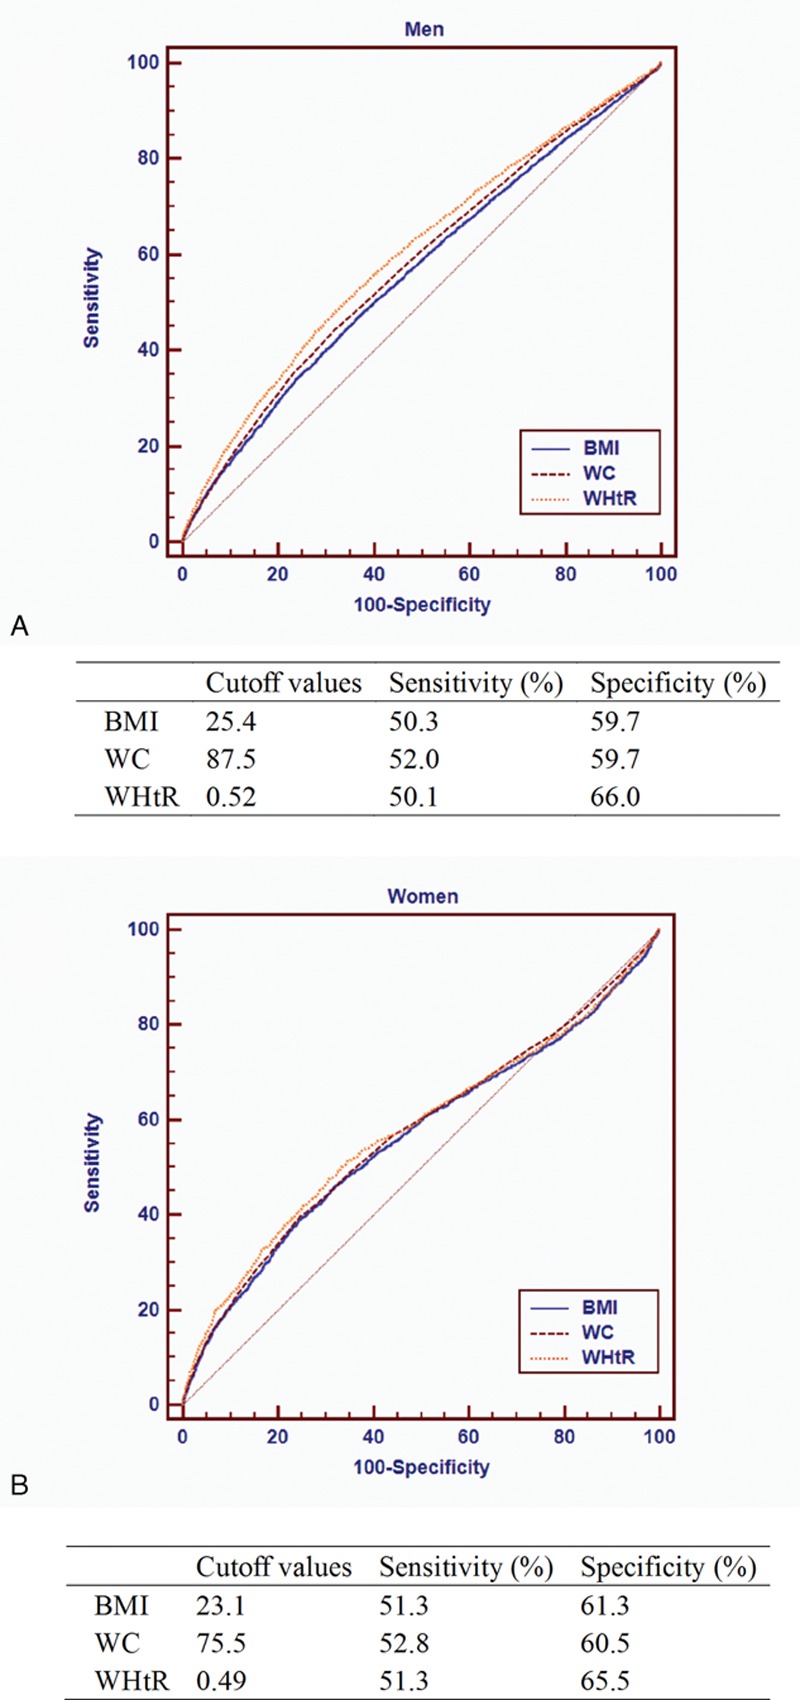
ROC ∗curve and cutoffs of anthropometric indices in predicting CKD for men (A) and women (B).
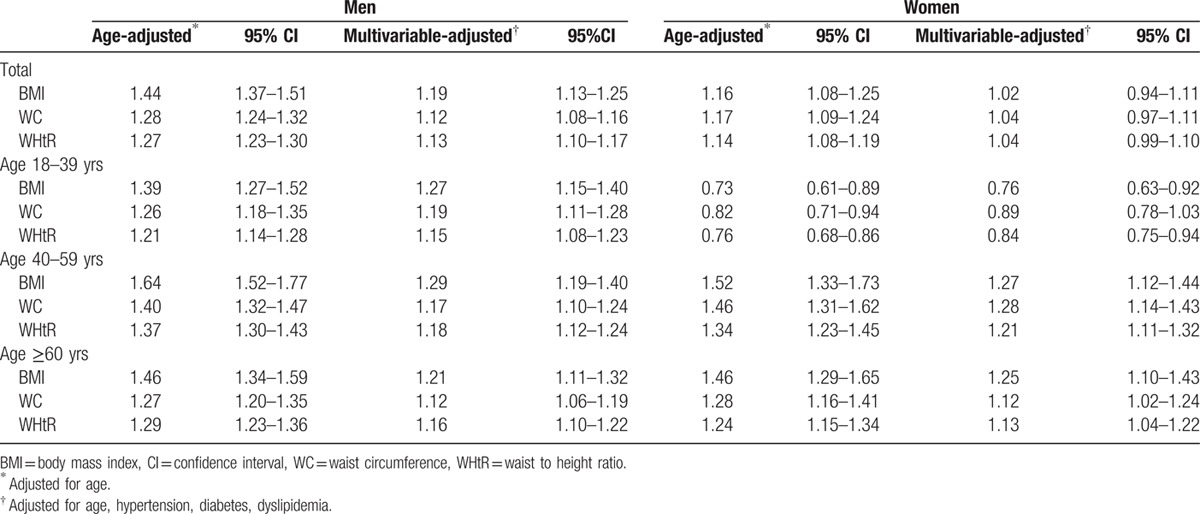
The multivariate-adjusted ORs and 95% CIs for the presence of CKD according to per unit size of different obesity indices for both sexes are summarized in Table 4. For men, higher levels of BMI, WC, and WHtR were positively associated with CKD after adjusting confounders, including age, hypertension, diabetes, and dyslipidemia. For per unit size change, the multivariable-adjusted ORs of CKD were 1.19 (95% CI, 1.13–1.25) for BMI, 1.12 (95% CI, 1.08–1.16) for WC, and 1.13 (95% CI, 1.10–1.17) for WHtR among men, respectively. The corresponding age-adjusted ORs among women were 1.16 (95% CI, 1.08–1.25) for BMI, 1.17 (95% CI, 1.09–1.24) for WC, and 1.14 (95% CI, 1.08–1.19) for WHtR; however, these associations become nonsignificant in multivariable models. Further analyses were performed with the full sample divided into 3 age groups: ≤39 years old, 40∼59 years old, and ≥60 years old. The correlations between obesity indices and CKD in subgroups remained similar as that observed in the whole group for men and women, except for the inverse association between either BMI or WHtR and the presence of CKD in the age group of 18 to 39 years for women.
Table 4.
Age- and multivariate-adjusted odds ratios for CKD according to per unit size of different obesity indices in men and women.
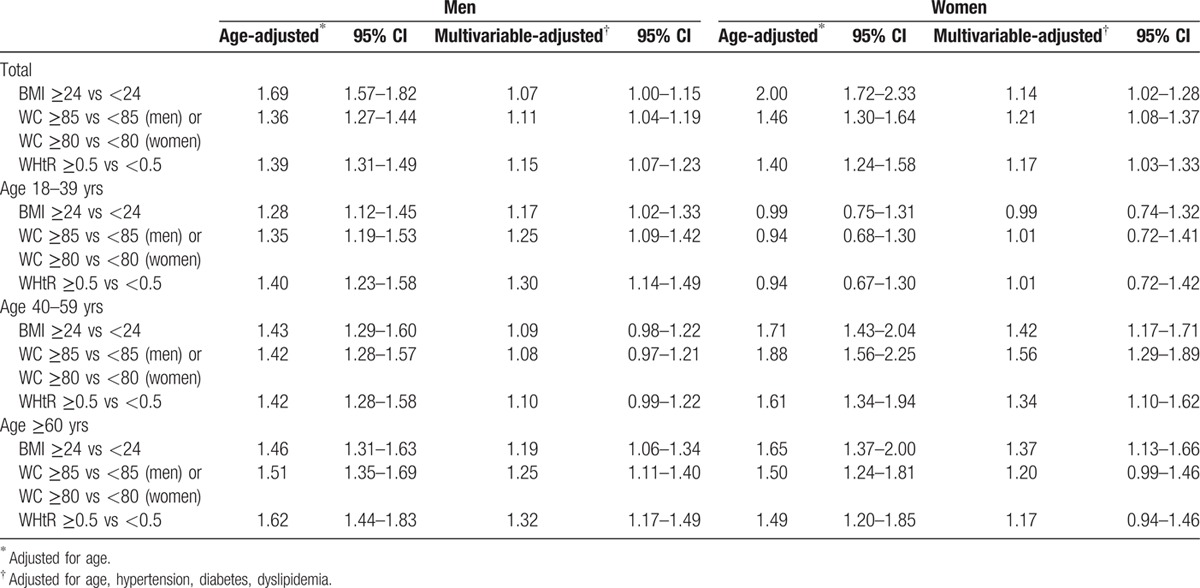
Using the cutoff values of BMI, WC, and WHtR recommended in China, WHtR or WC was superior in the association with CKD than BMI for men and women in the whole group, and the recommended cutoffs of all obesity indices provided higher ORs of having CKD for women than men (Table 5). After stratified by age groups, men aged ≤39 years who were overweight or central obesity, or had a WHtR ≥0.5 had a significantly greater odds of CKD than normal subjects, whereas the associations were not significant for women with the same age range. In contrast, women aged 40 to 59 years had an increased odds of CKD according to the well-established cutoffs, whereas the relationships were nonsignificant for men in the same age group. For men aged ≥60 years, BMI, WC, and WHtR appeared to increase the odds of CKD. There was a positive association between BMI and CKD for women aged ≥60 years; however, the relationship between WC and WHtR and CKD did not achieve statistical significance on multivariate analyses. The association between obesity indices and eGFR <60 mL/min/1.73 m2 was also analyzed, and the results were similar (Supplemental Tables 1–3).
Table 5.
Age- and multivariate-adjusted odds ratios for CKD according to recommended cutoffs of different obesity indices in men and women.
4. Discussion
Results of this large study, which could represent the general population of Chinese urban adults, demonstrated that increasing levels of obesity indices were associated with an increased odds for CKD per unit size of change according to BMI, WC, and WHtR, respectively. In the age-stratified analyses, the results in the subgroups were similar as that observed in the whole group, except for the inverse association between either BMI or WHtR and the presence of CKD for women aged 18 to 39 years. Our study also supported that central obesity defined by WHtR was more closely correlated with CKD than BMI for men, and WC was more close to CKD for women corresponding to the Chinese-recommended cutoff values.
Our results demonstrated that obesity was positively associated with the presence of CKD, which is in agreement with earlier studies.[9,12] In a cohort of 22,071 healthy male physicians with 14 years of follow-up, baseline BMI was associated significantly with an increased risk for CKD, with an OR of 1.45 (95% CI 1.19–1.76) in the highest quintile compared with those in the lowest.[9] The Framingham Heart Study prospectively investigated the association between BMI and the incidence of stage 3 CKD over the 18.5-year period, and found that obese subjects were 1.68 times more likely to have CKD, which was greatly attenuated after adjusting potential confounder. But this study showed that BMI was an independent risk factor for incident dipstick proteinuria in the multivariable models.[12] Some researches indicated the sex-specific difference between BMI and kidney disease in Asians.[13,24] In a health examination survey, obese men had a 56% increased risk of developing proteinuria, but obesity did not increase the risk for women.[24] Similar findings were observed that BMI increased the risk of ESRD in men, but not women in a community-based cohort.[13] However, the sex-specific differences were not noted in Caucasians.[25] Our results confirmed positive associations between obesity indices, including BMI, WC and WHtR, and CKD among Chinese men and women aged older than 40 years.
The present study indicated that either increased BMI or WHtR was associated with a decreased odds of CKD among women aged 18 to 39 years after adjusting for potential confounders. Data from ARIC Study and CHS found that elevated BMI was protective for CKD and subsequent mortality in US adults.[17] In a cohort study of 101,516 Japanese men and women, BMI was inversely associated with the risk of ESRD in women but not in men.[26] It has been well estimated that men have a higher risk of developing kidney diseases, and were more likely to have kidney diseases at younger age than women.[27] The reason for the sex-specific association is possibly due to the different exposure to hormones (especially estrogen) for premenopausal women and men. The association between obesity and CKD in women may be mediated by estrogen through multiple biological pathways, including regulating the rennin-angiotensin-aldosterone system, decreasing angiotensin type I receptors, and reducing angiotensin-converting enzymes, which play a role in vasculature and kidney functions.[28] The other possible reason is that women in the 18 to 39 years age group were relatively lean than men and women older than 40 years, and this group may be most vulnerable to underweight, which is also a risk factor for adverse health outcomes. Further studies are necessary to explore these relationships.
BMI does not discriminate between fat mass and muscle mass, or does not reflect fat distribution; therefore, individuals who are exceptionally muscular could be misclassified as obese on the basis of BMI alone. It is increasingly recognized that measures of central obesity, such as WC and WHtR, were more important than total fat mass, representing a substantially greater risk of cardiovascular and kidney disease.[15,20] WC has been found to correlate more strongly with visceral fat than BMI in those with nondislysis CKD.[29] WHtR has a good agreement with abdominal and visceral fat in comparison to computed tomography (CT) scan.[30] Current studies have reported that WC and WHtR were potentially better indicators to assess CKD risk in individuals regardless of BMI.[15,19,31] Our data also suggested that central obesity measured by WC and WHtR had a significantly greater association with CKD. WHtR especially showed a stronger association with CKD as indicated by slight larger AUCs, which was in agreement with other studies in this field.[18,19] Obesity, especially central obesity, is often coexisted with multiple CVD risk factors suggested as the common causes for CKD, such as diabetes, hypertension, and metabolic syndrome.[6–8] Several plausible mechanisms have been suggested to explain the associations. Obesity may increase single nephron perfusion and intracapillary perfusion pressure that contributes to glomerulosclerosis and loss of GFR over time.[32] Obesity is strongly associated with secretion of pro-atherogenic and inflammatory cytokines with adverse renal effects, such as adiponectin, leptin, interleukin-6, tumor necrosis factor (TNF)-a, and adipokines as well as oxidative stress, which results in increased urinary albumin excretion and therefore contributes to the development of CKD.[6,33] It is also evident that reversal of obesity improves kidney function; thus, weight loss is effective and cost-effective for disease prevention/treatment in obese patients.[34,35]
There is no consensus on the appropriate definition of WC to access CKD risk because different cutoff points are required for different ethnicities. Our earlier study reported cutoffs for WC to predict CVD risk and found that WC is more likely to be influenced by sex, age, and other factors.[20] However, the use of WHtR is simple and recommended.[36] WHtR, taking into account the effects of both WC and body height, has been suggested to have the highest association with all CVD risks in a number of studies, with the optimal cutoffs within a narrow range of 0.48 to 0.52.[37] The present data showed that the best WHtR cutoff point for the development of CKD was 0.50 cm for both men and women. Two studies reported that WHtR showed a greater discriminatory capability to identify CKD than BMI, WC, and WHR in the Oriental population.[19,38] A population-based study consisted of participants from south Asian, African, and European, and supported global use of WHtR in relation to CKD across ethnic groups.[39]
Our study has several important strengths. We investigated the associations between obesity indices and CKD on the basis of a nationally representative sample, which included more than 100,000 urban adults living in North and South China with a wide age range between 20 and 109 years. Our data showed broadly comparable and reliable for the definitions of BMI, WC, and WHtR. In addition, the standard protocols for anthropometric measurements and laboratory test by trained medical staff reduced the potential biases and measurement errors. There are also several limitations: First, the cross-sectional study design limited a causal association between obesity indices and CKD risk. Additional prospective studies will be needed to evaluate the reproducibility of general and central obesity to predict kidney damage and cardiovascular outcomes. Second, single measures of creatinine and dipstick measurements of urinary protein might have resulted in the misclassification of kidney function. However, our participants were apparently healthy people undergoing health examinations; these values were more likely consistent with kidney function. Third, quantitative data of urinary albumin were lacking in our study. We were unable to estimate the prevalence of albuminuria that is important for the development of kidney disease. Fourth, our study participants were generally from urban areas and had a higher economic level; therefore, the prevalence of CKD may have been overestimated. Finally, data on dietary or medication were lacking in our study, which were important factors for obesity parameters (BMI, WC/WHtR) and CKD incidence. However, our study was based on a very large sample size including more than 100,000 adults; thus, the distributions of personal characteristics were more likely to be random and less likely to materially change the results.
Although these limitations exist, this is the first multicenter, large-scale, population-based research to indicate that obesity was associated with an increased odds for CKD in men and women. Central obesity measures, including WC and WHtR, may be more closely correlated with CKD for Chinese urban adults. WHtR has advantages in terms of consistency of thresholds, which is recommended as a routine screening tool in clinical practice.
Supplementary Material
Footnotes
Authorship: QZ, YH conceived and designed the study. YH acquired, analyzed the data, wrote the manuscript. YH, FL, FW interpreted the data. QZ, XM, XZ provided advice and revised the manuscript.
Funding: This study was supported by the state science and technology support program [grant number: 2012BAI37B04 and 2013BAI12B00].
This paper has not been published elsewhere; it is not being considered for publication elsewhere; and that it has been submitted with the full knowledge and approval of the institution or organization given as the affiliation of the author(s). The authors have no conflicts of interest.
Supplemental Digital Content is available for this article.
References
- 1.Nugent RA, Fathima SF, Feigl AB, et al. The burden of chronic kidney disease on developing nations: a 21st century challenge in global health. Nephron Clin Pract 2011; 118:c269–c277. [DOI] [PubMed] [Google Scholar]
- 2.Zhang L, Wang F, Wang L, et al. Prevalence of chronic kidney disease in China: a cross-sectional survey. Lancet 2012; 379:815–822. [DOI] [PubMed] [Google Scholar]
- 3.Smith DH, Gullion CM, Nichols G, et al. Cost of medical care for chronic kidney disease and comorbidity among enrollees in a large HMO population. J Am Soc Nephrol 2004; 15:1300–1306. [DOI] [PubMed] [Google Scholar]
- 4.Kramer H, Tuttle KR, Leehey D, et al. Obesity management in adults with CKD. Am J Kidney Dis 2009; 53:151–165. [DOI] [PMC free article] [PubMed] [Google Scholar]
- 5.Ting SM, Nair H, Ching I, et al. Overweight, obesity and chronic kidney disease. Nephron Clin Pract 2009; 112:c121–c127. [DOI] [PubMed] [Google Scholar]
- 6.Garland JS. Elevated body mass index as a risk factor for chronic kidney disease: current perspectives. Diabetes Metab Syndr Obes 2014; 7:347–355. [DOI] [PMC free article] [PubMed] [Google Scholar]
- 7.Kurella M, Lo JC, Chertow GM. Metabolic syndrome and the risk for chronic kidney disease among nondiabetic adults. J Am Soc Nephrol 2005; 16:2134–2140. [DOI] [PubMed] [Google Scholar]
- 8.Fox CS, Larson MG, Leip EP, et al. Predictors of new-onset kidney disease in a community-based population. JAMA 2004; 291:844–850. [DOI] [PubMed] [Google Scholar]
- 9.Gelber RP, Kurth T, Kausz AT, et al. Association between body mass index and CKD in apparently healthy men. Am J Kidney Dis 2005; 46:871–880. [DOI] [PubMed] [Google Scholar]
- 10.Wang Y, Chen X, Song Y, et al. Association between obesity and kidney disease: a systematic review and meta-analysis. Kidney Int 2008; 73:19–33. [DOI] [PubMed] [Google Scholar]
- 11.Obesity: preventing and managing the global epidemic. Report of a WHO consultation. World Health Organ Tech Rep Ser 2000; 894:i–i10.1-253. [PubMed] [Google Scholar]
- 12.Foster MC, Hwang SJ, Larson MG, et al. Overweight, obesity, and the development of stage 3 CKD: the Framingham Heart Study. Am J Kidney Dis 2008; 52:39–48. [DOI] [PMC free article] [PubMed] [Google Scholar]
- 13.Iseki K, Ikemiya Y, Kinjo K, et al. Body mass index and the risk of development of end-stage renal disease in a screened cohort. Kidney Int 2004; 65:1870–1876. [DOI] [PubMed] [Google Scholar]
- 14.Kalantar-Zadeh K, Kopple JD. Body mass index and risk for end-stage renal disease. Ann Intern Med 2006; 144:701. [DOI] [PubMed] [Google Scholar]
- 15.Noori N, Hosseinpanah F, Nasiri AA, et al. Comparison of overall obesity and abdominal adiposity in predicting chronic kidney disease incidence among adults. J Ren Nutr 2009; 19:228–237. [DOI] [PubMed] [Google Scholar]
- 16.Elsayed EF, Tighiouart H, Weiner DE, et al. Waist-to-hip ratio and body mass index as risk factors for cardiovascular events in CKD. Am J Kidney Dis 2008; 52:49–57. [DOI] [PMC free article] [PubMed] [Google Scholar]
- 17.Elsayed EF, Sarnak MJ, Tighiouart H, et al. Waist-to-hip ratio, body mass index, and subsequent kidney disease and death. Am J Kidney Dis 2008; 52:29–38. [DOI] [PMC free article] [PubMed] [Google Scholar]
- 18.Silva MI, Lemos CC, Torres MR, et al. Waist-to-height ratio: an accurate anthropometric index of abdominal adiposity and a predictor of high HOMA-IR values in nondialyzed chronic kidney disease patients. Nutrition 2014; 30:279–285. [DOI] [PubMed] [Google Scholar]
- 19.Lin CH, Chou CY, Lin CC, et al. Waist-to-height ratio is the best index of obesity in association with chronic kidney disease. Nutrition 2007; 23:788–793. [DOI] [PubMed] [Google Scholar]
- 20.Zeng Q, He Y, Dong S, et al. Optimal cut-off values of BMI, waist circumference and waist:height ratio for defining obesity in Chinese adults. Br J Nutr 2014; 10:1–10. [DOI] [PubMed] [Google Scholar]
- 21.Tsuruya K, Yoshida H, Nagata M, et al. Association of the triglycerides to high-density lipoprotein cholesterol ratio with the risk of chronic kidney disease: analysis in a large Japanese population. Atherosclerosis 2000; 233:260–267. [DOI] [PubMed] [Google Scholar]
- 22.DeLong ER, DeLong DM, Clarke-Pearson DL. Comparing the areas under two or more correlated receiver operating characteristic curves: a nonparametric approach. Biometrics 1988; 44:837–845. [PubMed] [Google Scholar]
- 23.Zhou BF. the Cooperative Meta-analysis Group of Working Group on Obesity in C. Predictive values of body mass index and waist circumference for risk factors of certain related diseases in Chinese adults: study on optimal cut-off points of body mass index and waist circumference in Chinese adults. Biomed Environ Sci 2002; 15:83–96. [PubMed] [Google Scholar]
- 24.Tozawa M, Iseki K, Iseki C, et al. Influence of smoking and obesity on the development of proteinuria. Kidney Int 2002; 62:956–962. [DOI] [PubMed] [Google Scholar]
- 25.Hsu CY, McCulloch CE, Iribarren C, et al. Body mass index and risk for end-stage renal disease. Ann Intern Med 2006; 144:21–28. [DOI] [PubMed] [Google Scholar]
- 26.Iseki K, Ikemiya Y, Fukiyama K. Predictors of end-stage renal disease and body mass index in a screened cohort. Kidney Int Suppl 1997; 63:S169–S170. [PubMed] [Google Scholar]
- 27.Neugarten J, Acharya A, Silbiger SR. Effect of gender on the progression of nondiabetic renal disease: a meta-analysis. J Am Soc Nephrol 2000; 11:319–329. [DOI] [PubMed] [Google Scholar]
- 28.Tsujimoto T, Sairenchi T, Iso H, et al. The dose-response relationship between body mass index and the risk of incident stage >/ = 3 chronic kidney disease in a general Japanese population: the Ibaraki prefectural health study (IPHS). J Epidemiol 2014; 24:444–451. [DOI] [PMC free article] [PubMed] [Google Scholar]
- 29.Sanches FM, Avesani CM, Kamimura MA, et al. Waist circumference and visceral fat in CKD: a cross-sectional study. Am J Kidney Dis 2008; 52:66–73. [DOI] [PubMed] [Google Scholar]
- 30.Ashwell M, Cole TJ, Dixon AK. Ratio of waist circumference to height is strong predictor of intra-abdominal fat. BMJ 1996; 313:559–560. [DOI] [PMC free article] [PubMed] [Google Scholar]
- 31.Chen S, Wu B, Liu X, et al. Association of Anthropometric indexes with chronic kidney disease in a Chinese population. Clin Nephrol 2013; 80:361–369. [DOI] [PubMed] [Google Scholar]
- 32.Shankar A, Leng C, Chia KS, et al. Association between body mass index and chronic kidney disease in men and women: population-based study of Malay adults in Singapore. Nephrol Dial Transplant 2008; 23:1910–1918. [DOI] [PubMed] [Google Scholar]
- 33.Satirapoj B, Supasyndh O, Mayteedol N, et al. Obesity and its relation to chronic kidney disease: a population-based, cross-sectional study of a Thai army population and relatives. Nephrology 2013; 18:229–234. [DOI] [PubMed] [Google Scholar]
- 34.Morales E, Valero MA, Leon M, et al. Beneficial effects of weight loss in overweight patients with chronic proteinuric nephropathies. Am J Kidney Dis 2003; 41:319–327. [DOI] [PubMed] [Google Scholar]
- 35.Bello AK, de Zeeuw D, El Nahas M, et al. Impact of weight change on albuminuria in the general population. Nephrol Dial Transplant 2007; 22:1619–1627. [DOI] [PubMed] [Google Scholar]
- 36.Ashwell M, Hsieh SD. Six reasons why the waist-to-height ratio is a rapid and effective global indicator for health risks of obesity and how its use could simplify the international public health message on obesity. Int J Food Sci Nutr 2005; 56:303–307. [DOI] [PubMed] [Google Scholar]
- 37.Browning LM, Hsieh SD, Ashwell M. A systematic review of waist-to-height ratio as a screening tool for the prediction of cardiovascular disease and diabetes: 0.5 could be a suitable global boundary value. Nutr Res Rev 2010; 23:247–269. [DOI] [PubMed] [Google Scholar]
- 38.Evans PD, McIntyre NJ, Fluck RJ, et al. Anthropomorphic measurements that include central fat distribution are more closely related with key risk factors than BMI in CKD stage 3. PLoS One 2012; 7:12. [DOI] [PMC free article] [PubMed] [Google Scholar]
- 39.Van Valkengoed IG, Agyemang C, Krediet RT, et al. Ethnic differences in the association between waist-to-height ratio and albumin-creatinine ratio: the observational SUNSET study. BMC Nephrol 2012; 13:1471–2369. [DOI] [PMC free article] [PubMed] [Google Scholar]
Associated Data
This section collects any data citations, data availability statements, or supplementary materials included in this article.


