

Abstract
The aim of the study was to evaluate the treatment outcomes in cervical cancer patients treated with 18F-fluorodeoxyglucose (FDG)-positron emission tomography (PET)/computed tomography (CT)-guided 3-dimensional brachytherapy (3D-BT) planning for the first brachytherapy session.
We retrospectively analyzed 87 patients with cervical cancer who received definitive radiotherapy (RT). Primary tumor size was ≤4 cm in 22 patients (25.3%), >4 cm and ≤6 cm in 45 patients (51.7%), and >6 cm in 20 patients (23.0%). The median total dose of external beam RT was 50.4 (50.4–60.4) Gy. FDG-PET/CT-guided 3D-BT with an iridium-192 source was performed. The clinical target volume (CTV) for 3D-BT included the entire cervix and the abnormal FDG-uptake with a 1-cm expansion. A planned total dose was 24 Gy at 4 Gy per insertion 3 times per week using a tandem and 2 ovoids.
The mean D95 and D90 for the CTV were 73.4 (±5.9) Gy and 77.9 (±6.9) Gy, respectively (EQD2, α/β=10). The D2cc for the rectum and bladder was 374 (±97.4) cGy and 394 (±107.6) cGy per fraction, respectively. The EQD2 (α/β=3) for the D2cc was 74.5 (±12.4) Gy for the rectum and 77.3 (±14.6) Gy for the bladder. The median follow-up period was 40 (8–61) months. The 3-year overall survival (OS), progression-free survival (PFS), and local control (LC) rates were 84.7%, 72.1%, and 89.2%, respectively. The 3-year LC rate was 100% for tumors ≤ 4 cm, 91.1% for tumors > 4 cm and ≤ 6 cm, and 70.5% for tumors > 6 cm (P = 0.014). Local failure developed in 9 patients. Three patients had local failures outside of the CTV. Grade 1, 2, and 3 rectal bleeding developed in 5, 4, and 2 patients, respectively. One patient experienced rectovaginal fistula.
FDG-PET/CT-guided 3D-BT planning is a feasible approach, which showed favorable clinical outcomes.
Keywords: brachytherapy, cervical cancer, FDG-PET, radiotherapy
1. Introduction
Intracavitary brachytherapy (BT) combined with external beam radiation therapy (EBRT) plays an important role in the treatment of cervical cancer. Traditionally, BT planning for cervical cancer has been performed based on 2-dimensional, plain orthogonal x-ray images, using the point A dose for prescription and the reference points for organs at risk (OARs) reported by the International Commission on Radiation Units and Measurements 38.[1]
Recently, 3-dimensional, image-guided BT (3D-IGBT), which incorporates sectional images provided by computed tomography (CT) or magnetic resonance imaging (MRI) into the BT planning, has been rapidly developed.[2–4] For cervical cancer, 3D-IGBT has demonstrated better local control (LC) and a lower complication rate compared with 2-dimensional BT.[5–8] MRI is recommended for 3D-IGBT planning by the Brachytherapy Group of the European Society for Therapeutic Radiology and Oncology (GEC-ESTRO), because it is superior to CT for depicting soft tissue.[9] Its use is limited in some institutions, however, because of the high cost of MRI-compatible applicators, difficulties in accessing MRI from the procedure room, and the inability to use MRI in patients with metallic implants.
A few studies have shown that it is feasible to use 18F-fluorodeoxyglucose (FDG) positron emission tomography (PET) or PET/CT for 3D-IGBT planning.[10–12] FDG-PET/CT provides a functional image that visualizes abnormal glucose uptake, such as that seen in tumor cells, and thus provides the metabolic tumor volume in addition to the anatomical image. The disadvantage of CT-based brachytherapy planning compared with MRI is poor contrast resolution, but this might be complemented by biologic information of FDG-PET. Previously, researchers at our institution demonstrated that FDG-PET/CT-based 3D-BT planning is feasible.[12] Here, we report on the treatment outcomes in patients with cervical cancer who were treated with FDG-PET/CT-based 3D-BT.
2. Material and methods
2.1. Patients
A total of 91 consecutive patients with cervical cancer (International Federation of Gynecology and Obstetrics, FIGO stage IB1 to IVB) received definitive RT using FDG-PET/CT-based 3D-BT protocol between February 2009 and December 2011 in our hospital. Our institutional review board approved the study protocol. Among them, 4 patients with stage IVB were excluded and finally 87 patients were enrolled in this analysis.
All of the patients underwent pretreatment work-ups and routine clinical staging, which included physical examination, blood test, abdomino-pelvic CT, pelvic MRI, and FDG-PET/CT. All the patients were treated with whole-pelvic EBRT followed by FDG-PET/CT-based 3D-BT. The EBRT was delivered to whole pelvis with a dose of 45 Gy in daily fractions of 1.8 Gy. Then, a parametrial boost of 5.4 Gy was performed with midline block (MLB). Two patients received additional 10 Gy boost to lymph nodes. The median total dose of EBRT was 50.4 Gy (range, 50.4–60.4 Gy). FDG-PET/CT-based high dose rate (HDR) 3D-BT with an iridium-192 source was started at the beginning of the MLB to deliver a total dose of 24 Gy at 4 Gy per insertion 3 times per week in 6 fractions using a tandem and 2 ovoids.
Seventy-nine (90.8%) patients received concurrent chemotherapy. For 32 patients (36.8%), the chemotherapy regimen consisted of cisplatin 60 mg/m2 (day 1) and 5-FU 1000 mg/m2/d (day 1 through day 5) every 3 weeks, and for the other 47 patients (54.0%), the chemotherapy regimen consisted of cisplatin 40 mg/m2 weekly.
2.2. PET/CT-based 3D-BT
Our previous report described the details of the FDG-PET/CT-based 3D-BT.[12] Simulation for the FDG-PET/CT-based 3D-BT was performed to generate a brachytherapy plan at a median EBRT dose of 41.4 Gy in advance of delivery of brachytherapy with MLB. The patient laid on a CT-compatible plate in a position that was suitable for applicator insertion. After a standard Fletcher–Suit tandem and ovoids were inserted, orthogonal radiographs were obtained to confirm the applicator set-up, which was used for the verification before each treatment. Then, the patient was moved to the PET/CT room while lying on the plate with the applicator in place. PET/CT images of the pelvis were obtained using a Discovery STe scanner (GE Healthcare, Milwaukee, WI).
The PET and CT data were transferred to an EBRT treatment planning system (TPS) (Pinnacle V6.5, Philips, Madison, WI) for the delineation of the target volume and OARs (i.e., the rectum and bladder). Complete response (no residual tumor) on the PET/CT is defined as resolution of FDG uptake within the tumor volume so that is indistinguishable from surrounding normal tissue, and which was determined by a nuclear medicine physician and a radiation oncologist. For partially responded tumor, the gross tumor volume (GTV) was delineated. In our protocol, the determination of the GTV outline was based on the threshold value of 40% of the SUVmax within a region of interest encompassing the tumor, and it was adjusted by physician. Our previous data [12] showed that contouring by simple visual analysis resulted in a median threshold value of 41% of the SUVmax. The clinical target volume (CTV) included the entire cervix and the GTV with a 1-cm expansion in the direction of the initial extension of the tumor considering the clinically suspected lesion or uncertainty of PET/CT imaging (i.e., into the vagina or uterine body and the side of parametrial extension considering anatomic boundaries; Fig. 1). If the PET/CT image showed a metabolic complete response, the CTV included the entire cervix. For the treatment planning, the CTV and the OARs were transferred to a brachytherapy TPS (PLATO, version 14.3, Nucletron, Netherlands). Three-dimensional planning was performed using the optimization tool of the brachytherapy TPS, and manual modifications of the loading pattern and the dwell time were performed by referencing the dose–volume histogram of the target and OARs. We aimed to optimize the plan so that the minimum dose received by 95% of the volume (D95) was greater than the prescribed dose, whereas 2 cm3 of the volume (D2cc) of the OARs received less than the prescribed dose.
Figure 1.

Target volume delineation of FDG-PET/CT-guided 3-dimensional brachytherapy (gross tumor volume: orange; clinical target volume: sky blue; bladder: yellow; rectum: green). CT = computed tomography, FDG = 18F-fluorodeoxyglucose, PET = positron emission tomography.
Three-dimensional brachytherapy by FDG-PET/CT-based planning was started after median 45 Gy of whole pelvic RT, and the same plan was applied for subsequent brachytherapy sessions.
2.3. Follow-up
For evaluation of the initial response to treatment, whole-body FDG-PET/CT was performed 1 month after treatment. The patients were followed up at intervals of 3 to 4 months thereafter. At each visit, a clinical examination, cervical cytology, and blood tests were performed. Imaging studies such as FDG-PET/CT or MRI were also obtained. Local failure was defined as the presence of histologically confirmed tumor or definite progressive disease at the cervix, vagina, or parametrium during the follow-up period. Regional failure was defined as a recurrence at a pelvic lymph node. Para-aortic lymph node recurrence and/or metastases to other organs were considered distant failure.
3. Statistics
All data are reported as mean (±SD) unless otherwise indicated. Overall survival (OS) time was calculated from the date of the start of RT to the date of death or last follow-up. Progression-free survival (PFS) and local control (LC) times were calculated from the date of the start of RT to the date of any progression or the last follow-up and the date of local progression or the last follow-up, respectively. The actuarial OS, PFS, and LC rates were calculated by the Kaplan–Meier method. The log-rank test and the Cox proportional hazards regression model were used for univariate and multivariate analyses, respectively. A 2-sided P-value of 0.05 or less was considered statistically significant. The statistical software package SPSS 20.0 was used for all statistical analyses.
4. Results
4.1. Patients
The median follow-up period was 40 months (range, 8–61 months). The patient characteristics are summarized in Table 1.
Table 1.
Patient characteristics.

4.2. FDG-PET/CT-based 3D-BT
Fifteen patients (17.2%) showed complete response on the FDG-PET/CT for brachytherapy. The median CTV was 43.8 cm3 (range, 7–148.3 cm3). The mean D95 and D90 for the CTV in all patients were 411 (±68.0) cGy and 458 (±74.7) cGy per fraction, respectively. The equivalent dose in 2-Gy fractions (EQD2, α/β=10) for the CTV was calculated by the summation of the EBRT dose without the MLB and BT. The D95 and D90 for the CTV were 73.4 (±5.9) Gy and 77.9 (±6.9) Gy, respectively. The D2cc for the rectum and bladder was 374 (±97.4) cGy and 394 (±107.6) cGy per fraction, respectively. The EQD2 (α/β=3) for the D2cc was 74.5 (±12.4) Gy for the rectum and 77.3 (±14.6) Gy for the bladder. The median overall treatment time was 49 days (range, 44–117 days).
4.3. Response and disease control
Most patients (78 of 87, 89.7%) received FDG-PET/CT 1 month after RT for evaluation of the initial response. Seven patients (8.0%) received FDG-PET/CT 3 to 9 months after RT, and 2 patients (2.3%) did not receive FDG-PET/CT after RT. The FDG-PET/CT showed a complete response in 60 patients (69.0%), a partial response in 19 patients (21.8%), and progressive disease in 6 patients (6.9%).
Local failure developed in 9 patients. The median time to local progression was 9 months (range, 5–12 months). Three patients had local failures outside of the CTV; 2 patients experienced local recurrence in the uterine body and 1 experienced local recurrence in the lower vagina (Fig. 2). Seven patients had regional failures, and 18 patients had distant failures (Fig. 3). The 3-year LC rate was 89.2% (95% CI, 80.3–94.2%) (Fig. 4). The 3-year LC rate was 100% for tumors ≤4 cm, 91.1% for tumors >4 cm and ≤6 cm, and 70.5% for tumors >6 cm (P = 0.014; Fig. 5).
Figure 2.
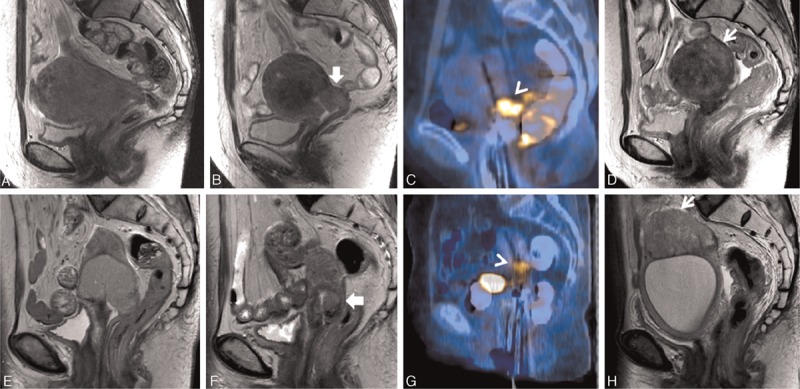
Uterine body recurrences outside of the clinical target volume of PET/CT-guided 3-dimensional brachytherapy. T2-weighted pelvic MRI in 2 patients showed a huge cervical mass (A and E). The cervical mass decreased before PET/CT-guided 3D-BT (B and F). PET/CT simulation revealed residual 18F-fluorodeoxyglucose uptake, which was in accordance with the pelvic MRI (C and G). After PET/CT-guided 3D-BT, the patients experienced recurrences in the uterus after 8 months of follow-up (D and H). CT = computed tomography, MRI = magnetic resonance imaging, 18F-fluorodeoxyglucose, PET = positron emission tomography.
Figure 3.

Patterns of failures. CTV = clinical target volume.
Figure 4.

Overall survival (OS), progression-free survival (PFS), and local control (LC) rates among all the patients (N = 87). LC = local control, OS = overall survival, PFS = progression-free survival.
Figure 5.

The local control (LC) rate according to tumor size. LC = local control.
The 3-year OS and PFS rates were 84.7% (95% confidence interval [CI], 75.1–90.8%) and 72.1% (95% CI, 61.3–80.4%), respectively (Fig. 4). The multivariate analysis showed that post-CCRT PET response at 1 month was the only significant factor for OS (P = 0.006) and PFS (P < 0.001). The other factors including age, FIGO stage, pelvic lymph node involvement, tumor size, the CTV volume at the time of brachytherapy and PET response at the time of brachytherapy did not show any statistical significance in the multivariate analysis for PFS and OS (Table 2).
Table 2.
Multivariate analysis for progression-free survival (PFS) and overall survival (OS).

4.4. Toxicity
Grade 1, 2, and 3 rectal bleeding developed in 5, 4, and 2 patients, respectively. One patient experienced rectovaginal fistula. Pelvic insufficiency fracture developed in 9 patients. The common sites of insufficiency fracture were the sacral alae (N = 8) followed by the pubic bone (N = 2). One patient experienced small bowel perforation 7 months after the completion of RT and received surgical resection and anastomosis.
5. Discussion
The standard treatment for locally advanced cervical cancer is definitive RT with concurrent chemotherapy.[13] The definitive RT consists of EBRT and BT. Traditional 2D-BT uses 2 reference points, A and B, in calculating and communicating the prescribed dose. Recently, 3D-IGBT using MRI or CT has become increasingly common, and the benefits of 3D-IGBT compared with 2D-BT in terms of local control and toxicities have been reported.[3,8] In 2000, the GEC-ESTRO described the basic concept and terminology of 3D-IGBT to support and promote the use of 3D-IGBT in treating cervical cancer.[9]
The GEC-ESTRO defined the target volumes for 3D-IGBT as the GTV, the high-risk CTV (HR-CTV), and the intermediate-risk CTV.[9] The HR-CTV is defined as the entire cervix plus any residual tumor extension at the time of brachytherapy with a high risk of local recurrence, and the intermediate-risk CTV is defined as the initial macroscopic extent of disease with at most residual microscopic disease at the time of brachytherapy. MRI is the gold standard for contouring the target volumes in 3D-IGBT for cervical cancer, because it provides high-quality imaging of the tumor extent. CT-based IGBT has also been performed in several institutions.[5,14] Contouring the target volumes based on CT images is limited, however, because CT cannot distinguish residual tumor extension from normal tissue, and it may overestimate the tumor volume.[15,16] Although both MRI and CT provide anatomical information, FDG-PET provides metabolic information about the glucose uptake of a tumor, which is correlated with the viable tumor burden. Thus, the metabolic tumor volume can be delineated using FDG-PET. One institution investigated the use of FDG-PET for 3D-IGBT planning.[11] Furthermore, FDG-PET/CT gives additional geometric information to combine with the information given by the FDG-PET and thus aids in the delineation of the metabolic tumor volume along the anatomic boundaries. In this study, the CTV was defined as the residual metabolic uptake plus a 1-cm margin to compensate for uncertainty in the tumor edge of metabolic uptake. This FDG-PET/CT-guided approach showed a 3-year overall LC rate of 89.2%, which was equivalent to that of other image-guided brachytherapy treatment.
The 3D-IGBT allows conformal planning and dose volume adaptation for the target volume and OARs. Many clinical results indicate that it improves the LC rate and decreases the treatment-related toxicities compared with conventional brachytherapy.[5–7] The Vienna group reported the dose–effect relationship for LC using dose–volume histogram parameters.[17,18] When the tumor was >5 cm, patients with a D90 for HR-CTV of >87 Gy showed better LC rates compared with patients with a D90 for HR-CTV of <87 Gy (96% vs. 80%). Furthermore, they continued the dose escalation for larger tumors (>5 cm) from a mean dose of 87 Gy to a mean dose of 93 Gy, which resulted in improved LC (6 failures among 38 patients in 2001–2003 vs. 1 failure among 65 patients in 2004–2008)[7]. They explained that the increase in the number of combined intracavitary/interstitial applications might also contribute to the improvement in LC. In our study, we actually aimed to prescribe the dose to D95 and not D90. The mean D95 of the CTV was 73.4 Gy (EQD2), and the mean D90 of the CTV was 77.9 Gy (EQD2). The prescribed dose was lower than those used in the USA and Europe. In Japan, although the recommended total prescribed dose is lower than that in the USA and Europe, clinical experiences showed favorable LC rates with acceptable complications.[19–21] In our study, the overall LC rate was 89.2% at 3 years. The LC rate was lower, however, in patients with larger tumors. The 3-year LC rate was 100% for tumors ≤4 cm, 91.1% for tumors >4 cm and ≤6 cm, and 70.5% for tumors >6 cm (P = 0.029). When we used a cut-off level of 5 cm, such as the Vienna group, the 3-year LC rate was 93.1% for tumors ≤5 cm and 84.8% for tumors >5 cm (P = 0.223). The LC rate for large tumors (>5 cm) in our study was slightly lower than that of the Vienna group (92%). Toita et al showed results similar to ours in their prospective study.[21] They prescribed 62 to 65 Gy of EQD2 to point A. The LC rates were 85% for tumors <5 cm, 72% for tumors 5 to 7 cm, and 54% for tumors ≥7 cm. Furthermore, there was no dose–effect relationship in patients with small tumors (2–5 cm).[17] Those findings indicate that a low cumulative dose of 62 to 78 Gy may be sufficient for small tumors <4 to 5 cm, which should be confirmed by prospective studies in the future. For larger tumors (>5–6 cm), dose escalation to 87 Gy or more of EQD2 might be necessary for better LC.[7,17] In addition, the use of interstitial brachytherapy can be helpful for large tumors with parametrial extension. The 3D-IGBT using only tandem and ovoids is limited in conformal planning to cover large advanced tumors while restricting the dose to OARs because of the limited dwell positions of the radiation sources.[22,23]
The present study has several limitations. First, the selection bias may have influenced the favorable outcomes because this study was conducted at a single institution with a small number of patients and heterogeneity of chemotherapy regimens. Second, the reproducibility of target volume delineation using FDG-PET/CT could not be validated in this study. The variation between inter- and intra-physician may be observed according to physicians’ experience. Third, we did not perform the subsequent adaptive planning to adjust for changes per each brachytherapy session.
In conclusion, FDG-PET/CT-based 3D-BT showed favorable clinical outcomes, which is equivalent to those of other image-guided brachytherapy. The strategies of dose escalation/de-escalation management according to the tumor size should be investigated in future studies.
Footnotes
The authors have no conflicts of interest to disclose.
References
- 1.International Commission on Radiation Units and, Measurements., ICRU., Report 38: Dose and volume specification for reporting intracavitary therapy in, gynecology, Bethesda: ICRU; 1985. [Google Scholar]
- 2.Nag S, Cardenes H, Chang S, et al. Image-Guided Brachytherapy Working Group. Proposed guidelines for image-based intracavitary brachytherapy for cervical carcinoma: report from Image-Guided Brachytherapy Working Group. Int J Radiat Oncol Biol Phys 2004; 60:1160–1172. [DOI] [PubMed] [Google Scholar]
- 3.Potter R, Dimopoulos J, Georg P, et al. Clinical impact of MRI assisted dose volume adaptation and dose escalation in brachytherapy of locally advanced cervix cancer. Radiother Oncol 2007; 83:148–155. [DOI] [PubMed] [Google Scholar]
- 4.Koom WS, Sohn DK, Kim JY, et al. Computed tomography-based high-dose-rate intracavitary brachytherapy for uterine cervical cancer: preliminary demonstration of correlation between dose-volume parameters and rectal mucosal changes observed by flexible sigmoidoscopy. Int J Radiat Oncol Biol Phys 2007; 68:1446–1454. [DOI] [PubMed] [Google Scholar]
- 5.Kang HC, Shin KH, Park SY, et al. 3D CT-based high-dose-rate brachytherapy for cervical cancer: clinical impact on late rectal bleeding and local control. Radiother Oncol 2010; 97:507–513. [DOI] [PubMed] [Google Scholar]
- 6.Lindegaard JC, Fokdal LU, Nielsen SK, et al. MRI-guided adaptive radiotherapy in locally advanced cervical cancer from a Nordic perspective. Acta Oncol 2013; 52:1510–1519. [DOI] [PubMed] [Google Scholar]
- 7.Potter R, Georg P, Dimopoulos JC, et al. Clinical outcome of protocol based image (MRI) guided adaptive brachytherapy combined with 3D conformal radiotherapy with or without chemotherapy in patients with locally advanced cervical cancer. Radiother Oncol 2011; 100:116–123. [DOI] [PMC free article] [PubMed] [Google Scholar]
- 8.Charra-Brunaud C, Harter V, Delannes M, et al. Impact of 3D image-based PDR brachytherapy on outcome of patients treated for cervix carcinoma in France: results of the French STIC prospective study. Radiother Oncol 2012; 103:305–313. [DOI] [PubMed] [Google Scholar]
- 9.Haie-Meder C, Potter R, Van Limbergen E, et al. Gynaecological GECEWG Recommendations from Gynaecological (GYN) GEC-ESTRO Working Group (I): concepts and terms in 3D image based 3D treatment planning in cervix cancer brachytherapy with emphasis on MRI assessment of GTV and CTV. Radiother Oncol 2005; 74:235–245. [DOI] [PubMed] [Google Scholar]
- 10.Malyapa RS, Mutic S, Low DA, et al. Physiologic FDG-PET three-dimensional brachytherapy treatment planning for cervical cancer. Int J Radiat Oncol Biol Phys 2002; 54:1140–1146. [DOI] [PubMed] [Google Scholar]
- 11.Lin LL, Mutic S, Low DA, et al. Adaptive brachytherapy treatment planning for cervical cancer using FDG-PET. Int J Radiat Oncol Biol Phys 2007; 67:91–96. [DOI] [PubMed] [Google Scholar]
- 12.Nam H, Huh SJ, Ju SG, et al. 18F-fluorodeoxyglucose positron emisson tomography/computed tomography guided conformal brachytherapy for cervical cancer. Int J Radiat Oncol Biol Phys 2012; 84:e29–e34. [DOI] [PubMed] [Google Scholar]
- 13.Green JA, Kirwan JM, Tierney JF, et al. Survival and recurrence after concomitant chemotherapy and radiotherapy for cancer of the uterine cervix: a systematic review and meta-analysis. Lancet 2001; 358:781–786. [DOI] [PubMed] [Google Scholar]
- 14.Hegazy N, Potter R, Kirisits C, et al. High-risk clinical target volume delineation in CT-guided cervical cancer brachytherapy: impact of information from FIGO stage with or without systematic inclusion of 3D documentation of clinical gynecological examination. Acta Oncol 2013; 52:1345–1352. [DOI] [PubMed] [Google Scholar]
- 15.Eskander RN, Scanderbeg D, Saenz CC, et al. Comparison of computed tomography and magnetic resonance imaging in cervical cancer brachytherapy target and normal tissue contouring. Int J Gynecol Cancer 2010; 20:47–53. [DOI] [PubMed] [Google Scholar]
- 16.Viswanathan AN, Dimopoulos J, Kirisits C, et al. Computed tomography versus magnetic resonance imaging-based contouring in cervical cancer brachytherapy: results of a prospective trial and preliminary guidelines for standardized contours. Int J Radiat Oncol Biol Phys 2007; 68:491–498. [DOI] [PubMed] [Google Scholar]
- 17.Dimopoulos JC, Potter R, Lang S, et al. Dose–effect relationship for local control of cervical cancer by magnetic resonance image-guided brachytherapy. Radiother Oncol 2009; 93:311–315. [DOI] [PubMed] [Google Scholar]
- 18.Dimopoulos JC, Lang S, Kirisits C, et al. Dose–volume histogram parameters and local tumor control in magnetic resonance image-guided cervical cancer brachytherapy. Int J Radiat Oncol Biol Phys 2009; 75:56–63. [DOI] [PubMed] [Google Scholar]
- 19.Toita T, Kodaira T, Shinoda A, et al. Patterns of radiotherapy practice for patients with cervical cancer (1999–2001): patterns of care study in Japan. Int J Radiat Oncol Biol Phys 2008; 70:788–794. [DOI] [PubMed] [Google Scholar]
- 20.Viswanathan AN, Creutzberg CL, Craighead P, et al. International brachytherapy practice patterns: a survey of the Gynecologic Cancer Intergroup (GCIG). Int J Radiat Oncol Biol Phys 2012; 82:250–255. [DOI] [PMC free article] [PubMed] [Google Scholar]
- 21.Toita T, Kitagawa R, Hamano T, et al. Cervical Cancer Committee of Japanese Gynecologic Oncology G Phase II study of concurrent chemoradiotherapy with high-dose-rate intracavitary brachytherapy in patients with locally advanced uterine cervical cancer: efficacy and toxicity of a low cumulative radiation dose schedule. Gynecol Oncol 2012; 126:211–216. [DOI] [PubMed] [Google Scholar]
- 22.Dimopoulos JC, Kirisits C, Petric P, et al. The Vienna applicator for combined intracavitary and interstitial brachytherapy of cervical cancer: clinical feasibility and preliminary results. Int J Radiat Oncol Biol Phys 2006; 66:83–90. [DOI] [PubMed] [Google Scholar]
- 23.Jurgenliemk-Schulz IM, Lang S, Tanderup K, et al. Variation of treatment planning parameters (D90 HR-CTV, D 2cc for OAR) for cervical cancer tandem ring brachytherapy in a multicentre setting: comparison of standard planning and 3D image guided optimisation based on a joint protocol for dose–volume constraints. Radiother Oncol 2010; 94:339–345. [DOI] [PubMed] [Google Scholar]