Abstract
Liver stiffness (LS) assessed using transient elastography (TE) can assess the risk of developing hepatocellular carcinoma (HCC). We evaluated whether TE, when compared with histological data as a reference standard, can predict the risk of HCC development in chronic hepatitis B (CHB) patients starting antiviral therapy.
Observational cohort database of 381 patients with CHB who underwent liver biopsy (LB) and TE were reviewed. All patients underwent surveillance for HCC development using ultrasonography and alpha-fetoprotein.
During the median follow-up period of 48.1 (interquartile range 30.3–69.3) months, HCC developed in 34 (8.9%) patients. In patients with HCC development, age, proportion of diabetes mellitus, histological fibrosis stage, and LS value were significantly higher than those in patients without (all P <0.05). The cumulative incidence rates of HCC increased significantly in association with elevated LS value in 3 stratified groups (LS value <8, 8–13, and >13 kPa; log-rank test, P <0.001), and with higher histological fibrosis stage in 3 stratified groups (F0–2, F3, and F4; log-rank test, P <0.001). On multivariate analysis, along with age, LS value was an independent predictor of HCC development (hazard ratio 1.041, P <0.001), whereas histological staging was not (P >0.05).
TE predicted HCC development independently in patients with CHB starting antiviral therapy. However, further investigation is needed to determine whether the current surveillance strategy can be optimized based on the LS value at the time of starting antiviral therapy.
INTRODUCTION
Chronic hepatitis B virus (HBV) infection is a major cause of liver cirrhosis and hepatocellular carcinoma (HCC) worldwide, with more than 350 million people affected.1 During the last several decades, the development of antiviral agents has been a major breakthrough in the treatment of chronic hepatitis B (CHB). Their use in CHB has prevented disease progression and reduced the risk of HCC development.2,3 Although first-generation nucleos (t)ides analogs such as lamivudine have encouraged resistant HBV strain, more effective and less resistance-prone antiviral agents, such as entecavir and tenofovir, have been available recently. These newer agents suppress HBV completely and promptly in CHB patients regardless of high baseline viral load or the presence of drug resistance.4,5 Nevertheless, a low, but clinically relevant risk of HCC development has still remained in CHB patients receiving antiviral therapy.6
In this era of potent antiviral therapy, the prognostic significance of serum HBV DNA level, which was considered a risk factor for HCC development, has substantially diminished. Thus, it can be hypothesized that fibrotic burden that is significantly related to the risk of developing HCC7,8 can stratify individual patients into different risks of developing HCC among CHB patients starting antiviral therapy. For evaluating the extent of liver fibrosis, liver biopsy (LB) remains the gold standard to date. However, due to the limitations of LB such as invasiveness, sampling error, and inter- and intraobserver variability, LB is often considered an “imperfect” surrogate marker for liver fibrosis.9 In addition, serial LBs are not feasible during antiviral therapy in clinical practice.9 Thus, to overcome the pitfalls of LB, noninvasive methods to assess liver fibrosis have been developed.
Transient elastography (TE) is one of the most widely validated noninvasive tools for assessing fibrotic burden.10,11 The prognostic value of liver stiffness (LS) as measured by TE in predicting critical events related to fibrosis progression, including the development of portal hypertension-related complications and HCC, has been well established in several longitudinal studies.12–15 Moreover, recent studies demonstrated that TE can predict HCC or liver-related events (LREs) even in patients receiving antiviral therapy.16–18 Although a recent study demonstrated that TE is more useful in predicting LREs when compared with histological data in CHB patients before starting antiviral therapy,19 further validation of TE in predicting HCC in the era of antiviral therapy is still required.
In this multicenter, retrospective study, we aimed to evaluate the prognostic value of TE in predicting risk of developing HCC as compared with the prognostic value of histological data in CHB patients starting antiviral therapy.
METHODS
Patients
From November 2005 to January 2015, 465 CHB patients who underwent LB and TE before starting antiviral therapy at 3 tertiary centers were considered for inclusion. The indication for LB was the assessment of the severity of liver fibrosis and inflammation before starting antiviral therapy. CHB was defined as the persistent presence of serum hepatitis B surface antigen for >6 months.17 Antiviral therapy was initiated in accordance with the treatment guidelines of the Korean Association for the Study of the Liver20 and reimbursement guidelines of the National Health Insurance Service in Korea. Virological response (VR) was defined as a reduction in HBV DNA levels to <2000 IU/mL.
Exclusion criteria were as follows: failure to obtain reliable LS values (valid shot = 0), an invalid LS value, delay between LB and TE>1 month, starting antiviral therapy more than 1 month after LB, presence of HCC at enrollment or history of it, HCC development within 6 month after enrollment, history of previous antiviral therapy, history of decompensated cirrhosis, Child–Pugh class B or C cirrhosis at enrollment, unsuitable quality of LB specimen for appropriate interpretation, coinfection with hepatitis C, hepatitis D, or HIV, right-sided heart failure, pregnancy, and loss to follow-up (Supplementary Figure 1).
The study protocol conformed with the ethical guidelines of the 1975 Declaration of Helsinki and was approved by the Institutional Review Board of Severance Hospital as well as other institutes. Written informed consents were not required due to the retrospective nature of this study.
LB Examination
LB specimens were prepared with hematoxylin and eosin (H&E) and Masson trichrome. All liver tissue samples were evaluated by experienced pathologists at each center who was blinded to the clinical data. The degree of liver histology was evaluated semiquantitatively according to the Batts and Ludwig scoring system.21 Fibrosis was staged as follows: F0, no fibrosis; F1, portal fibrosis without septa; F2, portal fibrosis and a few septa; F3, numerous septa without cirrhosis; and F4, cirrhosis. The necro-inflammatory activity was graded as A0, none; A1, minimal; A2, mild; A3, moderate; and A4, severe activity.
LS Measurement Using TE
TE was performed as previously reported,15,22,23 and LS value was expressed as kilopascal (kPa). In this study, only LS values with at least 10 validated measurements and a success rate of at least 60%, and an interquartile range (IQR) to median value ratio (IQR/M) of <0.3 were considered reliable.
Baseline Work-Up and Follow-Up
The baseline visit for enrollment was defined as the visit during which LB was performed. At baseline and during follow-up, all patient data were evaluated based on ultrasonography and laboratory work-up, including alpha-fetoprotein every 3 or 6 months for screening of HCC and other portal hypertension-related complications. The diagnosis of HCC was established based on the guideline of the American Association for the Study of Liver Disease.24 LRE was defined as hepatic decompensation (variceal bleeding, ascites, spontaneous bacterial peritonitis, hepatic encephalopathy, or hepatorenal syndrome), HCC, and liver-related death. To avoid statistical repetition, we selected the earliest LRE if a given patient experienced different types of LRE at different time points.
Statistical Analysis
Data are expressed as the median with range, the mean ± SD, or number (n, %) as appropriate. Differences among continuous and categorical variables were examined using Student t test (or the Mann–Whitney test) and the χ2 test (or Fisher exact test), respectively. To assess the accuracy of LS value in diagnosing histological bridging fibrosis and cirrhosis, the receiver operating characteristics (ROC) curve and its 95% confidence interval (CI) were calculated.23
The cumulative incidence rates of HCC and LRE were analyzed using the Kaplan–Meier method with comparison using the log-rank test. Times to HCC and LRE development were calculated from the date of enrollment to the date of development of HCC and the first LRE or the last follow-up. To identify independent risk factors for developing HCC and LRE, Cox proportional hazards regression analysis was used.23 Statistical analyses were performed using SPSS software (version 18.0; SPSS Inc., Chicago, IL). A P value <0.05 was considered statistically significant.
RESULTS
Patient Characteristics
After excluding 84 patients according to our exclusion criteria, a total of 381 patients were finally selected for the statistical analysis (Supplementary Figure 1). The baseline clinical characteristics of the study population are described in Table 1. The mean age was 44.1 years, and male sex was predominant (n = 251, 65.9%). The mean LS value and ALT level were 13.9 kPa and 132.6 IU/L, respectively. The histological fibrosis stages were F0–1 in 44 (11.5%) patients, F2 in 93 (24.4), F3 in 94 (24.7), and F4 in 150 (39.4).
TABLE 1.
Baseline Characteristics of the Study Population (n = 381)
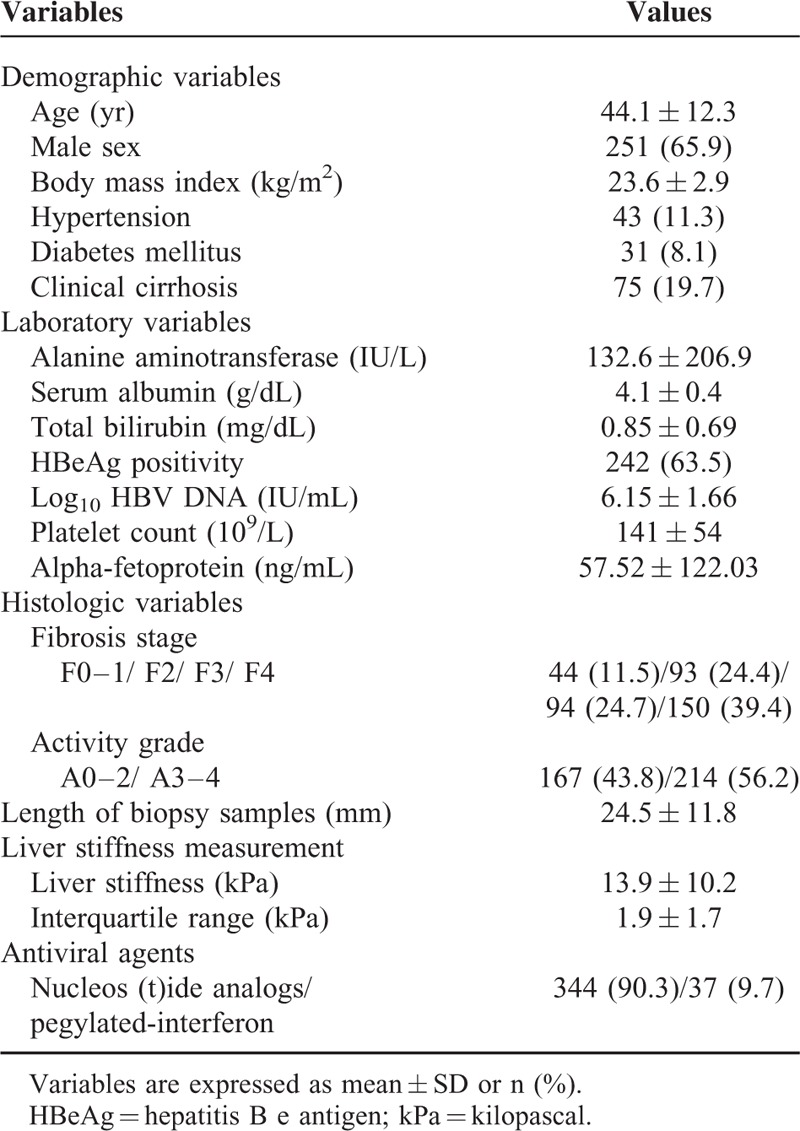
A total of 344 (90.3%) patients were treated with nucleos (t)ide analogs (67 with lamivudine, 21 with clevudine, 59 with telbivudine, 9 with adefovir, 10 with tenofovir, and 178 with entecavir), and 37 (9.7%) patients were treated with pegylated-interferon.
Diagnostic Performances of TE and the Optimal LS Cutoff for Each Fibrosis Stage
The optimal cutoff LS values and corresponding diagnostic indexes of our study cohort were calculated (Supplementary Table 1). The AUCs of TE to predict ≥F2 (n = 337), ≥F3 (n = 244), and ≥F4 (n = 148) fibrosis stage were 0.804 (05% CI 0.747–0.962), 0.830 (95% CI 0.786–0.874), and 0.824 (95% CI 0.783–0.865), respectively. The cutoff LS values for ≥F2, ≥F3, and F4 were 7.5 kPa (sensitivity 79.5% specificity 65.9%), 9.5 kPa (sensitivity 76.6% specificity 80.3%), and 11.5 kPa (sensitivity 75.7% specificity 79.0%), respectively.
HCC Development During Follow-Up
During a median follow-up period of 48.1 (IQR 30.3–69.3) months, 34 (8.9%) patients experienced HCC development. Furthermore, 36 (9.4%) patients experienced LRE development (31 HCCs and 5 hepatic decompensations as the first event). The cumulative incidence rates of HCC at 3, 5, and 7 years were 6.5%, 11.2%, and 11.9%, respectively, with an annual incidence of 22 per 1000 person-years (Figure 1A). The cumulative incidence rates of LRE at 3, 5, and 7 years were 7.0%, 11.7%, 12.5%, respectively, with an annual incidence of 23 per 1000 person-years (Figure 1B).
FIGURE 1.

The cumulative incidence rates of HCC (A) and LRE (B) (Kaplan–Meier plot). The cumulative incidence rates of HCC at 3, 5, and 7 years were 6.5%, 11.2%, and 11.9%, respectively, with an annual incidence of 22 per 1000 person-years. The cumulative incidence rates of LREs at 3, 5, and 7 years were 7.0%, 11.7%, and 12.5%, respectively, with an annual incidence of 23 per 1000 person-years. HCC = hepatocellular carcinoma; LRE = liver-related event.
Comparison of Baseline Characteristics of Patients With and Without HCC and LRE
When the baseline characteristics of patients with and without HCC were compared (Table 2), age (mean 54.5 vs. 43.0 years), proportion of diabetes mellitus (20.6 vs. 6.9%), histological F4 fibrosis stage (70.6 vs. 35.7%), and LS value (mean 20.0 vs. 13.3 kPa) were significantly higher in patients with HCC development than in those without (all P <0.05), whereas ALT level (52.4 vs. 140.5 IU/L) and platelet count (128 vs. 142 × 109/L) were significantly lower in patients with HCC development than in those without (all P <0.05).
TABLE 2.
Comparison Between Patients With and Without HCC or LRE Development
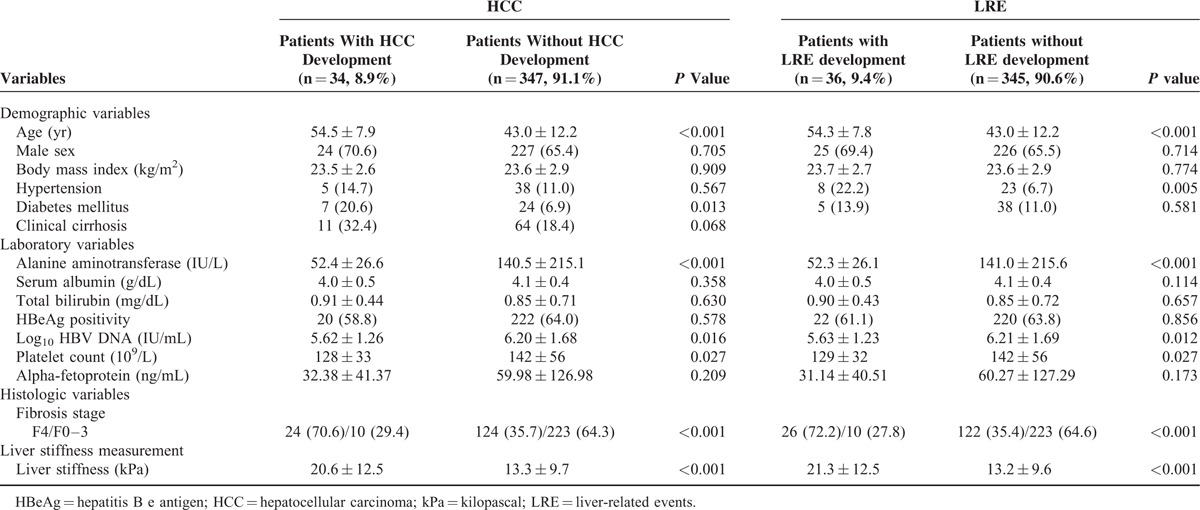
When the baseline characteristics of patients who experienced an LRE were compared with those of patients who did not (Table 2), age (mean 54.3 vs. 43.0 years), proportion of hypertension (22.2 vs. 6.7%), histological F4 fibrosis stage (72.2 vs. 35.4%), and LS value (21.3 vs. 13.2 kPa) were significantly higher in patients with LRE development than in those without (all P <0.05), whereas ALT level (52.3 vs. 141 IU/L), HBV-DNA level (5.63 vs. 6.21 log10 IU/mL), and platelet count (129 vs. 142 109/L) were significantly lower in patients with LRE development (all P <0.05).
Comparison of the Prognostic Performance of LS Value and Histological Fibrosis Stage
The AUCs of the LS value and histological fibrosis stage for HCC development at 3- and 5- years are shown in Table 3. Although the AUC values of LS value to predict HCC development at 3-years and 5-years were higher than those of histological fibrosis stage, statistical significances were not reached (all P >0.05). Similar results were obtained with respect to LRE development (Table 3).
TABLE 3.
Comparison of the Prognostic Performance of LS Value and Histological Fibrosis Stage

Independent Predictors of HCC and LRE Development
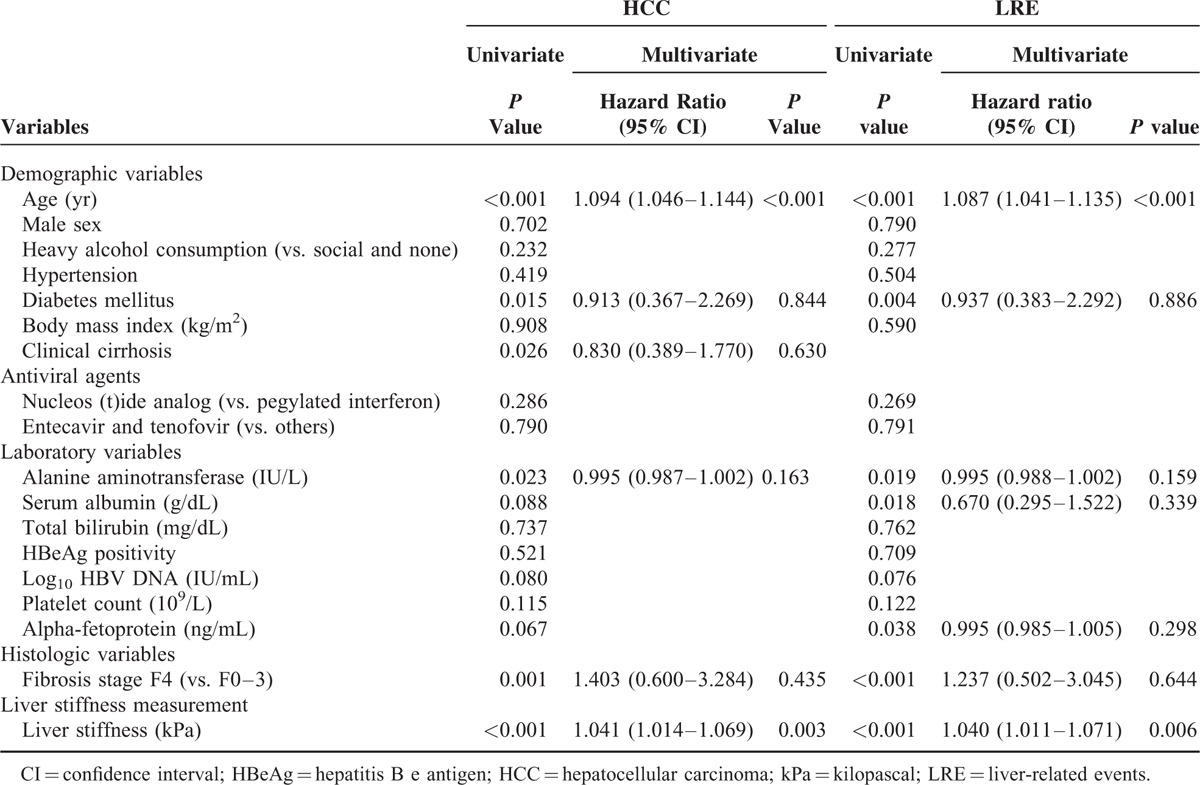
Univariate and subsequent multivariate analysis to identify independent predictors of HCC and LRE development are described in Table 4. On univariate analysis, age, diabetes mellitus, clinical cirrhosis, ALT level, fibrosis stage (F4 vs. F0–3), and LS values significantly predicted HCC development (all P <0.05), whereas age, diabetes mellitus, ALT level, serum albumin level, alpha-fetoprotein, fibrosis stage (F4 vs. F0–3), and LS values significantly predicted LRE development (all P <0.05). On subsequent multivariate analyses, LS value was an independent predictor of HCC development (P <0.001; adjusted HR 1.042, 95% CI 1.016–1.070) and LRE development (P = 0.006; adjusted HR 1.041, 95% CI 1.012–1.071), together with age (Table 4), whereas histological fibrosis stage was not an independent predictor for either HCC or LRE development (all P >0.05). When LS value and histological fibrosis stage were separately entered into multivariate analyses to prevent statistical collinearity, LS value was selected as one of the independent predictors of HCC (HR 1.058, 95% CI 1.020–1.097, P = 0.002) and LRE development (HR 1.052, 95% CI 1.018–1.087, P = 0.003) (Supplementary Table 2, whereas histological fibrosis stage was not (P = 0.089 for HCC, P = 0.095 for LRE) (Supplementary Table 3).
TABLE 4.
Independent Predictors of HCC or LRE Development
Considering the independent prognostic significance of LS values, we stratified our study population into 3 groups using the cutoff LS values of 8.0 and 13 kPa according to the stratifications used in several previous studies.15,17 The risk of HCC and the risk of LRE development increased in association with higher LS values among 3 stratified groups (log-rank test, all P <0.001) (Figure 2A and B). Although histological fibrosis stage was not a significant predictor of HCC and LRE development, when the patients were divided into 3 groups according to histological fibrosis stage (F0-2, F3, and F4), the risk of HCC and the risk of LRE development also increased in association with higher histological fibrosis stage (log-rank test, all P <0.001) (Figure 2C and D).
FIGURE 2.
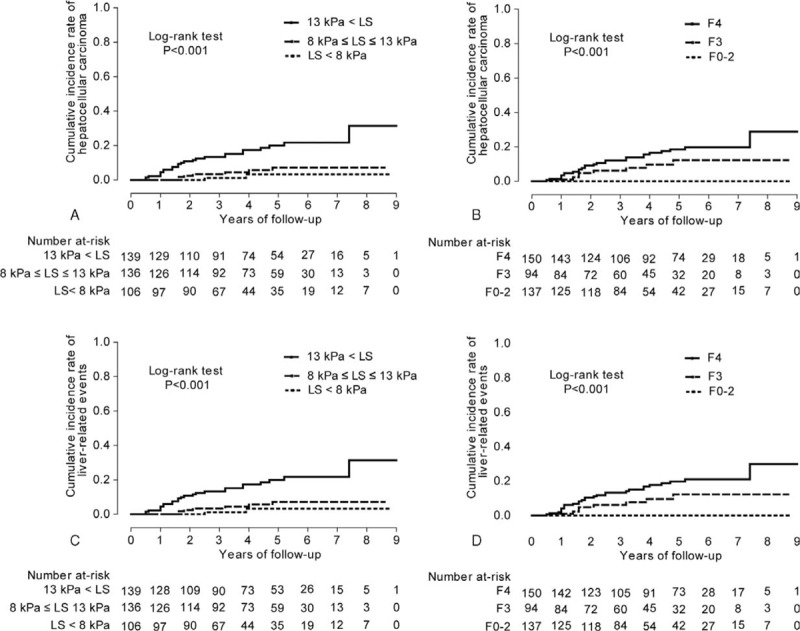
The cumulative incidence rates of HCC based on stratified LS values (<8, 8–13, and >13 kPa) and histological fibrosis stage (F0–2, F3, and F4) (A and B), and the cumulative incidence rates of LRE based on stratified LS values and histological fibrosis stage (C and D). The cumulative incidence rates of HCC and LRE increased significantly in association with higher LS value and with higher histological fibrosis stage (log-rank test, all P <0.001). HCC = hepatocellular carcinoma; LRE = liver-related event.
Association Between the Change in LS Values and the Risk of Developing HCC or LRE
Of the study population, a second TE examination was available at the time of VR after a median of 13.2 (range, 6.0–24.0) months in 139 (36.5%) patients. We excluded 5 patients who showed an increase in LS value from <13 kPa at baseline to ≥13 kPa at follow-up to prevent statistical error caused by a small sample size. The remaining patients were divided into 3 groups (group 1: n = 75, LS value <13 kPa at baseline and follow-up; group 2: n = 33, LS value ≥13 kPa at baseline and <13 kPa at follow-up; group 3: n = 26, LS values >13 kPa both at baseline and follow-up). The cumulative incidence rates of HCC and LRE differed significantly among the 3 groups (log-rank test, all P <0.001) (Figure 3A and B).
FIGURE 3.
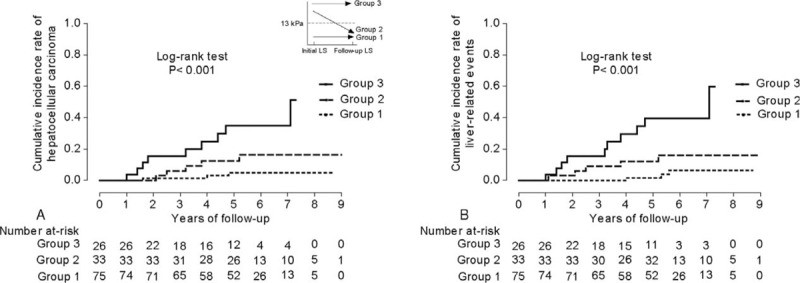
The cumulative incidence rates of HCC (A) and LRE (B) according to the changes in LS values (n = 134). The overall incidence rates of HCC and LRE differed significantly among the 3 groups (log-rank test, all P <0.001). HCC = hepatocellular carcinoma; LRE = liver-related event.
DISCUSSION AND CONCLUSIONS
In this study, we aimed to evaluate whether TE, when compared with histological data, can predict the risk of HCC and LRE development in CHB patients starting antiviral therapy. To our knowledge, this is the first Asian longitudinal study with a relatively large sample size demonstrating that the prognostic value of TE may be better than that of histological information in assessing the risk of HCC and LRE development. Our study also demonstrated that changes in LS values can monitor the changing risk of HCC or LRE development during antiviral therapy.
The results of our study address several important clinical points. First, LB, as a gold standard, provide accurate information regarding the degree of liver fibrosis and necroinflammation, enable clinicians in determining whether to start antiviral therapy, and provide prognostic information.9 Indeed, as shown in our study, histological assessment predicted the risk of HCC and LRE development at 3- and 5-years of antiviral therapy with acceptable accuracy (AUC around 0.75), which was statistically similar to that of LS value. However, histological assessment was not selected as an independent predictor of HCC and LRE development when adjusted with and without LS value. In contrast, it was demonstrated that TE could assess the fibrotic burden with acceptable accuracy (AUC more than 0.8 for each fibrosis stage) similar to a vast amount of previous studies,13,19,25 and that TE was independently prognostic in predicting HCC and LRE development even after adjusting for LB and other variables. These findings support the necessity to check LS values at the time of starting antiviral therapy. Our findings also supported the use of TE to assess the changing risk of HCC and LRE development. Because serial LBs are not feasible in real clinical practice due to the inherent invasiveness of biopsy, TE can be used to monitor the changes in LS values during antiviral therapy.
Second, our study showed that the risk of developing HCC or experiencing an LRE remained significant with cumulative incidence rates of 11.2% and 11.7% at 5 year, respectively, although it has been known that the risks significantly decreased due to appropriate antiviral therapy.26,27 This supports the need for risk prediction to assist prognostication and HCC surveillance even with antiviral therapy. Although HBV DNA level was one of the most important predictors of HCC development in the era prior to antiviral therapy,28,29 the preexisting or remained fibrotic burden after antiviral therapy has recently received the attention as a significant prognostic candidate due to diminished prognostic significance of HBV DNA by active and potent antiviral therapy.7 In this regard, in the era of antiviral therapy, the LS value, which can be used to assess preexisting or residual fibrotic burden, may be a more appropriate risk prediction tool for HCC development. Accordingly, recent studies demonstrated that the LS-based HCC risk scores had better predictive performance than conventional scores in CHB patients receiving antiviral therapy.17,30
In our study, a 1-point increase in LS value was associated with a 1.041- and 1.040-fold increase in the risk of HCC and LRE development, respectively. These results emphasize the prognostic significance of LS values in determining the risk of developing HCC in the era of antiviral therapy and are consistent with the results of several previous studies with similar clinical settings.18,19,31 A previous study by Kim et al19 demonstrated that LS value was an independent predictor of LRE development, whereas histological fibrosis stage was not, in patients showing histologically advanced liver fibrosis and starting nucleot (s)ide analogs. Another study by Lee et al demonstrated that LS values at complete VR are useful for predicting LRE development in patients receiving entecavir.17 When we divided our study population into 3 groups using the stratified LS value similar to the study by Lee et al, the risk of developing HCC significantly increased in the groups with high LS values. Similar to our study, prior studies have shown that LS values significantly decreased in most CHB patients during antiviral therapy, and those changes may reflect the changing risk of HCC or LRE development during antiviral therapy.17,24,32
Several issues still remained unresolved in our study. First, the number of patients who developed HCC was small (8.9%), which was related to the characteristics of our study population receiving antiviral therapy. Nevertheless, the homogeneity of our population with respect to antiviral treatment, histological data, and follow-up duration may have played a role in revealing the clinical significance of TE. Second, if histological data had been available at the time of VR, the association of LS change with histological fibrosis change might have been more clearly determined. A well-designed future study with follow-up histological data is required to confirm whether TE can monitor the changes in the fibrotic burden during and after antiviral therapy. Finally, after a rigorous review of the literature, we decided to focus on the performance of TE instead of simple noninvasive methods such as AST to platelet ratio index (APRI), FIB-4, and Forn index. Despite being a good alternative to LB, TE is not widely available due to its high cost, especially in resource-limited countries. Thus, future studies should focus on simple noninvasive methods.
In conclusion, our study showed the predictive value of LS measurement using TE, as compared with the histological fibrosis stage, in predicting HCC and LRE development in patients receiving antiviral therapy. Despite the reduction in HCC and LRE risk attributable to effective antiviral therapy, the risk remains substantial. Our study supports that tailored surveillance strategies for HCC could be established based on LS values. However, further investigation is needed to determine whether the current surveillance strategy can be optimized based on the LS value at the time of starting antiviral therapy.
Supplementary Material
Acknowledgment
The authors are grateful to Dong-Su Jang (Medical Illustrator, Medical Research Support Section, Yonsei University College of Medicine, Seoul, Korea) for his help with the figures.
Footnotes
Abbreviations: ALT = alanine aminotransferase, AST = aspartate aminotransferase, AUC = area under the receiver operating characteristic curve, CHB = chronic hepatitis B, CI = confidence interval, HBeAg = hepatitis B e antigen, HBV = hepatitis B virus, HCC = hepatocellular carcinoma, HR = hazard ratio, IQR = interquartile range, kPa = kilopascal, LB = liver biopsy, LRE = liver-related event, LS = liver stiffness, ROC = receiver operating characteristic, TE = transient elastography, ULN = upper limit of normal, VR = virological response.
The English in this document has been checked by at least 2 professional editors, both native speakers of English.
Yeon Seok Seo, Mi Na Kim, Seung Up Kim and Young Seok Kim contributed equally to this work as first authors.
This study was supported by a grant of the Korea Healthcare technology R&D Project, Ministry of Health and Welfare, Republic of Korea (HI10C2020), and supported by Basic Science Research Program through the National Research Foundation of Korea (NRF) funded by the Ministry of Science, ICT and Future Planning (NRF-2014R1A1A1008585) and by the Ministry of Education (2015R1D1A1A01058653). The funders had no role in study design, data collection and analysis, decision to publish, or preparation of the manuscript.
The authors have no conflicts of interest to disclose.
REFERENCES
- 1.Liaw YF, Chu CM. Hepatitis B virus infection. Lancet 2009; 373:582–592. [DOI] [PubMed] [Google Scholar]
- 2.Fattovich G. Natural history and prognosis of hepatitis B. Semin Liver Dis 2003; 23:47–58. [DOI] [PubMed] [Google Scholar]
- 3.McMahon BJ. The natural history of chronic hepatitis B virus infection. Semin Liver Dis 2004; 24 suppl 1:17–21. [DOI] [PubMed] [Google Scholar]
- 4.Papatheodoridis GV, Manolakopoulos S, Dusheiko G, et al. Therapeutic strategies in the management of patients with chronic hepatitis B virus infection. Lancet Infect Dis 2008; 8:167–178. [DOI] [PubMed] [Google Scholar]
- 5.EASL Clinical Practice Guidelines: management of chronic hepatitis B. J Hepatol 2009; 50:227–242. [DOI] [PubMed] [Google Scholar]
- 6.Lai CL, Yuen MF. Prevention of hepatitis B virus-related hepatocellular carcinoma with antiviral therapy. Hepatology 2013; 57:399–408. [DOI] [PubMed] [Google Scholar]
- 7.Pungpapong S, Kim WR, Poterucha JJ. Natural history of hepatitis B virus infection: an update for clinicians. Mayo Clin Proc 2007; 82:967–975. [DOI] [PubMed] [Google Scholar]
- 8.Yoshida H, Shiratori Y, Moriyama M, et al. Interferon therapy reduces the risk for hepatocellular carcinoma: national surveillance program of cirrhotic and noncirrhotic patients with chronic hepatitis C in Japan. IHIT Study Group. Inhibition of Hepatocarcinogenesis by Interferon Therapy. Ann Intern Med 1999; 131:174–181. [DOI] [PubMed] [Google Scholar]
- 9.Bravo AA, Sheth SG, Chopra S. Liver biopsy. N Engl J Med 2001; 344:495–500. [DOI] [PubMed] [Google Scholar]
- 10.Chon YE, Choi EH, Song KJ, et al. Performance of transient elastography for the staging of liver fibrosis in patients with chronic hepatitis B: a meta-analysis. PLoS One 2012; 7:e44930. [DOI] [PMC free article] [PubMed] [Google Scholar]
- 11.Friedrich-Rust M, Ong MF, Martens S, et al. Performance of transient elastography for the staging of liver fibrosis: a meta-analysis. Gastroenterology 2008; 134:960–974. [DOI] [PubMed] [Google Scholar]
- 12.Kim BK, Fung J, Yuen MF, et al. Clinical application of liver stiffness measurement using transient elastography in chronic liver disease from longitudinal perspectives. World J Gastroenterol 2013; 19:1890–1900. [DOI] [PMC free article] [PubMed] [Google Scholar]
- 13.Kim BK, Kim do Y, Han KH, et al. Risk assessment of esophageal variceal bleeding in B-viral liver cirrhosis by a liver stiffness measurement-based model. Am J Gastroenterol 2011; 106:1654–1662. [DOI] [PubMed] [Google Scholar]
- 14.Kim BK, Han KH, Park JY, et al. A liver stiffness measurement-based, noninvasive prediction model for high-risk esophageal varices in B-viral liver cirrhosis. Am J Gastroenterol 2010; 105:1382–1390. [DOI] [PubMed] [Google Scholar]
- 15.Jung KS, Kim SU, Ahn SH, et al. Risk assessment of hepatitis B virus-related hepatocellular carcinoma development using liver stiffness measurement (FibroScan). Hepatology 2011; 53:885–894. [DOI] [PubMed] [Google Scholar]
- 16.Kang W, Kim SU, Ahn SH. Non-invasive prediction of forthcoming cirrhosis-related complications. World J Gastroenterol 2014; 20:2613–2623. [DOI] [PMC free article] [PubMed] [Google Scholar]
- 17.Lee HW, Yoo EJ, Kim BK, et al. Prediction of development of liver-related events by transient elastography in hepatitis B patients with complete virological response on antiviral therapy. Am J Gastroenterol 2014; 109:1241–1249. [DOI] [PubMed] [Google Scholar]
- 18.Kim JH, Kim MN, Han KH, et al. Clinical application of transient elastography in patients with chronic viral hepatitis receiving antiviral treatment. Liver Int 2015; 35:1103–1115. [DOI] [PubMed] [Google Scholar]
- 19.Kim SU, Lee JH, Kim do Y, et al. Prediction of liver-related events using fibroscan in chronic hepatitis B patients showing advanced liver fibrosis. PLoS One 2012; 7:e36676. [DOI] [PMC free article] [PubMed] [Google Scholar]
- 20.KASL Clinical Practice Guidelines: management of chronic hepatitis B. Clin Mol Hepatol 2012; 18:109–162. [DOI] [PMC free article] [PubMed] [Google Scholar]
- 21.Batts KP, Ludwig J. Chronic hepatitis. An update on terminology and reporting. Am J Surg Pathol 1995; 19:1409–1417. [DOI] [PubMed] [Google Scholar]
- 22.Sandrin L, Fourquet B, Hasquenoph JM, et al. Transient elastography: a new noninvasive method for assessment of hepatic fibrosis. Ultrasound Med Biol 2003; 29:1705–1713. [DOI] [PubMed] [Google Scholar]
- 23.Kim MN, Kim SU, Kim BK, et al. Increased risk of hepatocellular carcinoma in chronic hepatitis B patients with transient elastography-defined subclinical cirrhosis. Hepatology 2015; 61:1851–1859. [DOI] [PubMed] [Google Scholar]
- 24.Bruix J, Sherman M. Management of hepatocellular carcinoma: an update. Hepatology 2011; 53:1020–1022. [DOI] [PMC free article] [PubMed] [Google Scholar]
- 25.Seo YS, Kim MY, Kim SU, et al. Accuracy of transient elastography in assessing liver fibrosis in chronic viral hepatitis: a multicentre, retrospective study. Liver Int 2015; 35:2246–2255. [DOI] [PubMed] [Google Scholar]
- 26.Liaw YF, Sung JJ, Chow WC, et al. Lamivudine for patients with chronic hepatitis B and advanced liver disease. N Engl J Med 2004; 351:1521–1531. [DOI] [PubMed] [Google Scholar]
- 27.Fung SK, Lok AS. Management of patients with hepatitis B virus-induced cirrhosis. J Hepatol 2005; 42 suppl 1:S54–64. [DOI] [PubMed] [Google Scholar]
- 28.Iloeje UH, Yang HI, Su J, et al. Predicting cirrhosis risk based on the level of circulating hepatitis B viral load. Gastroenterology 2006; 130:678–686. [DOI] [PubMed] [Google Scholar]
- 29.Chan HL, Tse CH, Mo F, et al. High viral load and hepatitis B virus subgenotype ce are associated with increased risk of hepatocellular carcinoma. J Clin Oncol 2008; 26:177–182. [DOI] [PubMed] [Google Scholar]
- 30.Jung KS, Kim SU, Song K, et al. Validation of hepatitis B virus-related hepatocellular carcinoma prediction models in the era of antiviral therapy. Hepatology 2015; 62:1757–1766. [DOI] [PubMed] [Google Scholar]
- 31.Kim MN, Kim SU, Park JY, et al. Risk assessment of liver-related events using transient elastography in patients with chronic hepatitis B receiving entecavir. J Clin Gastroenterol 2014; 48:272–278. [DOI] [PubMed] [Google Scholar]
- 32.Kim BK, Oh HJ, Park JY, et al. Early on-treatment change in liver stiffness predicts development of liver-related events in chronic hepatitis B patients receiving antiviral therapy. Liver Int 2013; 33:180–189. [DOI] [PubMed] [Google Scholar]
Associated Data
This section collects any data citations, data availability statements, or supplementary materials included in this article.


