Abstract
Metabolic impairment is the common cause for mortality in acromegalic patients. In this study, long-term improvements of metabolic parameters were evaluated according to 2 different remission criteria.
This was an observational cohort study before and up to 1 year after transsphenoidal adenomectomy (TSA). Participants were 187 patients with acromegaly. At 6 months after TSA, remitted patients with age- and sex-matched normalized IGF-1 were divided into 2 groups: remission 1 (R1), nadir growth hormone (GH) below 0.4 ng/mL; and remission 2 (R2), nadir GH between 0.4 and 1.0 ng/mL in oral glucose tolerance test (OGTT). Metabolic parameters during serial OGTTs were evaluated for 12 months. Remission was achieved in 157 (R1–136; R2–21) patients. Immediate postoperative metabolic parameters including body weight, body mass index, glucose, insulin, and free fatty acid in OGTT were all significantly improved in R1 and R2. HOMA-%β and HOMA-IR scores also improved in both R1 and R2. These improvements persisted for duration (12 months) of this study. However, no difference was present in metabolic parameters between R1 and R2. Although the patients with preoperative adrenal insufficiency presented significantly increased HOMA scores before TSA, there was no difference between classifications of deficient pituitary axes and changes of metabolic parameters after TSA. Remitted patients exhibited rapid restoration of metabolic parameters immediate postoperative period. Long-term improvements in metabolic parameters were not different between the 2 different nadir GH cut-offs, 0.4 and 1.0 ng/mL.
Keywords: free fatty acid, gH-secreting pituitary adenoma, hOMA, insulin resistance, oral glucose tolerance test
1. Introduction
Acromegaly is a clinical syndrome caused by excess secretion of growth hormone (GH).[1] Long-term exposure to excess GH results in increased production of insulin-like growth factor-1 (IGF-1), mainly by the liver. The standardized mortality ratio of acromegalic patients is 1.48, which are mostly contributed by hyperglycemia or overt diabetes, and cardiovascular events.[2] Concerning the main causes of mortality, control of metabolic impairments plays a major role in the management of acromegalic patients.[1] In acromegaly, GH excess is known to induce insulin resistance and to impair β-cell function, thereby causing diabetes mellitus (DM) and cardiovascular diseases.[3–5] Although IGF-1 has been shown to improve insulin resistance in healthy subjects and in patients with diabetes, the effect of increased IGF-1 on glucose homeostasis in active acromegaly has not been clearly evaluated.[6] Despite the opposite role of GH and IGF-1 on glucose homeostasis, approximately 10% to 15% of all patients with acromegaly suffer from DM, and more than 50% have impaired glucose tolerance.[7,8] Serum GH levels, age, low HOMA-%β, duration of GH excess, familial history of DM, and hypertension have all been reported to be associated with the development of DM in patients with acromegaly.[3,9] Furthermore, GH excess in patients with active acromegaly has been shown to induce hepatic resistance as well as muscular and adipogenic insulin resistance.[3,10]
The treatment goals in acromegalic patients are to normalize the over-secretion of GH and IGF-1.[11] Recent guideline for the management of patients with acromegaly defined biochemical remission as a nadir GH concentration below 0.4 ng/mL in the 75 g oral glucose tolerance test (OGTT).[12] Furthermore, the latest guideline proposed a random GH level below 1 ng/mL[11] as a therapeutic goal, because this cut-off correlated with control of acromegaly. The GH concentrations for defining biochemical remission, including nadir GH cut-off concentrations in the OGTT and random GH concentration, have been lowered steadily over the past few decades to avoid complications associated with GH excess. However, the relationship between these cut-off values and metabolic parameter changes in patients with acromegaly has not yet been fully investigated.
Recently, we reported that immediate postoperative changes of GH level during a week after transsphenoidal adenomectomy (TSA) had significant role on predicting both the long-term biochemical remission and the accelerated GH deficiency in patients with acromegaly.[13,14] Concerning that both GH excess and deficiency have adverse effects on metabolic syndrome, early changes of biochemical activities of acromegaly could induce abrupt changes of metabolic parameters since a week after TSA. However, no study demonstrated the serial changes of metabolic parameters including biochemical activities during a week after TSA. Furthermore, few reports have studied metabolic parameter changes in patients surgically cured of acromegaly, although metabolic impairment is a major reason why acromegaly requires treatment.
Therefore, in this study, we evaluated the significance of the different nadir GH cut-offs in OGTT on metabolic changes after TSA. Furthermore, we investigated the serial changes of metabolic parameters in patients cured of acromegaly by TSA. We evaluated these parameters before TSA and then again at 1 week, 6 months, and 12 months after TSA.
2. Methods
2.1. Patients
All patients were initially part of a cohort at Severance Hospital Pituitary Tumor Center.[13–15] Since 1992, 605 acromegalic patients have received TSA in Severance Hospital Pituitary Tumor Center. All TSAs were performed by a senior neurosurgeon (SHK). Before January 2011, GH levels were determined using an immunoradiometric assay.[15] After January 2011, a highly sensitive and specific chemiluminescent immunoassay was used for GH measurement with World Health Organization international standard (WHO IS 98/574). Because recent guideline suggested ultrasensitive method for GH measurement using WHO IS 98/574, the patients of whom GH levels were measured by this kit before and after TSA were included in this study. In this cohort, 209 patients with acromegaly received TSA from January 2011 to December 2014. Of the 209 patients, 22 were excluded due to a lack of adequate endocrine evaluation or to follow-up loss after TSA. Thus, we evaluated 187 patients with acromegaly, each of whom was followed up to 12 months after TSA. The clinical manifestations of the 22 excluded patients did not differ from those of the 187 enrolled patients. The excluded patients were 41 (34–51) years old and 9 of them (40.9%) were male. Preoperative HOMA-%β and HOMA-IR of them were 96.2 (68.1–157.5) and 2.8 (2.0–5.8), respectively. Pituitary tumors were classified according to the modified Hardy radiological classification system as described previously,[15] which uses tumor size and invasiveness of cavernous sinus for classification. Hardy classification I meant the tumors of which the size was less than 1 cm and location was limited within the sella. If the tumors extended to the suprasellar region less than 1 cm, they were categorized as Hardy classification II. The tumors extending to the suprasellar region above 1 cm were Hardy classification IIIA and those growing into the sphenoid sinus were Hardy classification IIIB. The tumors invading into the cavernous sinus were Hardy classification IV.
This study was conducted in accordance with the Declaration of Helsinki and was approved by our institutional review board (No. 4-2015-0725).
2.2. Metabolic parameters
During the 75 g OGTT, serum GH, glucose, insulin, and free fatty acid (FFA) levels were measured for 2 hours as described previously.[15] The OGTT was performed before TSA and then again at 1 week after TSA; patients had been also followed up at 6-month intervals after TSA. According to the IGF-1 and the nadir GH level in OGTT at 6 months after TSA, the remitted patients classified into 2 groups; R1: nadir GH in OGTT below 0.4 ng/mL and age- and sex-matched normal IGF-1, and R2: nadir GH in OGTT between 0.4 and 1.0 ng/mL and age- and sex-matched normal IGF-1. GH concentrations were determined by a highly sensitive and specific chemiluminescent immunoassay (LIASON hGH; DiaSorin, Saluggia VS, Italy), using WHO IS 98/574. The analytic sensitivity, interassay coefficient of variation (CV), and intra-assay CV of GH measurements were 0.01 μIU/mL, 3.8–5.0%, and 1.3–2.1%. IGF-1 concentrations were measured by an IRMA system (IGF-1 NEXT IRMA CT; Biocode-Hycel, Liège, Belgium). The analytic sensitivity, interassay CV, and intra-assay CV of IGF-1 measurements were 1.25 ng/L, 7.4% to 9.1%, and 2.6% to 4.4%.
Homeostasis model assessment was used to calculate pancreatic β-cell function (HOMA-%β) and insulin sensitivity (HOMA-IR).[16] Briefly, HOMA-%β and HOMA-IR were calculated according to the following equations:
HOMA-%β = [20 × fasting serum insulin (μU/mL)]/[fasting plasma glucose (mg/dL)/18 − 3.5]
HOMA-IR = fasting serum insulin (μU/mL) × fasting plasma glucose (mg/dL)/405
At each OGTT, patients were classified into the following categories of glucose homeostasis: normal glucose tolerance, fasting plasma glucose below 100 mg/dL, and postprandial plasma glucose below 140 mg/dL; DM, fasting plasma glucose above 126 mg/dL or postprandial plasma glucose above 200 mg/dL; and impaired glucose tolerance and/or impaired fasting glucose, subjects who did not satisfy the criterion for either normal glucose tolerance or DM.
2.3. Pituitary function test
Anterior pituitary functions were evaluated both before and after TSA with the combined pituitary function test (CPFT). CPFTs were conducted serially at 6 months, 2 years, and then every 2 years thereafter after TSA. CPFTs were conducted and interpreted as described previously.[13]
2.4. Statistical analyses
Continuous variables are expressed as medians (quartile ranges). Data were analyzed using the SPSS Software Package for Windows (version 20; IBM Corp, Armonk, NY). To compare values between patients with different nadir GH concentrations, the Mann–Whitney U test and the linear-by-linear association test were performed for continuous variables and categorical variables, respectively. The Wilcoxon signed-rank test was used to compare results before and after TSA. All statistical tests were two tailed, and a P value <0.05 was considered to indicate statistical significance.
3. Results
3.1. Baseline characteristics
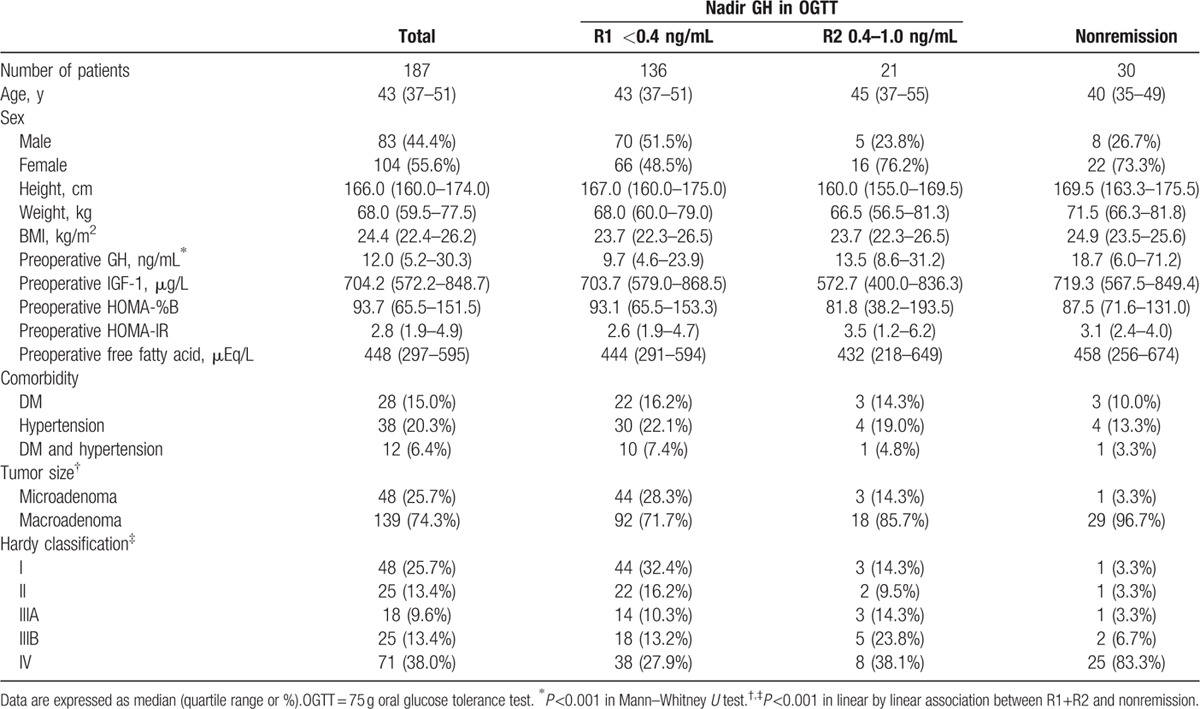
The baseline characteristics of the 187 patients are shown in Table 1. Of the 187 patients, 136 (72.7%; R1) and 157 (84.0%; R1 and R2) achieved biochemical remission as defined by age-matched and sex-matched normal IGF-1 values and 2 different nadir GH cut-offs in the OGTT (0.4 and 1.0 ng/mL, respectively). The median age was 43 (36–52) years, and the median follow-up duration was 2 (1–2.8) years. The sex distribution within the group was 55.6% female and 44.4% male. Postoperative OGTTs were conducted 4 (2–5) times. Before TSA, the median HOMA-%β score was 93.7 (65.5–151.5) and the median HOMA-IR score was 2.8 (1.9–4.9). Of the 187 patients, 28 (15.0%) and 38 (20.3%) had a history of DM and hypertension, respectively. Among the 28 patients with comorbidity of DM, preoperative antihyperglycemic treatment was performed as below; life style modification in 3 (2 in R1 and 1 in nonremitted group), oral antihyperglycemic agents in 20 (16 in R1, 3 in R2, and 1 in nonremitted group), and insulin therapy in 5 patients (4 in R1 and 1 in nonremitted group). The nonremitted patients had significantly higher preoperative GH level and showed higher modified Hardy classification scores. No clinical differences in preoperative periods were observed between R1 and R2 (Table 1).
Table 1.
Clinical manifestations of patients with acromegaly according to biochemical activities at 6 months after transsphenoidal adenomectomy.
3.2. Changes in metabolic parameters after transsphenoidal adenomectomy
Serial OGTTs were performed to evaluate the biochemical status of acromegaly, glucose, insulin, C-peptide, and FFA. In R1, all metabolic parameters tested had improved significantly by 1 week after TSA. These parameters included body weight, body mass index (BMI), fasting glucose, fasting insulin, fasting, and postglucose suppressed FFA during the OGTT (Table 2). Moreover, these improvements were maintained over all subsequent OGTTs. The fasting FFA level decreased abruptly at a week and then slightly increased by 6 months after TSA (452 vs. 172 vs. 344 vs. 350 mEq/L; before, at a week, at 6 months, and at 12 months after TSA, respectively). Postglucose suppressed FFA level during the OGTT maintained significantly lower than that of preoperative OGTT since a week after TSA (80 vs. 44 vs. 39 vs. 34 mEq/L; before, at a week, at 6 months, and at 12 months after TSA, respectively). Furthermore, those values persisted for at least 12 months after TSA (Fig. 1).
Table 2.
Changes of metabolic parameters in cured acromegalic patients according to nadir GH level in oral glucose tolerance for 6 months after transsphenoidal adenomectomy.

Figure 1.
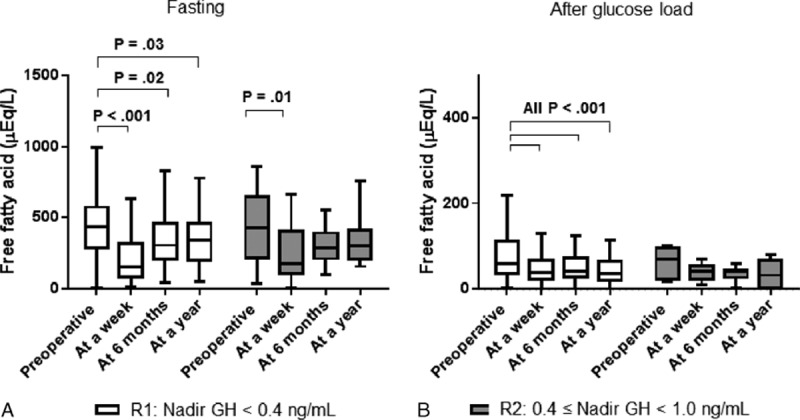
Changes free fatty acids during 75 g glucose tolerance test. During 75 g oral glucose tolerance tests, free fatty acids were measured serially before, at a week, at 6 months, and at 12 months after transsphenodial adenomectomy. At each period, there was no difference in fasting (A) and glucose-suppressed (B) free fatty acids between different cut-off GH values. White box: patients in remission with age-matched and sex-matched normal IGF-1 levels and nadir GH levels below 0.4 ng/mL (R1). Gray box: patients with age-matched and sex-matched normal IGF-1 levels and nadir GH levels ranging from 0.4 to 1.0 ng/mL (R2). Boxes indicate interquartile ranges. Horizontal bars indicate median levels.
The patients of R2 showed similar metabolic parameter changes at 1 week after TSA compared with subjects of R1. Furthermore, no significant differences regarding these metabolic parameters were observed between patients R1 and R2 at 6 months after TSA (Table 2). During serial postoperative OGTTs for 12 months, both FFA levels at basal and 2 h did not differ between R1 and R2 (Fig. 1).
3.3. Glucose homeostasis changes after transsphenoidal adenomectomy
Glucose homeostasis changes were evaluated via OGTT, HOMA-%β, and HOMA-IR scoring. After TSA, most patients exhibited decreased HOMA-%β and HOMA-IR scores. Before TSA, no significant differences were observed in the HOMA-%β and HOMA-IR scores according to acromegaly biochemical status, that is whether the patient achieved remission or not (Table 1).
In R1, the median HOMA-%β score was significantly decreased [from 94.5 (70.7–151.7) to 64.2 (38.7–108.4)] at 1 week after TSA. Furthermore, this decrease in HOMA-%β was maintained throughout the rest of the study (Fig. 2A). Although there was no statistical significance due to the limited number of R2, similar changes of HOMA-%β were also shown in R2.
Figure 2.
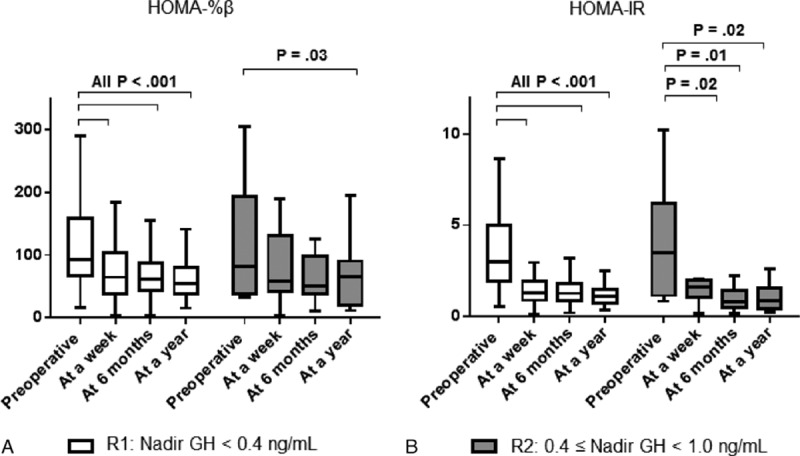
Changes in HOMA scores in patients with acromegaly after transsphenoidal adenomectomy. HOMA-%β (A) and HOMA-IR (B) scores were measured in patients of Group 1 and Group 2 during the 75 g oral glucose tolerance test at 6 months after transsphenoidal adenomectomy. P values were calculated with the Wilcoxon signed rank test after comparing the values before and after transsphenoidal adenomectomy. White box: patients in remission with age-matched and sex-matched normal IGF-1 levels and nadir GH levels below 0.4 ng/mL (R1). Gray box: patients with age-matched and sex-matched normal IGF-1 levels and nadir GH levels ranging from 0.4 to 1.0 ng/mL (R2). Boxes indicate interquartile ranges. Horizontal bars indicate median levels.
The patients of R1 and R2 showed abrupt reduction of their HOMA-IR scores at 1 week after TSA. The mean preoperative HOMA-IR score of R1 was 2.9 (2.0–5.4); this score decreased to 1.3 (0.8–1.9) at 1 week and then to 1.1 (0.7–1.5) at 6 months after TSA. This improvement in HOMA-IR score was maintained at least for 12 months after TSA, at which time the median score remained at 1.0 (0.7–1.5). Similar HOMA-IR changes were also observed in R2 (Fig. 2B).
During the OGTT, patients were classified as normal, IFG/IGT, or DM. Although only 15.0% reported previously diagnosed DM, half of the enrolled patients were categorized as DM through the preoperative OGTT. As shown in the changes of HOMA-IR and other metabolic parameters, the classifications of glucose homeostasis during OGTT improved abruptly after TSA and were maintained thereafter for at least 12 months. Regarding glucose homeostasis in the OGTT, similar patterns of change were observed between R1 and R2 (Fig. 3A and B). Among the 67 patients of R1 with DM in the preoperative OGTT, 30 (45.3%) exhibited improved glucose tolerance at 1 week after TSA.
Figure 3.
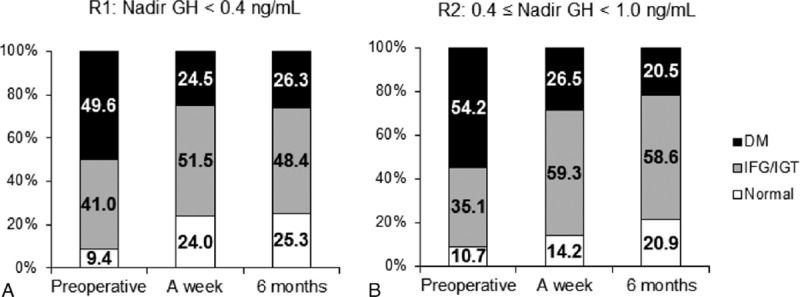
Categorization of glucose homeostasis during the 75 g glucose tolerance test. According to the result of the 75 g oral glucose tolerance test, each patient was classified into one of the following 3 categories: diabetes mellitus (DM), impaired fasting glucose (IFG)/impaired glucose tolerance (IGT), and normal. No significant differences were observed between patients of R1 (A) and R2 (B).
3.4. Effects of each pituitary hormone on metabolic parameters
Hormones in the pituitary axes, including thyroid-stimulating hormone (TSH), gonadotropins, and adrenocorticotropic hormone (ACTH), were evaluated through CPFTs before and serially after TSA. Before TSA, patients with ACTH deficiency had significantly higher HOMA-%β and HOMA-IR scores compared with patients with intact ACTH secretory functions [187.6 (79.5–192.3) vs. 93.2 (63.7–137.7), 4.1 (2.7–6.1) vs. 2.2 (1.8–3.8), respectively]. However, no significant differences in HOMA scores were observed according to the classifications of the deficient pituitary axes after TSA (Fig. 4).
Figure 4.
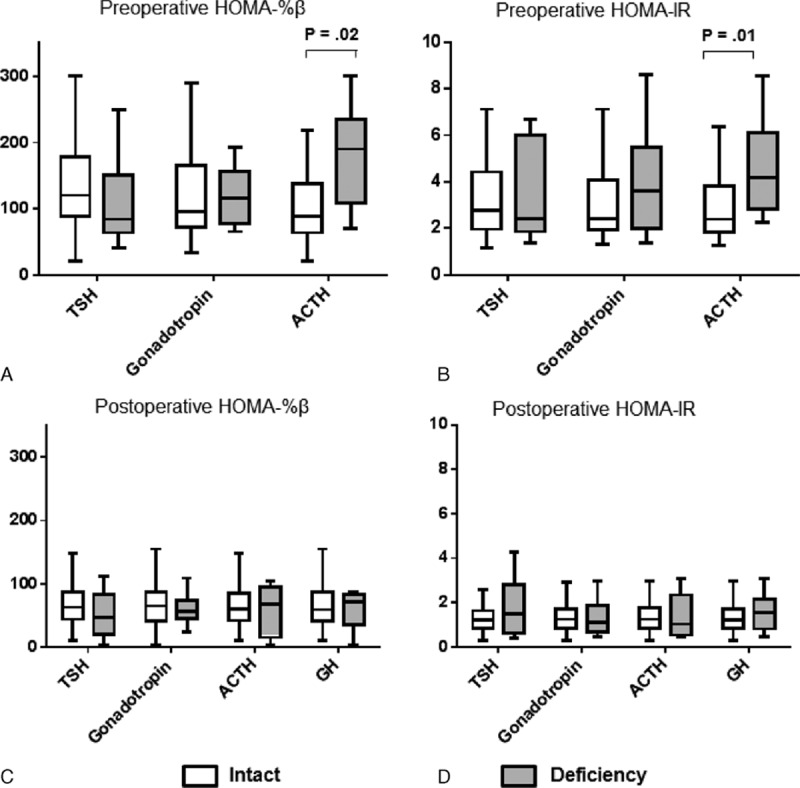
Effect of each pituitary hormone on HOMA scores before and after transsphenoidal adenomectomy. HOMA-%β (A, C) and HOMA-IR (B, D) scores were measured before (A, B) and at 6 months after transsphenoidal adenomectomy (C, D) in patients in remission from acromegaly. P values were calculated with the Mann–Whitney U test. White box: intact secretory function of each hormone. Gray box: deficient secretory function of each hormone. Boxes indicate interquartile ranges. Horizontal bars indicate median levels.
3.5. Body weight changes after transsphenoidal adenomectomy
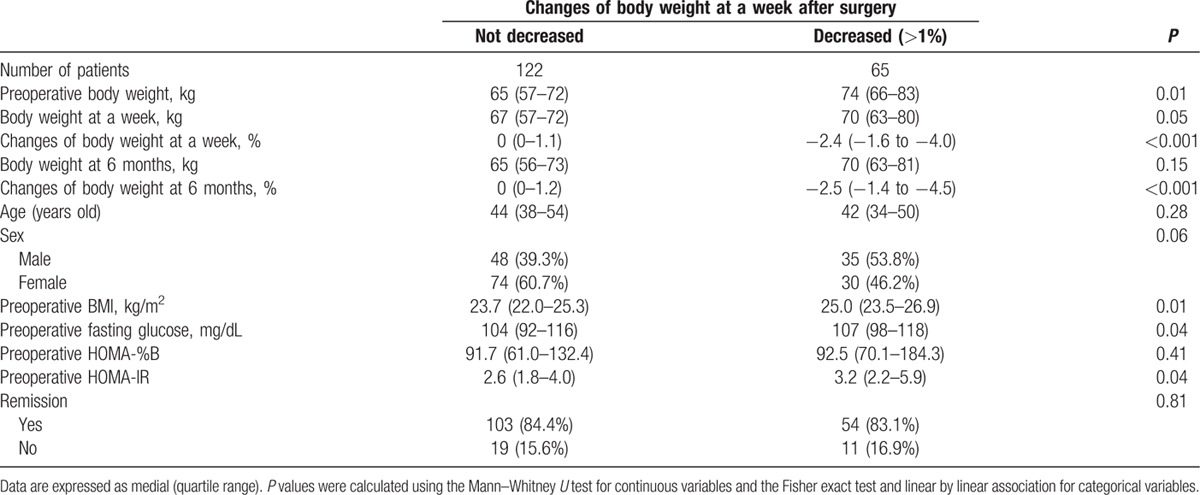
In addition to the metabolic changes, some patients exhibited abrupt changes in body weight by 1 week after TSA. Specifically, 65 (34.8%) of the 187 enrolled patients presented body weight reduction of at least 1% compared with their preoperative body weight (Table 3). The median body weight decrease was 2.4% (1.6–4.0%) at 1 week after TSA; this decreased body weight was maintained throughout the duration of the study. Before TSA, patients with decreased body weight after TSA had significantly greater body weights, BMIs, fasting glucose level, and HOMA-IR scores. However, no significant differences in age, sex, remission rate, and incidence of preoperative comorbidities (including DM and hypertension) were observed in patients with decreased body weight after TSA. In patients with body weight reduction above 1% at a week after TSA, metabolic parameters including postoperative body weights, BMIs, and HOMA-IR became similar to those of the others at 6 months after TSA. Sixty-three of 65 patients (97%) with body weight reduction at a week after TSA maintained same body weight for up to 12 months. In contrast, only 17 of 122 patients (14%) without weight loss at a week after TSA experienced long-term reduction of body weight during 12 months after TSA.
Table 3.
Clinical factors predicting body weight changes after transsphenoidal adenomectomy.
4. Discussion
In this study, we applied different cut-off nadir GH levels during OGTT and evaluated the changes in metabolic parameters in patients with normalized IGF-1 levels after TSA. We analyzed several metabolic parameters during the OGTT, including glucose, FFA, and insulin. The major findings of this study included: no significant difference in the change of any metabolic parameter was observed for nadir GH cut-offs between 0.4 and 1.0 ng/mL; metabolic parameters exhibited abrupt improvements by 1 week after TSA and these improvements were maintained for the duration of the study; and significant body weight reductions after TSA were mainly observed in obese patients with higher HOMA scores.
Metabolic syndrome is a leading cause of death in patients with acromegaly.[7] Excess secretion of GH and IGF-1 has been shown to be associated with insulin resistance in patients with acromegaly.[7,8,17] Furthermore, patients with active acromegaly have been shown to have elevated serum triglyceride, low-density lipoprotein-cholesterol, apoB, and FFA levels.[18] Even during medical treatment for acromegaly, somatostatin analogues and GH receptor antagonists influence glucose intolerance and lipid metabolism.[19] However, few studies have evaluated the effects of surgical resection of the GH secreting pituitary adenoma on metabolic parameter changes. In 1992, M⊘ller et al[20] evaluated metabolic parameters in 7 patients with acromegaly at 1 month prior to and again at 2 months after successful pituitary adenomectomy. They found that patients with active acromegaly exhibited increased serum levels of FFA and other lipid intermediates, reduced forearm uptake of glucose, and increased hepatic glucose production; moreover, these findings were reversed by surgical resection. Serri et al.[21] analyzed 34 patients in remission who exhibited improved glucose tolerance after TSA. However, they failed to demonstrate the serial changes in metabolic parameters after surgical resection.
In this study, we evaluated the changes of metabolic parameters in 187 patients with acromegaly. To accurately evaluate the biochemical status of acromegaly, it is essential to determine the nadir GH level in the OGTT and the IGF-1 level. Previously, we demonstrated that recovery of biochemical activities developed early at a week after TSA and predicted long-term remission in patients with acromegaly (sensitivity 81.7% and specificity 95.1%).[14] In this study, OGTTs were conducted before TSA and then again at 1 week after TSA. Follow-up OGTTs were then performed at 6 month intervals thereafter. Concerning the role of TSA on metabolic changes, we also reported that immediate postoperative changes of GH level during a week predicted the GH deficiency in surgically cured patients with acromegaly.[13] In the current study, all patients exhibited immediate improvement of metabolic parameters by 1 week after TSA. Specifically, body weight, BMI, fasting glucose level, fasting insulin level, fasting FFA level, and postglucose suppressed FFA all exhibited significant changes immediately after TSA. Among these parameters, abrupt reduction of the fasting FFA level was slightly restored at 6 months after TSA and was maintained at these levels. GH and IGF-1 have opposite role in lipid metabolism.[22,23] Although GH excess itself has been shown to stimulate lipid utilization and produce FFA,[24] IGF-1 reduces the circulating FFA in human.[23] On the other hand, GH level decreases abruptly within a few hours and IGF-1 falls slowly during several weeks after TSA.[14] Due to the difference of metabolic effect and time to fall between GH and IGF-1, changes of FFA might be slightly restored at 6 months after TSA. In serial OGTTs, both the fasting and glucose-suppressed FFAs were evaluated for 2 hours. Several studies suggested that glucose-suppressed FFAs present the superior markers to the fasting FFAs in determining the metabolic status.[25] Furthermore, glucose-suppressed FFA presented close correlation with insulin resistance in metabolic syndrome.[26] The patients of R1 and R2 showed identical values in glucose-suppressed FFA levels and maintained for 12 months after TSA (Fig. 1). Among the 187 enrolled patients, 143 patients had been followed up for more than 2 years after TSA. Their metabolic parameters at 2 years had persisted comparable to those at 6 months after TSA.
To minimize the complications associated with GH excess, many experts have consistently suggested lower GH and IGF-1 levels for defining biochemical remission of acromegaly.[11,12] However, excessive suppression of GH in patients with acromegaly is also associated with GH deficiency.[13] In patients with acromegaly, both GH excess and deficiency induce insulin resistance and metabolic impairment.[27] In this study, we compared various metabolic parameters according to 2 different nadir GH cut-offs during the OGTT, 0.4 ng/mL, and 1.0 ng/mL. Although only a limited number of patients exhibited a nadir GH level between 0.4 and 1.0 ng/mL (R2), no significant differences in the postoperative changes of metabolic parameters were observed between the 2 different cut-offs (R1 versus R2). Insulin resistance analysis revealed that the HOMA-IR score was slightly more improved in patients of R2 compared with subjects of R1 (Fig. 1B).
In patients with acromegaly, body weight is increased due to skeletal enlargement and water retention.[8] Moreover, metabolic syndrome and glucose intolerance are more frequent in female patients with acromegaly.[5] However, no significant differences were observed between male and female patients in the present study. Although body weight has been reported to be increased after TSA compared with values before TSA,[28] most patients did not experience weight gain in the present study. Moreover, 65 of the 187 patients had lost more than 1% of their body weight by 1 week after TSA. Furthermore, most patients maintained their new body weights. Interestingly, more obese patients exhibited greater reductions in body weight after TSA. The discrepancy regarding body weight changes after TSA compared with the previous study might be due to race differences and/or the preoperative metabolic conditions of the 2 study populations. The patients in the present study were of a single Asian race. As shown in Table 1, the prevalence of past DM and hypertension were low compared with other studies. Furthermore, most of the enrolled patients had body weights and BMIs in the normal range. Although Reyes-Vidal et al.[28] reported the increased body weight in surgically cured acromegalic patients whose body weight was 90.4 ± 3.4 kg, body weight of subjects was 68.0 (59.5–77.5) kg in this study. Since the majority of the enrolled patients were not obese before TSA, the postoperative changes of metabolic parameters could be influenced by GH itself, rather than other complicated organs involving insulin resistance such as adipose tissue and liver.
Hypopituitarism is an important risk factor for metabolic impairments and glucose intolerance. Although we found that patients with preoperative ACTH deficiencies had even unfavorable HOMA scores before TSA, no significant differences were observed regarding metabolic parameter changes with respect to the classification of the postoperative deficiency of each pituitary axis. Even GH deficiency did not have the significant difference on development of metabolic parameter changes. Since the secretory functions of each pituitary axis were evaluated relatively early (6 months after TSA), hypopituitarism might not have any effect on metabolic parameters.
The limitation of this study is the low number of R2, which were only 21 patients. However, logistic analysis including body weight, BMI, glucose, insulin, and FFA during OGTT also revealed that there was no difference between R1 and R2. Furthermore, degree of improvement in metabolic parameters before and after TSA was also comparable between R1 and R2. Although enough statistical power was not achieved due to the small number of R2, this study demonstrated the first possible evidence that no differences in metabolic parameters were observed between each cut-off of nadir GH during OGTT. Lastly, antihyperglycemic agents might influence the metabolic parameters during OGTT before and after TSA. However, only 4 of 136 (2.9%) patients in R1 and none in R2 received insulin therapy before TSA, and only 1 subject in R1 maintained the insulin at 6 months after TSA. Furthermore, most of patients taking oral antihyperglycemic agents before TSA experienced the reduction (3 of 16 in R1 and 2 of 3 diabetic patients in R2) or cessation (12 of 16 in R1 and 1 of 3 diabetic patients in R2) of medications at 6 months after TSA.
In conclusion, this is the first study to present clinical information regarding serial changes of metabolic parameters in patients with acromegaly who were cured by TSA. Our study is also the first to present this information according to different nadir GH cut-offs during the OGTT. Although most guidelines propose that relatively low GH levels should be used to define biochemical remission in patients with acromegaly, these data indicate that the different cut-offs are not associated with any significant differences, at least concerning the metabolic parameters investigated here. The cut-offs of nadir GH level 0.4 ng/mL during OGTT were not superior to 1.0 ng/mL in predicting better improvement of metabolic parameters in acromegalic patients. To determine the optimal biochemical targets for recovery from GH excess and for normalized metabolic parameters, future studies with large populations and long-term follow-up durations are required.
Acknowledgments
We appreciate Juyoon Park, RN, MPH, OCN, Hae Won Kim, RN, Eun Sook Kim, RN, Min Kyeong Jang, RN, Sung Ja Kang, RN, and Bok Soon Lee, RN, Pituitary Tumor Clinic, and Soo Yeon Choi, MPH, Department of Medical Recording, for their tremendous effort in performing the pituitary function tests and data acquisition for such a long follow-up duration.
Footnotes
Abbreviations: ACTH = adrenocorticotropic hormone, BMI = body mass index, CPFT = combined pituitary function test, CV = coefficient of variation, DM = diabetes mellitus, FFA = free fatty acid, GH = growth hormone, IGF-1 = insulin like growth factor-1, OGTT = oral glucose tolerance test, R1 = remission 1, R2 = remission 2, TSA = transsphenoidal adenomectomy, TSH = thyroid-stimulating hormone, WHO = World Health Organization.
This study was supported by a faculty research grant of Yonsei University College of Medicine and the “Y. Jacobs Young Research Award” for (6-2015-0067).
The authors have no conflicts of interest to disclose.
References
- [1].Melmed S. Medical progress: acromegaly. N Engl J Med 2006;355:2558–73. [DOI] [PubMed] [Google Scholar]
- [2].Holdaway IM, Rajasoorya RC, Gamble GD. Factors influencing mortality in acromegaly. J Clin Endocrinol Metab 2004;89:667–74. [DOI] [PubMed] [Google Scholar]
- [3].Kasayama S, Otsuki M, Takagi M, et al. Impaired beta-cell function in the presence of reduced insulin sensitivity determines glucose tolerance status in acromegalic patients. Clin Endocrinol (Oxf) 2000;52:549–55. [DOI] [PubMed] [Google Scholar]
- [4].M⊘ller N, J⊘rgensen JO. Effects of growth hormone on glucose, lipid, and protein metabolism in human subjects. Endocr Rev 2009;30:152–77. [DOI] [PubMed] [Google Scholar]
- [5].Ciresi A, Amato MC, Pivonello R, et al. The metabolic profile in active acromegaly is gender-specific. J Clin Endocrinol Metab 2013;98:E51–59. [DOI] [PubMed] [Google Scholar]
- [6].Moses AC, Young SC, Morrow LA, et al. Recombinant human insulin-like growth factor I increases insulin sensitivity and improves glycemic control in type II diabetes. Diabetes 1996;45:91–100. [DOI] [PubMed] [Google Scholar]
- [7].Mestron A, Webb SM, Astorga R, et al. Epidemiology, clinical characteristics, outcome, morbidity and mortality in acromegaly based on the Spanish Acromegaly Registry (Registro Espanol de Acromegalia, REA). Eur J Endocrinol 2004;151:439–46. [DOI] [PubMed] [Google Scholar]
- [8].Ezzat S, Forster MJ, Berchtold P, et al. Acromegaly. Clinical and biochemical features in 500 patients. Medicine (Baltimore) 1994;73:233–40. [PubMed] [Google Scholar]
- [9].Kreze A, Kreze-Spirova E, Mikulecky M. Risk factors for glucose intolerance in active acromegaly. Braz J Med Biol Res 2001;34:1429–33. [DOI] [PubMed] [Google Scholar]
- [10].Colao A, Ferone D, Marzullo P, Lombardi G. Systemic complications of acromegaly: epidemiology, pathogenesis, and management. Endocr Rev 2004;25:102–52. [DOI] [PubMed] [Google Scholar]
- [11].Katznelson L, Laws ER, Melmed S, et al. Acromegaly: an endocrine society clinical practice guideline. J Clin Endocrinol Metab 2014;99:3933–51. [DOI] [PubMed] [Google Scholar]
- [12].Giustina A, Chanson P, Bronstein MD, et al. A consensus on criteria for cure of acromegaly. J Clin Endocrinol Metab 2010;95:3141–8. [DOI] [PubMed] [Google Scholar]
- [13].Ku CR, Hong JW, Kim EH, Lee EJ. Clinical predictors of GH deficiency in surgically cured acromegalic patients. Eur J Endocrinol 2014;171:379–87. [DOI] [PubMed] [Google Scholar]
- [14].Kim EH, Oh MC, Lee EJ, Kim SH. Predicting long-term remission by measuring immediate postoperative growth hormone levels and oral glucose tolerance test in acromegaly. Neurosurgery 2012;70:1106–13. [DOI] [PubMed] [Google Scholar]
- [15].Ku CR, Kim EH, Oh MC, et al. Surgical and endocrinological outcomes in the treatment of growth hormone-secreting pituitary adenomas according to the shift of surgical paradigm. Neurosurgery 2012;71(2 Suppl Operative):ons192–203. [DOI] [PubMed] [Google Scholar]
- [16].Matthews DR, Hosker JP, Rudenski AS, et al. Homeostasis model assessment: insulin resistance and beta-cell function from fasting plasma glucose and insulin concentrations in man. Diabetologia 1985;28:412–9. [DOI] [PubMed] [Google Scholar]
- [17].Barrande G, Pittino-Lungo M, Coste J, et al. Hormonal and metabolic effects of radiotherapy in acromegaly: long-term results in 128 patients followed in a single center. J Clin Endocrinol Metab 2000;85:3779–85. [DOI] [PubMed] [Google Scholar]
- [18].Boero L, Manavela M, Meroño T, et al. GH levels and insulin sensitivity are differently associated with biomarkers of cardiovascular disease in active acromegaly. Clin Endocrinol (Oxf) 2012;77:579–85. [DOI] [PubMed] [Google Scholar]
- [19].Madsen M, Krusenstjerna-Hafstr⊘m T, M⊘ller L, et al. Fat content in liver and skeletal muscle changes in a reciprocal manner in patients with acromegaly during combination therapy with a somatostatin analog and a GH receptor antagonist: a randomized clinical trial. J Clin Endocrinol Metab 2012;97:1227–35. [DOI] [PubMed] [Google Scholar]
- [20].M⊘ller N, Schmitz O, J⊘orgensen JO, et al. Basal- and insulin-stimulated substrate metabolism in patients with active acromegaly before and after adenomectomy. J Clin Endocrinol Metab 1992;74:1012–9. [DOI] [PubMed] [Google Scholar]
- [21].Serri O, Beauregard C, Hardy J. Long-term biochemical status and disease-related morbidity in 53 postoperative patients with acromegaly. J Clin Endocrinol Metab 2004;89:658–61. [DOI] [PubMed] [Google Scholar]
- [22].Gibney J, Healy ML, Stolinski M, et al. Effect of growth hormone (GH) on glycerol and free fatty acid metabolism during exhaustive exercise in GH-deficient adults. J Clin Endocrinol Metab 2003;88:1792–7. [DOI] [PubMed] [Google Scholar]
- [23].García Fernández M, Delgado G, Puche JE, et al. Low doses of insulin-like growth factor I improve insulin resistance, lipid metabolism, and oxidative damage in aging rats. Endocrinology 2008;149:2433–42. [DOI] [PubMed] [Google Scholar]
- [24].N⊘rrelund H, Djurhuus C, J⊘rgensen JO, et al. Effects of GH on urea, glucose and lipid metabolism, and insulin sensitivity during fasting in GH-deficient patients. Am J Physiol Endocrinol Metab 2003;285:E737–743. [DOI] [PubMed] [Google Scholar]
- [25].Zhao X, Peter A, Fritsche J, et al. Changes of the plasma metabolome during an oral glucose tolerance test: is there more than glucose to look at? Am J Physiol Endocrinol Metab 2009;296:E384–393. [DOI] [PubMed] [Google Scholar]
- [26].Wajchenberg BL, Giannella Neto D, da Silva ME, Santos RF. Depot-specific hormonal characteristics of subcutaneous and visceral adipose tissue and their relation to the metabolic syndrome. Horm Metab Res 2002;34:616–21. [DOI] [PubMed] [Google Scholar]
- [27].Lin E, Wexler TL, Nachtigall L, et al. Effects of growth hormone deficiency on body composition and biomarkers of cardiovascular risk after definitive therapy for acromegaly. Clin Endocrinol (Oxf) 2012;77:430–8. [DOI] [PMC free article] [PubMed] [Google Scholar]
- [28].Reyes-Vidal C, Fernandez JC, Bruce JN, et al. Prospective study of surgical treatment of acromegaly: effects on ghrelin, weight, adiposity, and markers of CV risk. J Clin Endocrinol Metab 2014;99:4124–32. [DOI] [PMC free article] [PubMed] [Google Scholar]


