Abstract
Signs and symptoms of temporomandibular joint (TMJ) dysfunction are commonly found in patients with facial asymmetry. Previous studies on the TMJ position have been limited to 2-dimensional (2D) radiographs, computed tomography (CT), or cone-beam computed tomography (CBCT). The purpose of this study was to compare the differences of TMJ position by using 2D CBCT and 3D model measurement methods. In addition, the differences of TMJ positions between patients with facial asymmetry and asymptomatic subjects were investigated.
We prospectively recruited 5 patients (cases, mean age, 24.8 ± 2.9 years) diagnosed with facial asymmetry and 5 asymptomatic subjects (controls, mean age, 26 ± 1.2 years). The TMJ spaces, condylar and ramus angles were assessed by using 2D and 3D methods. The 3D models of mandible, maxilla, and teeth were reconstructed with the 3D image software. The variables in each group were assessed by t-test and the level of significance was 0.05.
There was a significant difference in the horizontal condylar angle (HCA), coronal condylar angle (CCA), sagittal ramus angle (SRA), medial joint space (MJS), lateral joint space (LJS), superior joint space (SJS), and anterior joint space (AJS) measured in the 2D CBCT and in the 3D models (P < 0.05). The case group had significantly smaller SJS compared to the controls on both nondeviation side (P = 0.009) and deviation side (P = 0.004). In the case group, the nondeviation SRA was significantly larger than the deviation side (P = 0.009). There was no significant difference in the coronal condylar width (CCW) in either group. In addition, the anterior disc displacement (ADD) was more likely to occur on the deviated side in the case group.
In conclusion, the 3D measurement method is more accurate and effective for clinicians to investigate the morphology of TMJ than the 2D method.
INTRODUCTION
Facial asymmetry is one of the most common types of jaw deformity.1 It was reported that the prevalence of facial asymmetry varied from 8.7% to 23.3%.1,2 The prevalence of facial asymmetry was 6.3% to 7.5% for Chinese.3,4 Temporomandibular joint (TMJ) symptoms and internal derangement are commonly found in patients with facial asymmetry.5–7 The positions of the mandibular condyles, disc, and glenoid fossa in patients with facial asymmetry were proven to be different from those in asymptomatic subjects.6,7 These differences can cause joint pain, temporomandibular disorders (TMD), disc displacement, and disc perforation.7–9 The morphologic study of TMJ in patients with facial asymmetry can contribute to the existing knowledge and management strategies of TMJ diseases.7
Many studies have investigated the TMJ position of patients with facial asymmetry using different measurement methods.10–18 Cephalometric radiographs were used to measure the TMJ positions of Malays and Chinese with facial asymmetry for assessing its impact on the TMD.10 Cephalometric radiographs were also used to evaluate the morphological condylar changes after orthognathic surgery.11 Meanwhile, computed tomography (CT) could be used to examine the morphological aspects of TMJ, to investigate the position of the mandibular canal, and to analyze the influences of complicated mandible reconstruction on a patient's condylar position and TMJ function.12–14 In addition, several studies have reported that high accuracy was obtained when using cone-beam computed tomography (CBCT) to evaluate the TMJ position. CBCT was used to measure the volume, metrical size, position of each condyle sample, and the thickness of the roof of the glenoid fossa, and to evaluation the changes of the condylar axis and the anteroposterior condylar position relative to the glenoid fossa after surgery.17,18 Magnetic resonance imaging (MRI) has also been used to assess the relationship of the articular disc and condyle, and to examine the kinematics of the structures of the TMJ under mastication.15,16
Existing studies have been limited to 2-dimensional (2D) assessments of the TMJ; however, it has been shown that 2D methods provide less accuracy than 3-dimensional (3D) methods.19,20 The aim of this study was to compare the differences of the TMJ position by using 2D CBCT and 3D models measuring methods and to investigate the differences in TMJ morphology between patients with facial asymmetry and asymptomatic subjects.
MATERIALS AND METHODS
Subjects and Data Acquisition
Five patients diagnosed with facial asymmetry were designated as cases (3 women and 2 men, 24.8 ± 2.9 years old) and 5 asymptomatic subjects, designated as controls (3 women and 2 men, 26.0 ± 1.2 years old), were prospectively recruited for this study, with IRB approval. The TMJ clicking sound and joint pain were found in the 5 patients with facial asymmetry. Informed consent was obtained from each subject before the experiment. The patients and asymptomatic subjects were identified and recruited by a single oral surgeon in the Department of Oral and Maxillofacial Surgery, Affiliated Hospital of Stomatology, Chongqing Medical University. The inclusion criteria of patients were as follows: healthy physical condition, the deviations from the facial midline were >5 mm, TMJ clicking sound, and joint pain with no prior TMJ-related procedures. The inclusion criteria of asymptomatic subjects were as follows: healthy physical condition, no facial asymmetry, no TMD symptoms, and no degenerative joint disease.
CBCT for all patients was performed at the Affiliated Hospital of Stomatology, Chongqing Medical University. The maxilla and mandible were scanned using a CBCT machine (Imaging Sciences International Inc. Hatfield) with a complete head view. Each CBCT scan consisted of a total amount of 290 to 330 images with slice thicknesses of 0.4 mm. The CBCT data was reformatted into Digital Imaging and Communications in Medicine (DICOM) format.
3D Modeling
The cortical bone, cancellous bone, and teeth were separated in MIMICS (Materialise, Leuven, Belgium) according to the Hounsfield units (HU). The boundaries of the regions of the mandible, maxilla, and teeth were accurately distinguished on each slice of CBCT. Subsequently the 3D models of the mandible, maxilla, and teeth were constructed in MIMICS (Figure 1).
FIGURE 1.
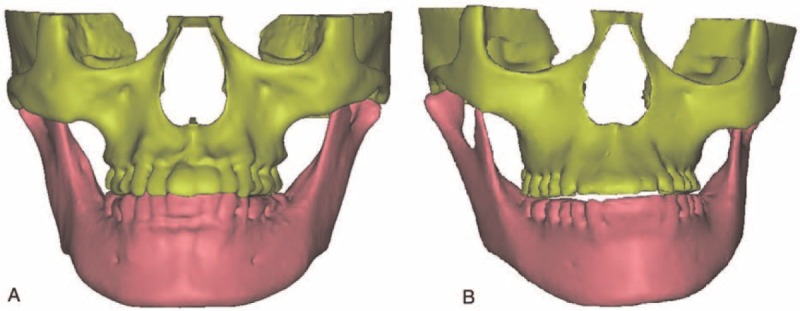
The 3D models of mandible, maxilla, and teeth of (A) asymptomatic subject, (B) patient with facial asymmetry. 3D = three-dimensional.
2D and 3D TMJ Analysis
In this study, the horizontal condylar angle (HCA), coronal condylar angle (CCA), sagittal ramus angle (SRA), coronal condylar width (CCW), medial joint space (MJS), lateral joint space (LJS), superior joint space (SJS), anterior joint space (AJS), and posterior joint space (PJS) were measured in the 2D CBCT images, as well as in the 3D reconstructed models. The 2D CBCT images were measured in accordance with the method reported by Ueki et al.7 A 2D axial slice demonstrating the HCA was selected for each patient (Figure 2A). The HCA was determined as the angle between the RL line and the condylar long axis (the line between the medial and lateral points).7 Using 2D coronal slices, measurements of the MJS, SJS, LJS, CCA, and CCW were derived from the condyle and glenoid fossa (Figure 3A and B). The MJS, SJS, and LJS were determined as the distance between the most medial point, superior point, and lateral point of the condyle and the articular fossa, respectively.7 The CCA was determined as the angle between the Frankfurt horizontal (FH) plane and the condylar long axis.7 The 2D sagittal slices allowed measurements of the SRA, PJS, and AJS (Figure 4A and B). The SRA was determined as the angle between the FH plane and the tangential line to the posterior outline of ramus.7 The PJS and AJS were determined as the distance parallel to the FH plane between the posterior point and anterior point of the condyle in the articular fossa and the articular eminence outline, respectively.7 In addition, these 9 parameters were also measured in the 3D reconstructed models (Figures 2–4). All samples were re-evaluated thrice within a 1 week interval by 3 authors of this study. The correlation coefficients of the results in each measurement were >0.95; therefore, the repeatability of the measurements was acceptable.
FIGURE 2.
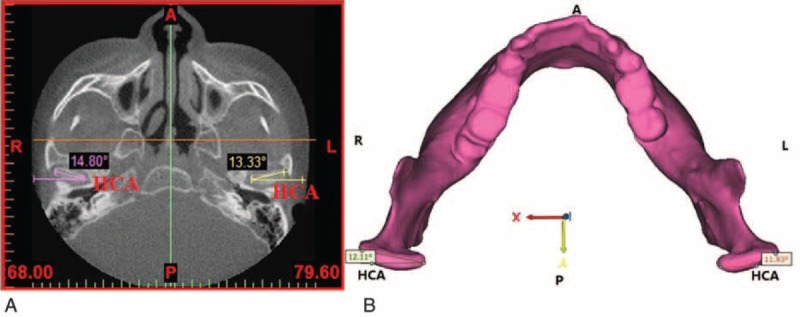
Measurements of the HCA: (A) on the horizontal CBCT image; (B) in the 3D model. 3D = three-dimensional; A = the anterior direction; CBCT = cone-beam computed tomography; HCA = horizontal condylar angle; L = the left direction; P = the posterior direction; R = the right direction.
FIGURE 3.
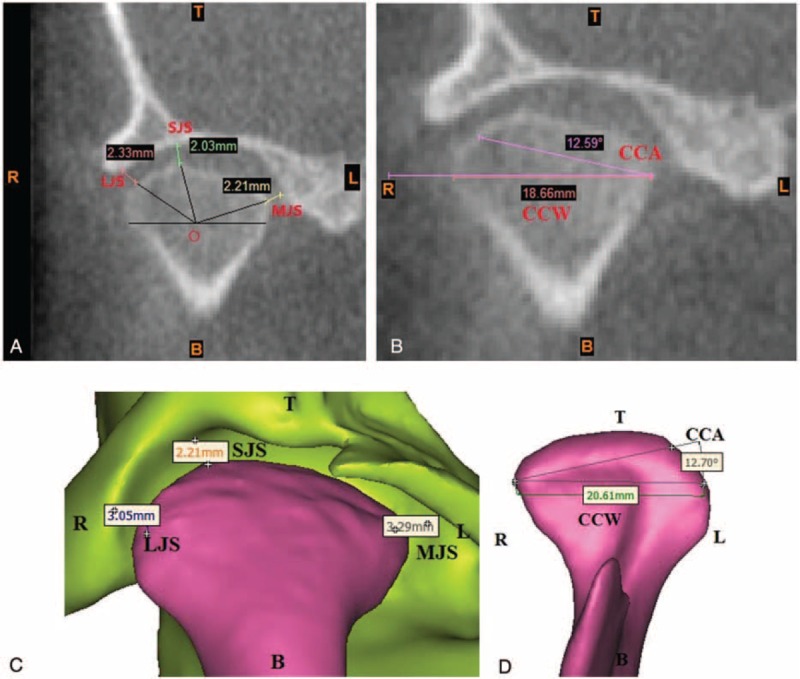
Measurements of MJS, SJS, LJS, CCA, and CCW: (A and B) on the coronal CBCT image; (C and D) in the 3D model. 3D = three-dimensional; B = the bottom direction; CBCT = cone-beam computed tomography; CCA = coronal condylar angle; CCW = coronal condylar width; L = the left direction; LJS = lateral joint space; MJS = medial joint space; R = the right direction; SJS = superior joint space; T = the top direction.
FIGURE 4.
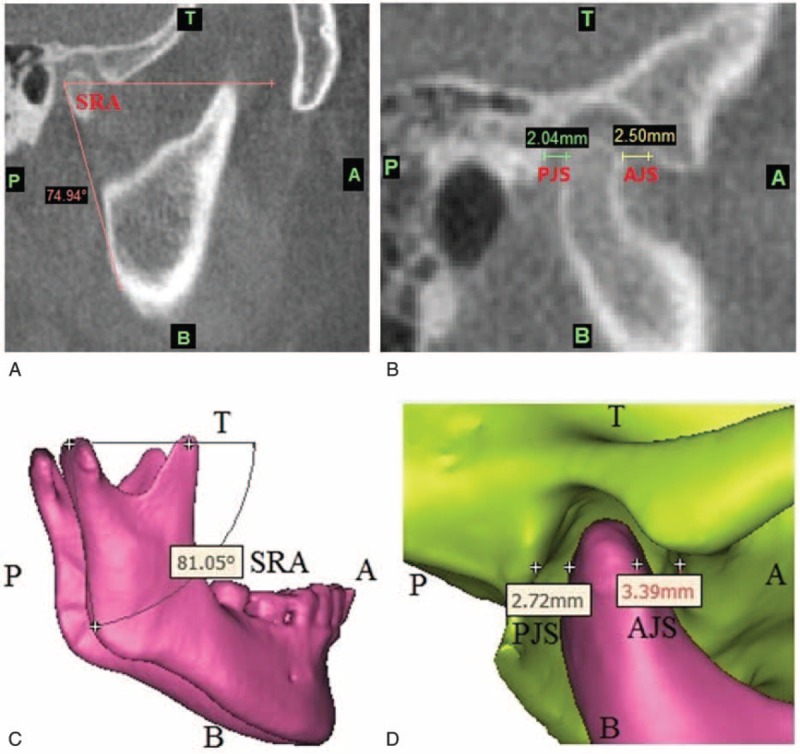
Measurements of SRA, PJS, and AJS: (A and B) on the sagittal CBCT image; (C and D) in the 3D model. 3D = three-dimensional; A = the anterior direction; AJS = anterior joint space; B = the bottom direction; CBCT = cone-beam computed tomography; P = the posterior direction; PJS = posterior joint space; SRA = sagittal ramus angle; T = the top direction.
Statistical Analysis
2D and 3D TMJ morphological measurements were analyzed for differences using Student's t test for each patient to determine the accuracy of the measurements. In addition, we performed comparisons: (1) between the cases and controls, (2) between the deviation and nondeviation sides for asymmetric TMJ in the case group, and (3) between the left and right sides for symmetric TMJ in the control group. The t test was performed and statistical significance was achieved when P < 0.05. SPSS 20.0 (SPSS, Inc, Chicago, IL) was used for the analysis.
RESULTS
The mandibles of all the patients with facial asymmetry deviated toward the left, shown as Figure 1B. The right and left sides were defined as the deviation side and the nondeviation side, respectively.
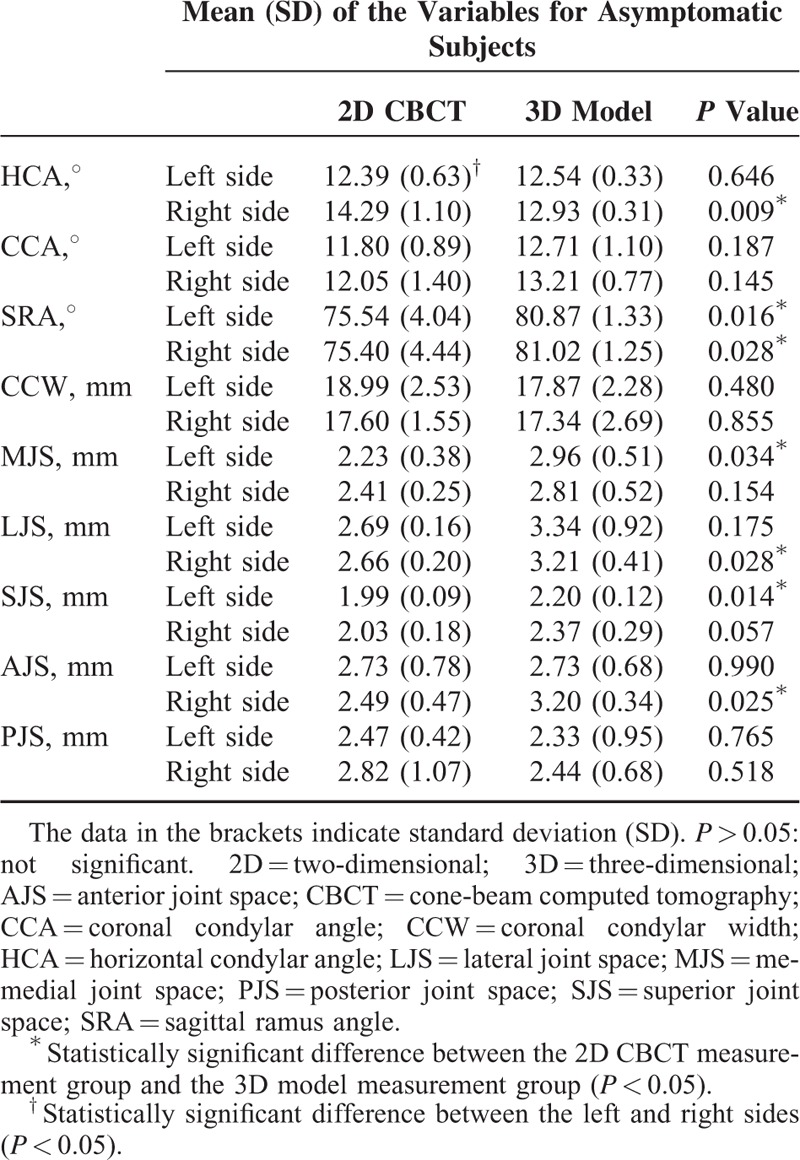
For the asymptomatic subjects, the HCA measured from the 2D CBCT images showed statistical significance between the left and right sides. However, all the 9 parameters measured from 3D models indicated no statistical significance between the left and right sides. The HCA, SRA, MJS, LJS, SJS, and AJS in the 2D CBCT images and 3D models were found to be statistically significant (Table 1). The SRA, MJS, LJS, SJS, and AJS in the 2D group were significantly smaller than in the 3D group (Table 1). However, the HCA on the right side in the 2D group was significantly larger than that in the 3D group (P = 0.009).
TABLE 1.
Mean (SD) of the Variables for Asymptomatic Subjects Measured in the 2D CBCT and 3D Model
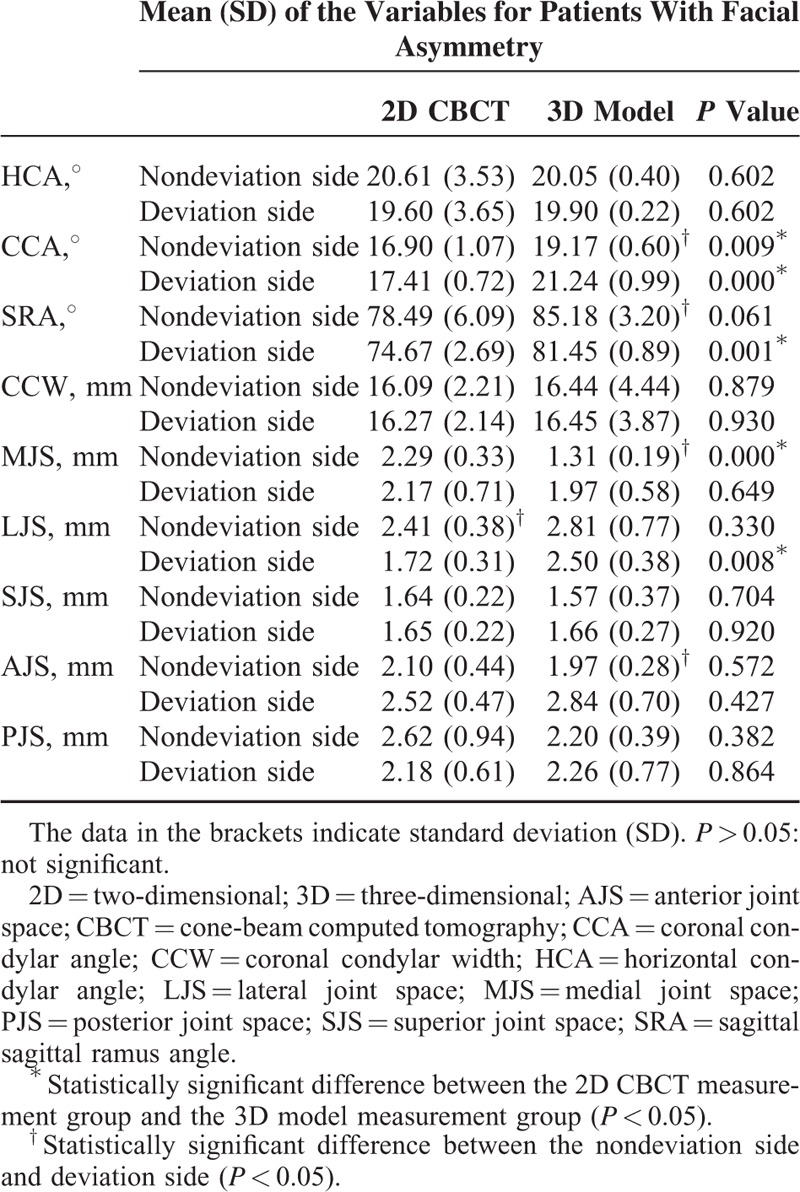
For the patients with facial asymmetry, the LJS measured from the 2D CBCT images showed statistical significance between the left and right sides. However, the CCA, SRA, MJS, and AJS measured from 3D models had statistical significance between the left and right sides. The CCA in the 2D group was significantly smaller than that in the 3D group on the nondeviation side (P = 0.009) and the deviation side (P = 0.000). The CCA of patients with facial asymmetry were also observably larger than for asymptomatic subjects (Tables 1 and 2). The SRA and LJS on the deviation side in the 2D group were significantly smaller than in the 3D group (Table 2). The MJS on the nondeviation side in the 2D group was significantly larger than that in the 3D group (P = 0.000). The LJS and SJS of patients with facial asymmetry were observably larger than for asymptomatic subjects (Tables 1 and 2).
TABLE 2.
Mean (SD) of the Variables for Patients With Facial Asymmetry Measured in the 2D CBCT and 3D Model
The HCA and CCA in the patients group were significantly larger than those in the asymptomatic subjects group, no matter on the nondeviation/left side or the deviation/right side (Table 3). The SRA in the patients group was also significantly larger than that in the control group on the nondeviation/left side (P = 0.024), but there was no significant difference for the SRA in the 2 groups on the deviation/right side (Table 3). Meanwhile, the MJS and SJS in the patients group were significantly smaller than those in the control group on both sides (Table 3). Moreover, the LJS on the deviation/right side in the patients group was also significantly smaller than that in the asymptomatic subjects group (P = 0.022). The other variables were not significantly different in the 2 groups (Table 3).
TABLE 3.
Mean (SD) of the Variables for Patients With Facial Asymmetry and Asymptomatic Subjects Measured in the 3D Model
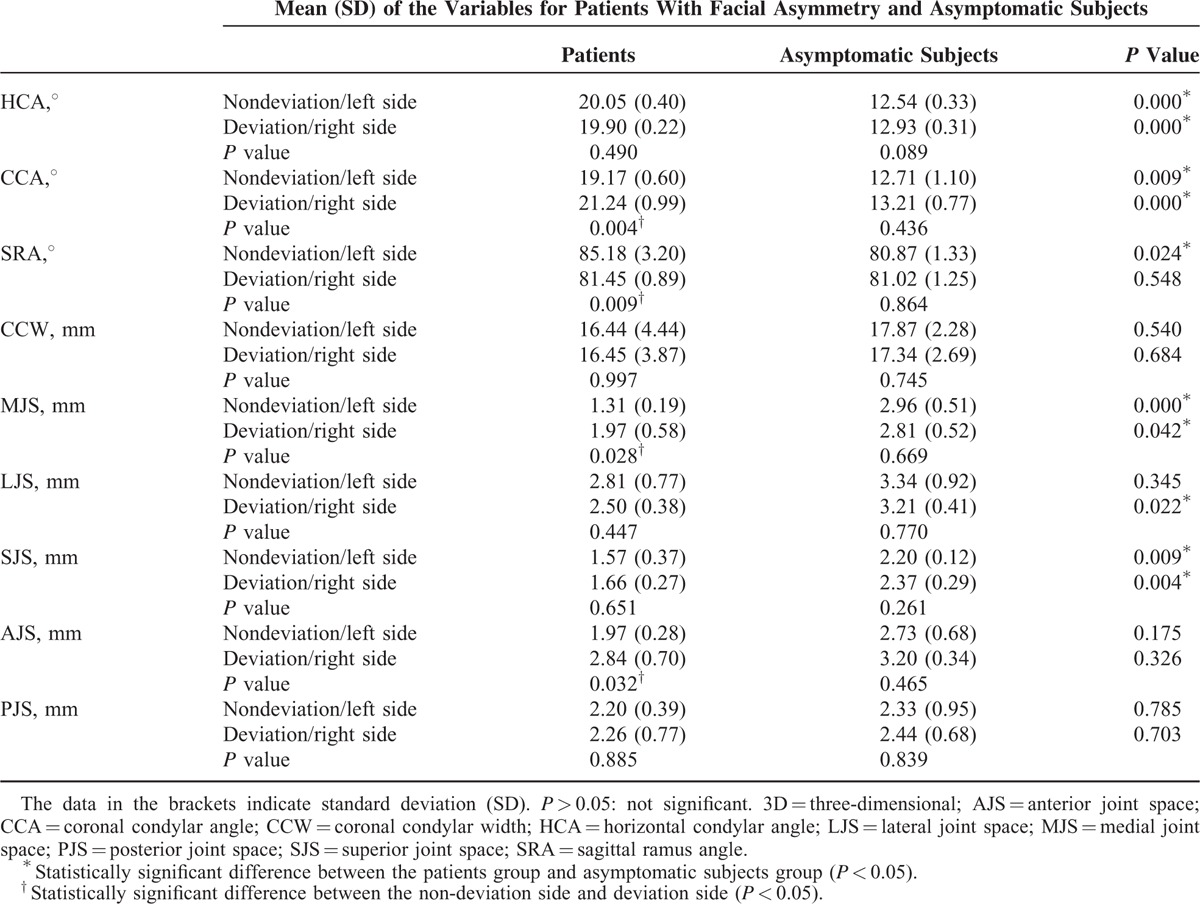
In the measurements from the 3D models, the CCA, SRA, MJS, and AJS for the patients with facial asymmetry had statistical significance between the left and right sides, but all the 9 parameters for the asymptomatic subjects had no statistical significance between the left and right sides. For the patients with facial asymmetry, the CCA, MJS, and AJS on the nondeviation side were significantly smaller than those on the deviation side (Table 3). However, the SRA on the nondeviation side was significantly larger than that on the deviation side (P = 0.009).
DISCUSSION
Comparison of the TMJ position between the 2D CBCT slices and the 3D space models has not been studied previously. The measurement method on the 2D CBCT scans has been validated in the literature.7,21 Goncalves et al and Yang and Hwang measured the changes in the condylar position after SSRO in 3D space.6,22 However the changes in disc, glenoid fossa, and articular eminence were not measured. This is the first study to investigate the differences of the TMJ position between the patients with facial asymmetry and asymptomatic subjects by using 2D CBCT and 3D models methods. The results indicated that there were significant differences between the cases and controls, and between the deviation and nondeviation sides.
The condylar angle could be an etiological factor for disc displacement and degenerative joint disease.7,23,24 The joint space and ramus angle would determine the disc position and the asymmetry of mandible.7,24 Therefore, the above 9 parameters were used to investigate the TMJ morphology. Ueki et al measured both TMJs using the 2D CBCT images and found that the mean angles of CCA were 11.9 and 12.7° on the left side and right side and the mean distances of SJS and PJS were 1.8 mm and 2.5 mm, respectively.7 In this study, the CCA for asymptomatic subjects measured in the 2D CBCT images were 11.80 ± 0.89 and 12.05 ± 1.40° on the left and right sides, respectively. The mean distances of SJS and PJS for asymptomatic subjects were 1.99 mm and 2.47 mm, respectively. The mean distance of the CCW for asymptomatic subjects was 17.60 mm in this study, consistent with Al-Koshab et al's result of 17.80 mm.17 The measurement method in the 3D models was also similar to other previous studies.6,22,25,26 In this study, the mean angle of CCA for patients with facial asymmetry was 19.17° measured from the 3D models, close to Kim et al's results of 19.81°.26 These results indicated that the methods and results were reliable in our study.
Tables 1 and 2 indicated that the HCA, CCA, SRA, MJS, LJS, SJS, and AJS measured in the 2D CBCT and 3D models were statistically significantly different, no matter in the case group or in the control group. These distances and angles measured in the 2D CBCT were significantly less than that measured in the 3D model, which suggested that the 2D method may lead to smaller measured values. Because the lines of CCW and PJS measured in the 2D CBCT almost coincided with the coronal and sagittal projection of the 2 lines measured in the 3D model, the CCW and PJS were not significantly different between the 2 measurement methods. In other words, these results suggest that the distances and angles of TMJ measured in the 3D model were closer to the real value.
From the results measured in the 3D models, significant differences of HCA, CCA, SRA, MJS, SJS, and LJS were found between the patients with facial asymmetry and the asymptomatic subjects. The HCA and CCA for patients with facial asymmetry were significantly larger than those for the asymptomatic subjects on both sides. The increase of the condylar angle for the patients may probably cause the rise of the condylar ridge, and then it may lead to the aggravation of the squeezing in the disc and other soft tissues in the TMJ. The disc displacement and other TMJ diseases were also widely reported to be associated with mandibular asymmetry in related research.7,23,24,27 The SRA on the nondeviation side for the patients with facial asymmetry was significantly larger than that for the asymptomatic subjects. However, there was no significant difference of SRA on the deviation side between the patients with facial asymmetry and the asymptomatic subjects. This result suggested that the sagittal ramus angles for patients with facial asymmetry were increased on the nondeviation side rather than the deviation side comparing to the asymptomatic subjects. The MJS, SJS, and LJS for the patients with facial asymmetry were significantly smaller than those for the asymptomatic subjects. The results indicated that the spaces between the condyle and glenoid fossa were reduced for the patients with facial asymmetry. The decrease of the joint space for the patients with facial asymmetry may lead to the articular disc suffering severely squeezing. Furthermore, the severely squeezing of disc may lead to the joint pain, disc perforation, or other TMJ dysfunctions, which were the symptoms of the TMD. This finding was also consistent with Yang and Hwang and Ueki et al's studies.22,28
In our study, there was no significant difference of the TMJ positions measured in the 3D models for asymptomatic subjects between the left side and right side. However, for the patients with facial asymmetry, the SRA on the deviation side was significantly smaller than that on the nondeviation side. This result indicated that facial asymmetry may lead to the increase of the sagittal ramus angle on the nondeviation side rather than the deviation. On the contrary, the CCA, MJS, and AJS on the deviation side were significantly larger than those on the nondeviation side. The increase of the coronal condylar angle indicated that facial asymmetry may lead to the rise of condylar ridge on the deviation side. The increase of the joint space at the medial and anterior sides of TMJ on the deviation side may induce the disc move to forward, known as anterior disc displacement (ADD). Related research reported that ∼14% to 49.3% of the patients with jaw deformities had TMJ symptoms.29–32 In Ueki et al's study, the incidence of disc displacement was 56.8% in the asymmetry group.24 The results in this study also suggested that the patients with facial asymmetry may had ADD. Furthermore, this study indicated that the ADD was more likely to occur on the deviated side for the patients with facial asymmetry.
One major limitation of the present study is that the sample size of each group is relatively small. This is mainly due to that this study is a methodological inquiry between the 2D and 3D measurement of TMJ, which could provide the theoretical guidance on the methodology for future studies. Certainly, a multicentric study with a larger sample should be necessary to confirm our findings.
CONCLUSIONS
The 3D measurement method is more accurate and effective for clinicians to investigate the morphology of TMJ than the 2D method.
Footnotes
Abbreviations: 2D = two-dimensional, 3D = three-dimensional, AJS = anterior joint space, CBCT = cone-beam computed tomography, CCA = coronal condylar angle, CCW = coronal condylar width, CT = computed tomography, DICOM = Digital Imaging and Communications in Medicine, HCA = horizontal condylar angle, HU = Hounsfield units, LJS = lateral joint space, MJS = medial joint space, MRI = magnetic resonance imaging, PJS = posterior joint space, SJS = superior joint space, SRA = sagittal ramus angle, TMD = temporomandibular disorders, TMJ = temporomandibular joint.
J-LS and Y-LZ both contributed equally to the study.
Funding: this study was supported by the National Natural Science Foundation of China under Grant number 11202143 and 11572057.
The authors have no conflicts of interest to disclose.
REFERENCES
- 1.Bishara SE, Burkey PS, Kharouf JG. Dental and facial asymmetries: a review. Angle Orthod 1994; 64:89–98. [DOI] [PubMed] [Google Scholar]
- 2.Bergersen EO. Enlargement and distortion in cephalometric radiography: compensation tables for linear measurements. Angle Orthod 1980; 50:230–244. [DOI] [PubMed] [Google Scholar]
- 3.Wang H, Wang B, Ji C, et al. The prevalence of malocclusion and mandible deviation in Beijing. Beijing J Stomatology 2002; 10:70–72. [Google Scholar]
- 4.Hua Z, Song J, Yanqiong L. Clinical study of orthognathic surgery for the treatment of dentofacial deformities. J Stomatology 2003; 23:219–223. [Google Scholar]
- 5.Ueki K, Nakagawa K, Marukawa K, et al. The relationship between temporomandibular joint disc morphology and stress angulation in skeletal Class III patients. Eur J Orthod 2005; 27:501–506. [DOI] [PubMed] [Google Scholar]
- 6.Goncalves JR, Wolford LM, Cassano DS, et al. Temporomandibular joint condylar changes following maxillomandibular advancement and articular disc repositioning. J Oral Maxillofac Surg 2013; 71:1759e1–1759e15. [DOI] [PMC free article] [PubMed] [Google Scholar]
- 7.Ueki K, Moroi A, Sotobori M, et al. Changes in temporomandibular joint and ramus after sagittal split ramus osteotomy in mandibular prognathism patients with and without asymmetry. J Craniomaxillofac Surg 2012; 40:821–827. [DOI] [PubMed] [Google Scholar]
- 8.Isberg AM, Isacsson G. Tissue reactions of the temporomandibular joint following retrusive guidance of the mandible. Cranio 1986; 4:143–148. [DOI] [PubMed] [Google Scholar]
- 9.Iii EE, Hinton RJ. Histologic examination of the temporomandibular joint after mandibular advancement with and without rigid fixation: an experimental investigation in adult Macaca mulatta. J Oral Maxillofac Surg 1991; 49:1316–1327. [DOI] [PubMed] [Google Scholar]
- 10.Rakesh N, Devi BKY, Patil DJ, et al. Assessment of cervical spine postural disorders in patients with temporomandibular dysfunction: a radiographic evaluation. Oral Radiol 2014; 30:38–44. [Google Scholar]
- 11.Scolozzi P, Momjian A, Courvoisier DS, et al. Evaluation of condylar morphology following orthognathic surgery on digital panoramic radiographs. Could methodology influence the range of “normality” in condylar changes? Dentomaxillofac Radiol 2013; 42:20120463. [DOI] [PMC free article] [PubMed] [Google Scholar]
- 12.Dupuy-Bonafé I, Otal P, Montal S, et al. Biometry of the temporomandibular joint using computerized tomography. Surg Radiol Anat 2014; 36:933–939. [DOI] [PubMed] [Google Scholar]
- 13.Chandak SO, Pandilwar PK, Bhople PR, et al. Computed tomographic analysis of the position of the mandibular canal in unilateral temporomandibular joint ankylosis patients. Br J Oral Maxillofac Surg 2013; 51:434–437. [DOI] [PubMed] [Google Scholar]
- 14.Shi B, Lin LS, Qiu Y, et al. Evaluation of temporomandibular joint function after complicated mandible reconstruction guided by rapid prototyping technique. China J Oral Maxillofac Surg 2009; 7:4–7. [Google Scholar]
- 15.Yang ZJ, Song DH, Dong LL, et al. Magnetic resonance imaging of temporomandibular joint: morphometric study of asymptomatic volunteers. J Craniofac Surg 2015; 26:425–429. [DOI] [PubMed] [Google Scholar]
- 16.Hopfgartner AJ, Tymofiyeva O, Ehses P, et al. Dynamic MRI of the TMJ under physical load. Dentomaxillofac Radiol 2013; 42:311–1311. [DOI] [PMC free article] [PubMed] [Google Scholar]
- 17.Al-koshab M, Nambiar P, John J, et al. Assessment of condyle and glenoid fossa morphology using CBCT in South-East Asians. PloS One 2015; 10:e0121682. [DOI] [PMC free article] [PubMed] [Google Scholar]
- 18.Kim YI, Cho BH, Jung YH, et al. Cone-beam computerized tomography evaluation of condylar changes and stability following two-jaw surgery: Le Fort I osteotomy and mandibular setback surgery with rigid fixation. Oral Surg Oral Med Oral Pathol Oral Radiol Endod 2011; 111:681–687. [DOI] [PubMed] [Google Scholar]
- 19.D’Urso P, Barker T, Earwaker W, et al. Stereolithographic biomodelling in cranio-maxillofacial surgery: prospective trial. J Craniomaxillofac Surg 1999; 27:30–37. [DOI] [PubMed] [Google Scholar]
- 20.Zhu M, Chai G, Qingfeng LI. Application of three-dimensional printing technique in correction of mandibular prognathism. Zhongguo Xiu Fu Chong Jian Wai Ke Za Zhi 2014; 28:296–299. [PubMed] [Google Scholar]
- 21.Cevidanes LHS, Hajati AK, B. Paniagua MS, et al. Quantification of condylar resorption in temporomandibular joint osteoarthritis. Oral Surg Oral Med Oral Pathol Oral Radiol Endod 2010; 110:110–117. [DOI] [PMC free article] [PubMed] [Google Scholar]
- 22.Yang HJ, Hwang SJ. Change in condylar position in posterior bending osteotomy minimizing condylar torque in BSSRO for facial asymmetry. J Craniomaxillofac Surg 2014; 42:325–332. [DOI] [PubMed] [Google Scholar]
- 23.Sanromán JF, González JMG, Hoyo JAD. Relationship between condylar position, dentofacial deformity and temporomandibular joint dysfunction: an MRI and CT prospective study. J Craniomaxillofac Surg 1998; 26:35–42. [DOI] [PubMed] [Google Scholar]
- 24.Ueki K, Nakagawa K, Takatsuka S, et al. Temporomandibular joint morphology and disc position in skeletal class III patients. J Craniomaxillofac Surg 2001; 28:362–368. [DOI] [PubMed] [Google Scholar]
- 25.Carvalho FDAR, Cevidanes LHS, Almeida MADO, et al. Three-dimensional assessment of mandibular advancement 1 year after surgery. Am J Orthod Dentofacial Orthop 2010; 137:121–124. [DOI] [PMC free article] [PubMed] [Google Scholar]
- 26.Kim YJ, Oh KM, Hong JS, et al. Do patients treated with bimaxillary surgery have more stable condylar positions than those who have undergone single-jaw surgery? J Oral Maxillofac Surg 2012; 70:2143–2152. [DOI] [PubMed] [Google Scholar]
- 27.Schellhas K, Piper M, Omlie M. Facial skeleton remodeling due to temporomandibular joint degeneration: an imaging study of 100 patients. AJNR Am J Neuroradiol 1990; 11:541–551. [PMC free article] [PubMed] [Google Scholar]
- 28.Ueki K, Degerliyurt K, Hashiba Y, et al. Horizontal changes in the condylar head after sagittal split ramus osteotomy with bent plate fixation. Oral Surg Oral Med Oral Pathol Oral Radiol Endod 2008; 106:656–661. [DOI] [PubMed] [Google Scholar]
- 29.Ueki K, Marukawa K, Shimada M, et al. Condylar and disc positions after sagittal split ramus osteotomy with and without Le Fort I osteotomy. Oral Surg Oral Med Oral Pathol Oral Radiol Endod 2007; 103:342–348. [DOI] [PubMed] [Google Scholar]
- 30.Laskin DM, Ryan WA, Greene CS. Incidence of temporomandibular symptoms in patients with major skeletal malocclusions: a survey of oral and maxillofacial surgery training programs. Oral Surg Oral Med Oral Pathol 1986; 61:537–542. [DOI] [PubMed] [Google Scholar]
- 31.Kerstens H, Tuinzing D, Vanderkwast W. Temporomandibular joint symptoms in orthognathic surgery. J Craniomaxillofac Surg 1989; 17:215–218. [DOI] [PubMed] [Google Scholar]
- 32.White CS, Dolwick MF. Prevalence and variance of temporomandibular dysfunction in orthognathic surgery patients. Int J Adult Orthodon Orthognath Surg 1992; 7:7–14. [PubMed] [Google Scholar]


