Supplemental Digital Content is available in the text
Abstract
Subjective global assessment (SGA) is associated with mortality in end-stage renal disease (ESRD) patients. However, little is known whether improvement or deterioration of nutritional status after dialysis initiation influences the clinical outcome. We aimed to elucidate the association between changes in nutritional status determined by SGA during the first year of dialysis and all-cause mortality in incident ESRD patients.
This was a multicenter, prospective cohort study. Incident dialysis patients with available SGA data at both baseline and 12 months after dialysis commencement (n = 914) were analyzed. Nutritional status was defined as well nourished (WN, SGA A) or malnourished (MN, SGA B or C). The patients were divided into 4 groups according to the change in nutritional status between baseline and 12 months after dialysis commencement: group 1, WN to WN; group 2, MN to WN; group 3, WN to MN; and group 4, MN to MN. Cox proportional hazard analysis was performed to clarify the association between changes in nutritional status and mortality.
Being in the MN group at 12 months after dialysis initiation, but not at baseline, was a significant risk factor for mortality. There was a significant difference in the 3-year survival rates among the groups (group 1, 92.2%; group 2, 86.0%; group 3, 78.2%; and group 4, 63.5%; log-rank test, P < 0.001). Multivariate Cox regression analysis revealed that the mortality risk was significantly higher in group 3 than in group 1 (hazard ratio [HR] 2.77, 95% confidence interval [CI] 1.27–6.03, P = 0.01) whereas the mortality risk was significantly lower in group 2 compared with group 4 (HR 0.35, 95% CI 0.17–0.71, P < 0.01) even after adjustment for confounding factors. Moreover, mortality risk of group 3 was significantly higher than in group 2 (HR 2.89, 95% CI 1.22–6.81, P = 0.02); there was no significant difference between groups 1 and 2.
The changes in nutritional status assessed by SGA during the first year of dialysis were associated with all-cause mortality in incident ESRD patients.
INTRODUCTION
Protein–energy wasting (PEW) is a syndrome of protein and energy wasting, malnutrition, and inflammation.1,2 In patients with end-stage renal disease (ESRD), PEW is prevalent, ranging from 16% to 62% depending on the study subjects and assessment methods,3–5 and is attributed to not only insufficient nutrient intake but also oxidative stress, metabolic acidosis, and nutrient loss during dialysis.3,6 In addition, mounting evidence has shown that PEW is a significant risk factor for morbidity and mortality in these patients.7,8 Therefore, continuous monitoring of nutritional status and early detection and treatment of PEW may be important for the clinical outcomes in ESRD patients.
To detect PEW in patients with ESRD, various clinical and biochemical parameters have been used in clinical practice, including body mass index (BMI), muscle mass, dietary protein or energy intake, and serum albumin or prealbumin concentrations.6,9,10 However, no single parameter can definitively ascertain PEW; therefore, the International Society of Renal Nutrition and Metabolism panel has proposed diagnostic criteria for PEW in patients undergoing dialysis consisting of 4 categories (serum chemistry, body mass, muscle mass, and dietary intake).6 At least 3 compatible findings among the 4 categories are required to diagnose PEW. However, these parameters are influenced by acute inflammation accompanied by infectious/inflammatory conditions and a patient's hydration status. To overcome these flaws, subjective global assessment (SGA) has been suggested as a comprehensive method for evaluating nutritional status in ESRD patients.
Subjective global assessment is a well-established tool to assess nutritional status and a feasible method to ascertain PEW based on a patient's medical history and physical examination.11,12 Moreover, it can be applied quickly in clinics without technical difficulties. Although a number of previous studies found a significant association between SGA score and mortality in patients with ESRD, the SGA score was determined only once in most of those studies.8,13 Especially in incident ESRD patients, the SGA score only at the time of dialysis initiation was usually used to define nutritional status.9,14 Because patient's nutritional status can change as a result of improved oral intake, correction of acidosis, and nutrient loss through the dialysate after commencing ESRD treatment, the change in nutritional status may affect patient survival in incident dialysis patients. To date, however, this issue has not been explored. Therefore, in the present study, a comprehensive mortality analysis was performed according to the changes in SGA score during the first year of dialysis in incident dialysis patients from the Clinical Research Center for ESRD (CRC for ESRD) cohort, a nationwide prospective observational multicenter cohort.
METHODS
Ethics
The current study was conducted in accordance with the Declaration of Helsinki. The study protocol was approved by the institutional review board at each participating center, and all patients provided written informed consent to participate in this study.
Subjects
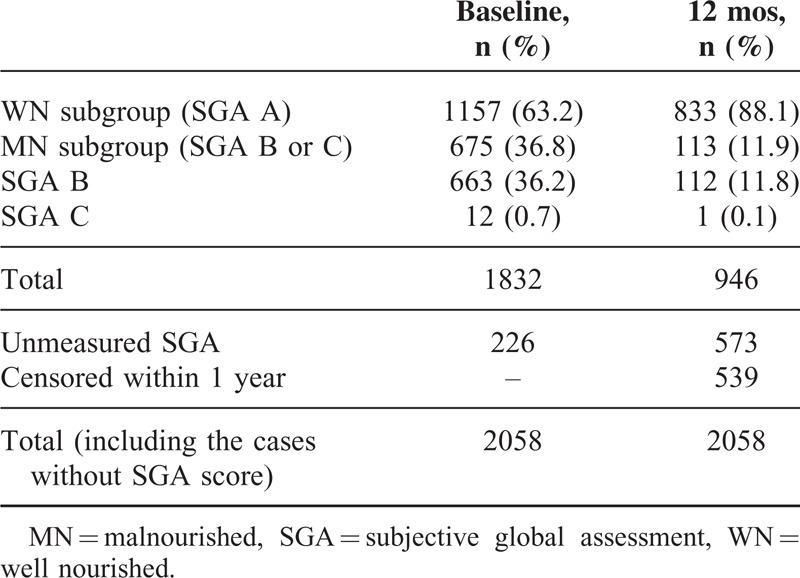
All consecutive ESRD patients who started hemodialysis (HD) or peritoneal dialysis (PD) between November 1, 2008 and February 28, 2014 at 36 centers of the CRC for ESRD in Korea were initially recruited for this prospective observational multicenter study. We excluded patients who were younger than 18 years, had a history of kidney transplantation before dialysis therapy, or had an underlying active malignancy. Consequently, 2058 patients were initially eligible to be enrolled at the time of dialysis initiation. Because the current study aimed at clarifying the impact of the change in nutritional status assessed by SGA during the first year of dialysis, we first analyzed the data from the entire cohort (n = 2058), and then focused on the patients whose both baseline and 12-month SGA data were available (n = 914) (Figure 1). The numbers of the patients in SGA groups at baseline and at 12 months are described in Table 1.
FIGURE 1.
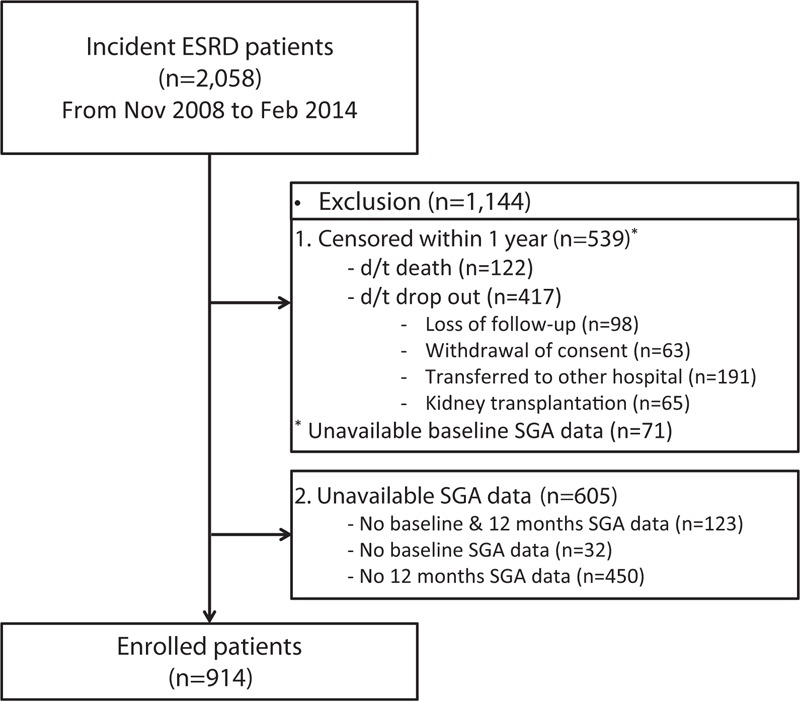
Flow diagram of the study subjects.
TABLE 1.
Nutritional Status Groups Based on Subjective Global Assessment at Baseline and 12 Months After Dialysis Commencement
Data Collection
Demographic and clinical data were recorded at the time of study entry, including age, sex, BMI calculated as weight/height2 (kg/m2), blood pressure, dialysis modality, and comorbidities, such as diabetes mellitus, coronary artery disease, cerebrovascular disease, peripheral artery disease, heart failure, and moderate or severe liver disease. Coronary artery disease was defined as a history of angina, myocardial infarction, angioplasty or coronary artery bypass graft, and cerebrovascular accident as a history of transient ischemic attack, stroke, or carotid endarterectomy. A history of claudication, foot ulceration, and/or ischemic limb loss, and any peripheral revascularization procedure was considered peripheral artery disease. The following baseline laboratory data were measured from fasting blood samples, which were drawn before the start of HD on the day of a midweek session in HD patients and at 2 hours after the first PD exchange with 1.5% dextrose dialysate in PD patients, close to the time of discharge, and every 3 months thereafter. The following laboratory data were measured: white blood cell counts and hemoglobin, blood urea nitrogen, creatinine, calcium, phosphorus, intact parathyroid hormone, glucose, uric acid, albumin, and total cholesterol concentrations. High-sensitivity C-reactive protein (hs-CRP) concentrations were measured by latex-enhanced immunonephelometry using a BNII analyzer (Dade Behring; Newark, DE).
Subjective Global Assessment
Nutritional status was determined using the 7-point SGA scale consisting of 2 categories: medical history and physical examination. The medical history section includes weight change, dietary intake, gastrointestinal symptoms, functional capacity, and disease and comorbidity data. The physical examination section includes loss of subcutaneous fat, muscle wasting, and edema. The trained investigators rated each item from 1 to 7, and decided the overall SGA score. Based on the overall SGA score, the patients were categorized into 3 groups as SGA A (SGA score 6–7, well nourished, [WN]), B (SGA score 3–5, mildly to moderately malnourished [MN]), or C (SGA score 1–2, severely MN). However, since the number of SGA C patients was too small to be analyzed separately, MN patients were combined into the same group (MN group, SGA B or C). Finally, patients were classified into 4 groups according to the 1-year changes in nutritional status: group 1, WN to WN; group 2, MN to WN; group 3, WN to MN; and group 4, MN to MN.
Outcome Measures
All deaths were retrieved from the database of the CRC for ESRD and carefully reviewed. The primary endpoint was all-cause mortality, and the survival duration data were calculated from the time of dialysis initiation to death, dropout, or February 28, 2015.
Statistical Analyses
Statistical analyses were performed using SPSS for Windows version 21 (IBM Corporation; Armonk, NY). Data are expressed as mean ± standard deviation or median (interquartile range) for continuous variables and number (percentage) for categorical variables. The normality of distribution was assessed using the Shapiro–Wilk test. The differences between the groups were analyzed using analysis of variance or Kruskal–Wallis test for continuous variables and the χ2 test for categorical variables, and paired t test or Wilcoxon signed rank test was used to compare baseline and 12-month values. Cumulative survival graphs for all-cause mortality were generated using the Kaplan–Meier analyses, and log-rank test was used to compare the survival rates between the groups. The prognostic value of the changes in nutritional status for mortality was verified using Cox proportional hazards regression analysis. A P value less than 0.05 was considered statistically significant.
RESULTS
Data From the Entire Cohort
Of 2058 incident dialysis patients, nutritional status group assessed by SGA was determined in 1832 patients at baseline and in 946 patients at 12 months after dialysis commencement. The mean age of the entire cohort was 60.4 ± 14.3 years, and 62.1% were men. A total of 1473 patients (71.6%) started HD, and 1114 (54.1%) had diabetes. The distribution of nutritional status group at baseline was as follows: WN group, 1157 (63.2%) and MN group, 675 (36.8%) (Table 1).
During a median follow-up of 31 months, 323 patients (15.7% of the entire cohort) died, and of the patients with SGA data at baseline, 281 patients (15.3%) died. A Kaplan–Meier plot demonstrated that 3-year survival rates were significantly higher in the WN group than in the MN group at baseline (WN group, 85.7%; MN group, 75.1%, P < 0.001) (Supplementary Figure 1). The impact of the baseline nutritional status assessed by SGA on all-cause mortality was statistically significant in univariate Cox proportional regression analysis, but not in multivariate analysis (Supplementary Table 1). In contrast, the 12-month nutritional status was significantly associated with all-cause mortality in both univariate and multivariate Cox regression models.
Characteristics of the Patients With Available Subjective Global Assessment Data at Baseline and 12 Months After Dialysis Initiation
To clarify the impact of nutritional status changes in the first year after dialysis initiation, we analyzed the patients with available baseline and 12-month SGA data (n = 914). The baseline demographics, clinical characteristics, and laboratory findings are shown in Table 2. At the time of dialysis commencement, 651 patients (71.2%) belonged to the WN subgroup and 263 patients (28.8%) to the MN subgroup. We categorized the patients into 4 groups according to nutritional status changes from baseline to after 12 months (group 1, WN to WN; group 2, MN to WN; group 3, WN to MN; and group 4, MN to MN). After 12 months, the number of patients whose nutritional status was changed from WN to MN was 48 out of 651 patients (7.4%), and the nutritional status of 213 out of 263 patients (81.0%) was changed from MN to WN. Therefore, the numbers of patients in each group were 603, 213, 48, and 50, respectively. There were significant differences in age, the proportion of diabetic patients, and serum albumin, creatinine, and hs-CRP concentrations among the 4 groups (P < 0.05 to P < 0.001). However, BMI, systolic and diastolic blood pressure, and serum total cholesterol concentrations were comparable.
TABLE 2.
Demographics, Clinical Characteristics, and Laboratory Findings in the 4 Groups

Effects of Baseline and 12-Month Nutritional Status Assessed by Subjective Global Assessment on All-Cause Mortality
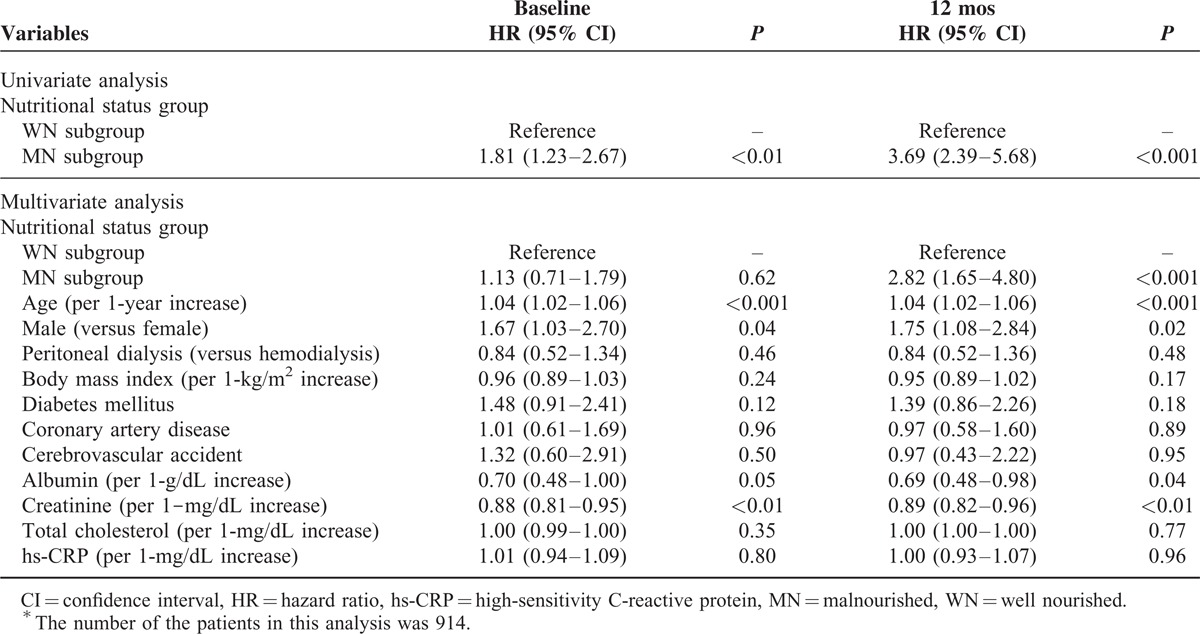
During a median follow-up of 30 months, 108 patients (11.8%) died. Univariate Cox regression analysis revealed that being in the MN subgroup at baseline was significantly associated with all-cause mortality (hazard ratio [HR] 1.81, 95% confidence interval [CI] 1.23–2.67, P < 0.01) (Table 3). In multivariate Cox regression analysis, however, the significance of being in the MN subgroup at baseline as a predictor of all-cause mortality disappeared after adjusting for confounding factors (HR 1.13, 95% CI 0.71–1.79, P = 0.62). In contrast, being in the MN subgroup at 12 months was a significant risk factor for all-cause mortality in both univariate and multivariate Cox regression analyses (in univariate analysis: HR 3.69, 95% CI 2.39–5.68, P < 0.001; in multivariate analysis: HR 2.82, 95% CI 1.65–4.80, P < 0.001).
TABLE 3.
Effects of Nutritional Status Group at Baseline and After 12 Months on All-Cause Mortality∗
Changes in Body Mass Index and Nutritional Biochemical Markers in the 4 Groups
Compared with baseline, serum albumin concentrations were significantly increased after 12 months in all 4 groups (P = 0.01 to P < 0.001) (Table 4 and Figure 2). After 12 months, BMI was also significantly increased in group 2 (P = 0.01). However, there were no significant differences in the changes in BMI and serum albumin concentrations among the 4 groups. In contrast, serum creatinine concentrations were significantly increased in group 3 (P < 0.01) and group 4 (P < 0.001) after 12 months, whereas they were slightly decreased in group 2, and these changes were significantly different among the 4 groups (P < 0.01). Meanwhile, there were no significant changes in serum cholesterol concentrations during the first year of dialysis treatment in the 4 groups.
TABLE 4.
Comparisons of the Changes in Body Mass Index and Nutritional Biochemical Markers Among the 4 Groups
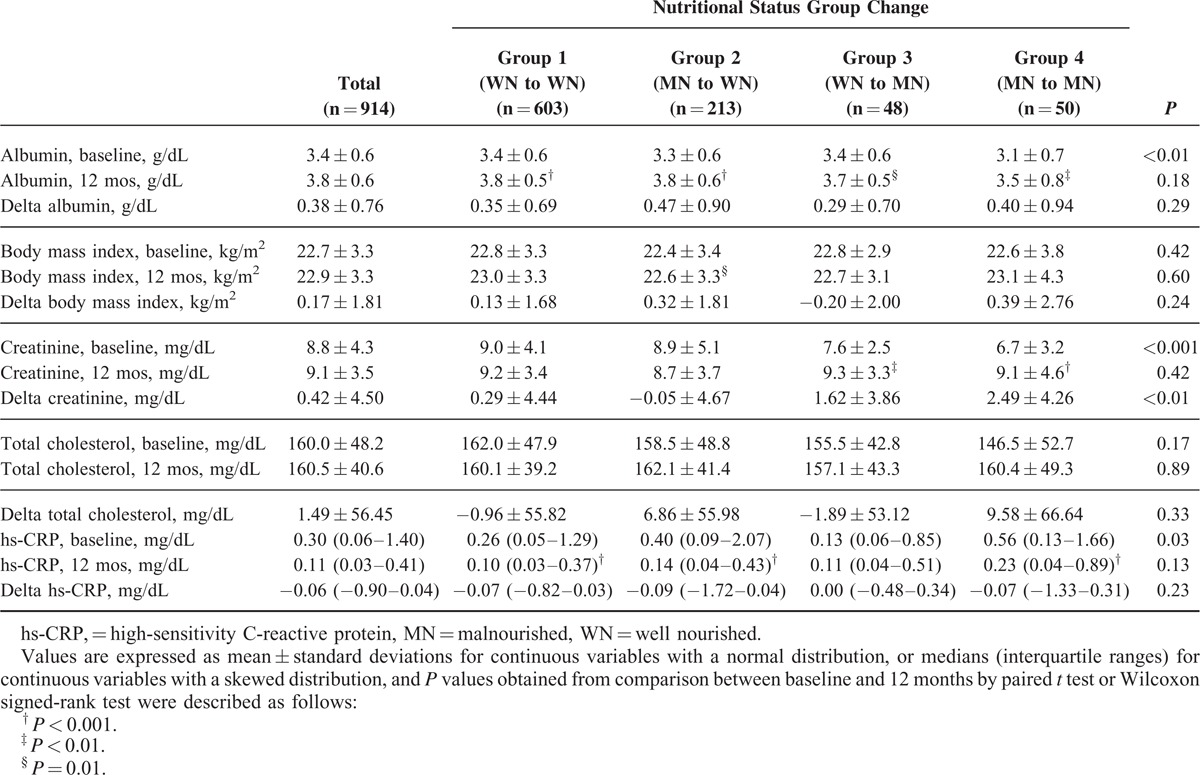
FIGURE 2.
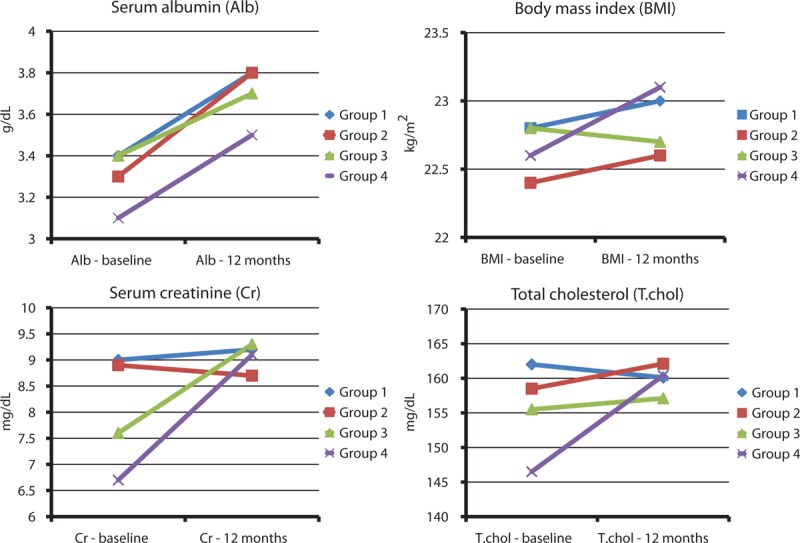
Changes in serum albumin levels, body mass index, and serum creatinine and total cholesterol concentrations from baseline to 12 months.
Comparison of All-Cause Mortality According to Changes in Nutritional Status
To investigate differences in all-cause mortality according to changes in nutritional status assessed by SGA, the patient survival rates of the 4 groups were compared. Kaplan–Meier survival curve analysis demonstrated that the 3-year survival rates in each group were 92.2%, 86.0%, 78.2%, and 63.5%, respectively, and there was a significant difference in patient survival across the 4 groups (log-rank test, P < 0.001) (Figure 3). However, pairwise comparison among the groups revealed that the difference between groups 1 and 2 did not reach statistical significance (P = 0.06). Multivariate Cox regression analysis also revealed that the risk for mortality was significantly higher in group 3 than group 1 (HR 2.77, 95% CI 1.27–6.03, P = 0.01), whereas the mortality risk was significantly lower in group 2 compared with group 4 (HR 0.35, 95% CI 0.17–0.71, P < 0.01) even after adjustment for confounding factors. Moreover, mortality risk of group 3 was significantly higher than in group 2 (HR 2.89, 95% CI 1.22–6.81, P = 0.02), whereas there was no significant difference in the risk for mortality between groups 1 and 2 (Table 5).
FIGURE 3.
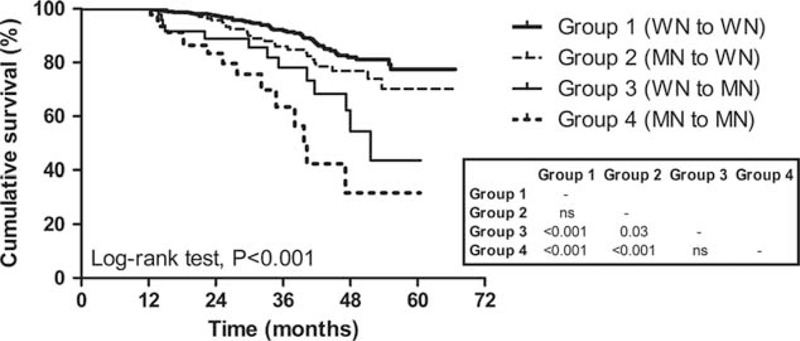
Kaplan–Meier plot for all-cause mortality of the groups according to the nutritional status change assessed by subjective global assessment (3 categories). Numbers in the box are P values of pairwise comparisons between 2 groups. WN group: SGA A group, MN group: SGA B or C group. MN = malnourished, SGA = subjective global assessment, WN = well nourished.
TABLE 5.
Impact of the Changes in Nutritional Status Group on All-Cause Mortality

Next, we verified the predictive power of nutritional status change for mortality by performing 2 additional analyses. Firstly, we subdivided the patients according to their baseline SGA, and performed multivariate Cox regression analyses separately. In the WN subgroup at baseline (n = 651), deterioration of nutritional status (WN to MN) was significantly associated with a higher all-cause mortality (HR 2.48, 95% CI 1.10–5.59, P = 0.03), whereas improvement of nutritional status (MN to WN) was associated with a significantly lower mortality in the MN subgroup at baseline (n = 263) (HR 0.26, 95% CI 0.11–0.57, P < 0.01), even after adjustment for age, sex, dialysis modality, BMI, diabetes mellitus, coronary artery disease, cerebrovascular disease, and serum albumin, creatinine, total cholesterol, and hs-CRP concentrations (Supplementary Table 2). Secondly, both baseline SGA and delta SGA (differences in SGA score in 7-point scale between baseline and 12 months) were incorporated in multivariate Cox regression analysis, and it was found that an increase in SGA score by 1 point after 12 months of dialysis was independently associated with a 34% decrease in all-cause mortality risk (Supplementary Table 3).
Lastly, when the patients were restratified according to the trend of nutritional status change during the first year of dialysis as stationary (WN to WN, MN to MN), improving (MN to WN), and worsening (WN to MN), the risk for all-cause mortality of the worsening nutritional status group was significantly higher compared with the other 2 groups (stationary and improving groups) (P < 0.05) (Figure 4). Additionally, the patients’ group with worsening nutritional status assessed by 7-point scale SGA also showed poorer survival than stationary or improving groups, although statistical difference was not significant in Kaplan–Meier plot (Supplementary Figure 2).
FIGURE 4.
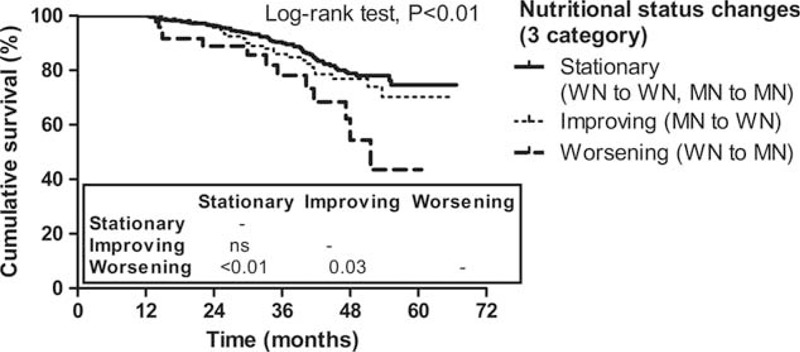
Kaplan–Meier plot for all-cause mortality of the reclassified patients group according to the trend of nutritional status change (3 categories). Numbers in the box are P values of pairwise comparisons between 2 groups. WN group: SGA A group, MN group: SGA B or C group. MN = malnourished, SGA = subjective global assessment, WN = well nourished.
DISCUSSION
Clinically, SGA is a simple method to assess nutritional status in various patients, including ESRD patients. Previous studies found that SGA score was an independent predictor of mortality in patients undergoing dialysis.8,9,13,14 As most of those studies used SGA scores measured just once in their analysis, it is unclear whether changes in SGA scores exerted any effect on clinical outcomes in dialysis patients. In this study, we showed that the changes in nutritional status assessed by SGA during the first year of dialysis were associated with mortality in incident ESRD patients.
It is well-known that PEW is a myriad factor associated with poor clinical outcomes in various patient populations.15–17 Therefore, a number of interventions have been tried to prevent PEW to improve patient morbidity and mortality; however, it is still prevalent in some patient groups, especially in ESRD patients. In the first study in which SGA was used in ESRD patients, 18 of 59 prevalent dialysis patients (30.5%; 9 of 23 PD patients and 9 of 36 HD patients) were classified as MN.18 The 7-point SGA used in the current study was then validated in the Canada-USA study, in which 51.2% of 680 incident PD patients were revealed to be mildly to moderately MN.19 The Netherlands Co-operative Study on the Adequacy of Dialysis-2 (NECOSAD-II) study also used the SGA to determine nutritional status and found that 22.9% and 5.1% of ESRD patients had moderate and severe PEW, respectively, at 3 months.14 This wide range of the proportion of patients with malnutrition in previous studies may be attributed to the differences in the study population (HD versus PD), the time (prevalent versus incident) and methods of assessment, and predialysis management. This study showed that the prevalence of mild to moderate malnutrition in incident dialysis patients was 28.8% at baseline, which was consistent with the NECOSAD-II study; however, it decreased to 10.7% after 12 months of dialysis. We surmised that the decrease in the proportion of MN ESRD patients 12 months after dialysis initiation was due to improved dietary intake and reduced gastrointestinal symptoms, leading to weight gain and functional capacity improvement, after the correction of uremia and acidosis.
Numerous previous studies have demonstrated that PEW determined by the SGA is a significant independent predictor of morbidity and mortality in a variety of patient groups.15–17,20,21 However, most of those studies included PEW assessed by the SGA only once at a certain time in the analysis. Similar to the current study, however, some studies have tried to elucidate the impact of the changes in SGA ratings on clinical outcomes. Braunschweig et al22 and Allard et al23 found that the decline in nutritional status determined by SGA in hospitalized patients for more than 7 days was a significant independent predictor of a longer length of hospital stay and higher complication rates regardless of the patient's nutritional status on admission. In ESRD patients, the NECOSAD-II study also found that malnutrition at baseline (SGA score 1–5) was significantly associated with 7-year mortality and that time dependently, this association was even stronger.14 In agreement with the aforementioned studies, the present study showed that the change in nutritional status assessed by SGA at baseline and 12 months after dialysis commencement was significantly associated with all-cause mortality, whereas nutritional status assessed by SGA at the time of dialysis initiation was not an independent predictor of the clinical outcome in Korean incident dialysis patients. These findings further underscore the importance of regular monitoring of nutritional status rather than nutritional assessment at a single time, because nutritional status can change in ESRD patients after commencing dialysis treatment. However, in the subgroup of patients who died within 1 year, the risks of all-cause mortality between baseline WN and MN groups were not statistically different (Supplementary Figure 3). These findings may suggest that other factors such as cardiovascular diseases rather than malnutrition are more closely associated with mortality within 1 year of dialysis commencement.
Although many studies showed that nutrition-related variables, such as BMI, lean body mass, anthropometric parameters, and serum creatinine, albumin, prealbumin, transferrin, ferritin, and CRP concentrations,24–27 were significantly correlated with SGA scores, some investigators failed to demonstrate these relations.28,29 A previous study by Jones et al24 found significant differences in midarm circumference, midarm muscle circumference, and serum creatinine and CRP concentrations, but not serum albumin concentrations, between patients classified as SGA A (WN) and B (mildly to moderately MN). In addition, they showed that the composite nutrition score was associated with the 3-point SGA score, 7-point SGA score, BMI, midarm circumference, and triceps skinfold, except for serum albumin concentrations. In contrast, serum albumin concentrations were significantly correlated with CRP concentrations, suggesting that serum albumin concentrations were related to inflammation rather than nutrition state in patients undergoing HD. Our study revealed that BMI was significantly increased in group 2 at 12 months compared with that at baseline, and serum albumin concentrations were significantly increased after 12 months of dialysis in all 4 groups; however, there were no significant differences in the changes in BMI and serum albumin concentrations among the 4 groups. Moreover, although the nutritional status was worsened in group 3, serum creatinine concentrations were significantly increased in this group, whereas serum creatinine concentrations were not changed in group 2, in which the nutritional status was improved. Furthermore, the change in nutritional status assessed by SGA, rather than the changes in BMI and serum albumin and creatinine concentrations, was demonstrated to be a significant risk factor for all-cause mortality (Supplementary Table 4). These findings suggest that the change in nutritional status determined by SGA may be more closely associated with clinical outcomes than the changes in other nutritional parameters in incident ESRD patients.
Meanwhile, we reclassified the patients into 3 groups according to the changes in 3-category and 7-point scale SGA during the follow-up period as stationary, improving, and worsening and compared the mortality risks among these groups. The worsening groups by 3-category and 7-point scale were revealed to be associated with higher mortality risks, but a statistical significance was found only in nutritional status changes stratified by 3 categories but not by 7-point scale. The main difference between the 2 classifications was whether patients with a 1-point SGA score change (for instance, 3 to 4 or 7 to 6) was considered as stationary by 3 categories or changed (improving or worsening, respectively, by 7-point scale). Supplementary Figure 4 is the Kaplan–Meier plot according to the baseline SGA score using 7-point scale, revealing that the mortality risk of the SGA 7 group was similar to the SGA 6 group, but was significantly lower compared with the SGA 3 and 5 groups. Based on these findings, we surmised that 7-point scale could subdivide their nutritional status, but the effect of SGA score changes upon 7-point scale was not powerful to predict all-cause mortality because of a relatively large number of patients with a 1-point SGA score change within the same 3-category SGA subgroup.
The most common cause of death in the current study was cardiovascular disease, followed by infection (Supplementary Table 5). In ESRD patients, it is well known that malnutrition, inflammation, and atherosclerosis are connected (and termed MIA syndrome), implying that malnutrition may lead to increased cardiovascular mortality in these patients.1 In addition, malnutrition is associated with a defective immune system, resulting in susceptibility to infectious disease.30 In the present study, compared with groups 1 and 3, group 2 had significantly higher baseline concentrations of hs-CRP; however, they significantly decreased after 12 months. In contrast, significantly lower hs-CRP concentrations at baseline in group 3 compared with those in group 2 were only slightly increased at 12 months after dialysis initiation. These differential changes in hs-CRP concentrations may account for the opposite clinical outcomes between groups 2 and 3.
This study has several limitations. First, as the study subjects were all Korean incident dialysis patients, the association between the changes in nutritional status determined using the SGA and all-cause mortality may not be generalized to other populations. Second, although the SGA scores were determined by trained investigators at each study center, they were not validated by a third person. In addition, SGA scores were determined in 901 patients (98.6%) at baseline and after 12 months by the same investigators. Third, we assessed nutritional status using the SGA only twice. There is little evidence to guide the frequency of nutritional state screening for dialysis patients; however, 4- to 6-monthly monitoring for nutritional status is suggested in stable ESRD patients undergoing dialysis. Further studies on sequential SGA scores will be needed to firmly verify our current results. Fourth, the proportion of the severely MN patients (0.7% at baseline) was much lower than the previous studies; therefore, severely MN patients could not be analyzed separately.14,19 This may be attributed to several factors, such as ethnic differences,31 some degree of residual renal function,32,33 and a relatively long duration of predialysis care by nephrologists (mean 3.6 years). Fifth, anthropometric indices were not included, and thus the predictability of the changes in these indices for mortality was not clarified. Lastly, the number of patients who died in the present study was relatively small compared with those in previous studies on Western ESRD patients. We hypothesize that the difference is mainly attributed to disparate ethnicities, as the mortality rates of our patients were comparable with those of Japanese patients undergoing HD. Despite these limitations, this study highlighted the significance of the changes in nutritional status assessed by SGA in a large prospective ESRD patient cohort with a relatively long follow-up.
In summary, the changes in nutritional status assessed by SGA during the first year of dialysis were associated with all-cause mortality in incident ESRD patients. The mortality rates in patients whose nutritional status was poor at the time of dialysis commencement but improved after 12 months were comparable with those in patients who had good nutritional status at both times, whereas WN patients at baseline whose nutritional status was worse after 12 months of dialysis showed poor patient survival. These findings suggest that maintaining nutritional status in WN patients and intervening to improve nutritional status in MN patients at the start of dialysis may improve clinical outcomes in incident dialysis patients.
Supplementary Material
Footnotes
Abbreviations: BMI = body mass index, CRC = Clinical Research Center, ESRD = end-stage renal disease, HD = hemodialysis, hs-CRP = high-sensitivity C-reactive protein, MN = malnourished, PD = peritoneal dialysis, PEW = protein–energy wasting, SGA = subjective global assessment, WN = well nourished.
This work was supported by the Brain Korea 21 PLUS Project for Medical Science, Yonsei University College of Medicine, and a grant of the Korea Healthcare Technology R&D Project, Ministry of Health and Welfare, Republic of Korea (HI10C2020).
The authors have no conflicts of interest to disclose.
REFERENCES
- 1.Kalantar-Zadeh K, Ikizler TA, Block G, et al. Malnutrition-inflammation complex syndrome in dialysis patients: causes and consequences. Am J Kidney Dis 2003; 42:864–881. [DOI] [PubMed] [Google Scholar]
- 2.Kovesdy CP, Shinaberger CS, Kalantar-Zadeh K. Epidemiology of dietary nutrient intake in ESRD. Semin Dial 2010; 23:353–358. [DOI] [PMC free article] [PubMed] [Google Scholar]
- 3.Han SH, Han DS. Nutrition in patients on peritoneal dialysis. Nat Rev Nephrol 2012; 8:163–175. [DOI] [PubMed] [Google Scholar]
- 4.Kopple JD. McCollum Award Lecture, 1996: protein-energy malnutrition in maintenance dialysis patients. Am J Clin Nutr 1997; 65:1544–1557. [DOI] [PubMed] [Google Scholar]
- 5.Tayyem RF, Mrayyan MT. Assessing the prevalence of malnutrition in chronic kidney disease patients in Jordan. J Ren Nutr 2008; 18:202–209. [DOI] [PubMed] [Google Scholar]
- 6.Fouque D, Kalantar-Zadeh K, Kopple J, et al. A proposed nomenclature and diagnostic criteria for protein-energy wasting in acute and chronic kidney disease. Kidney Int 2008; 73:391–398. [DOI] [PubMed] [Google Scholar]
- 7.Ikizler TA, Hakim RM. Nutrition in end-stage renal disease. Kidney Int 1996; 50:343–357. [DOI] [PubMed] [Google Scholar]
- 8.Pifer TB, McCullough KP, Port FK, et al. Mortality risk in hemodialysis patients and changes in nutritional indicators: DOPPS. Kidney Int 2002; 62:2238–2245. [DOI] [PubMed] [Google Scholar]
- 9.Stenvinkel P, Barany P, Chung SH, et al. A comparative analysis of nutritional parameters as predictors of outcome in male and female ESRD patients. Nephrol Dial Transplant 2002; 17:1266–1274. [DOI] [PubMed] [Google Scholar]
- 10.Mehrotra R. Nutritional issues in peritoneal dialysis patients: how do they differ from that of patients undergoing hemodialysis? J Ren Nutr 2013; 23:237–240. [DOI] [PubMed] [Google Scholar]
- 11.Steiber A, Leon JB, Secker D, et al. Multicenter study of the validity and reliability of subjective global assessment in the hemodialysis population. J Ren Nutr 2007; 17:336–342. [DOI] [PubMed] [Google Scholar]
- 12.Detsky AS, McLaughlin JR, Baker JP, et al. What is subjective global assessment of nutritional status? JPEN J Parenter Enteral Nutr 1987; 11:8–13. [DOI] [PubMed] [Google Scholar]
- 13.Kalantar-Zadeh K, Kopple JD, Block G, et al. A malnutrition-inflammation score is correlated with morbidity and mortality in maintenance hemodialysis patients. Am J Kidney Dis 2001; 38:1251–1263. [DOI] [PubMed] [Google Scholar]
- 14.de Mutsert R, Grootendorst DC, Boeschoten EW, et al. Subjective global assessment of nutritional status is strongly associated with mortality in chronic dialysis patients. Am J Clin Nutr 2009; 89:787–793. [DOI] [PubMed] [Google Scholar]
- 15.Leandro-Merhi VA, Braga de Aquino JL. Comparison of nutritional diagnosis methods and prediction of clinical outcomes in patients with neoplasms and digestive tract diseases. Clin Nutr 2015; 34:647–651. [DOI] [PubMed] [Google Scholar]
- 16.Gupta D, Lammersfeld CA, Vashi PG, et al. Can subjective global assessment of nutritional status predict survival in ovarian cancer? J Ovarian Res 2008; 1:5. [DOI] [PMC free article] [PubMed] [Google Scholar]
- 17.Persson MD, Brismar KE, Katzarski KS, et al. Nutritional status using mini nutritional assessment and subjective global assessment predict mortality in geriatric patients. J Am Geriatr Soc 2002; 50:1996–2002. [DOI] [PubMed] [Google Scholar]
- 18.Enia G, Sicuso C, Alati G, et al. Subjective global assessment of nutrition in dialysis patients. Nephrol Dial Transplant 1993; 8:1094–1098. [PubMed] [Google Scholar]
- 19.Canada-USA (CANUSA) Peritoneal Dialysis Study Group. Adequacy of dialysis and nutrition in continuous peritoneal dialysis: association with clinical outcomes. J Am Soc Nephrol 1996; 7:198–207. [DOI] [PubMed] [Google Scholar]
- 20.Chan M, Kelly J, Batterham M, et al. Malnutrition (subjective global assessment) scores and serum albumin levels, but not body mass index values, at initiation of dialysis are independent predictors of mortality: a 10-year clinical cohort study. J Ren Nutr 2012; 22:547–557. [DOI] [PubMed] [Google Scholar]
- 21.Fontes D, Generoso Sde V, Toulson Davisson Correia MI. Subjective global assessment: a reliable nutritional assessment tool to predict outcomes in critically ill patients. Clin Nutr 2014; 33:291–295. [DOI] [PubMed] [Google Scholar]
- 22.Braunschweig C, Gomez S, Sheean PM. Impact of declines in nutritional status on outcomes in adult patients hospitalized for more than 7 days. J Am Diet Assoc 2000; 100:1316–1322.quiz 1323–1314. [DOI] [PubMed] [Google Scholar]
- 23.Allard JP, Keller H, Jeejeebhoy KN, et al. Decline in nutritional status is associated with prolonged length of stay in hospitalized patients admitted for 7 days or more: a prospective cohort study. Clin Nutr 2015; in press. [DOI] [PubMed] [Google Scholar]
- 24.Jones CH, Wolfenden RC, Wells LM. Is subjective global assessment a reliable measure of nutritional status in hemodialysis? J Ren Nutr 2004; 14:26–30. [DOI] [PubMed] [Google Scholar]
- 25.Gama-Axelsson T, Heimburger O, Stenvinkel P, et al. Serum albumin as predictor of nutritional status in patients with ESRD. Clin J Am Soc Nephrol 2012; 7:1446–1453. [DOI] [PMC free article] [PubMed] [Google Scholar]
- 26.Kalantar-Zadeh K, Kleiner M, Dunne E, et al. A modified quantitative subjective global assessment of nutrition for dialysis patients. Nephrol Dial Transplant 1999; 14:1732–1738. [DOI] [PubMed] [Google Scholar]
- 27.Stenvinkel P, Heimburger O, Paultre F, et al. Strong association between malnutrition, inflammation, and atherosclerosis in chronic renal failure. Kidney Int 1999; 55:1899–1911. [DOI] [PubMed] [Google Scholar]
- 28.Erb ED, Hand RK, Steiber AL. SGA scores have poor correlation with serum albumin in obese hemodialysis patients: a secondary analysis. J Ren Nutr 2014; 24:268–271. [DOI] [PubMed] [Google Scholar]
- 29.Espahbodi F, Khoddad T, Esmaeili L. Evaluation of malnutrition and its association with biochemical parameters in patients with end stage renal disease undergoing hemodialysis using subjective global assessment. Nephrourol Mon 2014; 6:e16385. [DOI] [PMC free article] [PubMed] [Google Scholar]
- 30.Chandra RK. Nutrition and the immune system: an introduction. Am J Clin Nutr 1997; 66:460S–463S. [DOI] [PubMed] [Google Scholar]
- 31.Kang DH, Kang EW, Choi SR, et al. Nutritional problems of Asian peritoneal dialysis patients. Perit Dial Int 2003; 23:S58–S64. [PubMed] [Google Scholar]
- 32.Kang DH, Yoon KI, Choi KB, et al. Relationship of peritoneal membrane transport characteristics to the nutritional status in CAPD patients. Nephrol Dial Transplant 1999; 14:1715–1722. [DOI] [PubMed] [Google Scholar]
- 33.Kang EW, Goo YS, Lee SC, et al. Factors affecting malnutrition in continuous ambulatory peritoneal dialysis patients: a cross-sectional study. Korean J Nephrol 2002; 21:943–955. [Google Scholar]
Associated Data
This section collects any data citations, data availability statements, or supplementary materials included in this article.


