Abstract
To evaluate the diagnostic performance of fused diffusion-weighted imaging (DWI) using either unenhanced (UFMR) or early postcontrast T1-weighted imaging (PCFMR) to detect and characterize breast lesions in patients with breast cancer.
This retrospective observational study was approved by institutional review board in our hospital and informed consents were waived. We retrospectively selected 87 consecutive patients who underwent preoperative breast magnetic resonance imaging, including DWI and definitive surgery. Both UFMR and PCFMR were reviewed by 5 radiologists for detection, lesion size, Breast Imaging Reporting and Data System final assessment, the probability of malignancy, lesion conspicuity, and apparent diffusion coefficients.
A total of 129 lesions were identified by at least 2 readers on UFMR or PCFMR. Of 645 potentially detected lesions, there were 528 (82%) with UFMR and 554 (86%) with PCFMR. Malignant lesions or index cancers showed significantly higher detection rates than benign or additional lesions on both UFMR and PCFMR (P < 0.05). Area under the characteristic curves (AUCs) for predicting malignancy ranged 0.927 to 0.986 for UFMR, and 0.936 to 0.993 for PCFMR, which was not significantly different. Lesion conspicuity was significantly higher on PCFMR than UFMR (8.59 ± 1.67 vs 9.19 ± 1.36, respectively; P < 0.05) across 5 readers. Mean intraclass correlation coefficients for lesion size on UFMR and PCFMR were 0.89 and 0.92, respectively.
Detection rates of index malignant lesions were similar for UFMR and PCFMR. Interobserver agreement for final assessments was reliable across 5 readers. Diagnostic accuracy for predicting malignancy with UFMR versus PCFMR was similar, although lesion conspicuity was significantly greater with the latter.
INTRODUCTION
Since its introduction in 1986, dynamic contrast-enhanced magnetic resonance imaging (DCE-MRI) has become the most sensitive method for detecting invasive breast cancer.1–5 A meta-analysis revealed a pooled sensitivity of 90% and specificity of 72%.6 Moreover, the clinical utility of breast MRI screening in high-risk women is greater than mammography and sonography, which shifts the distribution toward lower stages and reduces the number of interval cancers.5,7–9 Breast MRI has been used as a second-line imaging tool to solve diagnostic problems and as an adjuvant screening tool in women at high risk of breast cancer.10 Full diagnostic breast DCE-MRI includes multiple pre and postcontrast sequences, with or without fat suppression, which requires excessive amounts of time and is costly compared with screening mammography. Recently, several studies have shown that an abbreviated breast MRI including a pre, first postcontrast sequence, and subtraction maximum intensity projection had a similar diagnostic accuracy in a screening setting.10,11
The use of gadolinium-based contrast agents has several issues, however, such as a risk of immediate adverse effects, contraindications in patients with impaired renal function and chronic kidney disease, nephrogenic systemic fibrosis as a late complication, and the relatively high cost of contrast agent.12,13 Recent study also described that intravenous gadolinium-based contrast agent exposure was associated with neuronal tissue deposition even in the setting of relatively normal renal function.14 Additionally, in a mass screening setting for breast cancer, the long-term effects of annual or biannual administration of gadolinium contrast agents are unknown.15 On the contrary, diffusion-weighted imaging (DWI) is a useful unenhanced technique that provides microstructural data at the cellular level and can detect changes in the apparent diffusion coefficient (ADC) for tissue water associated with changes in tissues and intracellular structures.16 Recent studies have demonstrated that it has a potential to detect breast cancer and characterize breast lesions.16,17 Technical advances in DWI has allowed for an improved quality of DWI, while readout segmented DWI have the potential to provide improved spatial resolution and reduced distortion compared with conventional single-shot echo-planar imaging (EPI).18 Several studies have evaluated the diagnostic performance of an unenhanced MR protocol that includes DWI and T2-weighted imaging,19–22 and they showed good diagnostic performance compared with screening mammography. However, lesion conspicuity and background conspicuity that result from the breast anatomy may represent concerns for the clinical application of DWI. These limitations may be overcome by fusion imaging using high b-value DWI and T1-weighted imaging, which may provide both anatomic and functional information.23–25 Therefore, we aimed in our present study to evaluate the diagnostic performance of fused DWI using either unenhanced (UFMR) or early postcontrast T1-weighted imaging (PCFMR) to detect and characterize breast lesions in patients with breast cancer.
MATERIALS AND METHODS
Study Population
This retrospective observational study was approved by our institutional review board of Asan Medical Center and the requirement for obtaining informed patient consent was waived due to the retrospective nature of our study. Our focus is on the detection and characterization of breast lesions. Therefore, we chose patients with biopsy-proven malignant masses. We searched reports from picture archiving and communication system reports. From January to July 2014, 436 consecutive patients with biopsy-proven malignant mass who underwent preoperative diagnostic breast MRI at 3T, including DWI and definitive surgery, were enrolled. Among them, we selected only patients who underwent readout segmented echo-planar imaging (rs-EPI), in order to improve the detectability and spatial resolution of DWI. We excluded patients who underwent neoadjuvant chemotherapy (n = 201), who underwent mammotome or excisional biopsy (n = 11), who underwent postoperative screening MRI (n = 108), and who underwent diagnostic MRI for the evaluation of implant or foreign body injection (n = 29). Finally, 87 patients with biopsy-confirmed malignant masses (age range, 29–80 years; mean, 51 years) were included in the analysis (Figure 1).
FIGURE 1.
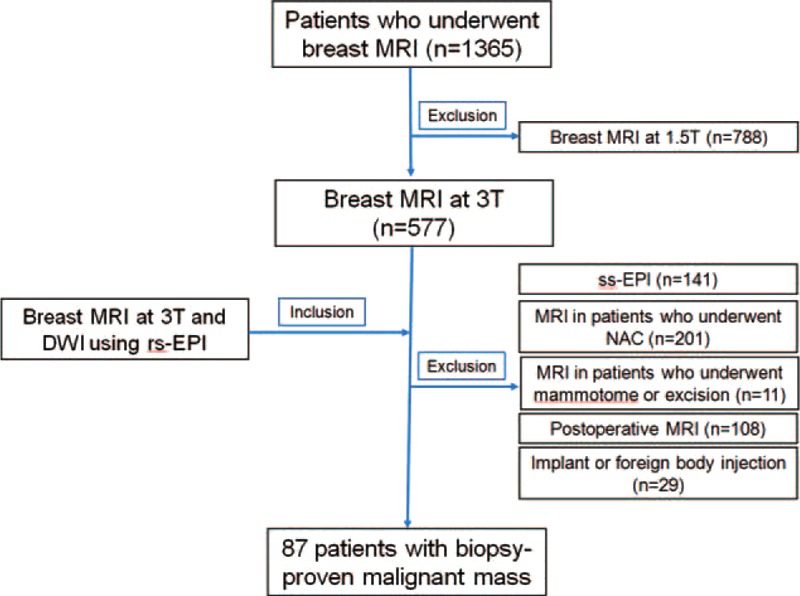
Flow diagram of study population selection.
MRI Acquisition
DCE-MRI was performed using a 3T MR scanner (Skyra, Siemens Medical Solutions, Erlangen, Germany) with a dedicated 18-channel phased-array breast coil (Siemens Medical Solutions). Breast MRI protocol was as follows: an axial T2-weighted sequence (Repetition Time [TR], Echo Time [TE], 1100/131 ms; flip angle, 125°; 1.5-mm thickness without an inter-slice gap; field of view [FOV], 340 × 210 mm2; matrix size, 256 × 416; acquisition time, 134 s) and an axial dynamic 3D T1-weighted spoiled gradient-echo (VIBE, volume interpolated breathhold examination) sequence (TR/TE, 5.6/2.5 ms; flip angle, 12°; matrix size, 384 × 384; FOV, 360 × 360 mm; and 0.9-mm thickness without an inter-slice gap). One unenhanced and five contrast-enhanced acquisitions were acquired and a temporal resolution was 59 s. An intravenous bolus injection of 0.1 mmol/kg gadoterate meglumine (Dotarem, Guerbet, Aulnay-sous-Bois, France) was administered at a flow rate of 2 mL/s using an MR compatible power injector (Spectris; Medrad, Pittsburgh, PA) followed by a 20-mL saline flush.
After dynamic series, DWI was performed using rs-EPI sequence. Diffusion-weighted gradients were applied in 3 orthogonal directions and 2 b-values (0 and 1000 s/mm2) were used. Acquisition parameters were as follows: TR/TE, 8200/57 ms; flip angle, 180°; FOV, 152 × 340 mm2; matrix, 88 × 196; slice thickness, 3 mm; and acquisition time, 4 min 17 s. The spatial resolution of rs-DWI was 1.73 × 1.73 × 3 mm. An ADC value was calculated based on the ADC maps. Whenever we evaluated an identified lesion during review, each radiologist manually drew the regions of interest (ROIs) on 1 representative slice, as reflected in the DCE-MRI. Apparent necrotic or cystic components were avoided by referring to T2-weighted images. The tumor shows generally hyperintense on DWI and hypointense on ADC map. The ROIs were drawn on the b = 1000 s/mm2 image and then transferred onto the ADC map to obtain their ADC values.
Digital Imaging and Communications in Medicine files from DCE-MRI and DWI were transferred to computer software (Syngovia; Siemens Medical Solutions) in order to generate fusion images using high b-value DWI and unenhanced or postcontrast T1WI. A total of 2 sets of fusion MR images were generated in 2 steps. First, UFMR was carried out between high b-value DWI and unenhanced T1WI. Second, PCFMR was conducted between high b-value DWI and early postcontrast T1WI. These fusion images were saved in each case with removal of all information on the patient's identity.
Image Analysis
Five dedicated breast radiologists with 1, 1, 3, 4, and 10 years of breast MRI experience (2 breast fellows with 1 year of breast MRI experience and 3 breast faculty members with 3, 4, and 10 years of breast MRI experience) independently evaluated either UFMR or PCFMR, along with ADC maps, by first assessing UFMR along with ADC maps, and then considering PCFMR along with ADC maps. Each radiologist evaluated 2 sets of MRI data, including UFMR and PCFMR, according to the following Breast Imaging Reporting and Data System (BIRADS) criteria: laterality (right vs left); lesion type on MRI (mass vs nonmass); location (quadrant, subareolar area); detection (no vs yes); size measured by each modality (mm); final assessment category (2, 3, 4, and 5); the probability of malignancy using a 100-point scale; and lesion conspicuity using a 10-point scale. Additionally, each reader obtained ADC values for each of the lesions detected by drawing an ROI in 1 representative slice of a lesion. All of these data were entered onto an Excel spread sheet. Each reader reviewed the 2 datasets at 2 weeks interval, so that readers could not be influenced by their review of the other dataset. First, the images of UFMR were read, and then those of PCFMR were read.
Data Review and Statistical Analysis
For data analysis, UFMR and PCFMR findings were compared by 1 radiologist (HJS with 10 years of experience in breast MRI); all lesions were matched and assigned lesion numbers across 5 readers. To reduce the effects of false-positive detection, reproducibility and κ statistics were only considered for those lesions identified by at least 2 readers. The consensus description across 5 readers identifying any given lesion was considered as the reference standard for that lesion. “Consensus” was defined as a lesion detected by at least 2 readers. Statistical analyses were performed using SPSS version 19.0 (SPSS, Inc., Chicago, IL).
The primary aim of our present study was to evaluate the reproducibility of identifying the characteristics of various lesions, including lesion detection, lesion size, and lesion type, on UFMR and PCFMR across 5 readers in a diagnostic setting. Initially, summary tables and simple frequencies were used to explore data and identify outliers. An intraclass correlation coefficient (ICC) was calculated for continuous variables, such as lesion size, and the ADC values between UFMR and PCFMR. To measure interobserver agreement on lesion detection and BIRADS final assessments across 5 readers, κ statistics were used. Any missing values were excluded. Note that κ values denote the following: 1.0, perfect agreement; 0.81 to 0.99, almost perfect agreement; 0.61 to 0.80, substantial agreement; 0.41 to 0.60, moderate agreement; 0.21 to 0.40, fair agreement; and ≤0.20, slight agreement.26 The χ2 test was used to compare the detection rate between the following criteria: mass versus nonmass, benignity versus malignancy, and main versus additional lesion. A paired t test was used to compare lesion conspicuity between UFMR and ECFMR. Receiver operating characteristic (ROC) curve analysis was performed to evaluate the diagnostic performance of identifying the probability of malignancy on both UFMR and PCFMR. A 2-sided 95% confidence interval (CI) was used to estimate the ICC. Two-tailed statistical tests were always used, and P values < 0.05 were considered statistically significant.
RESULTS
Patients
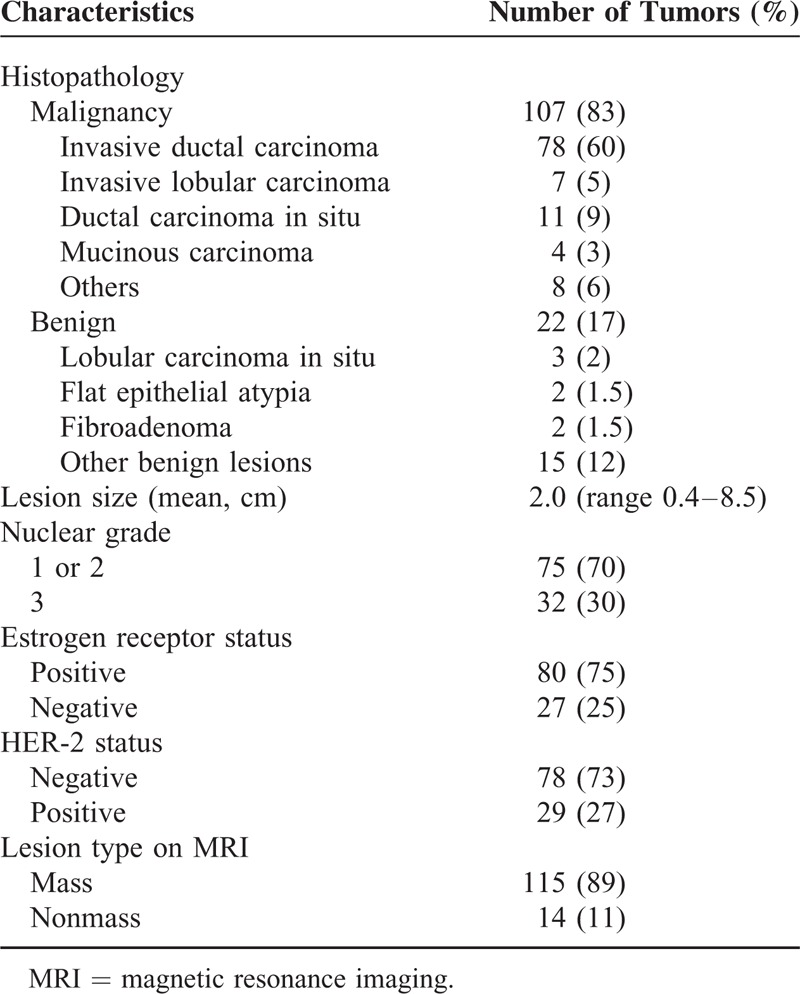
A total of 136 enhancing lesions were identified by conventional DCE-MRI in the 87 study patients. Among them, 7 lesions, including 3 additional suspicious lesions and 4 benign lesions, were not detected on either fused unenhanced or early postcontrast T1-weighted DWI by any of 5 readers. The 3 additional suspicious lesions included two 0.6 cm invasive ductal carcinomas and one 0.4 cm ductal carcinoma in situ (DCIS). Finally, we included 129 lesions in 87 patients that were detected by at least 2 readers, which were composed of 107 malignant lesions (83%) and 22 benign lesions (17%). Among the107 malignant lesions, 87 (81%) were an index cancer and 20 (19%) were additional malignant lesions. A summary of the characteristics of the 129 lesions in 87 patients is provided in Table 1. The size of the benign lesions was significantly smaller than that of the malignant lesions (0.77 ± 0.28 cm vs 2.05 ± 1.32 cm, P < 0.001).
TABLE 1.
Characteristics of the 129 Lesions in the 87 Patients With Breast Cancer
Lesion Detection
Among 645 of potential lesion detections in our study series, 528 (82%) detections were made using UFMR and 554 (86%) detections were made using PCFMR. For UFMR, 4 (3%) potential lesions were missed by all 5 readers, 7 (5%) were only detected by 1 reader, 15 (12%) were detected by 2 readers, 8 (6%) were detected by 3 readers, 7 (5%) were detected by 4 readers, and 88 (68%) were detected by all 5 readers. For PCFMR, 22 (17%) potential lesions were detected by 2 readers, 9 (7%) were detected by 3 readers, 8 (6%) were detected by 4 readers, and 90 (70%) were detected by all 5 readers. The detection rates of each of the 5 readers are summarized in Table 2.
TABLE 2.
Lesion Detection and Conspicuity on Both Fused Unenhanced T1-Weighted DWI and Fused Early Postcontrast T1-Weighted DWI in Patients With Breast Cancer

For the 107 malignant lesions in our patient population, 87 (81%) index cancers were detected by all 5 readers (Figure 2) and the other 20 (19%) additional suspicious lesions were detected by 4 or less readers on UFMR (Figure 3). On PCFMR, 88 (82%) malignant lesions, including 87 index cancer lesions, were detected by all 5 readers, while the remaining 19 (18%) additional suspicious lesions were detected by 4 or less readers (Figure 4).
FIGURE 2.
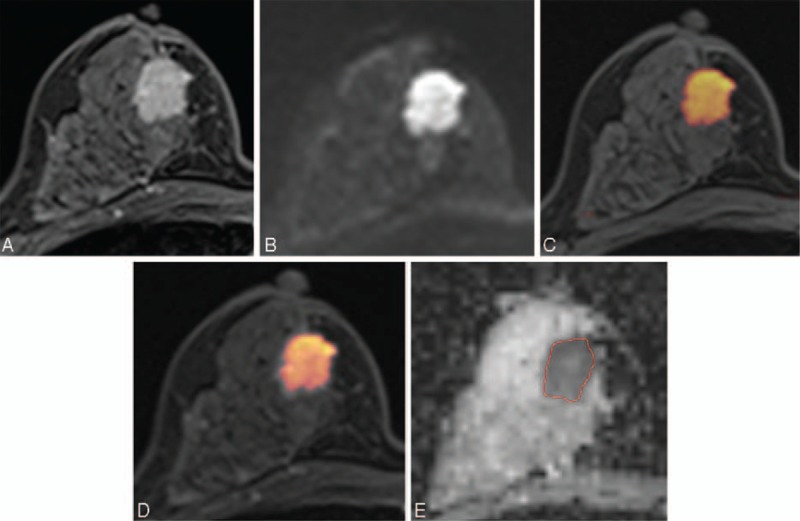
Images of a 45-y-old patient with an invasive ductal carcinoma of the right breast. (A) Axial dynamic-contrast enhanced MRI shows a 2 cm-enhancing mass in the right breast. (B) Diffusion-weighted image at 1000 s/mm2 shows a high-signal intensity mass in the right breast. (C, D) For the corresponding lesion, axial UFMR (C) and PCFMR (D) also show a red-colored mass in the right breast. (E) ADC map shows a mass with low ADC value in the right breast of 0.844 × 10⁻³ mm2/s. Definitive surgery confirmed a 1.9-cm invasive ductal carcinoma. ADC = apparent diffusion coefficient, MRI = magnetic resonance imaging, PCFMR = fused diffusion-weighted imaging using early postcontrast T1-weighted imaging, UFMR = fused diffusion-weighted imaging using unenhanced T1-weighted imaging.
FIGURE 3.
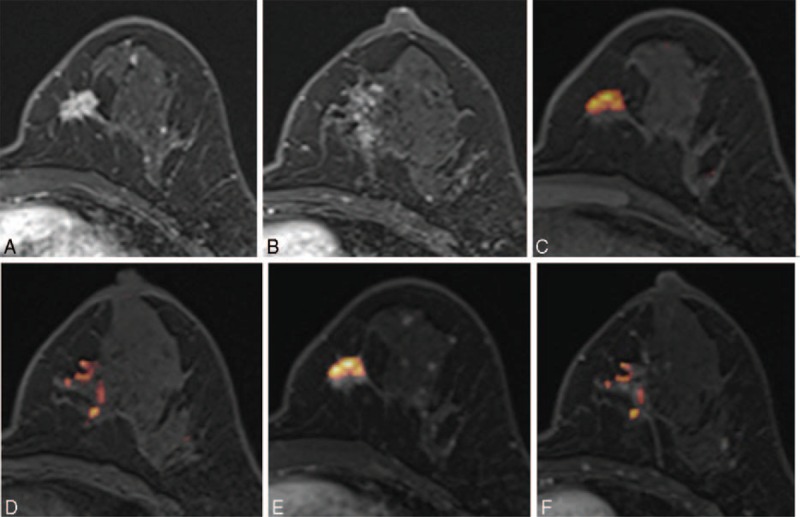
Images of a 44-y-old patient with an invasive ductal carcinoma of the left breast. (A, B) Axial DCE-MR images show an irregular enhancing mass in the lower inner quadrant and a focal nonmass enhancement at the level of the nipple of the left breast. (C, D) UFMR image shows a red-colored main mass, which was detected by all 5 readers, and a focal area of a red-colored nonmass lesion, which was detected by only 2 readers. (E, F) PCFMR image also shows a red-colored main mass and focal area of a red-colored nonmass lesion, which was detected by 3 readers. Surgery confirmed lobular carcinoma in situ and flat epithelial atypia. DCE-MR = dynamic contrast-enhanced magnetic resonance, PCFMR = fused diffusion-weighted imaging using early postcontrast T1-weighted imaging, UFMR = fused diffusion-weighted imaging using unenhanced T1-weighted imaging.
FIGURE 4.
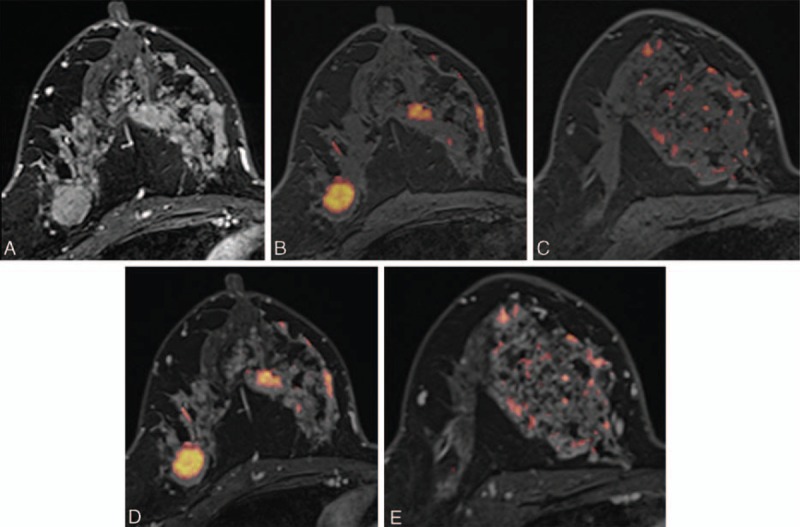
Images of a 46-y-old woman with an invasive ductal carcinoma of the right breast. (A) Axial DCE-MR image shows an irregular enhancing mass in the outer portion of the right breast, which was proven to be an invasive ductal carcinoma. Segmental nonmass clumped enhancement was also present in the upper inner quadrant of the right breast, which was proven to be a 12-cm DCIS. (B, C) UFMR images show a red-colored main mass, which was detected by all 5 readers. A segmental red-colored nonmass lesion was detected by 3 readers. (D, E) For the corresponding lesion, PCFMR images also show a red-colored main mass, which was detected by all 5 readers. The segmental red-colored nonmass lesion was also detected by all 5 readers. DCE-MR = dynamic contrast-enhanced magnetic resonance, DCIS = ductal carcinoma in situ, PCFMR = fused diffusion-weighted imaging using early postcontrast T1-weighted imaging, UFMR = fused diffusion-weighted imaging using unenhanced T1-weighted imaging.
Our null hypothesis for lesion detection was that there were no significant differences for lesion detection between UFMR and PCFMR. Both the lesion and cancer detection rates were higher on PCFMR than on UFMR, but this was only significantly different for 1 reader (Table 2). Only reader 2 showed a significantly higher lesion detection rate on PCFMR than on UFMR (P = 0.002), whereas the overall cancer detection rate was not significantly different between both modalities across 5 readers. By UFMR, the detection rate ranged from 14% to 73% for benign lesions and from 88% to 93% for malignant lesions, whereas the detection rate on PCFMR ranged from 14% to 95% for benign lesions and from 89% to 95% for malignant lesions. For the additional enhancing lesions, the detection rate ranged from 28% to 73% on UFMR and from 28% to 93% on PCFMR. Notably, lesion conspicuity was significantly greater on PCFMR than on UFMR across all 5 readers (Table 2). Three breast faculty members (reader 1–3) showed higher overall lesion detection rates than breast fellows (readers 4 and 5), whereas cancer detection rates were similar between faculty members and breast fellows (Table 2).
Agreement
Regarding agreement on the lesion size between pathology and imaging, ICC ranged from 0.83 to 0.91 (mean, 0.89; 95% CI, 0.86–0.92) on UFMR and from 0.87 to 0.93 (mean, 0.90; 95% CI, 0.87–0.93) on PCFMR. The mean percentage agreement for lesion detection was 84% (range, 81–95%) on UFMR and 83% (range, 73–95%) on PCFMR across all 5 readers. The κ value with quadratic weighting for interobserver agreement of lesion detection was 0.78 (range, 0.56–0.93) on UFMR and 0.63 (range, 0.54–0.91) on PCFMR. The κ value with quadratic weighting for interobserver agreement of BIRADS final assessments was 0.73 (range, 0.51–0.91) on UFMR and 0.77 (range, 0.59–0.92) on PCFMR.
In our present patient cohort, there were 115 (89%) masses and 14 (11%) nonmass lesions. Using the χ2 test, we detected no significant differences for lesion detection according to lesion type (mass vs nonmass) on both UFMR and PCFMR across all 5 readers (for all, P > 0.05). The percentage agreement for lesion type assessments ranged from 93% to 97% (mean, 95%) across all 5 readers. For ADC measurements on an ADC map, ICCs for tumor ADC values ranged from 0.72 to 0.94 and the average ICC was 0.91 (95% CI, 0.89–0.94), which indicated high interobserver agreement. The area under the ROC curve (AUC) of ADC measurements for predicting malignancy was 0.76 (95% CI, 0.67–0.83), 0.75 (95% CI, 0.66–0.82), 0.76 (95% CI, 0.68–0.84), 0.70 (95% CI, 0.60–0.79), and 0.66 (95% CI, 0.56–0.76) for readers 1 to 5, respectively.
Diagnostic Performance
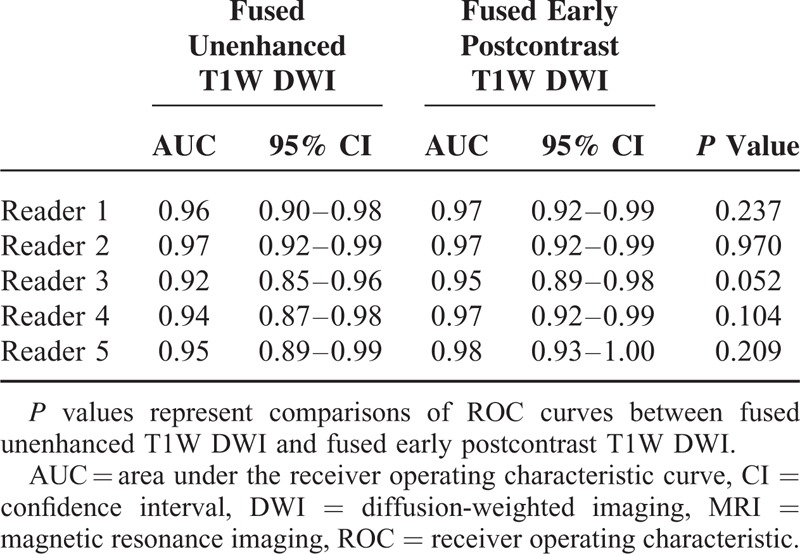
A comparison of diagnostic performance is summarized in Tables 3 and 4. UFMR showed sensitivity of 85% to 92%, specificity of 82% to 96%, and accuracy of 87% to 91%, whereas PCFMR showed a sensitivity of 89% to 93%, specificity of 86% to 91%, and accuracy of 89% to 92% (Table 3). In addition, UFMR showed positive predictive value (PPV) of 96% to 99% and negative predictive value (NPV) of 57% to 68%, whereas PCFMR showed PPV of 97% to 98% and NPV of 63% to 70%. No significant differences were detected for the diagnostic performance between these 2 modalities, although NPV of PCFMR was slightly higher than UFMR. AUCs for the prediction of malignancy ranged from 0.92 to 0.97 on UFMR and from 0.95 to 0.98 on PCFMR. The AUCs for predictions of malignancy were not significantly different between the 2 modalities (Table 4).
TABLE 3.
Diagnostic Performance of Fused Unenhanced T1-Weighted DWI and Fused Early Postcontrast T1-Weighted DWI

TABLE 4.
Diagnostic Performance Based on the Probability of Malignancy and Lesion Conspicuity of Lesions Detected Using Each Fusion MRI Modality
DISCUSSION
Recently, only a few studies have characterized an abbreviated breast MRI protocol, which has been associated with more rapid image acquisition and interpretation.10,11 An unenhanced breast MRI protocol might also be helpful for breast cancer screening, but this has also been poorly characterized. In our present proof-of-concept multiple reader study, UFMR showed a similar diagnostic performance and lesion detection rate to PCFMR, although the former showed less lesion conspicuity. Most lesions that were missed on UFMR were either benign or additional small suspicious lesions. UFMR had a sensitivity of 85% to 92% and specificity of 82% to 96%, whereas PCFMR had sensitivity of 89% to 93% and specificity of 86% to 91%. Several previous studies have investigated the roles of unenhanced breast MRI and reported that a protocol that combined DWI and T2-weighted imaging showed similar sensitivity, but improved specificity compared with dynamic contrast-enhanced MRI.20–22,26 In the general patient population, an unenhanced breast MRI protocol could be favorably compared with screening mammography.19–21
Based on DCE-MRI, considerable overlap has been shown to exist between benign and malignant lesions.3 In equivocal circumstances, an additional feature such as ADC on DWI could be helpful to reduce the number of biopsies.16–22,26–28 Trimboli et al22 showed that DWI plays an important role in cancer detection, yielding increasing sensitivity from 59% to 62% (T1-weighted image) to 70% to 76% (T1-weighted image plus DWI). Among unenhanced sequences, DWI provides information about the degree of water molecule diffusion, which is inversely correlated with both tissue cellularity and cell membrane integrity.19 One significant advantage is its high sensitivity for detecting breast cancer without requiring the injection of contrast material.20–22 A recent meta-analysis showed an overall sensitivity of 84% (82–87%) and specificity of 79% (75–82%).29
Several recent studies have examined the role of fusion MRI using both high b-value DWI and T2-weighted imaging, involving the abdomen, pelvis, and breast.23–26 The use of fusion MRI using high b-value DWI and T2-weighted imaging may overcome the limitations of DWI by simultaneously providing both anatomical and functional information about a tumor.26,27 Our present study differs from these previous studies in 1 aspect. We used a T1-weighted gradient echo sequence to take advantage of its high spatial resolution to obtain morphological data instead of T2-weighted imaging. Trimboli et al22 reported that unenhanced T1-weighted imaging showed 59% to 62% sensitivity with high specificity (92%) and a good PPV (79%). In our present study, UFMR showed a sensitivity of 85% to 92%, specificity of 82% to 96%, PPV of 96% to 99%, and NPV of 57% to 68%, which was higher than that reported by Trimboli et al,22 and was not significantly different compared with PCFMR. However, the lesion conspicuity of UFMR was significantly lower than that of PCFMR. By contrast, the time required for image acquisition was shorter for UFMR (∼5 min) than for PCFMR (∼10 min). Additionally, the unenhanced protocol had the advantage of not using contrast material.
In our present study, we also tried to confirm whether the diagnostic performance of UFMR was similar to that of PCFMR as a replacement for DCE-MRI with DWI. For both overall lesion and cancer detection rate, we found no significant differences between the 2 modalities, although lesion conspicuity was higher in PCFMR compared with UFMR. Most of the missed lesions on UFMR were either benign or additional suspicious lesions. When we considered the “consensus” lesions detected by at least 2 readers, the number of the missed lesions was 11 (8.5%) only on UFMR and the mean size of the missed lesion was 0.9 cm (range, 0.4–2.1 cm). Therefore, all index cancers were detected using the unenhanced sequence (UFMR). Additionally, AUCs for predicting malignancy were not significantly different between the 2 modalities. Therefore, we suggest that fused unenhanced T1-weighted DWI could replace DCE-MRI with DWI as a screening tool. As for the lesion type, invasive cancers are more conspicuous on DCE-MRI than noninvasive cancers such as DCIS and invasive cancers tend to present as discrete masses. However, our study showed that there was no significant difference for lesion detection according to lesion type on both UFMR and PCFMR across all 5 readers (P > 0.05 for all).
There were several limitations to our present study. First, we included a limited number of patients and adopted a retrospective study design. However, we did include consecutive uniform patients group who underwent preoperative breast MRI using a 3T MR scanner during the study period and definite surgery. Second, we evaluated only the preoperative breast MRI, which may induce selection bias. In addition, this may affect the image evaluation by radiologists. Third, we did not evaluate the diagnostic performance of DCE-MRI and DWI alone across our 5 readers because our study focused on comparisons of the diagnostic performance between UFMR and PCFMR. Fourth, fused DWI using both b = 1000 images and ADC maps were possible; however, we did not evaluate these 2 sets of fused images. Further study is needed to confirm our results. Fifth, the diagnostic performance of the fusion images may be degraded by misregistration between the DWI and T1WI images, which arises because the slice thickness and in-plane voxel size are larger for the DWI than for the T1WI series. In order to reduce this effect, we performed nonrigid image registration in order to register these 2 images using the dedicated software (Syngovia).
In conclusion, our current findings indicate that the detection of index malignant lesions by UFMR is similar to that of PCFMR, and the interobserver agreement of final assessments was found to be reliable across all 5 readers. The diagnostic performance for predicting malignancy was similar between with UFMR and PCFMR, although lesion conspicuity was significantly higher on PCFMR.
Footnotes
Abbreviations: ADC = apparent diffusion coefficient, AUC = area under the ROC curve, BIRADS = Breast Imaging Reporting and Data System, CI = confidence interval, DCE-MRI = dynamic contrast-enhanced magnetic resonance imaging, DCIS = ductal carcinoma in situ, DICOM = digital imaging and communications in medicine, DWI = diffusion-weighted imaging, EPI = echo-planar imaging, FOV = field of view, ICC = intraclass correlation coefficient, MIP = maximum intensity projection, NPV = negative predictive value, PCFMR = fused diffusion-weighted imaging using early postcontrast T1-weighted imaging, PPV = positive predictive value, ROC curve = receiver operating characteristic curve, ROI = region of interest, rs-EPI = readout segmented EPI, UFMR = fused diffusion-weighted imaging using unenhanced T1-weighted imaging
The authors have no funding and conflicts of interest to disclose.
REFERENCES
- 1.Heywang SH, Hahn D, Schmidt H, et al. MR imaging of the breast using gadolinium—DTPA. J Comput Assist Tomogr 1986; 10:199–204. [DOI] [PubMed] [Google Scholar]
- 2.Morrow M, Waters J, Morris E. MRI for breast cancer screening, diagnosis, and treatment. Lancet 2011; 378:1804–1811. [DOI] [PubMed] [Google Scholar]
- 3.Bluemke DA, Gatsonis CA, Chen MH, et al. Magnetic resonance imaging of the breast prior to biopsy. JAMA 2004; 292:2735–2742. [DOI] [PubMed] [Google Scholar]
- 4.Pediconi F, Miglio E, Telesca M, et al. Effect of preoperative breast magnetic resonance imaging on surgical decision making and cancer recurrence rates. Invest Radiol 2012; 47:128–135. [DOI] [PubMed] [Google Scholar]
- 5.Lehman CD, Gatsonis C, Kuhl CK, et al. MRI evaluation of the contralateral breast in women with recently diagnosed breast cancer. N Engl J Med 2007; 356:1295–1303. [DOI] [PubMed] [Google Scholar]
- 6.Peters NH, Borel Rinkes IH, Zuithoff NP, et al. Meta-analysis of MR imaging in the diagnosis of breast lesions. Radiology 2008; 246:116–124. [DOI] [PubMed] [Google Scholar]
- 7.Warner E, Plewes DB, Hill KA, et al. Surveillance of BRCA1 and BRCA2 mutation carriers with magnetic resonance imaging, ultrasound, mammography, and clinical breast examination. JAMA 2004; 292:1317–1325. [DOI] [PubMed] [Google Scholar]
- 8.Kriege M, Brekelmans CT, Boetes C, et al. Efficacy of MRI and mammography for breast-cancer screening in women with a familial or genetic predisposition. N Engl J Med 2004; 351:427–437. [DOI] [PubMed] [Google Scholar]
- 9.Warner E, Hill K, Causer P, et al. Prospective study of breast cancer incidence in women with a BRCA1 or BRCA2 mutation under surveillance with and without magnetic resonance imaging. J Clin Oncol 2011; 29:1664–1669. [DOI] [PMC free article] [PubMed] [Google Scholar]
- 10.Kuhl CK, Schrading S, Strobel K, et al. Abbreviated breast magnetic resonance imaging (MRI): first postcontrast subtracted images and maximum-intensity projection—a novel approach to breast cancer screening with MRI. J Clin Oncol 2014; 32:2304–2310. [DOI] [PubMed] [Google Scholar]
- 11.Mango VL, Morris EA, Dershaw DD, et al. Abbreviated protocol for breast MRI: are multiple sequences needed for cancer detection? Eur J Radiol 2015; 84:65–70. [DOI] [PubMed] [Google Scholar]
- 12.Hunt CH, Hartman RP, Hesley GK. Frequency and severity of adverse effects of iodinated and gadolinium contrast materials: retrospective review of 456,930 doses. Am J Roentgenol 2009; 193:1124–1127. [DOI] [PubMed] [Google Scholar]
- 13.Thomsen HS. Nephrogenic systemic fibrosis: a serious late adverse reaction to gadodiamide. Eur Radiol 2006; 16:2619–2621. [DOI] [PMC free article] [PubMed] [Google Scholar]
- 14.McDonald RJ, McDonald JS, Kallmes DF, et al. Intracranial gadolinium deposition after contrast-enhanced MR imaging. Radiology 2015; 275:772–782. [DOI] [PubMed] [Google Scholar]
- 15.Sardanelli F. Abujudeh HH, Bruno MA. Evidence-based radiology and its relationship with quality. Quality and Safety in Radiology. New York: Oxford University Press; 2012. 256–290. [Google Scholar]
- 16.Kul S, Cansu A, Alhan E, et al. Contribution of diffusion-weighted imaging to dynamic contrast-enhanced MRI in the characterization of breast tumors. Am J Roentgenol 2011; 196:210–217. [DOI] [PubMed] [Google Scholar]
- 17.Partridge SC, Mullins CD, Kurland BF, et al. Apparent diffusion coefficient values for discriminating benign and malignant breast MRI lesions: effects of lesion type and size. Am J Roentgenol 2010; 194:1664–1673. [DOI] [PubMed] [Google Scholar]
- 18.Singer L, Wilmes LJ, Saritas EU, et al. High-resolution diffusion-weighted magnetic resonance imaging in patients with locally advanced breast cancer. Acad Radiol 2012; 19:526–534. [DOI] [PMC free article] [PubMed] [Google Scholar]
- 19.Kuroki-Suzuki S, Kuroki Y, Nasu K, et al. Detecting breast cancer with non-contrast MR imaging: combining diffusion-weighted and STIR imaging. Magn Reson Med Sci 2007; 6:21–27. [DOI] [PubMed] [Google Scholar]
- 20.Baltzer PA, Benndorf M, Dietzel M, et al. Sensitivity and specificity of unenhanced MR mammography (DWI combined with T2-weighted TSE imaging, ueMRM) for the differentiation of mass lesions. Eur Radiol 2010; 20:1101–1110. [DOI] [PubMed] [Google Scholar]
- 21.Yabuuchi H, Matsuo Y, Sunami S, et al. Detection of non-palpable breast cancer in asymptomatic women by using unenhanced diffusion-weighted and T2-weighted MR imaging: comparison with mammography and dynamic contrast-enhanced MR imaging. Eur Radiol 2011; 21:11–17. [DOI] [PubMed] [Google Scholar]
- 22.Trimboli RM, Verardi N, Cartia F, et al. Breast cancer detection using double reading of unenhanced MRI including T1-weighted, T2-weighted STIR, and diffusion-weighted imaging: a proof of concept study. Am J Roentgenol 2014; 203:674–681. [DOI] [PubMed] [Google Scholar]
- 23.Tsushima Y, Takano A, Taketomi-Takahashi A, et al. Body diffusion-weighted MR imaging using high b-value for malignant tumor screening: usefulness and necessity of referring to T2-weighted images and creating fusion images. Acad Radiol 2007; 14:643–650. [DOI] [PubMed] [Google Scholar]
- 24.Park JJ, Kim CK, Park SY, et al. Parametrial invasion in cervical cancer: fused T2-weighted imaging and high-b-value diffusion-weighted imaging with background body signal suppression at 3 T. Radiology 2015; 274:734–741. [DOI] [PubMed] [Google Scholar]
- 25.Mir N, Sohaib SA, Collins D, et al. Fusion of high b-value diffusion-weighted and T2-weighted MR images improves identification of lymph nodes in the pelvis. J Med Imaging Radiat Oncol 2010; 54:358–364. [DOI] [PubMed] [Google Scholar]
- 26.Nechifor-Boila IA, Bancu S, Buruian M, et al. Diffusion weighted imaging with background body signal suppression/T2 image fusion in magnetic resonance mammography for breast cancer diagnosis. Chirurgia (Bucur) 2013; 108:199–205. [PubMed] [Google Scholar]
- 27.Stadlbauer A, Bernt R, Gruber S, et al. Diffusion-weighted MR imaging with background body signal suppression (DWIBS) for the diagnosis of malignant and benign breast lesions. Eur Radiol 2009; 19:2349–2356. [DOI] [PubMed] [Google Scholar]
- 28.Tan SL, Rahmat K, Rozalli FI, et al. Differentiation between benign and malignant breast lesions using quantitative diffusion-weighted sequence on 3 T MRI. Clin Radiol 2014; 69:63–71. [DOI] [PubMed] [Google Scholar]
- 29.Chen X, Li WL, Zhang YL, et al. Meta-analysis of quantitative diffusion-weighted MR imaging in the differential diagnosis of breast lesions. BMC Cancer 2010; 10:693. [DOI] [PMC free article] [PubMed] [Google Scholar]


