Abstract
The aim of the study was to investigate diagnosis efficacy of dynamic contrast-enhanced MRI (DCE-MRI) and diffusion-weighted MRI (DW-MRI) in Crohn's disease (CD). To find out the correlations between functional MRI parameters including Ktrans, Kep, Ve, Vp, and apparent diffusion coefficient (ADC) with a serologic biomarker. The relationships between pharmacokinetic parameters and ADC were also studied.
Thirty-two patients with CD (22 men, 10 women; mean age: 30.5 years) and 18 healthy volunteers without any inflammatory disease (10 men, 8 women; mean age, 34.11 years) were enrolled into this approved prospective study. Pearson analysis was used to evaluate the correlation between Ktrans, Kep, Ve, Vp, and C-reactive protein (CRP), ADC, and CRP respectively. The diagnostic efficacy of the functional MRI parameters in terms of sensitivity and specificity were analyzed by receiver operating characteristic (ROC) curve analyses. Optimal cut-off values of each functional MRI parameters for differentiation of inflammatory from normal bowel were determined according to the Youden criterion.
Mean value of Ktrans in the CD group was significantly higher than that of normal control group. Similar results were observed for Kep and Ve. On the contrary, the ADC value was lower in the CD group than that in the control group. Ktrans and Ve were shown to be correlated with CRP (r = 0.725, P < 0.001; r = 0.533, P = 0.002), meanwhile ADC showed negative correlation with CRP (r = −0.630, P < 0.001). There were negative correlations between the pharmacokinetic parameters and ADC, such as Ktrans to ADC (r = −0.856, P < 0.001), and Ve to ADC (r = −0.451, P = 0.01). The area under the curve (AUC) was 0.994 for Ktrans (P < 0.001), 0.905 for ADC (P < 0.001), 0.806 for Ve (P < 0.001), and 0.764 for Kep (P = 0.002). The cut-off point of the Ktrans was found to be 0.931 min–1. This value provided the best trade-off between sensitivity (93.8%) and specificity (100%). The best cut-off point of ADC was 1.11 × 10⁻³ mm2/s. At this level, sensitivity was 100% and specificity was 68.8%.
DCE-MRI and DW-MRI were helpful in the diagnosis of CD. Quantitative MRI parameters could be used to assess the severity of inflammation. The relationships between pharmacokinetic parameters (Ktrans and Ve) and ADC reflected microstructure and microcirculation of CD to some extent.
INTRODUCTION
Crohn's disease (CD) is a chronic, relapsing inflammatory disorder with unknown causes and usually occurred in early adulthood. It is characterized by multiple discontinuous areas of bowel inflammation distributing throughout the gastrointestinal tract, most commonly situated at ileocecal, and often complicated by strictures, abscesses, and fistula formations.1–4
Inflammatory and bacterial triggers stimulate C-reactive protein (CRP) production by mesenteric adipocytes in CD.5 CRP is a serologic acute-phase marker, and objective measures of inflammation in CD.6,7 Compared with clinical disease activity index, CRP is considered to be more useful in terms of evaluating the severity of inflammatory activity8 and is used to assess the clinical treatment by observing the changes of CRP level in numerous studies.9–11
Medical imaging plays a key role in measuring CD activities and identifying the complications. Magnetic resonance imaging (MRI) is regarded as the optimal imaging modality for assessment of CD. Compared with morphological imaging, functional imaging techniques such as dynamic contrast-enhanced MRI (DCE-MRI) and diffusion-weighted MRI (DW-MRI) offer more physiological information and have advantages in extraction of lesion mechanisms.
DW-MRI describes the local microstructural characteristics of water diffusion which could be quantified using the parameter of apparent diffusion coefficient (ADC). It enables the detection of microscopic change in the tissue structure and physiology of cellularity, cell membrane integrity, and lipophilicity. This method imaging tool has been applied in the assessment of bowel inflammation in CD in many studies.12–14
DCE-MRI involves the serial acquisition of T1-weighted images before, during, and after the injection of a paramagnetic contrast agent.15,16 The majorities of MRI contrast agents distribute into the vascular space and extravascular extracellular space (EES) and are excluded from the intracellular space. Quantitative T1-weighted images are used to estimate the contrast agent concentration in the vascular and EES compartments over time. The enhancement curve generated by DCE-MRI can be analyzed to assess pharmacokinetic parameters related to vascularity and volume fractions, such as Ktrans (volume transfer coefficient reflecting vascular permeability), Kep (flux rate constant), Vp (plasma volume fractions), and Ve (extracellular volume ratio reflecting vascular permeability).17 Currently, DCE-MRI has been used for evaluating the treatment efficacy for cancers such as glioblastoma,18 nasopharyngeal carcinomas,19 breast cancer,20,21 pancreatic cancer,22 bladder cancer,23 prostate cancer,24 and cervical cancer.25 Meanwhile, some studies have investigated the relation between inflammation and angiogenesis using DCE-MRI.26,27
These 2 functional MRI techniques are routinely used in many radiological departments. Combination of DW-MRI and DCE-MRI in diagnosis and assessment therapy response for solid tumor has become hotspot.24,28–31 To our knowledge, there is no relevant literature about the studies using combination of these 2 methods in CD currently. Thus, in this paper, we present a preliminary study of CD by DW-MRI and DCE-MRI together with standard clinical parameters.
MATERIAL AND METHODS
This prospective research was conducted from October 1, 2014, to April 30, 2015. Thirty-two patients with CD (22 men and 10 women; ages range 18 to 76 years, mean ± SD = 30.50 ± 11.64 years) were enrolled into the study. For comparison, 18 volunteers without inflammatory bowel disease and intestinal tumors (10 men and 8 women; ages range 19 to 53 years, mean ± SD = 34.11 ± 11.29 years) constituted control group (Table 1). Inclusion criteria of CD group: (1) accepted capsule enteroscopy and colonoscopy within the past 72 hours; (2) CD diagnosis confirmed by endoscopy and pathology; (3) only 1 lesion, and located at the ileocecal; (4) ability to undergo MRI without conscious sedation. This study was approved by the institutional review board, with informed patient consent.
TABLE 1.
Comparisons of MRI Parameters Between CD and Control Group

Trial Design
Serum samples were collected for analysis of CRP and assessment the inflammatory activity of CD patients before MRI scanning. No special preparation other than no intake of solid foods was required 6 hours before MRI examination. All subjects were required to drink 300 mL of mannitol (2.5%) every 10 minutes until a total of 1.5 L has been consumed within 60 minutes. Before the scan beginning, all individuals were given intravenous administration of 20 mg of scopolamine-N-butyl bromide (Busco-pan; Boehringer Ingelheim, Ingelheim, Germany) immediately to reduce bowel peristalsis motion artifacts.
All subjects in CD and control groups underwent MRI examination including conventional sequences, DW-MRI, and DCE-MRI.
MRI Study Protocol
MRI scan was performed using a 3.0 T clinical scanner (Signa HDxt, GE Healthcare) equipped with abdominal-pelvic coil (8 radiofrequency channels). Subjects were scanned in the supine position. Conventional sequences and scan parameters were: (1) coronal T2 (single shot fast spin-echo, SSFSE) through the abdomen and pelvis with breath-holding (Tck = 5 mm, spacing = 1 mm; TR = 2800 ms, TE = 70 ms); (2) axial T2 fast spin-echo fat-suppressed images covering the abdomen and pelvis, free-breathing with navigator triggering (Tck = 4 mm, spacing = 2 mm; TR = 12,000 ms, TE = 90 ms); (3) axial T1 LAVA-Flex Mask through the abdomen and pelvis with breath-holding (Tck = 4 mm, spacing = 0 mm; TR = 4500 ms, TE = 1.7 ms).
DW-MRI was performed with the following parameters: axial images; Tck = 4 mm, spacing = 0 mm; TR = 6600 ms, TE = min; matrix = 128 × 128–224; FOV = 40 cm; flip angle = 90°; b value = 0 and 600 s/mm2; diffusion of direction, 3 in 1; number of signals acquired = 6; scan layers = 16.
DCE-MRI protocol included 2 steps; (1) 5 different flip angles (4°, 6°, 8°, 10°, and 12°) T1-weighted 3D-LAVA sequences to determine the T1 relaxation time in the blood and tissue for T1 mapping. (2) Dynamic Contrast Enhanced MRI using 3D T1-weighted LAVA sequence with a flip angle of 12°. After 3 precontrast acquisitions, Gadodiamide (OmniScan, GE Healthcare, Ireland) was intravenously injected (0.2 mmol/kg) with a rate of 3.0 mL/s. Then, 15 mL of saline was flushed with the same rate. Scan parameters were following: axial images; TR = 2.9 ms, TE = 1.1 ms; matrix = 224 × 160; FOV = 42 cm; scan layers = 52. The temporal resolution was 7 s and the total scan time was 3 min 30 s including 30 phases.
To facilitate the future comparisons between DW-MRI and DCE-MRI, the ileocecal was chosen as scanning reference slice.
Interpretation of MRI Measurements
Pharmacokinetic parameters were calculated using a noncommercial software (Omni-Kinetics, GE Healthcare). First, the individual artery input function (AIF) was obtained from a region of interest (ROI) drawn on the abdominal aorta located in close proximity to the ileocecal (Figure 1A and D). Second, the extended Tofts liner model was chosen for fitting of the tissue response curves.32,33 The pharmacokinetic parameters such as Ktrans, Kep, Ve, and Vp were generated as color maps (Figure 2). ROI (30–50 mm2) for these pharmacokinetic parameters (Ktrans, Kep, Ve, and Vp) was placed on the maximal enhancing region of ileocecal (Figure 1B).
FIGURE 1.
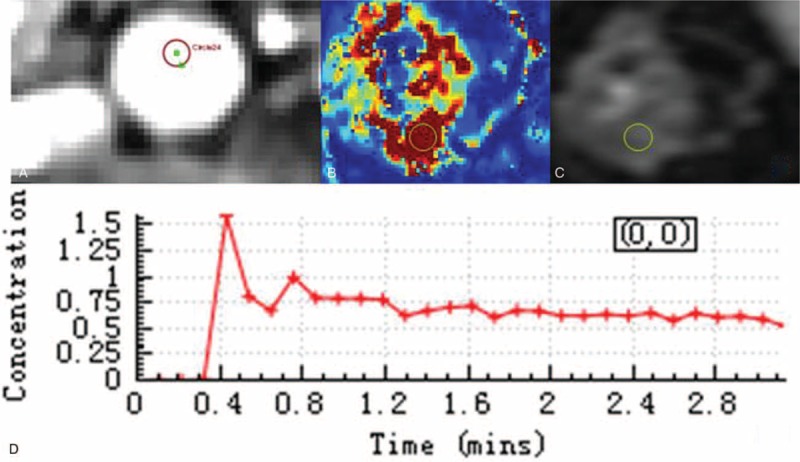
MRI measurements. Individual artery input function was obtained from a region of interest drawn on the abdominal aorta located in close proximity to the ileocecal (A, D). To calculate the Ktrans, a region of interest (with an area of 30–50 mm2) was placed on the ileocecal where the maximal enhancing region (B). For the same region of interest, the other pharmacokinetic parameters were calculated. The location and size of region of interest in ADC measurements was consistent with DCE-MRI (C). ADC = apparent diffusion coefficient; DCE-MRI = dynamic contrast-enhanced MRI; MRI = magnetic resonance imaging.
FIGURE 2.
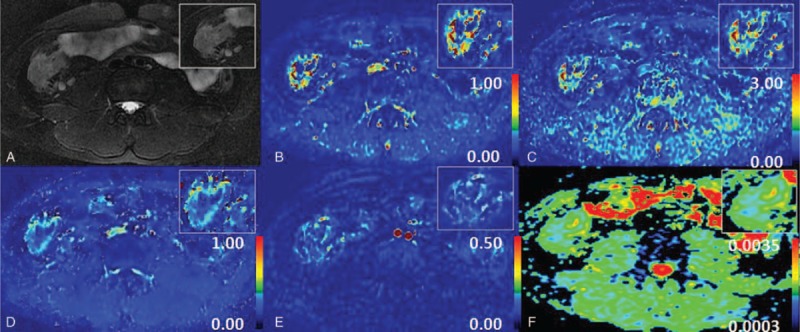
Maps of several parameters. Thickened bowel wall in ileocecal and enlarged lymph nodes were demonstrated on T2WI with fat-suppressed (A). Maps of several parameters including Ktrans (B), Kep (C), Ve (D), Vp (E), and ADC (F) related to vascular permeability and intra- and extravascular volumes were obtained. ADC = apparent diffusion coefficient.
The individual ADC was evaluated on a workstation with commercially available diffusion analysis software (Advantage Windows version 4.6, GE Healthcare). The location and size of ROI were consistent with DCE-MRI measurements (Figure 1C).
All parameters in both DCE-MRI and DW-MRI were independently evaluated by 2 radiologists (with a combined 10 years of body MRI experience), who were blinded to the clinical and endoscopic examination. To further assess the reproducibility and the repeatability of the measurements, Bland–Altman plots were generated. In this graphic method, the differences between the 2 radiologists are plotted against the averages of the 2 radiologists. The mean of the 2 values (measured by different radiologists) was accepted as the final result.
Statistical Analysis
Firstly, the independent samples t test in age and the chi-square test in gender were used to analyze significance between CD and control group. Second, all data in both DCE-MRI and DW-MRI were test with the Kolmogorov–Smirnov test for normally distributed before analysis. Normally distributed data were expressed as mean and standard deviations (SDs), whereas non-normally distributed data were expressed as median and interquartile ranges (IQRs). Third, for normally distributed data, independent sample t tests were used for multiple MRI parameters comparison between groups (Levene's test for homogeneity was conducted first to test the assumption of equal variance). Pearson analysis was used to evaluate the correlation between each of MRI parameters and CRP in CD patients. For data not normally distributed, nonparametric tests were used such as the Mann–Whitney test for between-group comparisons and Spearman analysis for correlation.
Statistical significance was set at P < 0.05. All the computations were performed using SPSS (version 18.0; IBM SPSS Inc., Chicago, IL).
The diagnostic efficacy of the MRI parameters in terms of sensitivity and specificity predictive value was analyzed by receiver operating characteristic (ROC) curve analyses. Optimal cut-off values of each MRI parameters for identification of inflammatory and normal bowel were determined according to the Youden criterion, which marks the point on an ROC curve where “sensitivity + specificity–1” is maximal.
RESULTS
The interobserver agreement in MRI parameters measurements is shown in Figure 3. The Bland–Altman plot suggested that interobserver reliability was very good. There was no significant difference (t test: P = 0.42) in age between CD and control group, and distribution of sex was similar in both groups (Fisher's exact test: P = 0.38). Age and sex did not mark as confounder and covariable in all comparisons between the 2 groups. All parameters in both DCE-MRI and DW-MRI were normally distributed, so means and SDs were provided for continuous variable.
FIGURE 3.
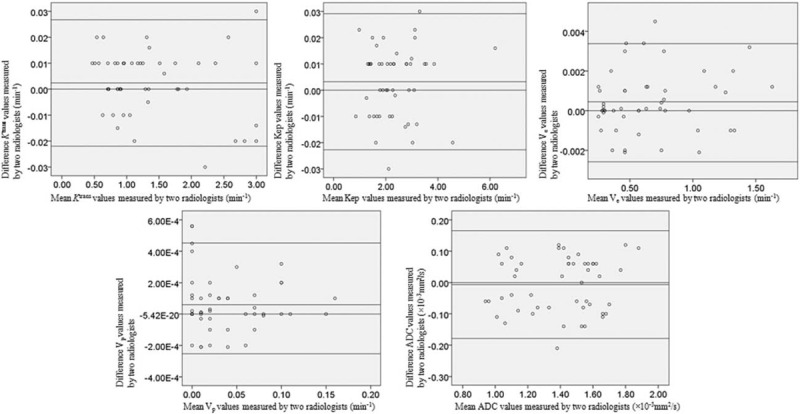
Bland–Altman plots of 2 radiologists’ measurements. Bland–Altman 95% limits of agreement in MRI parameters including Ktrans, Kep, Ve, Vp, and ADC. Top dotted line shows upper limit of agreement (mean difference plus 1.96 times standard deviation); bottom line shows lower limit of agreement (mean difference minus 1.96 times standard deviation). Plots show possible relationship between 2 radiologists in measurements. ADC = apparent diffusion coefficient; MRI = magnetic resonance imaging.
Comparisons of MRI Pharmacokinetic Parameters and ADC between CD and Control Group
As shown in Table 1 and Figure 4, the mean value of Ktrans in the CD group was significantly higher than that of control group (1.726 ± 0.723 min–1 vs 0.726 ± 0.141 min–1, P < 0.001). Similarly, the mean value of Kep was significantly greater in the CD ileocecal than control ileocecal (2.633 ± 1.063 min–1 vs 1.835 ± 0.493 min–1, P = 0.02). Ve in CD was also significantly greater compared with control (0.781 ± 0.382 vs 0.411 ± 0.169, P < 0.001). ADC in the CD group was lower than that of control group (1.275 ± 0.216 × 10⁻³ mm2/s vs 1.609 ± 0.124 × 10⁻³ mm2/s, P < 0.001). Vp had no statistically difference between the 2 groups (0.041 ± 0.100 vs 0.032 ± 0.026, P = 0.19).
FIGURE 4.
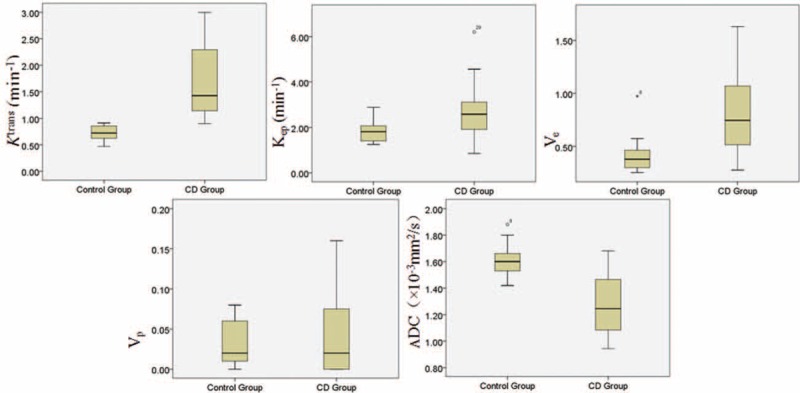
Box plots of DCE-MRI and DW-MRI parameters for the CD and control group. CD = Crohn's disease; DCE-MRI = dynamic contrast-enhanced MRI; DW-MRIdiffusion-weighted MRI.
Correlation Between MRI Parameters and Clinical Indicators
The relationships among DCE-MRI parameters, ADC, and CRP were displayed in Figure 5. Ktrans and Ve were correlated with CRP (pearson correlation coefficient: r = 0.725, P < 0.001; r = 0.533, P = 0.002). No correlation was found between Kep and CRP (P = 0.27), Vp and CRP (P = 0.15). ADC showed significantly negative correlation with CRP (r = −0.630, P < 0.001). There were negative correlations between the MRI parameters and ADC, such as Ktrans to ADC (r = −0.856, P < 0.001), and Ve to ADC (r = −0.451, P = 0.01) (Figure 6).
FIGURE 5.
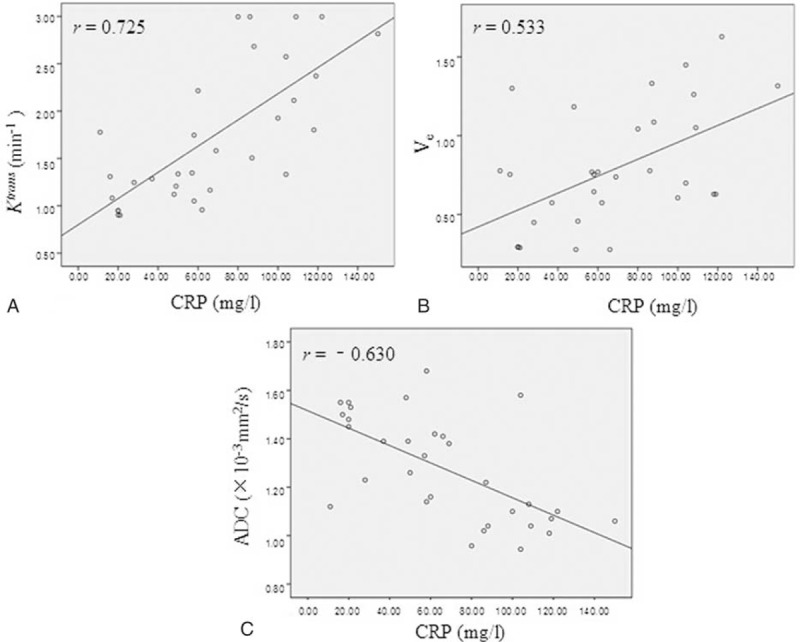
The relationship between DCE-MRI parameters, ADC and CRP. Ktrans (A) and Ve (B) were shown to be positive correlated with CRP (r = 0.725, P < 0.001; r = 0.533, P = 0.002). Scatterplots depicted the negative correlations between ADC and CRP (r = -0.630, P < 0.001) (C). ADC = apparent diffusion coefficient; CRP = C-reactive protein; DCE-MRI = dynamic contrast-enhanced MRI.
FIGURE 6.
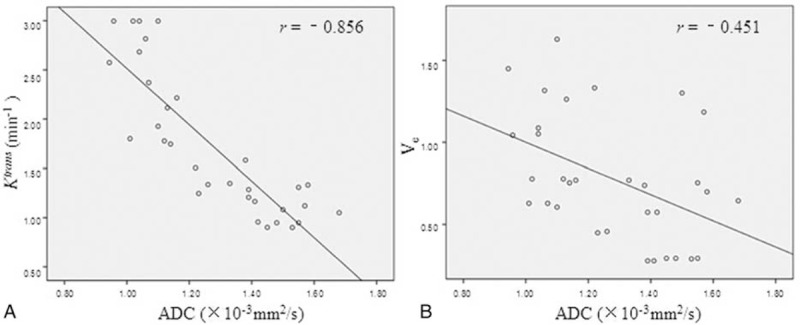
The relationship between DCE-MRI parameters and ADC. Scatterplots depicting the various negative correlations between the MRI parameters and ADC, such as Ktrans to ADC (r = −0.856, P < 0.001) (A), and Ve to ADC (r = −0.451, P = 0.01) (B). ADC = apparent diffusion coefficient; DCE-MRI = dynamic contrast-enhanced MRI.
The Diagnostic Efficacy of Different MRI Parameters for CD
The diagnostic efficacy was analyzed using ROC (Figure 7). The area under the curve (AUC) was 0.994 for Ktrans (P < 0.001), 0.905 for ADC (P < 0.001), 0.806 for Ve (P < 0.001), and 0.764 for Kep (P = 0.002), indicating that Ktrans and ADC were superior to Ve or Kep for CD prediction. ROC analysis also revealed that Vp had little diagnostic value (P = 0.06). The cut-off point of Ktrans at which there is optimal discrimination between CD and the normal ileocecal was 0.931 min–1 corresponding to a best trade-off between sensitivity (93.8%) and specificity (100%). The cut-off point of ADC was 1.11 × 10⁻³ mm2/s corresponding to a sensitivity of 100% and specificity of 68.8%.
FIGURE 7.
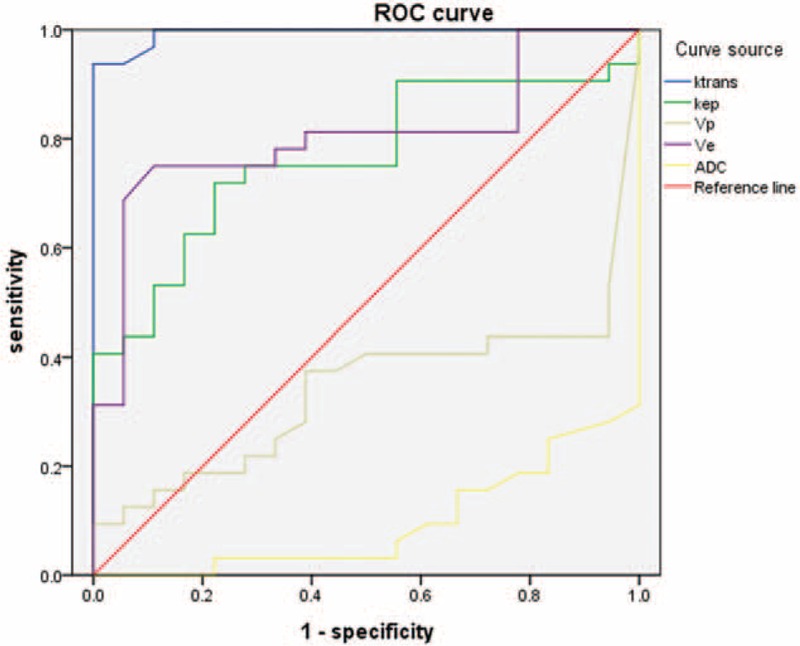
The diagnostic efficacy of different MRI parameters for CD. The area under the curve was 0.994 for Ktrans, 0.905 for ADC, 0.806 for Ve, and 0.764 for Kep, indicating that Ktrans and ADC were superior to Ve or Kep for CD prediction. ROC analysis also revealed Vp to be little diagnostic value (0.340). ADC = apparent diffusion coefficient; CD = Crohn's disease; ROC = receiver operating characteristic.
DISCUSSION
Correlation of Ktrans and Ve With CRP in CD
Previous studies have shown that Ktrans has been validated as an inflammation biomarker through clinical association with inflammatory pathology on biopsy.34 Histological inflammation of cellular infiltration strongly associates with pharmacokinetic parameters.35 Several studies have suggested that DCE-MRI is a sensitive biomarker of inflammation, demonstrating good correlation with laboratory markers of active disease and treatment response.36,37
It is now well established that, in chronic inflammatory diseases, tissue remodeling is associated with angiogenesis and microvascular remodeling. In the experimental CD study, angiogenesis increase relates to an aggravated disease.38 Incomplete inflammatory neovascularization results in the increment of microvascular permeability, which is a surrogate marker of the inflammation activity level. The volume transfer constant of contrast agent from a plasma space to an EES, as defined Ktrans, has been used to characterize this microvascular permeability quantitatively. Another biological significant parameter: fractional EES volume (Ve) has been applied to calculate the fraction of inflammatory volume occupied by the EES. In this study, Ktrans and Ve in the CD group were significantly higher than that of control group, and good correlation was shown between Ktrans, Ve, and CRP. These findings reflected the status of tissue microcirculation and may add valuable information about disease severity. Sinha et al39 reported that the degree of vascularity was closely related to the intensity of the inflammatory reaction in surgical specimens of CD. They concluded that contrast agent rapidly passed from the vascular into the EES, resulting in mural enhancement. So we hypothesized that the increase in values of Ktrans and Ve in the CD group was caused by increased vascular permeability of inflammatory tissue. It was supposed that in CD patients, the more severity of inflammation and the more angiogenesis with higher permeability, which leaded to more penetration of contrast agent molecules.
Correlation of ADC With CRP in CD
DW-MRI can provide reliable quantitative measurement of lesion bowel and has been used in the assessment of bowel inflammation in CD. Oto et al40 reviewed DW images of 11 CD patients and measured ADC values in a pilot study. They concluded that inflammatory bowel segments showed higher signal and decreased ADC values compared to normal segments. Kiryu et al12 found lower ADC values in the disease-active area than that in disease-inactive area in CD patients. Neubauer et al14 indicated a significant correlation between wall thickness and ADC in inflammatory segments. In our study, the ADC in CD group was lower than control group and demonstrated significant negative correlation with CRP. Statistical results confirmed that the ADC value may facilitate the quantitative analysis of disease activity in CD.
It is unclear why intestinal inflammatory lesions have restricted diffusion that is translated into the hyperintense signal on DW-MRI and decreased ADC values relative to normal segments. A potential pathogenetic mechanism is a reduction in extracellular space secondary to cell swelling or increased cell density. A number of factors can lead to this reduction, such as an increase in cellularity, migration of lymphocytes into the inflammatory wall segments, presence of oedema, micro-abscesses, or increased perfusion. In inflammatory segments, the lamina propria and submucosa are infiltrated by inflammatory cells. Aphtoid ulcers, characteristic lesions of CD, are also strongly associated with lymphoid aggregates. These lymphoid aggregates have restricted diffusion within themselves because of the increased cell density, as well as further limiting the diffusion by narrowing the limited space in the bowel wall. In addition to the increased number of inflammatory cells, dilated lymphatic channels, hypertrophied neuronal tissue, and the development of granulomas in the bowel wall can further narrow the extracellular space and therefore contribute to the restricted diffusion of water molecules. Accompanying intracellular changes within both the epithelial and inflammatory cells may also have an effect on the changes in diffusion.
Correlative Study Between DCE-MRI and DW-MRI
DCE-MRI sensitive to the presence of contrast medium in the EES can provide information on microvessel permeability (Ktrans) and extracellular leakage space (Ve). DW-MRI provides information about the random (Brownian) motion of water molecules. The movement of water molecules in the extracellular space is modified by interactions with cell membranes and macromolecules.41 In CD, inflammation and angiogenesis are intertwined. Inflammatory cells produce diverse angiogenic factors that stimulate microvessel growth. Angiogenesis with increased permeability promotes influx of more inflammatory cells. Diapedesis can further restrict diffusion by narrowing EES. There were negative statistical correlations between the MRI pharmacokinetic parameters and ADC, such as Ktrans and Ve to ADC in this present research. This result displayed that vascular contents including blood cells and contrast agent molecules penetrated into the extracellular space through angiogenesis with high permeability, further reduced EES with inflammatory cells, and limited the movement of water molecules. High value of Ktrans and Ve matched with low ADC explained the changes of microstructure and microcirculation in CD (Figure 8).
FIGURE 8.
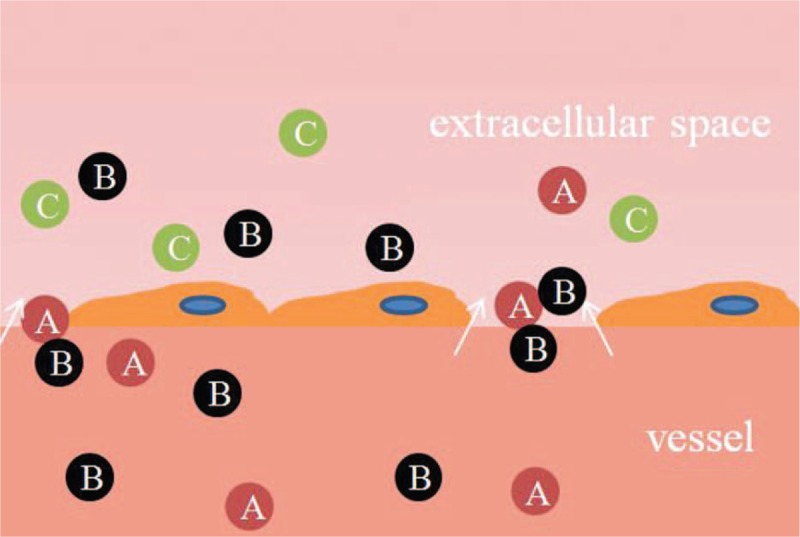
The changes of microstructure and microcirculation in CD. Vascular contents including blood cells (A) and contrast agent molecules (B) penetrated into the extracellular space through angiogenesis with high permeability, further limited the movement of water molecules with inflammatory cells (C). CD = Crohn's disease.
Comparison of Diagnostic Efficacy Between the DCE-MRI and DW-MRI
The present study found that the diagnostic sensitivity was 93.8% when Ktrans was 0.931 min–1, and the specificity was 100%, both of which were similar with the values for ADC (cut-off = 1.11; sensitivity of 100% and specificity of 68.8%). However, the AUC was 0.994 for Ktrans slightly higher than the AUC for ADC (0.905). Therefore, both Ktrans and ADC can provide the quantitative indicator for clinical research, but Ktrans was more meaningful in defining activity of CD.
In conclusion, this study compared parameters of DCE-MRI and DW-MRI in CD patients and found that vascular (Ktrans and Ve) and cellular (ADC) functional parameters were meaningful in the assessment of inflammatory activity. According to the negative correlations between the MRI pharmacokinetic parameters and ADC, we proposed a hypothesis about the changes of microstructure and microcirculation in CD. DCE-MRI and DW-MRI can provide quantitative parameters that can be useful in assessing disease activity, severity, and response to treatment. In the future, such advanced techniques may play an important role in management decisions for CD patients. However, this study included a relatively small number of patients; a larger sample should be investigated in future studies. The optimal imaging parameters of DCE-MR were collected and analyzed to obtain optimal vascular functional parameters in CD.
Footnotes
Abbreviations: AIF = artery input function, CD = Crohn's disease, CRP = C-reactive protein, DCE-MRI = dynamic contrast-enhanced MRI, DW-MRI = diffusion-weighted MRI, EES = extravascular extracellular space, Kep = flux rate constant, Ktrans = volume transfer coefficient reflecting vascular permeability, MRI = magnetic resonance imaging, ROC = receiver operating characteristic, ROI = region of interest, SDs = standard deviations, Ve = extracellular volume ratio reflecting vascular permeability, Vp = plasma volume fractions.
The authors have no funding and conflicts of interest to disclose.
REFERENCES
- 1.Cheng L, Huang MF, Mei PF, et al. The clinical, endoscopic and pathologic features of Crohn's disease in the differentiation from intestinal tuberculosis. Zhonghua Nei Ke Za Zhi 2013; 52:940–944. [PubMed] [Google Scholar]
- 2.Tzivanakis A, Singh JC, Guy RJ, et al. Influence of risk factors on the safety of ileocolic anastomosis in Crohn's disease surgery. Dis Colon Rectum 2012; 55:558–562. [DOI] [PubMed] [Google Scholar]
- 3.Schloricke E, Hoffmann M, Zimmermann M, et al. Simultaneous laparoscopic pyloroplasty and ileocecal resection in Crohn's disease. Acta Chirurgica Lugoslavica 2012; 59:117–120. [DOI] [PubMed] [Google Scholar]
- 4.Hovde O, Moum BA. Epidemiology and clinical course of Crohn's disease: results from observational studies. World J Gastroenterol 2012; 18:1723–1731. [DOI] [PMC free article] [PubMed] [Google Scholar]
- 5.Peyrin-Biroulet L, Gonzalez F, Dubuquoy L, et al. Mesenteric fat as a source of C reactive protein and as a target for bacterial translocation in Crohn's disease. Gut 2012; 61:78–85. [DOI] [PMC free article] [PubMed] [Google Scholar]
- 6.Magro F, Sousa P, Ministro P. C-reactive protein in Crohn's disease: how informative is it? Expert Rev Gastroenterol Hepatol 2014; 8:393–408. [DOI] [PubMed] [Google Scholar]
- 7.Cekic C, Arabul M, Alper E, et al. Evaluation of the relationship between serum ghrelin, C-reactive protein and interleukin-6 levels, and disease activity in inflammatory bowel diseases. Hepatogastroenterology 2014; 61:1196–1200. [PubMed] [Google Scholar]
- 8.Yang L, Ge ZZ, Gao YJ, et al. Assessment of capsule endoscopy scoring index, clinical disease activity, and C-reactive protein in small bowel Crohn's disease. J Gastroenterol Hepatol 2013; 28:829–833. [DOI] [PubMed] [Google Scholar]
- 9.Reinisch W, Wang Y, Oddens BJ, et al. C-reactive protein, an indicator for maintained response or remission to infliximab in patients with Crohn's disease: a post-hoc analysis from ACCENT I. Aliment Pharmacol Ther 2012; 35:568–576. [DOI] [PubMed] [Google Scholar]
- 10.Magro F, Rodrigues-Pinto E, Santos-Antunes J, et al. High C-reactive protein in Crohn's disease patients predicts nonresponse to infliximab treatment. J Crohn's Colitis 2014; 8:129–136. [DOI] [PubMed] [Google Scholar]
- 11.Hibi T, Sakuraba A, Watanabe M, et al. C-reactive protein is an indicator of serum infliximab level in predicting loss of response in patients with Crohn's disease. J Gastroenterol 2014; 49:254–262. [DOI] [PubMed] [Google Scholar]
- 12.Kiryu S, Dodanuki K, Takao H, et al. Free-breathing diffusion-weighted imaging for the assessment of inflammatory activity in Crohn's disease. J Magn Reson Imaging 2009; 29:880–886. [DOI] [PubMed] [Google Scholar]
- 13.Oto A, Kayhan A, Williams JT, et al. Active Crohn's disease in the small bowel: evaluation by diffusion weighted imaging and quantitative dynamic contrast enhanced MR imaging. J Magn Reson Imaging 2011; 33:615–624. [DOI] [PubMed] [Google Scholar]
- 14.Neubauer H, Pabst T, Dick A, et al. Small-bowel MRI in children and young adults with Crohn disease: retrospective head-to-head comparison of contrast-enhanced and diffusion-weighted MRI. Pediatr Radiol 2013; 43:103–114. [DOI] [PubMed] [Google Scholar]
- 15.Barnes SL, Whisenant JG, Xia L, et al. Techniques and applications of dynamic contrast enhanced magnetic resonance imaging in cancer. Conference proceedings: ... Annual International Conference of the IEEE Engineering in Medicine and Biology Society. IEEE Eng Med Biol Soc Ann Conf 2014; 2014:4264–4267. [DOI] [PMC free article] [PubMed] [Google Scholar]
- 16.Fluckiger JU, Loveless ME, Barnes SL, et al. A diffusion-compensated model for the analysis of DCE-MRI data: theory, simulations and experimental results. Phys Med Biol 2013; 58:1983–1998. [DOI] [PMC free article] [PubMed] [Google Scholar]
- 17.Barnes SL, Whisenant JG, Loveless ME, et al. Practical dynamic contrast enhanced MRI in small animal models of cancer: data acquisition, data analysis, and interpretation. Pharmaceutics 2012; 4:442–478. [DOI] [PMC free article] [PubMed] [Google Scholar]
- 18.Hsu YH, Huang Z, Ferl GZ, et al. GPU-accelerated compartmental modeling analysis of DCE-MRI data from glioblastoma patients treated with bevacizumab. PloS One 2015; 10:e0118421. [DOI] [PMC free article] [PubMed] [Google Scholar]
- 19.Liao WH, Yang LF, Liu XY, et al. DCE-MRI assessment of the effect of Epstein–Barr virus-encoded latent membrane protein-1 targeted DNAzyme on tumor vasculature in patients with nasopharyngeal carcinomas. BMC Cancer 2014; 14:835. [DOI] [PMC free article] [PubMed] [Google Scholar]
- 20.Atuegwu NC, Arlinghaus LR, Li X, et al. Parameterizing the logistic model of tumor growth by DW-MRI and DCE-MRI data to predict treatment response and changes in breast cancer cellularity during neoadjuvant chemotherapy. Transl Oncol 2013; 6:256–264. [DOI] [PMC free article] [PubMed] [Google Scholar]
- 21.Pickles MD, Lowry M, Manton DJ, et al. Prognostic value of DCE-MRI in breast cancer patients undergoing neoadjuvant chemotherapy: a comparison with traditional survival indicators. Eur Radiol 2015; 25:1097–1106. [DOI] [PubMed] [Google Scholar]
- 22.Kim JH, Kim H, Kim YJ, et al. Dynamic contrast-enhanced ultrasonographic (DCE-US) assessment of the early response after combined gemcitabine and HIFU with low-power treatment for the mouse xenograft model of human pancreatic cancer. Eur Radiol 2014; 24:2059–2068. [DOI] [PubMed] [Google Scholar]
- 23.Nguyen HT, Jia G, Shah ZK, et al. Prediction of chemotherapeutic response in bladder cancer using K-means clustering of dynamic contrast-enhanced (DCE)-MRI pharmacokinetic parameters. J Magn Reson Imaging 2015; 41:1374–1382. [DOI] [PMC free article] [PubMed] [Google Scholar]
- 24.Barrett T, Gill AB, Kataoka MY, et al. DCE and DW MRI in monitoring response to androgen deprivation therapy in patients with prostate cancer: a feasibility study. Magn Reson Med 2012; 67:778–785. [DOI] [PubMed] [Google Scholar]
- 25.Yuh WT, Mayr NA, Jarjoura D, et al. Predicting control of primary tumor and survival by DCE MRI during early therapy in cervical cancer. Invest Radiol 2009; 44:343–350. [DOI] [PMC free article] [PubMed] [Google Scholar]
- 26.Chen H, Wu T, Kerwin WS, et al. Atherosclerotic plaque inflammation quantification using dynamic contrast-enhanced (DCE) MRI. Quant Imaging Med Surg 2013; 3:298–301. [DOI] [PMC free article] [PubMed] [Google Scholar]
- 27.Truijman MT, Kwee RM, van Hoof RH, et al. Combined 18F-FDG PET-CT and DCE-MRI to assess inflammation and microvascularization in atherosclerotic plaques. Stroke 2013; 44:3568–3570. [DOI] [PubMed] [Google Scholar]
- 28.Padhani AR, Khan AA. Diffusion-weighted (DW) and dynamic contrast-enhanced (DCE) magnetic resonance imaging (MRI) for monitoring anticancer therapy. Targeted Oncol 2010; 5:39–52. [DOI] [PubMed] [Google Scholar]
- 29.Jena A, Taneja S, Mehta SB. Integrated quantitative DCE-MRI and DW-MRI to characterize breast lesions. Eur J Radiol 2012; 81 Suppl 1:S64–65. [DOI] [PubMed] [Google Scholar]
- 30.Gu J, Khong PL, Wang S, et al. Combined use of 18F-FDG PET/CT, DW-MRI, and DCE-MRI in treatment response for preoperative chemoradiation therapy in locally invasive rectal cancers. Clin Nucl Med 2013; 38:e226–e229. [DOI] [PubMed] [Google Scholar]
- 31.Hompland T, Ellingsen C, Galappathi K, et al. Connective tissue of cervical carcinoma xenografts: associations with tumor hypoxia and interstitial fluid pressure and its assessment by DCE-MRI and DW-MRI. Acta Oncologica 2014; 53:6–15. [DOI] [PubMed] [Google Scholar]
- 32.Filice S, Crisi G. Dynamic contrast-enhanced perfusion MRI of high grade brain gliomas obtained with arterial or venous waveform input function. J Neuroimaging 2016; 26:124–129. [DOI] [PubMed] [Google Scholar]
- 33.Handayani A, Triadyaksa P, Dijkstra H, et al. Intermodel agreement of myocardial blood flow estimation from stress-rest myocardial perfusion magnetic resonance imaging in patients with coronary artery disease. Invest Radiol 2015; 50:275–282. [DOI] [PubMed] [Google Scholar]
- 34.American College of Rheumatology Rheumatoid Arthritis Clinical Trials Task Force Imaging Group and Outcome Measures in Rheumatology Magnetic Resonance Imaging Inflammatory Arthritis Working Group. Review: The utility of magnetic resonance imaging for assessing structural damage in randomized controlled trials in rheumatoid arthritis. Arthritis Rheum 2013; 65:2513–2523. [DOI] [PubMed] [Google Scholar]
- 35.Axelsen MB, Poggenborg RP, Stoltenberg M, et al. Reliability and responsiveness of dynamic contrast-enhanced magnetic resonance imaging in rheumatoid arthritis. Scand J Rheumatol 2013; 42:115–122. [DOI] [PubMed] [Google Scholar]
- 36.Orguc S, Tikiz C, Aslanalp Z, et al. Comparison of OMERACT-RAMRIS scores and computer-aided dynamic magnetic resonance imaging findings of hand and wrist as a measure of activity in rheumatoid arthritis. Rheumatol Int 2013; 33:1837–1844. [DOI] [PubMed] [Google Scholar]
- 37.Hodgson R, Grainger A, O’Connor P, et al. Dynamic contrast enhanced MRI of bone marrow oedema in rheumatoid arthritis. Ann Rheum Dis 2008; 67:270–272. [DOI] [PubMed] [Google Scholar]
- 38.Deban L, Correale C, Vetrano S, et al. Multiple pathogenic roles of microvasculature in inflammatory bowel disease: a Jack of all trades. Am J Pathol 2008; 172:1457–1466. [DOI] [PMC free article] [PubMed] [Google Scholar]
- 39.Sinha R, Verma R, Verma S, et al. MR enterography of Crohn disease: part 2, imaging and pathologic findings. Am J Roentgenol 2011; 197:80–85. [DOI] [PubMed] [Google Scholar]
- 40.Oto A, Zhu F, Kulkarni K, et al. Evaluation of diffusion-weighted MR imaging for detection of bowel inflammation in patients with Crohn's disease. Acad Radiol 2009; 16:597–603. [DOI] [PMC free article] [PubMed] [Google Scholar]
- 41.Desar IM, ter Voert EG, Hambrock T, et al. Functional MRI techniques demonstrate early vascular changes in renal cell cancer patients treated with sunitinib: a pilot study. Cancer Imaging 2011; 11:259–265. [DOI] [PMC free article] [PubMed] [Google Scholar]


