Abstract
In a model of hemorrhagic shock, end-tidal carbon dioxide tension (EtCO2) has been shown to reflect the dependence of oxygen delivery (DO2) and oxygen consumption (VO2) at the onset of shock. The objectives of the present study were to determine whether variations in EtCO2 during volume expansion (VE) are correlated with changes in oxygen extraction (O2ER) and whether EtCO2 has predictive value in this respect.
All patients undergoing cardiac surgery admitted to intensive care unit in whom the physician decided to perform VE were included. EtCO2, cardiac output (CO), blood gas levels, and mean arterial pressure (MAP) were measured before and after VE with 500 mL of lactated Ringer solution. DO2, VO2, and O2ER were calculated from the central arterial and venous blood gas parameters. EtCO2 responders were defined as patients with more than a 4% increase in EtCO2 after VE. A receiver-operating characteristic curve was established for EtCO2, with a view to predicting a variation of more than 10% in O2ER.
Twenty-two (43%) of the 51 included patients were EtCO2 responders. In EtCO2 nonresponders, VE increased MAP and CO. In EtCO2 responders, VE increased MAP, CO, EtCO2, and decreased O2ER. Changes in EtCO2 were correlated with changes in CO and O2ER during VE (P < 0.05). The variation of EtCO2 during VE predicted a decrease of over 10% in O2ER (area under the curve [95% confidence interval]: 0.88 [0.77–0.96]; P < 0.0001).
During VE, an increase in EtCO2 did not systematically reflect an increase in CO. Only patients with a high O2ER (i.e., low ScvO2 values) display an increase in EtCO2. EtCO2 changes during fluid challenge predict changes in O2ER.
INTRODUCTION
The objective of volume-based hemodynamic resuscitation is to raise cardiac output (CO) and increase or restore the delivery of oxygen (DO2) required to meet the demands of oxygen consumption (VO2).1 If DO2 drops below a critical threshold, oxygen extraction (O2ER) cannot increase in proportion to demand, and VO2 becomes dependent on DO2. Before critical O2ER values arise, DO2 can decrease independently of VO2 (because DO2 exceeds VO2) and O2ER will increase with demand (as demonstrated by a progressive fall in central venous saturation [ScvO2]).2 When O2ER cannot rise any further, VO2 decreases and the body's metabolism becomes partially anaerobic (with a resulting increase in blood lactate levels).3 In many pathological situations, VO2 remains constant over a wide range of DO2 values as a result of adjustments in tissue oxygen uptake.4 ScvO2 is a clinically meaningful measure of tissue oxygenation,5 since it assesses the adequacy of DO2 with regard to VO2.6 Several studies have shown that ScvO2-based hemodynamic resuscitation is associated with lower morbidity and mortality rates during anesthesia and intensive care.7,8 Exhaled CO2 (end-tidal carbon dioxide tension, EtCO2) is also monitored in patients in the intensive care unit (ICU) or during anesthesia.9 Over short periods (and assuming a constant metabolic state), there is a qualitative relationship between EtCO2 and CO.10,11 Thus, EtCO2 can be used as a noninvasive, continuous measure of CO during several clinical situations with low-flow states.10–13 These results have not been confirmed in patients scheduled for surgery, in whom CO increased upon volume expansion (VE).14 One possible explanation is that patients scheduled for surgery and patients in the ICU differ in terms of systemic oxygen supply dependency. Most of the literature studies were performed in low-flow states, in which patients have been on a dependence phase between DO2 and VO2. This is probably not the case for most patients in the operating theatre. Based on a model of hemorrhagic shock in dogs, Guzman et al12 demonstrated that EtCO2 can reflect the dependence of DO2 and VO2 at the onset of shock and during hemodynamic resuscitation. Thereafter, Dubin et al13 confirmed the relationship between EtCO2, DO2, and VO2. Lastly, EtCO2 may be a noninvasive indicator of O2ER (and its surrogate ScVO2). Hence, the primary objective of the present study was to confirm that variations in EtCO2 during VE are correlated with changes in O2ER. We also evaluated the ability of variations in EtCO2 to predict a decrease in O2ER during VE.
METHODS
Ethics
The study's objectives and procedures were approved by the local independent ethics committee. Ethical approval for this study (Ethical Committee No. RNI2014-15) was provided by the Comité de Protection des Personnes Nord-Ouest II CHU—Place V. Pauchet, 80054 AMIENS Cedex 1 (Chairperson Bourgueil Thierry) on June 26, 2014. All patients received written information on the study and gave their verbal consent to participation prior to surgery. The present manuscript was drafted in compliance with the STROBE checklist for cohort studies.15
Patients
This prospective, observational study started on June 30, 2014 at Amiens University Hospital's cardio vascular and thoracic ICU over a 6-month period. The inclusion criteria were any major patient over 18 years, ventilated with controlled positive ventilation, for whom the physician decided to do a VE within hours of admission to the ICU. The indications for VE were arterial hypotension (systolic arterial pressure [SAP] lower than 90 mm Hg and/or mean arterial pressure [MAP] lower than 65 mm Hg), oliguria (urine output lower than 0.5 mL/kg per h over 1 h), clinical signs of hypoperfusion (skin mottling, capillary refill time over 2 s), and arterial hyperlactatemia (arterial lactate over 2 mmol/L). The noninclusion criteria were permanent arrhythmia, chronic obstructive pulmonary disease, and acute lung injury. The exclusion criteria were spontaneous ventilation, poor echogenicity, and arrhythmia.
Hemodynamic Parameters
An internal jugular vein central venous catheter and an arterial catheter were placed in all patients. Central venous pressure (CVP) and blood pressure were measured with a transducer zeroed at the mid-axillary line. Transthoracic echocardiography (Cx50, Philips Medical System, Suresnes, France) was performed by a physician who was blinded to the study outcomes. The left ventricular ejection fraction was measured using Simpson biplane method with a 4-chamber view. The diameter of the left ventricular outflow tract (LVOT) was measured on a long-axis parasternal view upon patient inclusion. Aortic area (SAo, in cm2) was calculated as π × LVOT2/4. The aortic velocity-time integral (VTIAo) was measured with pulsed Doppler and a 5-chamber apical view. Stroke volume (SV) (mL) was calculated as VTIAo × SAo. CO (in L/min) was calculated as SV × heart rate (HR). Mean echocardiographic parameters were calculated from 5 measurements (regardless of the respiratory cycle) and analyzed retrospectively. The intra and inter reproducibility of VTIAo measurements was tested prior to the study. Reproducibility values were 4.4 ± 3.9% and 4.4 ± 3.2%, respectively.
Oxygenation Parameters and EtCO2
We recorded the ventilator settings (tidal volume, plateau pressure, and end-expiratory pressure) at baseline. Exhaled CO2 was continuously measured at the tip of the endotracheal tube using a CO2 cuvette with an integrated sensor (Drager, Luebeck, Germany). All parameters were measured on arterial and central venous blood gases. Arterial and venous blood gas levels, the lactate level, the blood hemoglobin concentration, and oxyhemoglobin saturation were assayed using an automated analyzer (ABL800 FLEX, Radiometer, Bronshoj, Denmark). Arterial oxygen content (CaO2) and venous oxygen content (CvO2) were calculated as follows: CaO2 = 1.34 × Hb × SaO2 + 0.003 × PaO2; CvO2 = 1.34 × Hb × ScvO2 + 0.003 × PvO2, where Hb is the hemoglobin concentration (in g/dL), PaO2 is the arterial oxygen pressure (in mm Hg), SaO2 is the arterial oxygen saturation (in %), PvO2 is the venous oxygen pressure (mm Hg), ScvO2 is the central venous oxygen saturation (in %), and 0.003 the solubility coefficient of oxygen. PCO2 gap was calculated as follow: PCO2 gap = PcvCO2 − PaCO2 (mm Hg).
DO2 and VO2 were calculated from arterial and central venous blood gases as follows: DO2 (mL/min per kg) = (CaO2 × 10 × CO)/weight; VO2 (mL/min per kg) = the arteriovenous difference in oxygen content ([C(a − v)O2] × CO × 10)/weight. O2ER was defined as VO2/DO2 ratio. Arterial and venous CO2 contents (CaCO2, CvCO2) were calculated according to Douglas Formula.16 The alveolar dead space (Vd/Vt) was estimated from EtCO2 and PaCO2 as (PaCO2 − EtCO2)/PaCO2.17
Study Procedures
The following clinical parameters were recorded: age, gender, weight, and main diagnosis. First, a passive leg-raising (PLR) test was performed in order to evaluate the effects on SV, and assess preload status. After an equilibration period, baseline measurements of HR, SAP, MAP, diastolic arterial pressure (DAP), CVP, SV, CO, EtCO2, and arterial/venous blood gas levels were obtained. In the present study, VE always consisted in infusing 500 mL of lactated Ringer solution over 10 min; 10 min after VE, a second set of measurements (SAP, MAP, DAP, HR, CVP, SV, CO, EtCO2, and arterial/venous blood gas levels) was recorded. All patients had been sedated via the continuous infusion of propofol and were fully accustomed to mechanical ventilation. All patients underwent mechanical ventilation in volume-controlled mode with a tidal volume set to 7 to 9 mL/kg of ideal body weight, and a positive end-expiratory pressure of 5 to 8 cm H2O. Ventilator settings (oxygen inspired fraction, tidal volume, respiratory rate, and end positive pressure) and norepinephrine dosage were not modified during the study period.
Statistical Analysis
We calculated that a sample of 50 patients would be sufficient to demonstrate a correlation of over 0.7 between EtCO2, ERO2, VO2, DO2, and CO. Fifty-five patients were therefore recruited, taking into account the exclusion criteria. The variables’ distribution was assessed using a Kolmogorov–Smirnov test. Data are expressed as the proportion (in %), the mean (standard deviation, SD) or the median (interquartile range), as appropriate. We measured the magnitude of EtCO2 variations during VE by calculating the effect size (the mean divided by the SD).18,19 The effect size was 0.74. Then, we calculated the coefficient of variation (CV), precision and least significant change (LSC) for EtCO2. LSC is the least amount of EtCO2 change that can be considered statistically significant; that is, the minimum percentage change between successive measurements that can be considered not due to random error and therefore representing a real change in ETCO2. The EtCO2 CV and LSC were determined in all studied patients at baseline during stable respiratory and hemodynamic conditions. The CV (95% confidence interval [CI]) was 1.8% (0.9–2.7) and the LSC (95% CI) was 2.5% (1.3–3.8). EtCO2 responder was defined as an increase of EtCO2 of more than 4% in EtCO2 after VE. EtCO2 nonresponder was defined as an increase of EtCO2 of <4% in EtCO2 after VE. This cut off correspond to LSC with its 95% CI.20 Fluid responder was defined as an increase of more than 15% in the SV during VE.21 Fluid nonresponder was defined as an increase of <15% in the SV during VE. The nonparametric Wilcoxon rank sum test, Student paired t test, Student t test, and the Mann–Whitney test were used to assess statistical significance, as appropriate. Linear correlations were tested using Pearson or Spearman rank method. A receiver-operating characteristic curve was established for EtCO2, with a view to predicting a decrease of over 10% in O2ER, and a increase over 10% in ScVO2.22 The threshold for statistical significance was set to P < 0.05. SPSS software (version 21, IBM, New York, NY) was used to perform statistical analysis.
RESULTS
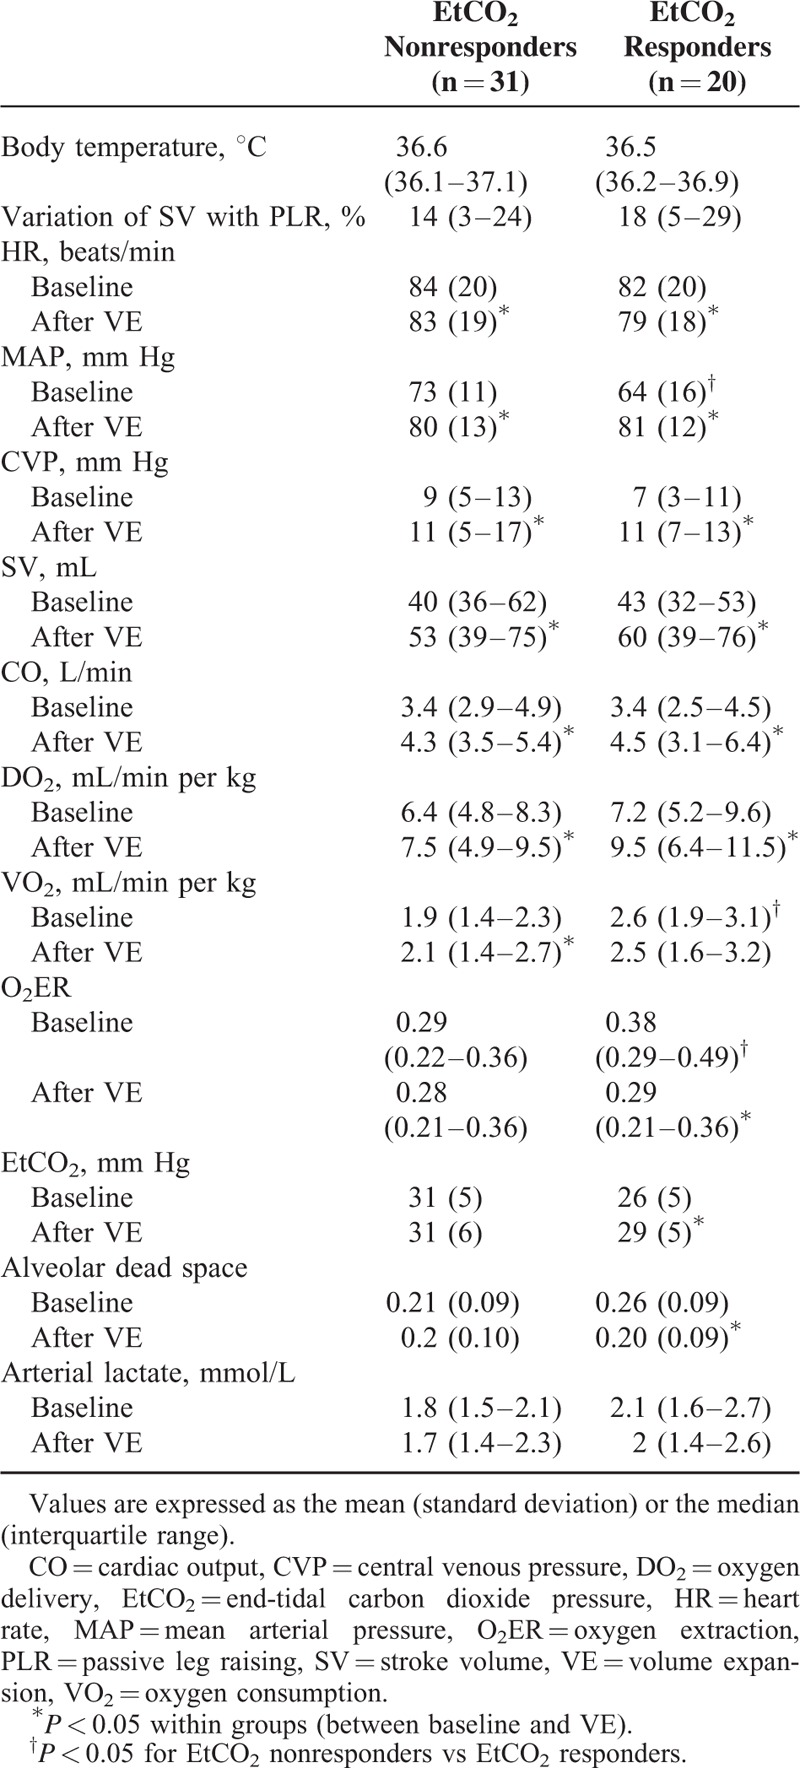
Fifty-one postoperative patients were analyzed after inclusion in the study (Figure 1, Table 1). The indications for VE were as follows: arterial hypotension (n = 34), oliguria (n = 4), and clinical signs of hypoperfusion (n = 13). Eighteen (35%) patients had hyperlactatemia. Indications for VE did not differ between EtCO2 responders and EtCO2 nonresponders (P > 0.05). Twenty (39%) of the 51 patients were classified as EtCO2 responders. All EtCO2 responders were also fluid responders and displayed a mean (95% CI) EtCO2 of 7% (6–9) during VE (Figure 1). Thirty-one patients were classified as EtCO2 nonresponders and displayed a mean (95% CI) change in EtCO2 of 0% (−1 to 1) during VE (Figure 1). Twenty-six of the EtCO2 nonresponders were fluid responders and 5 were fluid nonresponders. At baseline, prevalence of norepinephrine treatment did not differ between the 2 groups of patients (12 [39%] EtCO2 nonresponders vs 7 [35%] EtCO2 responders, P = 0.1). At baseline, SV variations with PLR did not differ between EtCO2 responders and EtCO2 nonresponders (P > 0.05, Table 2).
FIGURE 1.
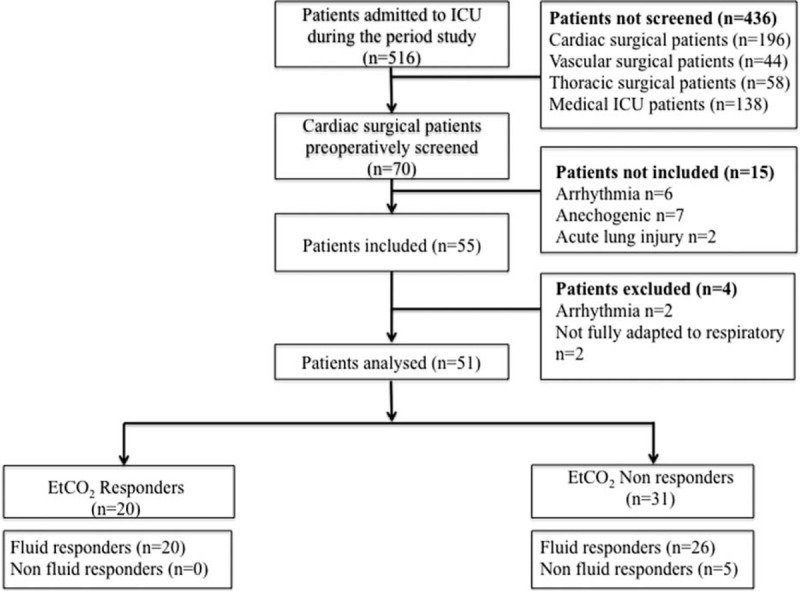
Study flow chart.
TABLE 1.
Characteristics of the Study Participants on Inclusion
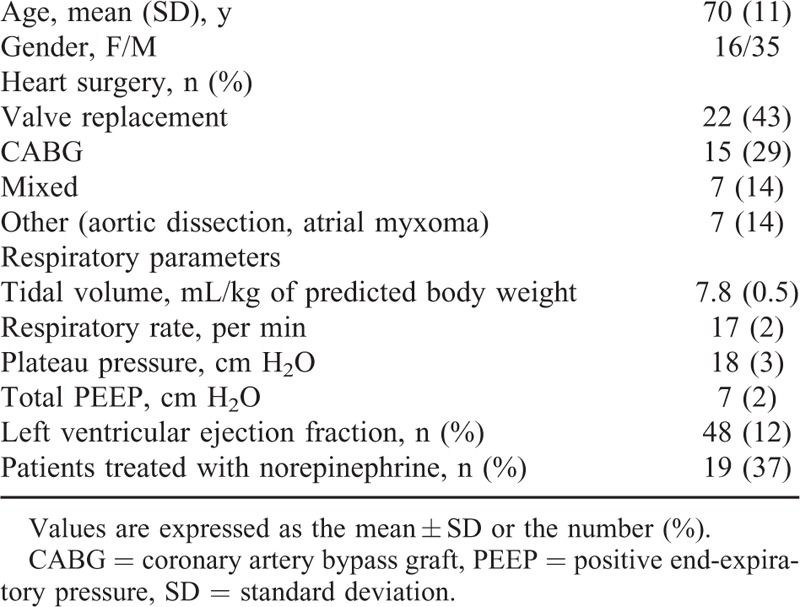
TABLE 2.
Comparison of Hemodynamic Parameters in Nonresponders, EtCO2 Nonresponders, and EtCO2 Responders
Effect of VE on Hemodynamic and Blood Gas Parameters
In the study population as a whole, VE led to increases in MAP, CVP, SV, CO, EtCO2, DO2, PvO2, and ScvO2, and decreases in HR, PvCO2, O2ER, and alveolar dead space (Tables 2 and 3). At baseline, MAP, PvO2, and ScvO2 were lower and VO2 and O2ER were higher in EtCO2 responders than in EtCO2 nonresponders (regardless of the presence or absence of a fluid response in the latter; Tables 2 and 3).
TABLE 3.
Comparison of Blood Gas Parameters in EtCO2 Nonresponders and EtCO2 Responder Groups
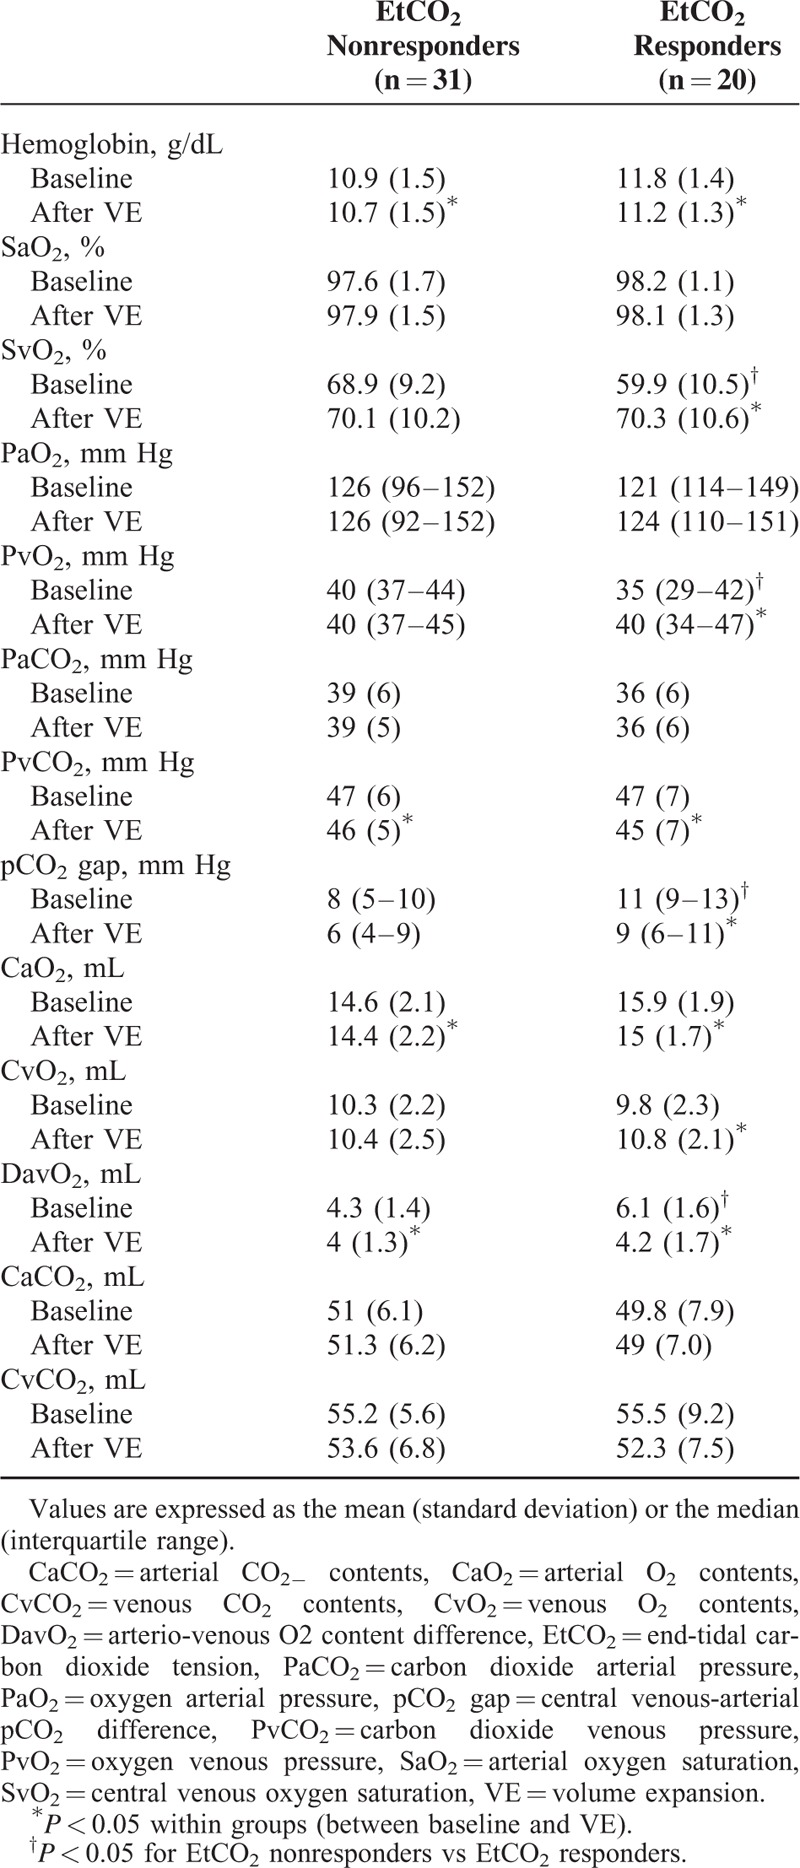
In EtCO2 nonresponders, VE led to increases in MAP, SV, CO, CVP, DO2, and VO2. PvCO2 decreased during VE. In EtCO2 responders, VE led to increases in MAP, SV, CO, CVP, EtCO2, PvO2, DO2, and ScvO2 and decreases in PvCO2, PcCO2 gap, O2ER, and alveolar dead space (Tables 2 and 3).
Correlations Between Hemodynamic, Blood Gas Parameters, and EtCO2
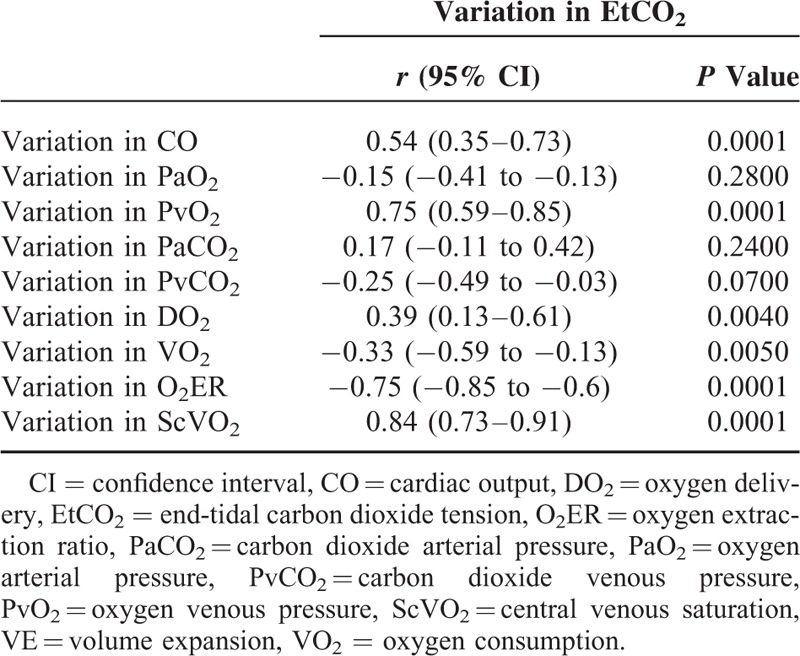
In the overall population at baseline, EtCO2 was correlated with CO, DO2, and O2ER (r = 0.48, P = 0.001; r = 0.47, P = 0.001; and r = −0.42, P = 0.005, respectively). O2ER was not correlated with arterial lactate levels (r = 0.01, P = 0.99 but was correlated with PavCO2 (r = −0.46, P = 0.01). Changes in EtCO2 during VE were correlated with those in CO, PvO2, DO2, VO2, ScVO2, and O2ER (Table 4). A change of more than 4% in EtCO2 during VE predicted a decrease of more than 10% in the VO2/DO2 ratio with an area under the curve (95% CI) of 0.88 (0.77–0.96) (P < 0.0001), a sensitivity of 71% (53–85), a specificity of 94% (71–100), a positive likelihood ratio of 12, negative likelihood ratio of 0.31, a positive predictive value of 96, and a negative predictive value of 62. In the same way, change in EtCO2 during VE predicted an increase of more than 10% in ScVO2 with an area under the curve (95% CI) of 0.90 (0.78–0.97), P < 0.0001.
TABLE 4.
Correlations Between Variations in EtCO2, Hemodynamic Parameters, and Blood Gas Parameters During VE
DISCUSSION
Our results demonstrated that during VE, the occurrence of concomitant increases in EtCO2 and CO depends on the relationship between VO2 and DO2; an increase in CO was not necessarily accompanied by an increase in EtCO2. Only patients with a high extraction ratio (i.e., low ScvO2 values) will display an increase in EtCO2. Thus, changes in EtCO2 during VE reflect changes in O2ER in response to a rise in DO2. Hence, during VE, EtCO2 may be a useful noninvasive indicator of changes in systemic oxygen supply dependency when fixed ventilation is maintained.
Several preclinical and clinical studies have demonstrated that EtCO2 can be used as a noninvasive, continuous measure of CO during low-flow states (cardiac arrest, hemorrhagic shock, cardiopulmonary resuscitation, circulatory shock, etc.).9–11 Similarly, EtCO2 has been shown to reflect changes in VO2 and VCO2 during hemorrhagic shock.12,13 Our present results demonstrated that EtCO2 may reflect changes in systemic oxygen supply associated with changes in CO during VE in nonseptic patients. All the patients in our study were postoperative sedated and nonhypothermic. Alveolar ventilation procedures and norepinephrine dosage did not change over the study period, and CO increased during VE. Even then, only 50% of fluid responders displayed an increase in EtCO2, thus EtCO2 was poorly correlated with changes in CO. Our results confirm previous findings in the operating theatre, where EtCO2 and CO were rather low.14 To determine the mechanisms by which increase in CO increase EtCO2 during VE, 1 would have to consider the study population and the effects of increase CO on blood gas parameters.
At baseline, EtCO2 responders had a lower MAP than EtCO2 nonresponders, whereas the 2 groups did not differ significantly in terms of preload status (i.e., variations in SV during PLR) and CO. Although EtCO2 responders and EtCO2 nonresponders did not differ in terms of DO2, the EtCO2 responders had a higher VO2 and thus a higher O2ER and lower ScVO2. VE led to an increase in CO (and thus DO2) and a decrease in PvCO2 in fluid responders. Nevertheless, VE in EtCO2 responders led to a recovery of DO2 in consistent with oxygen needs: the decrease in O2ER resulted in an increase in PvO2 and ScvO2. In contrast, EtCO2 nonresponsiveness was associated with an increase in DO2 and VO2 because baseline O2ER did not rise. Thus, concomitant increases in EtCO2 and CO may result from several different mechanisms.
Under steady-state conditions, alveolar CO2 elimination and therefore EtCO2 depend on several factors: CO2 production (VCO2, due to metabolism), alveolar ventilation (mechanical ventilation), pulmonary perfusion (CO), and V/Q matching. VCO2 depends on pulmonary elimination and metabolic production of CO2. The changes in EtCO2 in our population could not be explained by metabolic production of CO2 for several reasons. In a model of hemorrhagic shock, Dubin et al13 demonstrated that VCO2 could decrease EtCO2 during the period of VO2 supply dependency at low CO. The alterations in VCO2 were statistically significant for changes in CO, DO2, and VO2 values that were greater than those observed in our study. A further mechanism might be related to removal of peripheral tissue CO2 produced under anaerobic conditions.23 In the present study, the baseline O2ER values were below critical literature values at which tissue hypoxia was associated with anaerobic metabolism.24 Moreover, no inter and intra group difference was shown for CaCO2 and CvCO2. One can hypothesize that decrease (increases) in O2ER (ScVO2) and CO will decrease the venous blood's capacity to carry CO2 at a given PvO2, which in turn will offset the increase in CO2 delivery when CO rises.25
Thus, an increase in DO2 may decrease PvCO2 and increase CO2 delivery to the lung. At the same time, alveolar Vd/Vt fell in EtCO2 responders (despite constant minute ventilation) as a result of 2 mechanisms. The increases in PvO2 and CO may have improved alveolar perfusion pressure and the ventilation–perfusion ratio of the lung, which would tend to decrease PaCO2.26,27 In our population, changes in EtCO2 had good correlation with changes in PvO2 and ScVO2 whereas they were not associated to those in PaCO2 or PvCO2. These mechanisms may explain (at least in part) why EtCO2 did not change in EtCO2 nonresponders, whereas CO did.
In summary, EtCO2 responders had a low DO2 with regard to their VO2 resulting in higher O2ER (lower ScVO2). VE restored the relationship between VO2/DO2 through CO changes and increasing PvO2 and CO2 delivery to the lung, which improved the patients’ ventilation–perfusion ratio and thus increased EtCO2.
The present study had a number of limitations. The study population (patients after heart surgery) may have differed from septic shock patients. Most of our patients suffered from acute circulatory failure as a result of perioperative hypovolemia, whereas septic patients generally have acute circulatory failure that combines hypovolemia, changes in microvascular perfusion and cellular dysoxia. A patient's response to VE, the relationship between DO2 and VO2, and the extent of anaerobic metabolism may depend on the etiology of acute circulatory failure.28–30 We measured blood gas parameters from a central venous catheter and not from a pulmonary artery catheter. Although ScVO2 cannot give a precise absolute estimate of SvO2, it can serve as a guide to changes in SvO2 and VO2.30,31 Monnet et al used blood gas parameters from a central venous catheter to assess VO2, DO2, and their changes over time during fluid expansion in septic patients.31 In our study, changes in ScVO2 (measured) and O2ER (calculated) had good correlation (r = −0.89, P < 0.0001). Moreover, predictive values of EtCO2 changes during VE did not differ to predict an increase of ScVO2 or a decrease of VO2/DO2 ratio. Since we performed repeated measurements of blood gas levels, mathematical coupling cannot be ruled out. But De Backer et al demonstrated that during controlled conditions, VO2 calculated from hemodynamic data is a valid alternative to VO2 derived from respiratory gas measurements.30,32 The method used to calculate alveolar dead space was not standardized and may have introduced bias into the determination. The difference between EtCO2 and PaCO2 is altered in patients with altered ventilation/perfusion ratios (due to atelectasis, chronic heart failure, acute respiratory distress syndrome, etc.). In the present study, patients with chronic pulmonary disease or acute lung injury were excluded to limit this bias. Furthermore, these results cannot be extrapolated to EtCO2 changes that result from the administration of vasopressor drugs.33 EtCO2 changes seem small but they are similar to those used to predict fluid responsiveness.34 Lastly, given that we did not measure VCO2, we cannot rule out the occurrence of changes in metabolic production of CO2 during the VE-induced increase in CO.
CONCLUSIONS
During VE, an increase in CO was not necessarily accompanied by an increase in EtCO2. Only patients with a high O2ER (i.e., low ScvO2 values) display an increase in EtCO2. Thus, EtCO2 changes during fluid challenge predict changes in O2ER (i.e., ScVO2) in response to an increase in DO2. EtCO2 may be a useful noninvasive indicator of changes in systemic oxygen supply dependency in operative patients when fixed ventilation is maintained.
UNCITED REFERENCES
18.
Footnotes
Abbreviations: CaCO2 = arterial CO2 contents, CaO2 = arterial O2 contents, CO = cardiac output, CvCO2 = venous CO2 contents, CvO2 = venous O2 contents, CVP = central venous pressure, DO2 = oxygen delivery, HR = heart rate, ICU = intensive care unit, MAP = mean arterial pressure, O2ER = oxygen extraction, PaO2 = arterial oxygen pressure, PLR = passive leg raising, PvO2 = venous oxygen pressure, SaO2 = arterial oxygen saturation, SV = stroke volume, SvO2 = central venous oxygen saturation, VCO2 = carbon dioxide production, VO2 = oxygen consumption.
Acquisition of data: P-GG, MG, AHH, MT, PH, SB, KK, EB, HD, EL; analysis and interpretation: P-GG, HD, EL; and drafting the manuscript for important intellectual content: P-GG, MG, EL.
This study has been approved by the IRB of Amiens University Hospital.
The authors have no funding and conflicts of interest to disclose.
REFERENCES
- 1.Vincent JL, De Backer D. Oxygen transport—the oxygen delivery controversy. Intensive Care Med 2004; 30:1990–1996. [DOI] [PubMed] [Google Scholar]
- 2.Schumacker PT, Cain SM. The concept of a critical oxygen delivery. Intensive Care Med 1987; 13:223–229. [DOI] [PubMed] [Google Scholar]
- 3.Dantzker DR, Foreman B, Guittierez G. Oxygen supply and utilization relationships. Am Rev Resp Dis 1991; 143:675–679. [DOI] [PubMed] [Google Scholar]
- 4.Ronco JJ, Fenwick JC, Tweeddale MG, et al. Identification of the critical oxygen delivery for anaerobic metabolism in critically ill septic and non septic humans. JAMA 1993; 270:1724–1730. [PubMed] [Google Scholar]
- 5.Gutierrez G, Pohil RJ. Oxygen consumption is linearly related to oxygen supply in critically ill patients. J Crit Care 1986; 1:45–53. [Google Scholar]
- 6.Edwards JD. Oxygen transport in cardiogenic and septic shock. Crit Care Med 1991; 19:658–663. [DOI] [PubMed] [Google Scholar]
- 7.Boyle MS, Bennett M, Keogh GW, et al. Central venous oxygen saturation during high-risk general surgical procedures—relationship to complications and clinical outcomes. Anaesth Intensive Care 2014; 42:28–36. [DOI] [PubMed] [Google Scholar]
- 8.Jakob S, Bracht H, Eigenmann V, et al. Collaborative study group on perioperative ScvO2 monitoring: multicentre study on peri- and postoperative central venous oxygen saturation in high-risk surgical patients. Crit Care 2006; 10:R158. [DOI] [PMC free article] [PubMed] [Google Scholar]
- 9.Schmitz BD, Shapiro BA. Capnography. Respir Care Clin N Am 1995; 1:107–117. [PubMed] [Google Scholar]
- 10.Petrucci N, Muchada R. End-tidal CO2 as a predictive index of regional perfusion and its relation to aortic flow. A clinical study during peripheral vascular surgery. Minerva Anestesiol 1993; 59:297–305. [PubMed] [Google Scholar]
- 11.Gudipati CV, Weil MH, Bisera J, et al. Expired carbon dioxide: a noninvasive monitor of cardiopulmonary resuscitation. Circulation 1988; 77:234–239. [DOI] [PubMed] [Google Scholar]
- 12.Guzman JA, Lacoma FJ, Najar A, et al. End-tidal partial pressure of carbon dioxide as a noninvasive indicator of systemic oxygen supply dependency during hemorrhagic shock and resuscitation. Shock 1995; 8:427–431. [PubMed] [Google Scholar]
- 13.Dubin A, Murias G, Estenssoro E, et al. End-tidal CO2 pressure determinants during hemorrhagic shock. Intensive Care Med 2000; 26:1619–1622. [DOI] [PubMed] [Google Scholar]
- 14.Guinot PG, Godart J, de Broca B, et al. End-expiratory occlusion manoeuvre does not accurately predict fluid responsiveness in the operating theatre. Br J Anaesth 2014; 112:1050–1054. [DOI] [PubMed] [Google Scholar]
- 15.Von Elm E, Altman DG, Egger M, et al. The Strengthening the Reporting of Observational Studies in Epidemiology (STROBE) statement: guidelines for reporting observational studies. Ann Intern Med 2007; 147:573–577. [DOI] [PubMed] [Google Scholar]
- 16.Douglas AR, Jones NL, Reed JW. Calculation of whole blood CO2 content. J Appl Physiol 1985; 65:473–477. [DOI] [PubMed] [Google Scholar]
- 17.Nunn JF, Hill DW. Respiratory dead space and arterial to end-tidal CO, tension difference in anesthetized man. J Appl Physiol 1960; 15:383–389. [DOI] [PubMed] [Google Scholar]
- 18.Cohen J. Statistical Power Analysis for the Behavioral Sciences. 2nd edHillsdale, NJ: Lawrence Erlbaum Associates; 1988. [Google Scholar]
- 19.Cecconi M, Rhodes A, Poloniecki J, et al. Bench-to-bedside review: the importance of the precision of the reference technique in method comparison studies-with-specific reference to the measurement of cardiac output. Crit Care 2009; 13:201. [DOI] [PMC free article] [PubMed] [Google Scholar]
- 20.Guinot P-G, Urbina B, de Broca B, et al. Predictability of the respiratory variation of stroke volume varies according to the definition of fluid responsiveness. Br J Anaesth 2014; 112:580–581. [DOI] [PubMed] [Google Scholar]
- 21.Ousmane ML, Lebuffe G, Vallet B. Reanimation 2003; 12:109–116. [Google Scholar]
- 22.West JB. Ventilation-perfusion relationships. Am Rev Respir Dis 1977; 116:919–943. [DOI] [PubMed] [Google Scholar]
- 23.Farhi LE, Rahn H. Dynamics of changes in carbon dioxide stores. Anesthesiology 1960; 21:604–614. [DOI] [PubMed] [Google Scholar]
- 24.Cain SM, Adams RP. Appearance of excess lactate in anesthetized dogs during anemic and hypoxic hypoxia. Am J Physiol 1965; 209:604–608. [DOI] [PubMed] [Google Scholar]
- 25.Douglas CC, Haldane JS. The absorption and dissociation of carbon dioxide by the human blood. J Physiol 1914; 48:244–271. [DOI] [PMC free article] [PubMed] [Google Scholar]
- 26.Domino KB, Wetstein L, Glasser SA, et al. Influence of mixed venous oxygen tension (PvO2) on blood flow to atelectatic lung. Anesthesiology 1983; 59:428–434. [DOI] [PubMed] [Google Scholar]
- 27.Bishop MJ, Cheney FW. Effects of pulmonary blood flow and mixed venous O2 tension on gas exchange in dogs. Anesthesiology 1983; 58:130–135. [DOI] [PubMed] [Google Scholar]
- 28.Haupt MT, Gilbert EM, Carlson RW. Fluid loading increases oxygen consumption in septic patients with lactic acidosis. Am Rev Respir Dis 1985; 131:912–916. [DOI] [PubMed] [Google Scholar]
- 29.Lugo G, Arizpe D, Domínguez G, et al. Relationship between oxygen consumption and oxygen delivery during anesthesia in high-risk surgical patients. Crit Care Med 1993; 21:64–69. [DOI] [PubMed] [Google Scholar]
- 30.Monnet X, Julien F, Ait-Hamou N, et al. Lactate and venoarterial carbon dioxide difference/arterial-venous oxygen difference ratio, but not central venous oxygen saturation, predict increase in oxygen consumption in fluid responders. Crit Care Med 2013; 41:1412–1420. [DOI] [PubMed] [Google Scholar]
- 31.Reinhart K, Rudolph T, Bredle DL, et al. Comparison of central-venous to mixed-venous saturation during changes in oxygen supply/demand. Chest 1989; 95:1216–1221. [DOI] [PubMed] [Google Scholar]
- 32.De Backer D, Moraine JJ, Berre J, et al. Effects of dobutamine on oxygen consumption in septic patients. Direct versus indirect determinations. Am J Resp Crit Care Med 1994; 150:95–100. [DOI] [PubMed] [Google Scholar]
- 33.Gilbert EM, Haupt MT, Mandanas RY, et al. The effect of fluid loading, blood transfusion, and catecholamine infusion on oxygen delivery and consumption in patients with sepsis. Am Rev Respir Dis 1986; 134:873–878. [DOI] [PubMed] [Google Scholar]
- 34.Monge García MI, Gil Cano A, Gracia Romero M, et al. Non-invasive assessment of fluid responsiveness by changes in partial end-tidal CO2 pressure during a passive leg-raising maneuver. Ann Intensive Care 2012; 2:9. [DOI] [PMC free article] [PubMed] [Google Scholar]


