Graphical Abstract
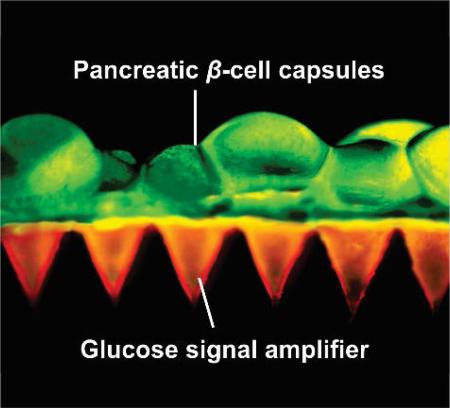
An innovative microneedle (MN)-based cell therapy is developed for glucose-responsive regulation of the insulin secretion from exogenous pancreatic β-cells without implantation. One MN patch could quickly reduce blood sugar levels (BGLs) of chemically-induced type 1 diabetic mice and stabilize BGLs at a reduced level for over 10 hours.
Keywords: diabetes, pancreatic cells, microneedle, physiological signal, drug delivery
Diabetes mellitus, as one of the most challenging chronic diseases, currently affects over 387 million people worldwide and this number is estimated to increase to around 500 million by 2030.[1] Providing lifelong exogenous insulin is essential for the treatment of type 1 diabetes.[2] However, there was an estimated 4.9 million diabetes related deaths worldwide in 2014.[1] A key constraint of the traditional insulin injection lies in inadequate glycemic control, which leads to diabetes complications, such as blindness, limb amputation and kidney failure. Conversely, overtreatment with insulin causes hypoglycemia, which can lead to behavioral and cognitive disturbance, seizure, brain damage, or death.[3]
Transplantation of insulin-producing cells has been intensively explored for treating type 1 diabetes.[4] However, due to the host recognition of transplanted cells, dependence on donor cells and requirement of extensive immunosuppressive therapy, direct cell implantation has a limited role in diabetes care.[5] An alternative technique is to encapsulate pancreatic β-cells in a semi-permeable container, isolating and protecting them from the immune system while still allowing the diffusion and transportation of nutrients and oxygen to the encapsulated cells.[6, 7] Nevertheless, the cell-capsule implantation or withdrawal usually requires a surgical procedure. More importantly, biocompatibility of the cell capsules is often compromised resulting in persistent inflammation, formation of foreign body giant cells, fibrosis, damage to the surrounding tissues and failure of the implant to control glucose.[8, 9]
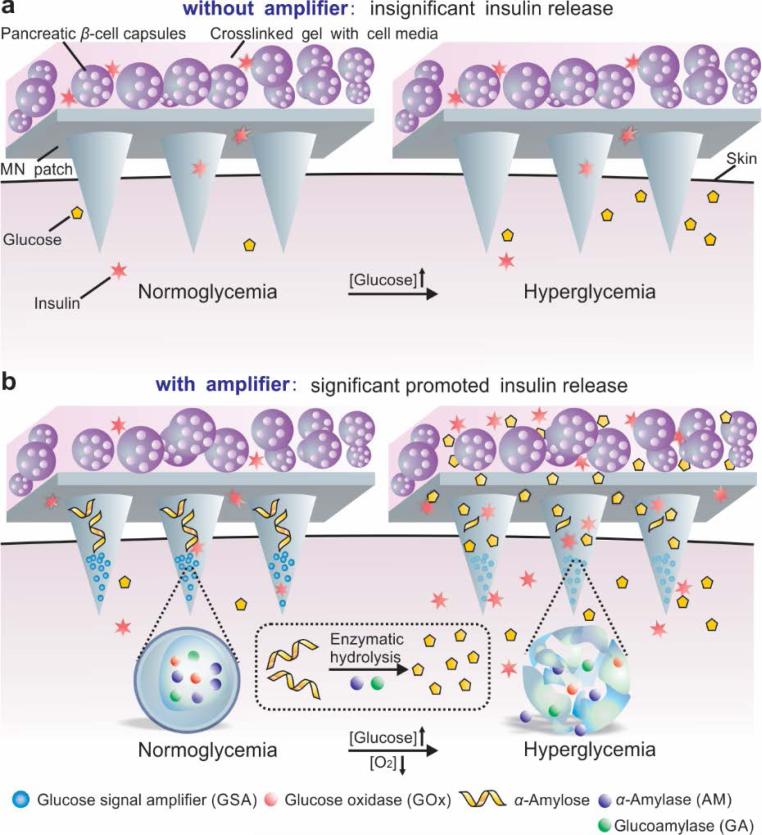
Herein, we describe a painless microneedle (MN) patch platform to modulate the insulin secretion from pancreatic β-cells for glucose-responsive regulation of blood glucose levels (BGLs) without implantation. As shown in Figure 1, this strategy integrates both live (cell-based) and synthetic glucose-responsive systems (L-S GRS) to allow the externally positioned β-cell capsules to sense glucose signals and to secrete insulin through the MN in a minimally invasive manner. Our preliminary design only integrated cell capsules with the MN patch made from the crosslinked hyaluronic acid (HA) (Figure 1a). We expected that under a hyperglycemic state, glucose could diffuse through the MN and interact with β-cells encapsulated in the alginate microgels in order to promote insulin secretion. However, due to the limited diffusion of glucose, the patch did not effectively respond to a hyperglycemic state and an insignificant increase in insulin secretion was detected. To effectively trigger the cellular response, the MN matrix reported here specifically contains synthetic “glucose-signal amplifiers” (GSAs) (Figure 1b). This innovative GSA is featured with self-assembled polymeric nanosized vesicles entrapping three enzymes: glucose oxidase (GOx), α-amylase (AM) and glucoamylase (GA). GOx converts glucose into gluconic acid in the presence of oxygen. AM hydrolyses the α-amylose into disaccharides and trisaccharides, which further converts to glucose by GA.[10]
Figure 1.
Schematic of the glucose responsive system (GRS) based on a microneedle-array patch integrated with pancreatic β-cells and glucose signal amplifiers (GSA). a) Without GSA, there is insignificant insulin release from the MN patch neither in normoglycemia nor hyperglycemia state. The MN patch is composed of crosslinked hyaluronic acid (grey). b) With GSA, there is significant promoted insulin release triggered by a hyperglycemia state. The MN patch is composed of crosslinked hyaluronic acid embedding assembled layers of α-amylose and GSA (from top to bottom).
Once subjected to the elevated BGLs, the GSA comprised of hypoxia-sensitive materials quickly disassociates to release the encapsulated enzymes in response to the rapid glucose oxidation by GOx and oxygen consumption:[11, 12]
The released enzymes subsequently hydrolyze α-amylose[13] embedded in the MN matrix, generating a local glucose-concentrated site. The “amplified” glucose effectively diffuses into the externally positioned β-cell capsules, promoting secretion and diffusion of insulin into the vascular and lymph capillary networks.[14] Using streptozotocin (STZ)-induced type 1 diabetic mouse as an animal model, we demonstrated that the GRS consisting of ~107 β-cells could quickly respond to a hyperglycemic state, decline and maintain BGLs at a reduced level for up to 10 hours. This cellular-synthetic hybrid glucose-responsive device with a physiological-signal amplifier modality presents a promising alternative to pancreatic β-cells implantation for tight regulation of BGLs.
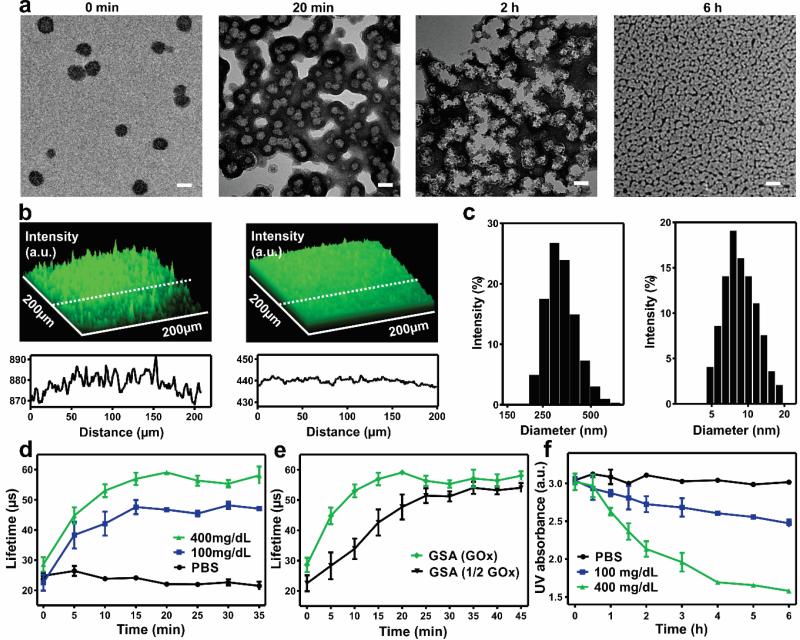
GSA was prepared by the solvent dialysis method for encapsulating three enzymes.[15] Briefly, amine-functionalized 2-nitroimidazole (NI) groups were covalently conjugated to the HA via an amide bond. The hypoxia-sensitive HA (HS-HA) functionalized with hydrophobic NI groups readily self-assembled into GSAs in the aqueous solution containing GOx, α-amylase and amyloglucosidase (Figure S1, Supporting Information). Under a hypoxic condition, the hydrophobic NI groups were reduced to hydrophilic 2-aminomidazoles via a single-electron reaction with NADPH catalyzed by nitroreductases.[16] The reduced product with amine groups was water-soluble, which facilitated the disassembly of GSA.[11, 17] The transmission electron microscopy (TEM) image (Figure 2a) showed that the GSA had a spherical shape with a monodisperse size. The average hydrodynamic size of GSA measured by dynamic light scattering (DLS) was 340 nm (Figure 2c), which was consistent with the TEM images. The zeta-potential of GSA was determined as −45.7 ± 2.4 mV due to the residual carboxyl of HA. The fluorescence image of GSA with fluorescein isothiocyanate (FITC)-labeled enzymes further verified successful co-encapsulation of the enzymes (Figure 2b). The loading capacity of GSA based on all the enzymes was determined as 7.4 ± 0.5 wt% and loading efficiency as 16.1 ± 1.0 wt%. The GSA was stable when incubated at 4°C and no noticeable turbidity change was observed over two weeks.
Figure 2.
Characterization of glucose signal amplifier (GSA). a) TEM images of enzymes-encapsulated GSA pre-, post-incubated in 400 mg/dL glucose solution for 20 min, 2 h and 6 h at 37°C respectively. Scale bar is 200 nm. b) (Top) Fluorescence 2.5D images of FITC-enzymes loaded GSA solution pre- and post- incubated in 400 mg/dL glucose solution for 2 h at 37°C. (Bottom) Distribution of the fluorescence intensity along the indicated white dash line. a.u., arbitrary unit. c) Size distribution of GSA pre- and post- incubated in 400 mg/dL glucose solution for 6 h. d) Phosphorescence lifetime profile for the GSA incubated in different glucose level solutions containing an oxygen concentration molecule probe. e) Phosphorescence lifetime profile for the GSA loaded with full or half dose of GOx in 400 mg/dL glucose solutions. f) Intensity of UV absorption at 330 nm of GSA in solutions with different glucose concentrations at 37 °C. Error bars indicate standard deviation (s.d.) (n = 3).
To assess the glucose-responsive capability of GSA in vitro, we examined the vesicles in 1×PBS buffer solutions with various glucose concentrations, including a typical hyperglycemic level (400 mg/dL), a normoglycemia level (100 mg/dL), and a control level (0 mg/dL). The hyperglycemia level generated a relatively lower oxygen environment in the GSA compared to the other two control groups, which was verified by an oxygen-sensitive phosphorescent molecular probe (Figure 2d). The oxygen level inside the GSA gradually reduced over time and reached equilibrium within 20 min. The oxygen consumption kinetics could be further modulated by altering the amount of GOx loaded into the vesicle, which showed a clearly delayed hypoxic effect with a half dose of GOx (Figure 2e). With the decline of oxygen level, the NI groups were effectively reduced by NADPH added into the solution. Correspondingly, the characteristic peak of NI at 330 nm in UV-Vis spectra decreased rapidly, which substantiated this bio-reduction reaction (Figure 2f). Due to the generation of water-soluble pendant groups on HS-HA, the GSA began to dissociate and subsequently release the encapsulated enzymes. As shown in TEM images, the GSA in 400 mg/dL glucose solution experienced gradual morphology changes from 20 min to 6 h (Figure 2a), which was consistent with the remarkable decline in the average hydrodynamic size, indicated by DLS (Figure 2c). In contrast, GSA incubated with no glucose or 100 mg/dL glucose displayed stable hydrodynamic size and no noticeable morphology change (Figure S2, Supporting Information). Furthermore, the release of encapsulated FITC-labeled enzymes from the dissociated vesicles was visualized by fluorescence microscopy. The fluorescence signal intensity was significantly decreased and presented homogeneous distribution after 2 hours, suggesting that the enzymes escaped from the dissociated GSA and evenly dispersed in the solution (Figure 2b).
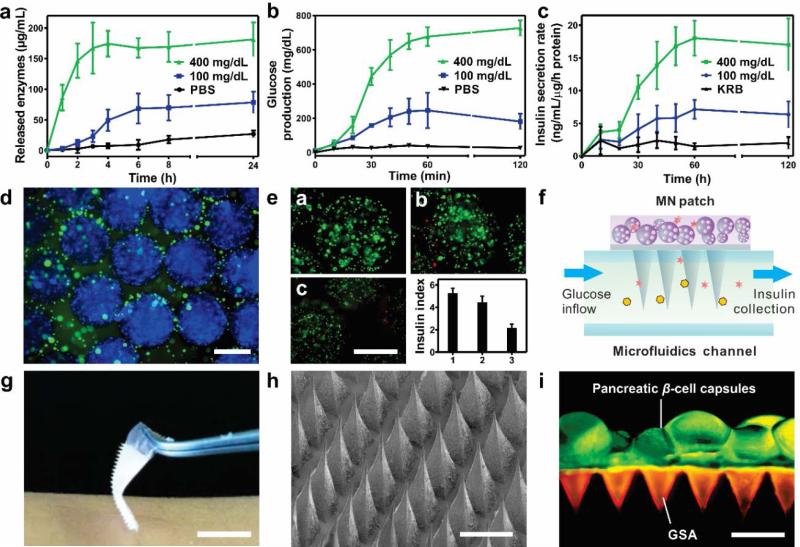
We next analyzed the enzyme release kinetics in response to the glucose level changes. No significant amount of released enzymes from GSA was detected within 24 h of incubation at a normal glucose level (100 mg/dL) and a control level (0 mg/dL) (Figure 3a). In sharp contrast, a rapid enzyme release rate was achieved from the GSA in the first 2 hours at a hyperglycemic environment (400 mg/dL). This could be attributed to the faster reduction of NI groups, which was induced by the hypoxic condition upon glucose oxidation.
Figure 3.
In vitro glucose-responsive studies of GSA and characterization of the MN patch and L-S GRS. a) In vitro accumulated enzymes release profile of the GSA in solutions with different glucose concentrations at 37°C. *P <0.05 for GSA in 400 mg/dL glucose solution compared with those in 100 or 0 mg/dL glucose concentration solutions. b) Accumulated glucose production from the α-amylose hydrolysis catalyzed by the released enzymes. *P<0.05 for GSA in 400 mg/dL glucose solution compared with those in 100 or 0 mg/dL glucose solutions. c) Insulin secretion rate profile of L-S GRS simulated by the inflow of different glucose solutions through a microfluidics device (100 and 400 mg/dL). (n = 3). d) Immunofluorescence image of the pancreatic β-cell capsules stained with insulin (green) and nucleus (blue). Scale bar is 500 μm. e) (a-c) Fluorescence images of the pancreatic β-cells from day 1 to day 3 after the encapsulation. Cells were stained with calcium-AM (live, green) and ethidium homodimer (dead, red). Scale bar is 500 μm. (bottom right) The insulin secretion index of the cells capsules as the function of time from day 1 to day 3 after encapsulation. Error bars indicate s.d. (n = 3). f) Schematic of stimulated insulin secretion from the L-S GRS using a microfluidics device. KRB with different glucose concentration flowed through the microfluidics channel and insulin secreted by the pancreatic β-cell capsules was collected from the outlet. g) Digital pictures of the GSA-loaded MN patch. Scale bar is 1 cm. h) SEM image of the MN patch. Scale bar is 500 μm. i) Fluorescence microscopy image of the L-S GRS: MN patch was loaded with rhodamine-labeled GSA and calcium AM-stained pancreatic β-cell capsules were positioned on the back of the MN patch. Scale bar is 500 μm.
Afterwards, the conversion from α-amylose to glucose catalyzed by the released enzymes from GSA was further investigated. The encapsulation ratio of AM to GA was pre-optimized as 1:2 by analyzing their enzymatic hydrolysis capability of α-amylose, indicated by the glucose production rate (Figure S3, Supporting Information). When AM and GA were utilized to saccharify 10 mg/mL α-amylose solution sequentially, the glucose production was readily increased to 816 ± 26 mg/dL, yielding an 81.6% conversion rate of α-amylose (Figure S4, Supporting Information). The circulation dichroism (CD) spectra confirmed that the released enzymes AM and GA from GSA maintained their secondary conformational structures (Figure S5, Supporting Information). Meanwhile, when the GSA was incubated in α-amylose solutions with various glucose concentrations, a significantly faster glucose production was achieved when incubated with 400 mg/dL glucose compared to the one with 100 mg/dL glucose (Figure 3b). It indicated that the enzymatic hydrolysis of α-amylose was activated by the gradual release of enzymes associated with the disassembly of GSA. Taken together, once “sensing” the elevated glucose level, the GSA could be activated to release the enzymes, which promoted the α-amylose-to-glucose conversion to amplify the glucose signal for downstream action.
We further investigated the use of MN patches for the delivery of insulin from pancreatic β-cell capsules. To create the “live” glucose-responsive component of the L-S GRS, the mouse islets β-cell lines were encapsulated in the alginate microgels with RGD[7] and type IV collagen[18] (packing density: 2 × 10⁶ cell/mL) to provide a matrix with biomimetic cell-ECM (extracellular matrix) adhesive interactions. Successful encapsulation was visualized by fluorescence microscopy with the concentrated cells and homogenous distribution of the secreted insulin surrounding the capsules (Figure 3d). The size of the obtained capsule was 735 ± 27 μm. The glucose stimulated insulin secretion (GSIS) analysis and live-dead assay were performed after day 1 to day 3 to validate that the encapsulated β-cells maintained their viability and functionality (Figure 3e).[7] The results indicated that the encapsulated β-cells could survive for a relatively long period of time and maintain normal glucose-responsive insulin secretion capability when compared their insulin secretion index with cells cultured on a 2D tissue culture plate (Figure S6, Supporting Information).
Meanwhile, the MN patch was fabricated using a micromolding approach. The resulting MN device had 400 pyramid needles in a 10-mm2 patch, and each needle had a side length of 400 μm at the base, a side length of 5 μm at the tip, and a height of 800 μm (Figure 3g, 3h). The needle was designed to have a triple-layered structure consisting of GSA, α-amylose and crosslinked hyaluronic acid matrix using alternating deposition. The mechanical strength of MN was determined as 0.18 N/needle, which was sufficient for skin penetration without breaking (Figure S7, Supporting Information).[19] A fluorescence view depicted the representative integration of MN patch with the pancreatic β-cells capsules (Figure 3i). GSAs were well distributed in tip region of the MNs and the cell-embedded capsules were positioned on the back of the MN patch.
The GSIS of L-S GRS was examined through the microfluidics (Figure 3f). The needles on the patch were incubated in an open microfluidic channel with continuous infusion of the Krebs-Ringer buffer (KRB) with a hyperglycemic level (400 mg/dL) and a normoglycemia level (100 mg/dL) respectively. The GSIS with the high glucose level infusion displayed a 3-fold increase compared to the low glucose one (Figure 3c). This was attributed to the hyperglycemic flow, which quickly promoted the dissociation of GSA; and the subsequent hydrolysis of α-amylose led to an amplified, sufficient glucose level signal for triggering the secretion of insulin from the β-cells capsules.
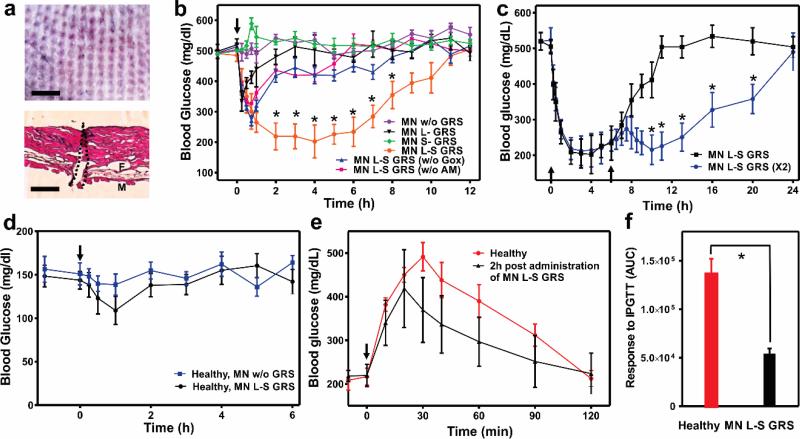
To investigate the in vivo efficacy of the glucose-responsive MN device, STZ-induced type 1 diabetic mice were subjected to transcutaneous administration of a variety of MNs samples: empty MNs without GRS (w/o GRS), MNs integrated with only L-GRS (L-GRS), MNs integrated with only S-GRS (S-GRS), MNs integrated with L-S-GRS (L-S GRS), MNs integrated with L-S-GRS but without GOx in S-GRS (L-S GRS (w/o GOx)), and MNs integrated with L-S-GRS but without α-amylose in S-GRS (L-S GRS (w/o AM)). Each MN patch was administered by a homemade applicator with 5N/patch to ensure the uniform penetration and was immobilized on the skin by topical skin adhesive. The excised skin tissue clearly showed the visible sites of needle insertion (Figure 4a, top) and the hematoxylin and eosin (H&E)-stained cross-section image indicated that MNs could penetrate to a depth of approximately 200 μm to the epidermis (Figure 4a, bottom), which allowed the GSA to be exposed to interstitial fluid in real-time.[19]
Figure 4.
In vivo studies of L-S GRS for type 1 diabetes treatment. a) Mouse dorsum skin was transcutaneously treated with MN patches. Scale bar is 1 mm (top); H&E stained cross-section of the treated skin indicated by the area within black dashed line (bottom). The regions of skin muscles and fat tissues are labeled as M and F, respectively. Scale bar is 200 μm. b) In vivo studies of the MN patches for STZ-induced type 1 diabetic mice treatment. Mice were subjected to transcutaneous administration with a variety of MNs samples: empty MNs without GRS (w/o GRS), MNs integrated with only L-GRS (L-GRS), MNs integrated with only S-GRS (S-GRS), MNs integrated with L-S-GRS (L-S GRS), MNs integrated with L-S-GRS but without GOx in S-GRS (L-S GRS (w/o GOx)), and MNs integrated with L-S-GRS but without α-amylose in S-GRS (L-S GRS (w/o AM)). *P < 0.05 for administration with MN integrated with L-S GRS compared with the control groups. c) BGLs change of diabetic mice treated with additional MN (L-S GRS) 6 h post administration. *P <0.05 for additional administration with MN compared with no additional administration. The black arrows indicate the administration points. d) BGLs change of the healthy mice after the MN administration (MN L-S GRS or empty MN (MN w/o GRS)). Error bars indicate s.d. (n = 5). e) Glucose tolerance test toward diabetic mice 2 h post administration of MNs with L-S GRS in comparison with the healthy control mice. The time points of administration were pointed out by the black arrows. f) The responsiveness was calculated based on the area under the curve (AUC) in 120 min, with the baseline set at the 0-min blood glucose reading. Error bars indicate s.d. (n = 5). *P < 0.05 for diabetic mice treated with MN L-S GRS administration compared to the healthy mice.
The BGLs of treated mice in each group were monitored over time. As shown in Figure 4b, the BGLs in mice treated with MN patch integrated with L-S GRS quickly declined to nearly 200 mg/dL within two hours and maintained in a significantly reduced level for 6 h without peaks of hyperglycemic or hypoglycemic states. In contrast, without the complete S-GRS (L-GRS group) or just lacking the responsive element-GOx (L-S GRS (w/o GOx) group) or amplifying element-AM (L-S GRS (w/o AM) group), the BGLs only decreased in the first hour, which could be explained by the diffusion of residual amounts of insulin detained in the hydrogel. Afterwards, the insulin secretion of β-cells maintained at the basal level and the BGLs of mice reverted to the hyperglycemic state. In the absence of β-cell capsules, the groups treated with MNs integrated with only S-GRS (S-GRS) or empty MN (w/o GRS) groups displayed no noticeable decline in BGLs as expected. The temporarily elevated BGLs in S-GRS group could be attributed to the induced hydrolysis of α-amylose and the host glucose clearance (Figure S8, Supporting Information).
To assess whether the MN patch could modulate the BGLs without causing potential risks of hypoglycemia, a group of STZ-induced mice were subjected to the MN patch replacement administration. The second MN patch treatment 6 hour post the first administration did not secrete excess insulin in absence of hyperglycemia trigger, which could avoid the hypoglycemia risk. Moreover, the additional MN patch was able to prolong the treatment efficiency in response to the elevated BGLs compared to the control (Figure 4c). The study on the healthy mice treated with MN patches integrated with L-S GRS and empty MN as control demonstrated that the device did not cause hypoglycemia (Figure 4d). Insignificant insulin release from the L-S GRS still maintained the BGLs of mice in a normal range. A glucose tolerance test demonstrated the tight glucose regulation capability on diabetic mice.[11, 20] At 2 h after administration of the L-S GRS, the diabetic mice were treated with an intraperitoneal glucose injection. BGLs of diabetic mice showed a 100 mg/dL increase and rapid decline to initial BGLs within 60 min (Figure 4e). The area under the curve between 0 and 120 min was calculated to indicate the MN maintenance of glucose homeostasis. Significant difference was observed between MN group and the control group 2 h post glucose challenge (Figure 4f).
To assess the biocompatibility of the GSA-loaded MN patch, the cytotoxicity of dissolved microneedles toward β-cells was evaluated by MTT assay (Figure S9, Supporting Information). The MNs and corresponding dissolved products did not show significant decrease of cell viability with the studied concentrations. The skin treated by the MN patch could rapidly recover within 8 h after MN removal and the H&E stained skin section of the injection site presented no obvious inflammation (Figure S10, Supporting Information).[21]
Currently, the biocompatibility and safety issues significantly hamper the clinical applications of pancreatic islet cells transplantation.[9, 22] Instead of utilizing traditional administration methods and relying on an invasive procedure, we developed a microneedle patch-based strategy to control the insulin secretion from externally positioned pancreatic β-cells, triggered by the internal hyperglycemic state. Importantly, for the first time, a synthetic amplifier was incorporated to quickly amplify the physiological signal, in this case “glucose level”, for effective transport of the signal and sufficient stimulation of insulin secretion from the β-cells. The results of serial treatments in vivo showed the potency of the MN patches in tight glucose regulation for a prolonged period. This method circumvents the challenging issues for pancreatic cells therapy associated with immune response and long-term efficacy. This effective administration period can be further extended by optimizing the density and viability of cells as well as the physicochemical properties of matrix material for transporting glucose and insulin. It is expected that the freshly-prepared patches with pig islets or stem cell-differentiated human pancreatic cells could be delivered to patients daily or every few days for ease of administration. Arguably more important from a fundamental perspective, this strategy also demonstrates the potential benefit of creating synthetic amplifiers for enhancing efficacy of physiological signal-responsive drug delivery systems when the original bio-signal is insufficient for triggering responsiveness.
Supplementary Material
Acknowledgements
This work was supported by the grants from the American Diabetes Association (ADA) to Z.G. (1-14-JF-29 and 1-15-ACE-21) and the grant from NC TraCS, NIH's Clinical and Translational Science Awards (CTSA, NIH grant 1UL1TR001111) at UNC-CH, the NC State Faculty Research and Professional Development Award and the National Science Foundation (NSF) through the ASSIST Engineering Research Center at NC State (EEC-1160483). We greatly thank Dr. Tushar K. Ghosh and Xiaomeng Fang for providing experimental facilities and assistance in device characterizations. We acknowledge the use of the Analytical Instrumentation Facility (AIF) at NC State, which is supported by the State of North Carolina and the National Science Foundation (NSF).
Footnotes
Supporting Information
Supporting Information is available from the Wiley Online Library or from the author.
Contributor Information
Yanqi Ye, Joint Department of Biomedical Engineering, University of North Carolina at Chapel Hill and North Carolina State University, Raleigh, NC 27695, USA; Division of Molecular Pharmaceutics and Center for Nanotechnology in Drug Delivery, Eshelman School of Pharmacy, University of North Carolina at Chapel Hill, Chapel Hill, NC 27599, USA.
Jicheng Yu, Joint Department of Biomedical Engineering, University of North Carolina at Chapel Hill and North Carolina State University, Raleigh, NC 27695, USA; Division of Molecular Pharmaceutics and Center for Nanotechnology in Drug Delivery, Eshelman School of Pharmacy, University of North Carolina at Chapel Hill, Chapel Hill, NC 27599, USA.
Dr. Chao Wang, Joint Department of Biomedical Engineering, University of North Carolina at Chapel Hill and North Carolina State University, Raleigh, NC 27695, USA Division of Molecular Pharmaceutics and Center for Nanotechnology in Drug Delivery, Eshelman School of Pharmacy, University of North Carolina at Chapel Hill, Chapel Hill, NC 27599, USA.
Nhu-Y Nguyen, Joint Department of Biomedical Engineering, University of North Carolina at Chapel Hill and North Carolina State University, Raleigh, NC 27695, USA.
Prof. Glenn M. Walker, Joint Department of Biomedical Engineering, University of North Carolina at Chapel Hill and North Carolina State University, Raleigh, NC 27695, USA
Prof. John B. Buse, Department of Medicine, University of North Carolina School of Medicine, Chapel Hill, NC 27599, USA
Prof. Zhen Gu, Joint Department of Biomedical Engineering, University of North Carolina at Chapel Hill and North Carolina State University, Raleigh, NC 27695, USA; Division of Molecular Pharmaceutics and Center for Nanotechnology in Drug Delivery, Eshelman School of Pharmacy, University of North Carolina at Chapel Hill, Chapel Hill, NC 27599, USA; Department of Medicine, University of North Carolina School of Medicine, Chapel Hill, NC 27599, USA.
References
- 1.Shaw JE, Sicree RA, Zimmet PZ. Diabetes Research and Clinical Practice. 2010;87:4. doi: 10.1016/j.diabres.2009.10.007. [DOI] [PubMed] [Google Scholar]; Belgium B. IDF Diabetes Atlas. 6th edn International Diabetes Federation; 2013. [Google Scholar]
- 2.Diabetes Care. 2012;36:S67. [Google Scholar]; Hayward RA. Jama. 1997;278:1663. [PubMed] [Google Scholar]; Owens DR, Zinman B, Bolli GB. The Lancet. 2001;358:739. doi: 10.1016/S0140-6736(01)05842-1. [DOI] [PubMed] [Google Scholar]
- 3.Ravaine V, Ancla C, Catargi B. Journal of Controlled Release. 2008;132:2. doi: 10.1016/j.jconrel.2008.08.009. [DOI] [PubMed] [Google Scholar]; Ricordi C, Strom TB. Nature Reviews Immunology. 2004;4:259. doi: 10.1038/nri1332. [DOI] [PubMed] [Google Scholar]; Steil G. Advanced Drug Delivery Reviews. 2004;56:125. doi: 10.1016/j.addr.2003.08.011. [DOI] [PubMed] [Google Scholar]; Gu Z, Biswas A, Zhao M, Tang Y. Chemical Society Reviews. 2011;40:3638. doi: 10.1039/c0cs00227e. [DOI] [PubMed] [Google Scholar]
- 4.Schneider S, Feilen PJ, Brunnenmeier F, Minnemann T, Zimmermann H, Zimmermann U, Weber MM. Diabetes. 2005;54:687. doi: 10.2337/diabetes.54.3.687. [DOI] [PubMed] [Google Scholar]; Barton FB, Rickels MR, Alejandro R, Hering BJ, Wease S, Naziruddin B, Oberholzer J, Odorico JS, Garfinkel MR, Levy M, Pattou F, Berney T, Secchi A, Messinger S, Senior PA, Maffi P, Posselt A, Stock PG, Kaufman DB, Luo X, Kandeel F, Cagliero E, Turgeon NA, Witkowski P, Naji A, O'Connell PJ, Greenbaum C, Kudva YC, Brayman KL, Aull MJ, Larsen C, Kay TWH, Fernandez LA, Vantyghem MC, Bellin M, Shapiro AMJ. Diabetes Care. 2012;35:1436. doi: 10.2337/dc12-0063. [DOI] [PMC free article] [PubMed] [Google Scholar]; Warnock GL, Thompson DM, Meloche RM, Shapiro RJ, Ao Z, Keown P, Johnson JD, Verchere CB, Partovi N, Begg IS, Fung M, Kozak SE, Tong SO, Alghofaili KM, Harris C. Transplantation. 2008;86:1762. doi: 10.1097/TP.0b013e318190b052. [DOI] [PubMed] [Google Scholar]
- 5.Merani S, Toso C, Emamaullee J, Shapiro AMJ. British Journal of Surgery. 2008;95:1449. doi: 10.1002/bjs.6391. [DOI] [PubMed] [Google Scholar]; Nishimura R, Goto M, Sekiguchi S, Fujimori K, Ushiyama A, Satomi S. Transplantation Proceedings. 2011;43:3239. doi: 10.1016/j.transproceed.2011.09.095. [DOI] [PubMed] [Google Scholar]; Pepper AR, Gala-Lopez B, Pawlick R, Merani S, Kin T, Shapiro AMJ. Nature Biotechnology. 2015;33:518. doi: 10.1038/nbt.3211. [DOI] [PubMed] [Google Scholar]
- 6.Zimmermann H, Shirley SG, Zimmermann U. Current Diabetes Reports. 2007;7:314. doi: 10.1007/s11892-007-0051-1. [DOI] [PubMed] [Google Scholar]; Pedraza E, Coronel MM, Fraker CA, Ricordi C, Stabler CL. Proceedings of the National Academy of Sciences. 2012;109:4245. doi: 10.1073/pnas.1113560109. [DOI] [PMC free article] [PubMed] [Google Scholar]
- 7.Lin CC, Anseth KS. Proceedings of the National Academy of Sciences. 2011;108:6380. doi: 10.1073/pnas.1014026108. [DOI] [PMC free article] [PubMed] [Google Scholar]
- 8.Veiseh O, Doloff JC, Ma M, Vegas AJ, Tam HH, Bader Andrew R., Li J, Langan E, Wyckoff J, Loo WS, Jhunjhunwala S, Chiu A, Siebert S, Tang K, Hollister-Lock J, Aresta-Dasilva S, Bochenek M, Mendoza-Elias J, Wang Y, Qi M, Lavin DM, Chen M, Dholakia N, Thakrar R, Lacík I, Weir Gordon C., Oberholzer J, Greiner DL, Langer R, Anderson DG. Nature Materials. 2015;14:643. doi: 10.1038/nmat4290. [DOI] [PMC free article] [PubMed] [Google Scholar]
- 9.Veiseh O, Tang BC, Whitehead KA, Anderson DG, Langer R. Nature Reviews Drug Discovery. 2014;14:45. doi: 10.1038/nrd4477. [DOI] [PMC free article] [PubMed] [Google Scholar]
- 10.Gurung N, Ray S, Bose S, Rai V. BioMed Research International. 2013;2013:1. doi: 10.1155/2013/329121. [DOI] [PMC free article] [PubMed] [Google Scholar]; Gupta R, Gigras P, Mohapatra H, Goswami VK, Chauhan B. Process Biochemistry. 2003;38:1599. [Google Scholar]; Kandra L. Journal of Molecular Structure: THEOCHEM. 2003;666-667:487. [Google Scholar]
- 11.Yu J, Zhang Y, Ye Y, DiSanto R, Sun W, Ranson D, Ligler FS, Buse JB, Gu Z. Proceedings of the National Academy of Sciences. 2015;112:8260. doi: 10.1073/pnas.1505405112. [DOI] [PMC free article] [PubMed] [Google Scholar]
- 12.Veiseh O, Langer R. Nature. 2015;524:39. doi: 10.1038/524039a. [DOI] [PubMed] [Google Scholar]
- 13.Peat S, Whelan WJ, Rees WR. Nature. 1953;172:158. doi: 10.1038/172158a0. [DOI] [PubMed] [Google Scholar]; Robyt JF, French D. Archives of Biochemistry and Biophysics. 1967;122:8. doi: 10.1016/0003-9861(67)90118-x. [DOI] [PubMed] [Google Scholar]; Whelan WJ, Roberts PJ. Nature. 1952;170:748. doi: 10.1038/170748a0. [DOI] [PubMed] [Google Scholar]
- 14.Harvey AJ, Kaestner SA, Sutter DE, Harvey NG, Mikszta JA, Pettis RJ. Pharmaceutical Research. 2010;28:107. doi: 10.1007/s11095-010-0123-9. [DOI] [PubMed] [Google Scholar]
- 15.Chung JE, Tan S, Gao SJ, Yongvongsoontorn N, Kim SH, Lee JH, Choi HS, Yano H, Zhuo L, Kurisawa M, Ying JY. Nature Nanotechnology. 2014;9:907. doi: 10.1038/nnano.2014.208. [DOI] [PMC free article] [PubMed] [Google Scholar]; Yu H, Qiu X, Nunes SP, Peinemann K-V. Nature Communications. 2014:5. doi: 10.1038/ncomms5110. [DOI] [PubMed] [Google Scholar]
- 16.Seki Y, Nakamura T, Okami Y. Journal of biochemistry. 1970;67:389. doi: 10.1093/oxfordjournals.jbchem.a129262. [DOI] [PubMed] [Google Scholar]
- 17.Hickey RJ, Haynes AS, Kikkawa JM, Park S-J. Journal of the American Chemical Society. 2011;133:1517. doi: 10.1021/ja1090113. [DOI] [PubMed] [Google Scholar]
- 18.Weber LM, Hayda KN, Haskins K, Anseth KS. Biomaterials. 2007;28:3004. doi: 10.1016/j.biomaterials.2007.03.005. [DOI] [PubMed] [Google Scholar]
- 19.Sullivan SP, Koutsonanos DG, del Pilar Martin M, Lee JW, Zarnitsyn V, Choi S-O, Murthy N, Compans RW, Skountzou I, Prausnitz MR. Nature Medicine. 2010;16:915. doi: 10.1038/nm.2182. [DOI] [PMC free article] [PubMed] [Google Scholar]
- 20.Chou DH-C, Webber MJ, Tang BC, Lin AB, Thapa LS, Deng D, Truong JV, Cortinas AB, Langer R, Anderson DG. Proceedings of the National Academy of Sciences. 2015;112:2401. doi: 10.1073/pnas.1424684112. [DOI] [PMC free article] [PubMed] [Google Scholar]
- 21.Yuan W, Xiaoyun H, Zaozhan W, Lizhu C, Liu Z, Fei W, Liangming Wei L. Drug Design, Development and Therapy. 2013:945. doi: 10.2147/DDDT.S44401. [DOI] [PMC free article] [PubMed] [Google Scholar]
- 22.Mitragotri S, Anderson DG, Chen X, Chow EK, Ho D, Kabanov AV, Karp JM, Kataoka K, Mirkin CA, Petrosko SH, Shi J, Stevens MM, Sun S, Teoh S, Venkatraman SS, Xia Y, Wang S, Gu Z, Xu C. ACS Nano. 2015;9:6644. doi: 10.1021/acsnano.5b03569. [DOI] [PMC free article] [PubMed] [Google Scholar]; Bratlie KM, York RL, Invernale MA, Langer R, Anderson DG. Advanced Healthcare Materials. 2012;1:267. doi: 10.1002/adhm.201200037. [DOI] [PMC free article] [PubMed] [Google Scholar]
Associated Data
This section collects any data citations, data availability statements, or supplementary materials included in this article.


