

Abstract
Objectives
Our goal is to develop a double lumen cannula (DLC) for a percutaneous right ventricular assist device (pRVAD) in order to eliminate two open chest surgeries for RVAD installation and removal. The objective of this study was to evaluate the performance, flow pattern, blood hemolysis, and thrombosis potential of the pRVAD DLC.
Methods
Computational fluid dynamics (CFD), using the finite volume method, was performed on the pRVAD DLC. For Reynolds numbers <4000, the laminar model was used to describe the blood flow behavior, while shear-stress transport k-ω model was used for Reynolds numbers >4000. Bench testing with a 27 Fr prototype was performed to validate the CFD calculations.
Results
There was <1.3% difference between the CFD and experimental pressure drop results. The Lagrangian approach revealed a low index of hemolysis (0.012% in drainage lumen and 0.0073% in infusion lumen) at 5 l/min flow rate. Blood stagnancy and recirculation regions were found in the CFD analysis, indicating a potential risk for thrombosis.
Conclusions
The pRVAD DLC can handle up to 5 l/min flow with limited potential hemolysis. Further modification of the pRVAD DLC is needed to address blood stagnancy and recirculation.
Keywords: heart failure, computational fluid dynamics, ventricular assist device, double lumen cannula, percutaneous
Introduction
Left ventricular assist devices (LVADs) are increasingly used to treat advanced heart failure with improved outcomes. About 40% of these patients develop right heart failure [1–3], which is difficult to predict before LVAD placement and typically manifests after LVAD installation [2, 4, 5]. One third of these right heart failure patients need a right ventricular assist device (RVAD), requiring a second open chest procedure for its installation [2]. Usually, the need for right ventricle (RV) support is temporary, and a third open chest procedure is required to remove the RVAD. These two procedures for RVAD installation and removal add additional risks, significantly contributing to LVAD morbidity and mortality.
A percutaneous RVAD (pRVAD) system eliminates two open chest procedures for RVAD installation and removal, decreasing the overall morbidity/mortality of post-LVAD right heart failure. Current pRVAD application is based on the off-label use of two TandemHeart™ cannulas for right atrium (RA) drainage and pulmonary artery (PA) infusion [6, 7]. However, this percutaneous technique is rarely used for RVAD application. The two separate venous cannulations require a long circuit to connect the blood pump, resulting in a large artificial surface-blood contact area and high blood resistance, which compromises RVAD performance. Furthermore, the femoral cannulation prevents ambulation. The A-Med was another two cannula RVAD system with the infusion cannula inside the drainage cannula. This system was designed for short-term (hours) support in off-pump coronary artery bypass surgery and was contraindicated for ambulation [8, 9]. The Impella RP is a single cannula system that has been used for RVAD application in Canada. However, the integration of the pump prevents guide wire usage. Therefore, the Impella RP can only be inserted from the femoral vein, which limits patient mobility [10, 11].
We are developing a double lumen cannula (DLC) for a pRVAD system that can be easily placed in the right jugular vein (RJV) during LVAD implantation and easily removed without surgery when right heart failure resolves. Compared to femoral vein access, right jugular vein cannulation has a much shorter route to the PA, can accommodate a much larger cannula for higher performance, and allows moderate ambulation.
This paper presents the numerical analysis of a pRVAD DLC model using computational fluid dynamics (CFD). The CFD results were used to predict the DLC performance and the potential for blood hemolysis/thrombosis. The CFD pressure drop results were validated by bench data from a 27 Fr pRVAD DLC prototype with <1.3% error.
Materials and Methods
pRVAD DLC Design
The pRVAD DLC is designed for one site cannulation from the RJV. The infusion tip is advanced through the superior vena cava to the PA via the RA and RV, with the drainage opening positioned in the RA. This DLC is coupled with a blood pump to establish a pRVAD system (Fig. 1A). This system withdraws blood from the RA and delivers it to the PA, bypassing the RV for right heart support.
Figure 1.
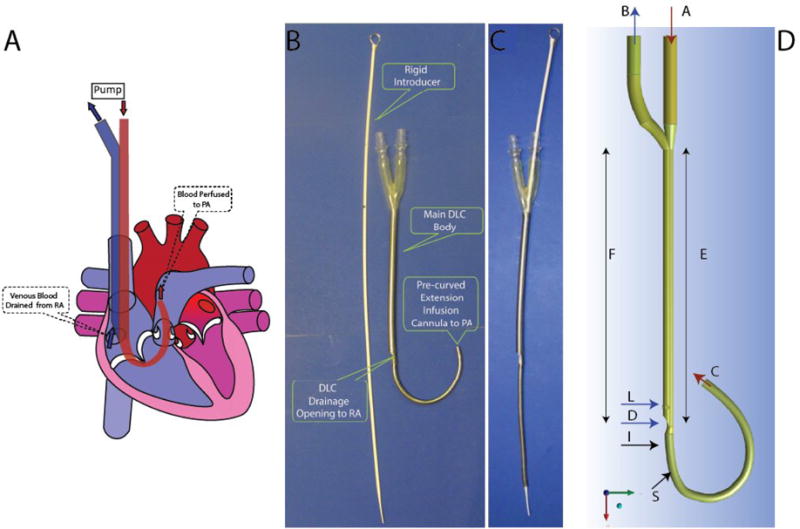
A. Implantation of pRVAD DLC. The drainage lumen is shown in blue and the infusion lumen/extension infusion cannula (EIC) is shown in red. The pRVAD DLC is positioned through the superior vena cava. The drainage lumen withdraws blood from the right atrium (RA), and the EIC perfuses the pulmonary artery (PA). B. The first pRVAD DLC prototype. The pRVAD DLC without rigid introducer allows EIC curvature. C. A rigid introducer straightens the EIC to facilitate insertion. D. The Computer Aided Design Model of pRVAD DLC. Blue arrows show blood flow through the drainage lumen and red arrows indicate blood flow through the infusion lumen (A: inlet infusion lumen; B: outlet drainage lumen; C: outlet infusion lumen; D: inlet drainage lumen; E: infusion main body; F: drainage main body; I and S: outer EIC sections where recirculation was found; L; later drainage inlets).
The pRVAD DLC consists of a main body and an extension infusion cannula (EIC) (Fig. 1B). This DLC is made of thin-walled polyurethane with stainless steel flat wire reinforcement which allows for greater flow rates and kink resistance. The infusion lumen within the main body is an eccentric membrane sleeve, maximizing the cross-sectional area of each DLC lumen. Under a pressure difference between the drainage and infusion lumens, the cylinder shape of the membrane sleeve is very stable and does not collapse [12, 13]. The infusion membrane sleeve extends out of the DLC main body to become an EIC. The EIC is curved to fit the sharp angle between the RA-RV and the RV-PA. A rigid introducer is placed inside the infusion lumen and EIC, which straightens the curved EIC for easy DLC insertion from the RJV (Fig 1C). When the EIC tip reaches the RV, the introducer is held stationary and only the DLC is advanced until the infusion tip enters the PA, while the drainage lumen resides in the RA.
Numerical Analysis
Using a commercial CFD software package (Fluent v14.5, ANSYS Inc.), the numerical analysis was carried out separately for the two different fluid domains (drainage and infusion DLC lumens) for blood flow rates of 1–5 l/min. To analyze blood flow in laminar regions (Reynolds number, Re< 2000), the laminar model was used. Flow rates with the Re>4000 were modeled using the shear-stress transport (SST) k-ω model[14]. The Menter SST k-ω model is a hybrid model which solves the fully turbulent regions far from the wall using the k-ε model and the blood regions near the wall, transforming the k-ε to the k-ω model[15]. Fraser et al.[15, 16] highlighted the dubious accuracy of the turbulent models to describe transitional flow, since the turbulent models can describe the behavior of the fluid only if a turbulent boundary layer exists next to the wall and a fully turbulent flow is developed far from the wall. Therefore, the transitional flows (2000 <Re < 4000) were modeled using the laminar model. The drainage lumen model was solved using the semi-implicit method for pressure-linked equations (SIMPLE). The SIMPLE method is used to iteratively solve steady state problems. First, an approximation of the velocity field is obtained by solving the momentum equation. The pressure gradient is calculated from the pressure distribution of a previous iteration or from an initial guess. Then, the equation for the pressure correction (Poisson equation) is solved to calculate the new pressure distribution, and the velocity is corrected [14]. The infusion lumen model was solved using the coupled pressure-velocity solver. The second-order upwind scheme was set for all simulations.
Computational Domain
The three-dimensional geometry of both domains was constructed using commercial computer aided design software (Rhinoceros 2.0, Fig 1D). The main DLC OD (section R) is 27 Fr (9 mm), and the EIC OD is 20 Fr (6.7 mm). The length of the DLC main body is 188 mm, and the length of the EIC is 151.8 mm. The infusion lumen diameter of main DLC body (section E) is 4 mm, and the EIC lumen diameter (section C) is 5.8 mm. For the drainage lumen, the inlet hydraulic diameter (section D) is 3.4 mm, and the three side holes (additional drainage openings) have a diameter of 2.8 mm.
Mesh
The computational domains were discretized using an unstructured tetrahedral mesh. To estimate the grid function convergence, five different meshes were evaluated. For the infusion lumen, the mesh size variation was from 120K (coarsest) to 3.9M cells (finest). For drainage lumen, the mesh size variation was from 69K (coarsest) to 2.7M cells (finest). The error between the coarser meshes (f*) and the finest mesh (f) was quantified by the Euclidian norm as [17]:
| (1) |
where f is the theoretical exact solution, n is the number of grid cells and f* denotes the grid functions for the coarser grid. This f* ≡ (p*,u*)T is described by dimensionless pressure drop (p*) and maximum velocity (u*) according to:
| (2) |
and
| (3) |
where is the dynamic pressure and Uinlet is the inlet velocity.
A least-squares correlation was used to fit the errors, obtaining convergence rate for the second-order numerical method of 1.73 for the infusion lumen and 1.42 for drainage lumen. For infusion lumen, the finest mesh error was estimated to be 4.4% for velocity and 1.8% for the pressure drop. For the drainage lumen, the finest mesh error was estimated to be 2.7% for velocity and 1.3% for pressure drop. All data is presented using the grids with the highest resolution (2.7M cells for drainage lumen and 3.9M cells for infusion lumen).
Flow Regimes
To model blood flow in the pRVAD DLC, the Reynolds number was first calculated as:
| (4) |
where ρ is the fluid density, ν is the average velocity (of either the infusion or drainage lumen), D is the diameter, and μ is the viscosity. Flow is generally considered laminar for Re < 2000, transitional for 2000 < Re < 4000, and turbulent for Re > 4000 (Table 1).
Table 1.
Reynolds Number and Blood Flow Patterns
| Q [l/min] | Infusion Lumen | Drainage Lumen | ||
|---|---|---|---|---|
| 1 | 1526 | Laminar flow pattern | 964 | Laminar flow pattern |
| 2 | 3104 | Transitional flow pattern | 1855 | Laminar flow pattern |
| 3 | 4452 | Turbulent flow pattern | 2787 | Transitional flow pattern |
| 4 | 5991 | Turbulent flow pattern | 3668 | Transitional flow pattern |
| 5 | 7479 | Turbulent flow pattern | 4664 | Turbulent flow pattern |
Reynolds numbers increase with increasing flow rates. Low flow rates are associated with a laminar flow pattern while the high flow rates exhibit a turbulent flow pattern.
Boundary Conditions
Blood was approximated as a homogeneous and incompressible fluid with a constant viscosity [18]. Blood was modeled with a density, ρ, of 1060 kg/m3 and a dynamic viscosity, ν, of 0.0035 Pa·s. For the infusion lumen, the velocity profile was defined as boundary condition on section A (Fig. 1D) and zero reference pressure was imposed on outlet C (pc). Constant pressures were used as the boundary conditions for the drainage lumen (inlets D and L and outlet B in Fig. 1D). Cannula walls were assumed to be rigid and impermeable, and no-slip condition, νwall = 0, was used.
Convergence Criterion
Calculation convergence was evaluated by setting the relative tolerance for residuals error equal to 10−3. The solution of laminar flow was considered to be convergent for residuals of continuity and the three velocity components less than this value. The solution of turbulent flow was considered to be convergent for the residuals of kinetic energy (k) and dissipation rate (ω) less than this threshold.
Flow Analysis and Index of Hemolysis
To estimate the clinical complications related to device geometry, the evaluation of the exposure time at certain levels of shear stress is required [19]. Dasi et al.[19] suggested that the Lagrangian-tracking method may result in the evaluation of blood cell damage along the tested device. To quantify the hemolysis index by the Lagrangian approach, the power law, which describes the scalar transport hemolysis model equation, is implemented as [15, 20]:
| (5) |
where HIflow is the index of hemolysis, τ is the shear stress [21] and T is the exposure time. The model proposed by Heuser et al.[22] (C = 1.8 · 10−6, α = 0.7650, β = 1.9910) is used to predict hemolysis for short exposure time (t<700ms) and shear stress < 700 Pa. The shear stress and the exposure time along the whole DLC body were smaller than 700 Pa and 700 ms, respectively. Therefore, the Heuser model[22] was acceptable for DLC blood damage analysis.
Flow paths extending the length of the infusion and drainage lumens (totaling 287 and 117, respectively) were integrated and averaged for each flow rate in the study to provide an approximation of the hemolysis index according to Eq. 5[23].
Fraser et al. [16] used blood stagnation, recirculation, and low shear rate as indices of potential thrombosis formation. In the current study, the following criteria were used for determining the risk of thrombosis: 1) stagnant flow (blood velocity < 1mm/s); 2) recirculation (x axis velocity u is negative); and 3) low shear rate (< 250s−1) [16, 24].
Prototype Fabrication and Bench Test
A 27 Fr pRVAD DLC prototype was fabricated at W–Z Biotech, LLC (Lexington, KY). The DLC was constructed from polyurethane with reinforced stainless steel wire by a dip molding process (0.7 mm wall thickness). The infusion lumen inside the main body was an eccentric thin membrane sleeve (0.3 mm thickness). Thermoforming was used to curve the EIC to fit the sharp angle of the RV inflow/outflow tracts. A rigid introducer was made of polyvinylchloride with an embedded stainless steel rod (Figs. 1B and 1C).
The bench test was performed in a simulation circuit, which included the pRVAD DLC, a CentriMag blood pump (Thoratec, Pleasanton, CA), and a reservoir. To mimic human blood viscosity at 37°C, a 37% w/v glycerin solution (at room temperature) was used in the simulation circuit. The inlet pressure of the DLC infusion lumen and the outlet pressure of the DLC drainage lumen were measured by TruWave pressure transducers (Edwards Life sciences, Irvine, CA). The circuit flow was measured using a T110 flowmeter (Transonic Systems Inc., Ithaca, NY) with a H9XL tubing flow sensor. The pressure and flow rate were recorded with acDAQ9172 Data Acquisition system which included NI 9237pressure module, NI 9215 flow module, and DAQ LabVIEW 8.6 (National Instruments, Austin, TX).
CFD Validation
To validate the CFD model, the pressure drop error between the experimental data and the CFD data was calculated for all flow rates. This error was obtained from the following percentage error formula:
| (10) |
where ΔPEXP is the experimental pressure drop, ΔPCFD is the CFD pressure drop and n are the number of measures.
Results
pRVAD DLC Performance
The CFD simulation predicted the pRVAD DLC pressure drop very well for all flow rates tested (1–5 l/min) with the difference between the numerical and experimental data being 1.3% (Fig. 2). As flow rates increased from 1 to 5 l/min, the drainage lumen negative pressure increased from −13.49 mm Hg to −184.25 mm Hg. The infusion lumen pressure increased from 28.03 mm Hg to 343.53 mm Hg.
Figure 2.

CFD and Experimental Data Flow-Pressure Comparison. The numerical results were considered validated according to the close fit with experimental pressure data.
Shear Stress and Hemolysis Index
Studies addressing the highest potential for blood damage were conducted at the 5 l/min flow rate. The highest shear stress in the infusion lumen was calculated to be 356.9 Pa and was located at the junction between connection tubing and main section E (membrane sleeve lumen, Fig. 3A). The infusion lumen cannula index of hemolysis, calculated as described above, was 0.0073%. The highest shear stress in the drainage lumen was located at the downstream edge of three side drainage holes (Fig. 3B), and was calculated as 409.1 Pa with a drainage lumen index of hemolysis of 0.012%.
Figure 3.

Shear Stress Distribution. A. Infusion Lumen. The dashed line shows maximum shear stress region magnified on bottom panel. The maximum shear stress reached 356.9 Pa at the beginning of the EIC of the main section (membrane sleeve lumen). B. Drainage Lumen. The bottom panel shows the maximum shear stress region. The maximum shear stress was 409.1 Pa, located in downstream edge of three side drainage holes, contributing to 37% of the total blood drainage. The numbers reported in parenthesis in the colored scale are used to mark the corresponding value of the shear stress in the different regions of the DLC in Figure 3A and Figure 3B.C. IH% variations along the flow rate. The red line refers to the infusion lumen, and the blue line refers to the drainage lumen. Increasing flow rate resulted in a rise in the index of hemolysis percent (IH%).
Velocity Pattern and Thrombogenic Risk
Maximal shear stress is directly related to the velocity gradient and was measured for flow rates up to 5 l/min. The highest velocity in the infusion lumen was 2.2 m/s at 1 l/min and 8.8 m/s at 5 l/min. Similarly, maximum drainage lumen velocities were 1.2 m/sat 1 l/min and6.3 m/s at 5 l/min (Fig 4A). Recirculation volume increased with increasing flow rates (Fig 4B).
Figure 4.

A.Highest Velocity Variation. The red line shows the velocity variation for the infusion lumen and the blue line for the drainage lumen. B. Recirculation Volume. Recirculation was defined as a negative x axis velocity.
Figure 5 shows the velocity contour and the recirculation regions. For the infusion lumen, the highest blood velocity was in the membrane sleeve (Fig. 1D, section E), and the outer edge at the beginning of EIC curve (section S). For the drainage lumen, the highest blood velocity was in the downstream edge of the three side drainage holes.
Figure 5.
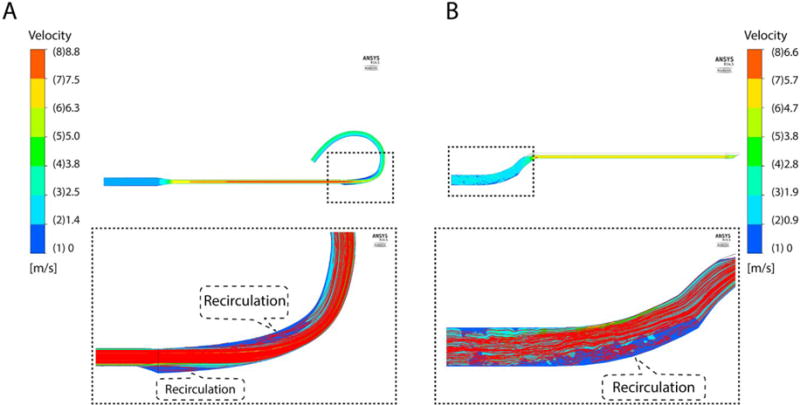
Velocity Flow Field and Path Lines. A. Infusion Lumen/EIC. At highest flow (5 l/min), the highest velocity was 8.8 m/s, located on main section. The dashed line shows recirculation region magnified on bottom panel. Recirculation was found in outer edge at beginning of EIC and in inner edge at EIC curve due to increased cross-sectional area. B. Drainage Lumen. At 5 l/min flow, the maximum velocity was 6.3 m/s, found on main section. The bottom panel shows recirculation region near outer edge of S-shape outlet drainage.
Recirculation was found in the infusion lumen for flow rates >3 l/min and for all flow rates tested in the drainage lumen. Recirculation in the infusion lumen occurred in the EIC near the beginning of the outer edge (section I) and at the inner edge of the EIC curve (section S) (Figure 5A). In the drainage lumen, recirculation flow was observed near the outer edge of S-shape outlet tubing (Fig 5B).
While high blood flow may cause recirculation, low flow velocity (blood velocity < 1 mm/s) and/or low shear rate (<250s−1) can result in blood stagnancy [16, 20]. At 1 l/min blood flow, the lowest infusion lumen velocity was 0.16 mm/s, and the lowest drainage velocity was 0.18 mm/s (Fig.6A). As expected, the volume of stagnant flow/low shear rate was found to decrease with the increasing flow rate (Fig. 6B and 6C). Stagnant flow was found for flow rates <2 l/min in the same regions of the infusion lumen that experienced recirculation (Fig. 7). Likewise, simulations predicted stagnant flow regions in the s-shaped outlet region of the drainage cannula for 1–3 l/min flow rates. Low shear rates were found at all flow rates tested at outer edge at the beginning of EIC (section I) and the inner edge of the EIC curve (Section S) (Fig 7).
Figure 6.

A. Lowest Velocity Variation. B. Blood Stagnation Volume. C. Wall Shear Rate Volume. Red line shows the variation for the infusion, and the blue line for the drainage lumen. The green line marked the stagnant velocity threshold. Blood stagnation was defined as a velocity < 1mm/s. The shear rate was considered low at values < 250/s.
Figure 7.

Velocity Flow Field and Stagnant Flow Volume. A. Infusion Lumen/EIC. At lowest flow (1 l/min), the lowest velocity was 0.16 mm/s. In the magnified bottom panel, the stagnant area was found in the outer edge at beginning of EIC and in the inner edge at EIC curve due to low velocity (red) and low shear stress (green). B. Drainage Lumen. At 1 l/min flow, the minimum velocity was 0.18 mm/s. In the magnified bottom panel, the stagnant area was due to low velocity (red) and low shear stress (green) on cannula outlet.
Discussion
Numerical studies of a 27 Fr pRVAD DLC were shown to compare well with experimental pressure drop measurements with an error of 1.3%. These results predicted that our 27 Fr pRVAD DLC can handle up to 5 l/min blood flow rates with very limited potential for hemolysis. However, this CFD study also showed blood stagnancy and recirculation in the curved areas of both pRVAD DLC lumens, indicating a potential risk for thrombosis.
Some of the major concerns in heart assist cannula application are blood cell damage and thrombosis formation. Blood cell damage is related to high shear stress (> 250 Pa) [25, 26]. In the current study, the maximal shear stress at 5 l/min blood flow was relatively high, 356.9 Pa in the infusion lumen and 409.1 Pa in the drainage lumen. However, the hemolysis index calculated by the Lagrangian approach was only 0.012% in the drainage lumen and 0.0073% in the infusion lumen. This hemolysis index is low when compared with data reported in the literature [27]. For blood flows ≤ 4l/min, the shear stress was ≤250 Pa and the hemolysis index calculation suggested a low risk of hemolysis. Thus, our 27 Fr DLC is potentially safe in terms of high shear stress-induced blood cell damage for flow rates <4 l/min, which is the main range for long-term application.
The cellular models developed to predict clotting risk are inappropriate for studying platelet activation and adhesion in artificial assist devices due to the high computational cost [15]. Furthermore, there are no previous numerical studies showing clot and thrombus deposition in the ventricular assist device cannula environment. However, known thrombosis risk factors may allow the range of flow rates with low thrombosis potential to be defined. These thrombosis risk factors include blood stagnancy, low shear rate, and recirculation [16, 24]. Stagnant flow exists for 1–3 l/m blood flow in the current pRVAD design, but the volume is very low (< 0.2 mm3), which may not be clinically relevant. This stagnant flow may be eliminated by changing the cannula ID gradually/smoothly. Low shear rate exists, especially at 1–2 l/min blood flow, which is potentially thrombogenic. The recirculation volume is significant, especially at 5 l/min flow rate, which may cause thrombosis in clinical situation. Therefore, the problem of thrombosis generation, particularly in the EIC region of the pRVAD DLC, must be addressed prior to clinical application.
Our DLC is specifically designed for long-term (week to month) pRVAD application. Our unique pRVAD DLC features: 1) a very strong, one piece polyurethane molding construction with embedded flat stainless steel wire reinforcement for longer-term ambulatory application; 2) an ultrathin membrane infusion lumen designed for very high efficiency. This design is based on our active patent[28], which has been commercialized as the AvalonElite DLC. The AvalonElite DLC has been successfully applied in extracorporeal membrane oxygenation (ECMO) with proven long term (month) durability and high performance [29–31]. The A-Med jugular coaxial cannula was a two separate cannula system with the infusion cannula inside the drainage cannula. It was designed for short-term (hours) heart support in off-pump coronary artery bypass surgery, but was not designed for longer-term (days) RV support. The A-Med cannula was also not secured for ambulation. The A-Med system wasn’t commercialized and no longer exists [8, 32–35]. Most recently, the Protek Duo-TandemHeart system has been used for RVAD. [36]. However, this DLC was not designed for RVAD, and was only approved by the FDA for VV ECMO. Therefore, its RVAD usage is an off-label application. The Impella RP has been used for RVAD in Canada. Since the pump integration prevents guide wire usage, the Impella RP can only be inserted from femoral vein, which limits patient mobility [10, 11].
Like all the other heart assist devices, stagnant flow and related thrombosis in RV/RA is a concern if very high RVAD pumping flow is needed. However, most of the time, the patient does not need high pumping flow, good amount of blood flow through RA/RV. The EIC is only 7.5 mm OD, which is only 15% of the total area of average adult PA (20 mm OD). Therefore, our pRVAD would not block PA[7]. We expect the distance between the tricuspid valve and PA valve to be variable. Although this variability is small and the length of the main PA will compensate for some of this variability, we may need an additional longer or shorter version of the EIC. The curved EIC is formed by plastic thermo molding. The elastic force is small, just good for easier insertion. This curved EIC will adapt to patient anatomy well and will not hit the PA wall. Either Echo or X-ray, along with a guide wire can be used which will aide in cannula EIC tip placement. The 5 l/min is a theory number, indicating potential flow. We reached this flow in bench test with CentriMag pump. If 5 l/min flow is needed, a 31 Fr version of the pRVAD DLC is required for less pressure difference and less negative drainage flow.
Limitations
We treated blood as a Newtonian fluid for simplicity. However, blood is a non-Newtonian fluid, although its behavior is very similar to a Newtonian fluid for shear rates >100/s. We also did not account for blood pulsatility from heart motion[16]. Furthermore, we did not take into account the accumulated blood damage due to multiple shear stress exposures from multiple blood cycles through cannula. We could not validate this CFD velocity distribution with particle image velocimetry (PIV) due to the DLC’s stainless steel wire reinforcement which blocks the PIV laser. Since our initial pRVAD DLC prototype did not have an ideal geometry and smooth surface, both of which will cause additional hemolysis, this initial prototype was not suitable for experimental hemolysis validation of the CFD analysis. However, in the current CFD study, it was important to localize the critical regions to guide future optimization of pRVAD DLC design even though it is not validated. The final optimized pRVAD DLC will be validated with blood circuit experimental data such as NIH.
Conclusion
CFD simulations were validated by experimental pressure drop data and predicted that our custom 27 Fr pRVAD DLC can handle up to 5 l/min blood flow with limited potential hemolysis. High flow causes recirculation and low flow can result in stagnancy and low shear stress, which are risk factors for thrombosis formation. Further design optimization is required to minimize the thrombogenic potential of the current pRVAD DLC.
Acknowledgments
Funding Source Declaration: This work was supported by NIH grant 1R43HL110562-01A1 and Johnston-Wright Endowment, University of Kentucky Department of Surgery.
Footnotes
Publisher's Disclaimer: This is a PDF file of an unedited manuscript that has been accepted for publication. As a service to our customers we are providing this early version of the manuscript. The manuscript will undergo copyediting, typesetting, and review of the resulting proof before it is published in its final citable form. Please note that during the production process errors may be discovered which could affect the content, and all legal disclaimers that apply to the journal pertain.
References
- 1.Frederick JR, Hsu VM, Kozin ED, O’Hara ML, Howell E, et al. Risk score derived from pre-operative data analysis predicts the need for biventricular mechanical circulatory support. J Heart Lung Transplant. 2008;27:1286–92. doi: 10.1016/j.healun.2008.09.006. [DOI] [PMC free article] [PubMed] [Google Scholar]
- 2.Dang NC, Topkara VK, Mercando M, Kay J, Kruger KH, Aboodi MS, et al. Right heart failure after left ventricular assist device implantation in patients with chronic congestive heart failure. J Heart Lung Transplant. 2006;25:1–6. doi: 10.1016/j.healun.2005.07.008. [DOI] [PubMed] [Google Scholar]
- 3.Matthews JC, Koelling TM, Pagani FD, Aaronson KD. The right ventricular failure risk score a preoperative tool for assessing the risk of right ventricular failure in left ventricular assist device candidates. J Am Coll Cardiol. 2008;51:2163–72. doi: 10.1016/j.jacc.2008.03.009. [DOI] [PMC free article] [PubMed] [Google Scholar]
- 4.Kavarana MN, Pessin-Minsley MS, Urtecho J, Catanese KA, Flannery M, Oz MC, et al. Right ventricular dysfunction and organ failure in left ventricular assist device recipients: a continuing problem. Ann Thorac Surg. 2002;73:745–50. doi: 10.1016/s0003-4975(01)03406-3. [DOI] [PubMed] [Google Scholar]
- 5.Ochiai Y, McCarthy PM, Smedira NG, Banbury MK, Navia JL, Feng J, et al. Predictors of severe right ventricular failure after implantable left ventricular assist device insertion: analysis of 245 patients. Circulation. 2002;106:I198–202. [PubMed] [Google Scholar]
- 6.Atiemo AD, Conte JV, Heldman AW. Resuscitation and recovery from acute right ventricular failure using a percutaneous right ventricular assist device. Catheter Cardiovasc Interv. 2006;68:78–82. doi: 10.1002/ccd.20691. [DOI] [PubMed] [Google Scholar]
- 7.Kiernan MS, Krishnamurthy B, Kapur NK. Percutaneous right ventricular assist via the internal jugular vein in cardiogenic shock complicating an acute inferior myocardial infarction. J Invasive Cardiol. 2010;22:E23–6. [PubMed] [Google Scholar]
- 8.Mathison M, Buffolo E, Jatene AD, Jatene FB, Reichenspurner H, Matheny RG, et al. Right heart circulatory support facilities coronary artery bypass without cardiopulmonary bypass. Ann Thorac Surg. 2000;70:1083–5. doi: 10.1016/s0003-4975(00)01827-0. [DOI] [PubMed] [Google Scholar]
- 9.Wirtz SP, Schmidt C, Van Aken H, Brodner G, Hammel D, Scheld HH, et al. Temporary right heart support with percutaneous jugular access. Ann Thorac Surg. 2006;81:701–5. doi: 10.1016/j.athoracsur.2005.08.003. [DOI] [PubMed] [Google Scholar]
- 10.Anderson MB, Goldstein J, Milano C, Morris LD, Kormos RL, Bhama J, et al. Benefits of a novel percutaneous ventricular assist device for right heart failure: The prospective RECOVER RIGHT study of the Impella RP device. J Heart Lung Transplant. 2015;34:1549–60. doi: 10.1016/j.healun.2015.08.018. [DOI] [PubMed] [Google Scholar]
- 11.Cheung AW, White CW, Davis MK, Freed DH. Short-term mechanical circulatory support for recovery from acute right ventricular failure: clinical outcomes. J Heart Lung Transplant. 2014;33:794–9. doi: 10.1016/j.healun.2014.02.028. [DOI] [PubMed] [Google Scholar]
- 12.Bermudez CA, Rocha RV, Sappington PL, Toyoda Y, Murray HN, Boujoukos AJ. Initial experience with single cannulation for venovenous extracorporeal oxygenation in adults. Ann Thorac Surg. 2010;90:991–5. doi: 10.1016/j.athoracsur.2010.06.017. [DOI] [PubMed] [Google Scholar]
- 13.Wang D, Zhou X, Liu X, Sidor B, Lynch J, Zwischenberger JB. Wang-Zwische Double Lumen Cannula-Toward a Percutaneous and Ambulatory Paracorporeal Artificial Lung. ASAIO Journal. 2008;54:606–11. doi: 10.1097/MAT.0b013e31818c69ab. [DOI] [PubMed] [Google Scholar]
- 14.Fluent User’s Guide Version 6.3. NH: Ansys Fluent Inc; 2006. [Google Scholar]
- 15.Fraser KH, Taskin ME, Griffith BP, Wu ZJ. The use of computational fluid dynamics in the development of ventricular assist devices. Medical Engineering & Physics. 2011;33:263–80. doi: 10.1016/j.medengphy.2010.10.014. [DOI] [PMC free article] [PubMed] [Google Scholar]
- 16.Fraser Kh, Zhang T, Taskin Me, Griffith BP, Wu ZJ. Computational fluid dynamics analysis of thrombosis potential in left ventricular assist device drainage cannulae. ASAIO J. 56:157–163. doi: 10.1097/MAT.0b013e3181d861f1. [DOI] [PMC free article] [PubMed] [Google Scholar]
- 17.Jones CC, Capasso P, McDonough JM, Wang D, Rosenstein KS, Zwischenberger JB. Biplane angiography for experimental validation of computational fluid dynamic models of blood flow in artificial lungs. ASAIO J. 2013;59:397–404. doi: 10.1097/MAT.0b013e3182937a80. [DOI] [PubMed] [Google Scholar]
- 18.Grigioni M, Daniele C, Morbiducci U, D’Avenio G, Di Benedetto G, Del Gaudio C, et al. Computational model of the fluid dynamics of a cannula inserted in a vessel: incidence of the presence of side holes in blood flow. J Biomech. 2002;35:1599–612. doi: 10.1016/s0021-9290(02)00231-2. [DOI] [PubMed] [Google Scholar]
- 19.Dasi LP, Simon HA, Sucosky P, Yoganathan AP. FLUID MECHANICS OF ARTIFICIAL HEART VALVES. Clinical and experimental pharmacology & physiology. 2009;36:225–37. doi: 10.1111/j.1440-1681.2008.05099.x. [DOI] [PMC free article] [PubMed] [Google Scholar]
- 20.Song X, Throckmorton AL, Wood HG, Antaki JF, Olsen DB. Computational fluid dynamics prediction of blood damage in a centrifugal pump. Artif Organs. 2003;27:938–41. doi: 10.1046/j.1525-1594.2003.00026.x. [DOI] [PubMed] [Google Scholar]
- 21.Bludszuweit C. Three-Dimensional Numerical Prediction of Stress Loading of Blood Particles in a Centrifugal Pump. Artificial Organs. 1995;19:590–6. doi: 10.1111/j.1525-1594.1995.tb02386.x. [DOI] [PubMed] [Google Scholar]
- 22.Heuser G, Opitz R. A Couette viscometer for short time shearing of blood. Biorheology. 1980;17:17–24. doi: 10.3233/bir-1980-171-205. [DOI] [PubMed] [Google Scholar]
- 23.Neidlin M, Jansen S, Moritz A, Steinseifer U, Kaufmann TS. Design Modifications and Computational Fluid Dynamic Analysis of an Outflow Cannula for Cardiopulmonary Bypass. Annals of Biomedical Engineering. 2014:1–10. doi: 10.1007/s10439-014-1064-y. [DOI] [PubMed] [Google Scholar]
- 24.Hochareon P, Manning KB, Fontaine AA, Tarbell JM, Deutsch S. Correlation of in vivo clot deposition with the flow characteristics in the 50 cc penn state artificial heart: a preliminary study. ASAIO J. 2004;50:537–42. doi: 10.1097/01.mat.0000145694.40637.a0. [DOI] [PubMed] [Google Scholar]
- 25.Sutera SP, Croce PA, Mehrjardi M. Hemolysis and subhemolytic alterations of human RBC induced by turbulent shear flow. Trans Am Soc Artif Intern Organs. 1972;18:335–41, 47. doi: 10.1097/00002480-197201000-00084. [DOI] [PubMed] [Google Scholar]
- 26.Zhang T, Taskin ME, Fang H-B, Pampori A, Jarvik R, Griffith BP, et al. Study of Flow-Induced Hemolysis Using Novel Couette-Type Blood-Shearing Devices. Artificial Organs. 2011;35:1180–6. doi: 10.1111/j.1525-1594.2011.01243.x. [DOI] [PubMed] [Google Scholar]
- 27.Liu G-M, Chen H-B, Luo F-L, Zhang Y, Sun H-S, Zhou J-Y, et al. Numerical Simulation of LVAD Inflow Cannulas with Different Tip. International Journal of Chemical Engineering. 2012;2012:8. [PubMed] [Google Scholar]
- 28.Wang D, Zwischenberger JB. In: Single expandable double lumen cannula assembly for veno-venous ECMO. Uspto, editor. USA: The University of Texas, System; 2009. USPTO. [Google Scholar]
- 29.Zhou X, Wang D, Sumpter R, Pattison G, Ballard-Croft C, Zwischenberger JB. Long-term support with an ambulatory percutaneous paracorporeal artificial lung. J Heart Lung Transplant. 2012;31:648–54. doi: 10.1016/j.healun.2012.02.007. [DOI] [PMC free article] [PubMed] [Google Scholar]
- 30.Reeb J, Falcoz PE, Santelmo N, Massard G. Double lumen bi-cava cannula for veno-venous extracorporeal membrane oxygenation as bridge to lung transplantation in non-intubated patient. Interact Cardiovasc Thorac Surg. 2012;14:125–7. doi: 10.1093/icvts/ivr046. [DOI] [PMC free article] [PubMed] [Google Scholar]
- 31.Hoopes CW, Kukreja J, Golden J, Davenport DL, Diaz-Guzman E, Zwischenberger JB. Extracorporeal membrane oxygenation as a bridge to pulmonary transplantation. J Thorac Cardiovasc Surg. 2013;145:862–8. doi: 10.1016/j.jtcvs.2012.12.022. [DOI] [PubMed] [Google Scholar]
- 32.Gelvin MG, Conte JV, Rivard DC. Use of A-Med Paraflow System for right heart support after heart transplantation. Asaio J. 2004;50:522–3. doi: 10.1097/01.mat.0000138015.83966.51. [DOI] [PubMed] [Google Scholar]
- 33.Caputo M, Yeatman M, Narayan P, Marchetto G, Ascione R, Reeves BC, et al. Effect of off-pump coronary surgery with right ventricular assist device on organ function and inflammatory response: a randomized controlled trial. Ann Thorac Surg. 2002;74:2088–95. doi: 10.1016/s0003-4975(02)04025-0. discussion 95–6. [DOI] [PubMed] [Google Scholar]
- 34.Livi U, Gelsomino S, Da Col P, Poldini F, Masullo G, Cheli G, et al. The A-Med right heart support for off-pump coronary artery bypass grafting. Ital Heart J. 2001;2:502–6. [PubMed] [Google Scholar]
- 35.Toomasian JM, Aboul-Hosn W. Coronary artery bypass grafting using a miniature right ventricular support system. Perfusion. 2000;15:521–6. doi: 10.1177/026765910001500608. [DOI] [PubMed] [Google Scholar]
- 36.Aggarwal V, Einhorn BN, Cohen HA. Current status of percutaneous right ventricular assist devices: First-in-man use of a novel dual lumen cannula. Catheter Cardiovasc Interv. 2016 doi: 10.1002/ccd.26348. [DOI] [PubMed] [Google Scholar]