Abstract
Objectives
Modern hearing aid (HA) devices include a collection of acoustic signal-processing features designed to improve listening outcomes in a variety of daily auditory environments. Manufacturers market these features at successive levels of technological sophistication. The features included in costlier premium hearing devices are designed to result in further improvements to daily listening outcomes compared to the features included in basic hearing devices. However, independent research has not substantiated such improvements. This research was designed to explore differences in speech-understanding and listening-effort outcomes for older adults using premium-feature and basic-feature HAs in their daily lives.
Design
For this participant-blinded, repeated, crossover trial 45 older adults (mean age 70.3 years) with mild-to-moderate sensorineural hearing loss wore each of four pairs of bilaterally fitted HAs for one month. HAs were premium-feature and basic-feature devices from two major brands. After each one month trial, participants’ speech-understanding and listening-effort outcomes were evaluated in the laboratory and in daily life.
Results
Three types of speech-understanding and listening-effort data were collected: measures of laboratory performance, responses to standardized self-report questionnaires, and participant diary entries about daily communication. The only statistically significant superiority for the premium-feature HAs occurred for listening effort in the loud laboratory condition and was demonstrated for only one of the tested brands.
Conclusions
The predominant complaint of older adults with mild-to-moderate hearing impairment is difficulty understanding speech in various settings. The combined results of all the outcome measures used in this research suggest that, when fitted using scientifically-based practices, both premium-feature and basic-feature HAs are capable of providing considerable, but essentially equivalent, improvements to speech understanding and listening effort in daily life for this population. For HA providers to make evidence-based recommendations to their clientele with hearing impairment it is essential that further independent research investigates the relative benefit/deficit of different levels of hearing technology across brands and manufacturers in these and other real-world listening domains.
Keywords: hearing aid, amplification, technology, outcome, speech understanding, listening effort, laboratory, field trial
INTRODUCTION
This is the second article of a series exploring the impact of hearing aid (HA) technology level on daily listening outcomes. This paper presents speech-understanding and listening-effort outcomes obtained in the laboratory and in daily life with premium and basic levels of HA technologies.
One of the predominant difficulties reported by individuals with hearing impairment (HI) is difficulty understanding speech in various settings, especially with background noise. Modern HAs possess signal-processing features, such as multichannel compression and directional microphone systems that were designed to improve outcomes in such listening environments. Versions of these features have been included in HAs for approximately 20-30 years. As new HAs are released, these technologies are refined to be more sophisticated, increasingly automatic, and more adaptive to changes in listening environments.
HAs from major manufacturers typically are released into the market as families, with each family comprising several HA models at different levels of technological sophistication. Although all of the models possess versions of complex acoustic signal-processing features like those mentioned above; compared to the lower (basic) levels of HAs, the higher (premium) levels of HAs possess the more recently released and more sophisticated versions of these features. Also, more complex versions of newer innovations such as environmental adaptation and binaural data streaming often are included in the premium models of modern HAs. Table 1 provides an example of how these features differed for premium-feature and basic-feature HA exemplars from 2 major HA brands in 2011. These exemplars were typical of HA products on the market at that time and that are available today. From this table it can be seen that the premium-feature exemplars possessed more complex versions of features intended to improve speech-understanding and/or listening-effort outcomes.
Table 1.
Differences, as described for brands A and B, between premium and basic features designed to target speech understanding and/or listening effort in the four research hearing aids. Only features that differed between the basic and premium models are included.
| Hearing aids |
||||
|---|---|---|---|---|
| Feature | Premium A | Basic A | Premium B | Basic B |
| Number of compression channels |
16 | 8 | 20 | 6 |
| Directional microphone |
Automatic multi- channel adaptive |
Automatic single- channel adaptive |
Automatic multi- channel adaptive |
Automatic single- channel adaptive |
| Automatic adaptation to environment |
More | Less | More | Less |
| Binaural data streaming |
More | Less | More | Less |
| Noise reduction | Automatic adjustment. 7 steps |
Automatic adjustment. 3 steps |
Automatic adjustment. 3 modes |
Automatic adjustment. 2 modes |
The rationales for the first four features listed in Table 1 and a brief review of the published independent research about their effectiveness in the domain of speech understanding can be found in Cox et al. 2014. At the time of that writing there was a lack of independent literature indicating any real world advantages of the four premium features over the basic versions of those features in speech understanding. An updated review of that literature confirmed that this dearth of evidence remained one year later. However, improved hearing is not limited to better speech understanding. It has been proposed that improved access to speech cues with advanced processing applied by high-technology premium HAs also might reduce the vigilance required for speech understanding in difficult listening and lesson fatigue resulting from these exertions; however, this has not been demonstrated (Hornsby 2013). Furthermore, it has been suggested that premium HA processing might ease listening effort even when improvements in hearing are not captured using speech recognition scores (e.g., Bentler et al. 2008; Sarampalis et al. 2009; Brons et al. 2013; Desjardins et al. 2014). Some features, such as digital noise reduction (DNR), are not expected to improve speech understanding, but might reduce listening effort. The benefit of DNR for reducing listening effort has been demonstrated under some conditions (Bentler et al. 2008; Sarampalis et al. 2009), although other research has not shown any benefit from DNR in this domain (Brons et al. 2013; Hornsby, 2013). Although it is reasonable to expect that listening with premium-feature HAs would further reduce listening effort compared to listening with basic-feature HAs, no independent evidence was found that demonstrated better listening-effort outcomes using premium and basic versions of any of the five features listed in Table 1.
It might seem obvious that outcomes would be better with premium-feature HAs when the most advanced features are working together. However, because there is little independent research that investigates whether the more advanced technologies provide further improvement to outcomes in selected listening situations, HA practitioners often rely on manufacturer-produced data and marketing to make recommendations about the level of technology most appropriate for a given client. To make an evidence-based choice between premium-feature and basic-feature HAs from among several different brands, providers and consumers require independent evidence that evaluates both laboratory and real-world speech-understanding and listening-effort outcomes with examples of these technologies that are fitted and functioning in a manner that represents both best fitting practices and manufacturers’ intended applications. This research was designed to provide such evidence.
Specifically, the following questions were asked:
For older-adults with uncomplicated, adult-onset, mild-to-moderate, sensorineural HI:
-
1)
What is the benefit/deficit of current hearing aid technology compared to unaided listening in the domains of speech understanding and listening effort?
-
2)
Do premium-feature HAs result in better speech understanding and/or listening effort than basic-feature HAs?
-
3)
Does the answer to question 2 differ across exemplars of basic-feature and premium-feature devices from two major HA brands?
METHODS
This article describes results of research comparing the effectiveness of premium-feature and basic-feature HA exemplars in improving speech understanding and reducing listening effort in the laboratory and in daily living. Study procedures were reviewed and approved by the University of Memphis Institutional Review Board. Details about the overall design of the study are provided in Cox et al. (2016).
Participants
There were 45 older adults, ages 61-81 (average 70 years), with symmetric, bilateral, mild-to-moderate sensorineural HI. Nineteen participants had worn hearing aids before. Admitting both new and experienced hearing aid users allowed us to sample typical individuals across the range of mild-to-moderate hearing impairment, the most prevalent degrees of hearing loss among older adults in the United States (Lin et al. 2011). A detailed description of participant demographics is provided in Cox et al. (2016). Speech-understanding outcomes for the first 25 of these participants were presented in Cox et al. (2014). The present article expands on those data with the additional power provided by 20 more participants and presents previously unreported outcomes in the domain of listening effort.
Hearing aids
Exemplars of premium-feature and basic-feature HAs were evaluated for each of 2 major brands. Detailed descriptions of these HAs are presented in Cox et al. (2016). Briefly, they were mini behind-the-ear thin-tube devices, commercially-released in 2011. Premium-feature and basic-feature HAs from the same brand appeared identical, but differed in advertised features. Table 1 summarizes those HA features designed to improve speech understanding and listening effort for the HA models used for this research. Most of these features were verifiable in our laboratory. Some others could not be verified outside of a specialized laboratory. Manufacturer representatives instructed the research team during in-laboratory training about how to set the various features to optimize performance with each of the different hearing aids. Features were programmed according to these recommendations. Left and right HAs were wirelessly linked. Participants were given a remote volume control for each pair of HAs, and could select from each of 3 programs using the remote control or a button located on the HA. The 3 manually-selectable programs were as follows: the default program (labeled the Everyday program) was designed to automatically adapt various HA features according to aspects of the listening environment. All exemplars of premium-feature and basic-feature technologies possessed some automatic adaptivity; however, the premium-feature technologies were described as having superior environmental classification and adaptation capabilities. The premium-feature HAs also engaged more sophisticated versions of directional microphones and noise reduction when the Everyday program was activated.
In addition to the default Everyday program, each HA was programmed with two other manually-selectable programs for use in specific difficult listening situations. These two programs were included for this study because the implemented technologies differed between the premium-feature and basic-feature devices for both brands and the premium features were described as having important potential real-world value. One of these programs was labeled Look-and-listen. This program engaged the strongest dedicated forward-facing directional microphone that was available for each HA model. Basic-feature HAs implemented a conventional single-channel directionality. Premium A implemented a multi-channel adaptive directionality and premium B used a binaural data streaming algorithm to narrow the focus of the directional microphone’s polar pattern. Another program was labeled the Speech-finder program. This program engaged features designed to detect speech coming from the sides or from behind the listener. Basic-feature HAs engaged a fixed omni-directional microphone. Premium-feature HAs used a binaural streaming algorithm to employ an adaptive directional microphone capable of engaging a forward-facing null. Details about the participants’ volume control adjustments and use of all programs in daily listening are provided in Cox et al (2016).
Procedure
The study was a single-blinded, repeated, crossover trial. Participants wore binaural premium-feature and basic-feature HA exemplars from 1 of 2 brands in their daily lives for 1 month each. Before their use of premium and basic HAs from a 2nd brand, participants experienced a 1-month washout period during which they were not provided with research HAs. Previous users were allowed to use their own hearing aids during the washout period. Outcomes were evaluated at the end of each 1-month trial. Sequences of brand (A and B) and technology level (basic and premium) use were counterbalanced. Participants were blinded to the technological differences between the research hearing aids and to the purpose of this research. Logistically, it was not possible to blind the researchers to the hearing aids that were being fitted and assessed. However, strenuous measures were taken to limit the potential for conveying unintended information to participants due to our knowledge about their hearing aids. See Cox et al. (2016) for additional discussion.
The HA fitting protocol used for this research and the HA fitting results are described in detail in Cox et al. (2016). Briefly, electroacoustic characteristics of the HAs were verified before each fitting. Next, the HAs were programmed with the manufacturer’s proprietary algorithms, then systematically fitted using comprehensive rule-based protocols, starting with gain adjustment to match National Acoustics Laboratory targets (Keidser et al. 2012). All features were set as recommended by the manufacturers for optimal performance of each device. These protocols resulted in HA outputs that were not substantially different for premium-feature and basic-feature HAs from the same brand (average SPL differences in the ear canal within 1-2 dB at 500, 1k, 2k, & 3k Hz). Small but systematic differences in outputs were noted between the two brands probably as a result of inherent differences in frequency response shape but these differences were somewhat mitigated by user adjustments in volume. See Cox et al. (2016) for a visual representation and discussion of average hearing aid outputs.
Outcomes
The speech-understanding and listening-effort measures reported in this paper included performance measures in the laboratory, responses to standardized questionnaires, and descriptions of daily communication situations in participant diaries. Using multiple types of measures allowed us to capitalize on the advantages of each: increased stimulus control from laboratory measures, improved ecological validity from the questionnaires, and the opportunity to obtain individualized information about important and/or previously unaddressed issues from the diaries. This comprehensive approach to outcome assessment was designed to capture any differences that might exist between HA technology levels and to provide a more complete and balanced picture of the answers to the questions described above.
Laboratory Measures
Speech Understanding
Speech understanding was quantified using the American-dialect version of the Four Alternative Auditory Feature test (AFAAF; Xu et al. 2014). The British-dialect version of the Four Alternative Auditory Feature test (FAAF; Foster & Haggard, 1987) is widely used in the United Kingdom. Numerous studies focused on hearing aid outcomes have established the FAAF as a sensitive and reliable measure of speech understanding (e.g., Gatehouse 1993, Gatehouse et al. 2006). The AFAAF is equally sensitive and reliable and differs from the FAAF in dialect only (Xu et al., 2014). The computer-administered AFAAF comprises 80 test utterances with a key word embedded in the sentence: “Can you hear __ clearly?” A typical test utterance is: “Can you hear OLD clearly?” Participants used a 4-button response box to select their answer from among four alternatives such as: HOLD, OLD, COLD, and GOLD, which were displayed for the participant on a computer screen. The test administrator recorded participant responses. Speech-understanding scores reflected response accuracy.
Speech understanding was evaluated in three listening environments which cover most of the range of levels and SNRs typically experienced in everyday life. Pearsons et al. (1977) demonstrated that the level of speech at the listener’s ear increases by about 0.6 dB for every 1 dB increase in ambient noise above 45 dBA in typical communication environments. Tested conditions simulated everyday environments with soft, average, and loud noise. The speech/noise levels (dB SPL C-weighted) were 55/45, 62/57 and 70/70, respectively. Recent research by Smeds et al (2015) estimated typical SNRs from recordings of hearing aids users’ daily environments. The speech/noise levels used for our laboratory measures are in line with those experienced by Smeds’s participants in daily listening. Eighty items were tested in each listening environment. Blocks of 20 items were interleaved among the three listening environments. Presentation order of the listening environments was counterbalanced across participants, and word order was randomized to minimize any potential order effects.
Testing was conducted in a sound-treated room with speech delivered from a loudspeaker 1 meter from the seated participant at 0° azimuth. A steady-state noise with a talker-matched spectrum was high-pass and low-pass filtered with a cutoff of 1500 Hz to create masking noises. This cutoff frequency was chosen because it approximated the logarithmic center frequency of the noise spectrum. Masker noises were gated to have an onset 1500 msec before the beginning of the speech signal and an offset 50 msec after the speech signal ended. Each speech utterance was approximately 2 seconds in duration. Loudspeakers placed at 135°, 180°, and 225° delivered masker noises. The rear loudspeaker at 180° delivered the low-pass masker. The other rear loudspeakers delivered the high-pass masker (one half of the test trials had high-pass noise delivered from the 135° (right) loudspeaker, and the other half were from the 225° (left) loudspeaker). The presentation order of left/right location of the high-pass masker was counterbalanced across participants. This testing arrangement was designed to be reasonably realistic while also providing an opportunity for the premium-level and basic-level adaptive directional microphones to improve the SNR in the participant’s ears according to their different capabilities. Aided testing was accomplished with the HAs set to the default automatic program.
Listening Effort
It is common for individuals with hearing impairment to report that everyday listening can be effortful, especially under difficult circumstances (Kramer et al 2006). It is generally presumed that this reported effort is a result of increased cognitive exertion needed for speech comprehension. Factors such as stress (Hicks & Tharpe 2002), cognitive capacity and executive functions (e.g., Picou et al 2016; Ronnberg et al 2013, Rudner et al 2011), vigilance and fatigue (e.g., Hornsby 2013) all have been linked to the construct of listening effort. However, the precise elements that embody this construct and their relationships are not clear. Furthermore, there is some debate about the best method to measure listening effort in the laboratory (McGarrigle et al. 2014).
For the present study listening effort was measured alongside speech understanding. Participants indicated how effortful they found groups of speech understanding trials to be. The AFAAF materials and testing procedure were considered well suited for laboratory listening effort assessment since, in previous research by Xu (2012), the AFAAF was demonstrated to be particularly sensitive to differences in cognition. This finding suggested that top-down processing plays an important role in speech-understanding for this task. In addition, improved access to speech cues provided by premium processing was expected to lesson vigilance required for distinguishing between the minimal pairs. Therefore we expected that the AFAAF materials and testing procedure would be appropriate for revealing reductions in listening effort that might result from the premium features. Prior to this study we compared the rating method, described below, with a dual-task measure (Johnson et al. 2015). That study demonstrated that the rating method was more sensitive to changes in listening demand (i.e., changes in SNR and linguistic context) which were presumed to impact listening effort. Furthermore, compared to the dual-task method, the rating method was less likely to interfere with concurrently measured speech-understanding performance and also was less likely to be complicated by floor and ceiling effects.
After each block of 20 AFAAF stimuli, the participant was prompted to give a verbal rating of the effort it took for them to understand that group of test words. They based their answers on a scale of listening effort ranging from 1-“No effort” to 7-“Extreme effort”. Participants were allowed to choose a fraction if they felt that the amount of effort was between two numbers on the scale. The listening environment (soft, average, or loud) changed after every group of 20 utterances. Because 80 test utterances were used for each listening environment, participants rated their listening effort 4 times for each listening environment in the unaided and each of the aided conditions.
Hearing aid processing during laboratory testing
To understand the potential impact of the hearing aids’ directionality and DNR processing during laboratory testing, we measured several representative samples of basic-feature and premium-feature hearing aids under conditions that approximated the laboratory listening environment. The average audiogram for the study was used to program the hearing aids according to each manufacturer’s proprietary algorithm. Features were set as they were for the study.
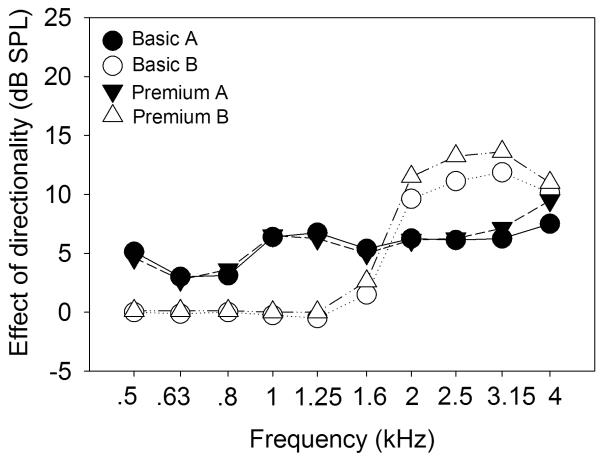
Directionality was assessed in the test box of a hearing aid analyzer after a 3 second presentation of speech at 65 dB SPL and noise at 59 dB SPL from the front and rear loudspeakers, respectively. These settings were chosen to approximate the temporal and level characteristics preceding presentation of the AFAAF keyword in the average condition. Differences between coupler outputs (dB SPL) measured for the front and rear inputs were calculated for the frequencies that are the most critical for speech understanding (500 – 4000 Hz; ANSI S3.7, 1993). Differences were averaged across the exemplars for each hearing aid type and are provided in Figure 1. Visual inspection of this Figure shows that all 4 types of hearing aids engaged directional processing in the test box under these conditions; however, it can be seen that directionality was different for the two brands. Brand A’s processing resulted in broad-band directionality and was not different for the basic and premium HAs. Brand B’s processing resulted in high-frequency directionality, with slightly greater directionality from 1.6 - 3.15 kHz for the premium HAs. Test box measures (not shown) also confirmed that directionality was engaged for all hearing aid exemplars at 55 and 70 dB SPL, levels similar to those used for the soft and loud laboratory conditions.
Figure 1.
Average output differences (dB SPL) for front and rear inputs measured in a test box after 3 seconds of speech from the front (65 dB SPL) and noise from the rear (59 dB SPL). Data are for exemplars of two basic-feature and two premium-feature hearing aids and for frequencies .5 – 4 kHz. Values > 0 indicate greater output for the signal from the front of the hearing aid.
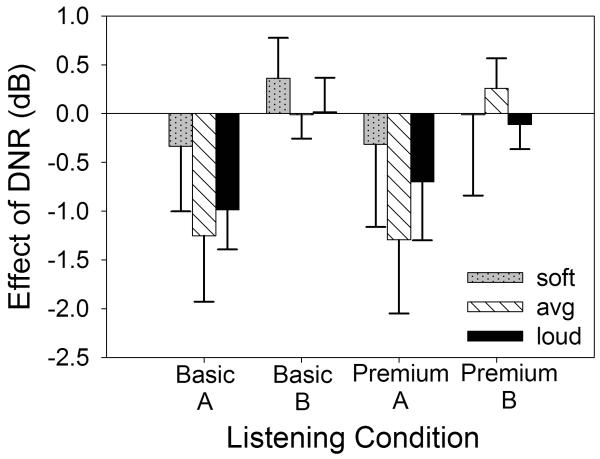
We also explored the potential impact of the different hearing aids’ DNR processing during the 1500 msec noise preceding each speech utterance during laboratory testing. Several representative hearing aid samples were tested in the laboratory set up for the soft, average, and loud conditions. Average RMS power was measured at two intervals after the onset of the noise: 100-300 msec and 1200-1400 msec. Level differences between these two intervals were computed and averaged for each of the 4 hearing aid types. These averaged data are presented in Figure 2. For this Figure, values < 0 dB demonstrate a reduction in level from the beginning to the end of the 1500 msec noise. It can be seen that Brand A’s processing reduced the level of the noise prior to the onset of the AFAAF test utterance for both premium and basic hearing aids. In contrast, Brand B’s processing did not reduce the noise level over this period for either HA model. Furthermore, differences in the effect of DNR between premium and basic hearing aids were small for both brands. Readers should keep in mind that these measures were constrained according to the capabilities of the test equipment and conditions. They are reported here to suggest some ways that the basic and premium processing might have differed and are not necessarily precise representations of processing during listening in the laboratory or the real world. For example, there is no way of knowing how the multi-band adaptive directionality might have behaved since directionality was tested in the presence of a single rear noise.
Figure 2.
Average RMS power (dB) of the AFAAF noise measured at 1200-1400 msec relative to 100-300 msec after noise onset in the soft, average, and loud laboratory test environments. Data are for exemplars of two basic-feature and two premium-feature hearing aids. Values < 0 indicate a reduction in noise level.
Standardized Questionnaires
Responses to standardized questionnaires allowed us to measure participants’ perceived speech understanding and listening effort in their daily lives. Participants responded to 3 different questionnaires with subscales that assessed real-world speech understanding and/or listening effort: the Abbreviated Profile of Hearing Aid Benefit (APHAB; Cox et al. 1995), the Speech, Spatial and Qualities of Hearing Scale (SSQ; Gatehouse et al. 2004), and the Device-Oriented Subjective Outcome (DOSO) Scale (Cox et al. 2014). These questionnaires all contain items intended to assess outcomes in similar domains; however, each possesses different items, different wording, and different formatting. When possible, subscale scores were combined across the questionnaires to provide a more robust picture of participants’ daily speech understanding and listening effort.
Before using any of the research HAs for this study, participants completed the APHAB and SSQ, which assessed unaided real-world speech understanding and/or listening effort. The APHAB measures hearing problems in everyday situations, and yields unaided and aided global speech communication subscale scores. The SSQ assesses difficulty hearing speech in challenging and dynamic listening circumstances, and yields subscale scores for unaided speech understanding and listening effort (Gatehouse et al. 2006). Prior to completion, all of the experienced hearing aid users were asked if they felt that they were accurately able to recall their day-to-day hearing abilities without wearing hearing aids. One full-time user was not able to recall his unaided data. This user agreed to go unaided for a few days before completing the questionnaires about his unaided experiences. At the end of each 1-month trial, participants responded to the APHAB according to their daily experiences with each pair of HAs. In addition, they completed the SSQ-B (Jensen et al. 2009). The SSQ-B is a version of the SSQ questionnaire comprising the same items as the SSQ and yields scores for the same subscales, but employs a modified response scale to measure the benefit (or deficit) of using amplification. Participants also completed the DOSO (Cox et al. 2014) for the aided conditions. The DOSO asks listeners to specify how well the hearing aids performed in different situations, and yields subscale scores for aided speech understanding and listening effort. Participants were provided with their responses for the first pair of HAs when completing the questionnaires for the second pair of HAs for each arm of the field trial. Unaided responses to the APHAB questionnaire were provided when responding for all aided conditions. Participants were given the opportunity to change their responses for the unaided condition when responding for the 1st aided condition of the study. Participants also were allowed to change their responses for the first pair of HAs when responding for the 2nd aided condition of each arm of the study if appropriate. This method was used so that participants could convey intended differences between the listening conditions as accurately as possible.
Participant Diaries
Participants received a blank diary in each of the 4 1-month trials. They used the diaries to describe in their own words one communication situation that went well, and one that went poorly, each day for five days at the end of the trial. This method provided participants an opportunity to identify those experiences with the HAs that were most memorable to them each day. These data were analyzed using qualitative content analysis (Knudsen et al. 2012).
Statistical Power
As described in an earlier publication, it was decided in the planning phase of this research that a medium effect size would be the minimum interesting difference between premium and basic-feature HA outcomes. See Cox et al. (2014) for the rationale. Power computation used the software G*Power version 3.1.7, configured for: ANOVA: repeated measures, within factors; alpha=.05; and 4 measurements (Faul et al. 2007). The research had > 98% power to detect a medium effect.
RESULTS
General Linear Model (GLM) repeated measures analysis of variance (ANOVA) with planned independent contrasts was used to analyze the laboratory and standardized questionnaire data. This approach has been shown to provide good statistical power while controlling the experiment-wise error rate (Rosenthal & Rosnow 1985). Planned contrasts corresponded to the 3 research questions and were designed to test: 1) the benefit/deficit of listening with HAs compared to listening without HAs; 2) outcomes with premium-feature HAs compared to basic-feature HAs with both brands combined; and 3) outcomes with premium-feature HAs compared to basic-feature HAs for each brand separately. For the ANOVA F test and the mutually orthogonal planned contrasts (contrasts for questions 1 and 2 above), values of p ≤ 0.05 are reported as significant. The contrasts necessary to answer question 3 were not orthogonal to the contrast for question 2. A Bonferroni correction was applied to the two comparisons for question 3 so that values of p ≤ 0.025 are reported as significant. Prior to all analyses, data were examined for distribution and outliers. Eleven of the total 1575 data points were potentially influential outliers. Following the recommendations of Tabachnick and Fidell (2007), each of these outlier values was adjusted to 1 unit more extreme than the next most extreme value in the distribution of that variable. All figures and analyses were based on these adjusted data. In addition, it was noted that 1 participant was presented with 60 test utterances rather than 80 for the loud environment when listening with brand B’s premium HAs. The averaged data points for speech understanding and listening effort were consistent with the respective variables’ distributions and both were included in the analyses.
Laboratory Outcomes
Speech Understanding
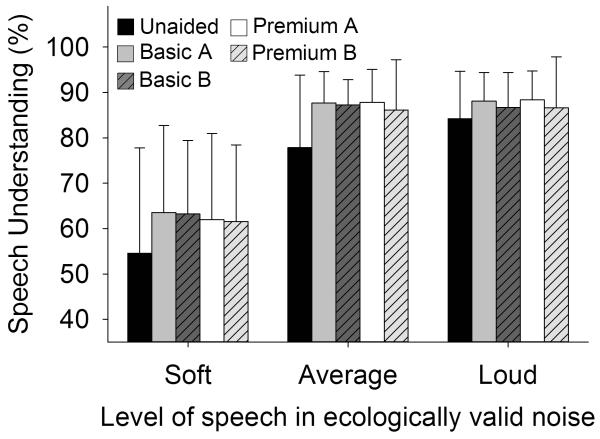
Proportions of correctly identified AFAAF keywords were generated for four groups of 20 utterances. The proportion scores were averaged to provide a single speech-understanding score for each listening environment for the unaided and each of the aided conditions. Figure 3 depicts the mean percentages of correctly identified speech in noise for each tested condition. This figure demonstrates that unaided listening (black bars) consistently produced poorer scores than each aided listening condition. The differences among the four aided conditions appear relatively small. These percentage scores were converted to rationalized arcsine units for statistical analysis (Studebaker 1985). Separate statistical analyses were carried out for each listening environment (soft, average, and loud). Results are displayed in rows 1 −3 of Table 2. Here it can be seen that speech-understanding was significantly affected by listening condition (unaided and four aided) in the soft, average, and loud environments. The first planned contrast comparing aided speech-understanding scores to unaided speech-understanding scores revealed that, on average, listening with HAs significantly improved speech-understanding performance compared to listening without HAs in all tested listening environments. No contrasts exploring differences between premium-feature and basic-feature HAs were statistically significant.
Figure 3.
Mean speech understanding in noise in each condition tested in the laboratory. Data are for listening unaided and with two basic-feature and two premium-feature hearing aids. A higher score indicates better speech understanding. Error bars show 1 standard deviation.
Table 2.
Summary of results of statistical analyses for laboratory outcomes. Main effects are for separate repeated measures ANOVAs of outcomes with unaided and four aided conditions. All values are the F test statistic except where indicated.
| Contrast |
|||||
|---|---|---|---|---|---|
| Outcome | Main effect | Unaided vs Aided |
Premium vs Basic | Premium A vs Basic A |
Premium B vs Basic B |
| 1. Understanding in lab (soft) | 9.361* | 23.7* | 2.41 | 2.11 | 1.16 |
| 2. Understanding in lab (average) | 16.957* | 33.04* | .00 | .15 | .16 |
| 3. Understanding in lab (loud) | 4.3* | 9.31* | 1.15 | .039 | 1.21 |
| 4. Listening effort in lab (soft) | 9.022* | 29.9* | .53 | 1.84 | .02 |
| 5. Listening effort in lab (average) |
13.794* | 29.09* | 2.83 | 3.38 | .58 |
| 6. Listening effort in lab (loud) | 2.619* | 1.78 | .99 | 2.23 | 8.98* |
statistically significant at .05 level
Listening Effort
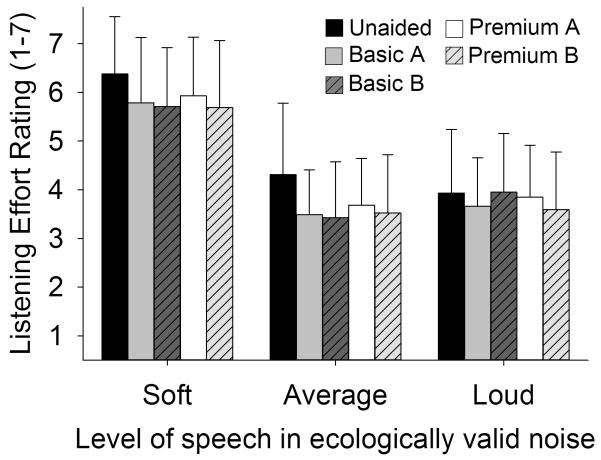
Listening effort was measured four times for each listening environment in the unaided and each of the aided conditions. These ratings were averaged for each participant to yield a single listening-effort rating for each listening environment and condition. Figure 4 depicts mean listening-effort ratings in noise for each tested condition. This figure demonstrates that unaided listening (black bars) consistently resulted in more listening effort than each aided listening condition for the soft and average listening environments. Differences among the four aided conditions in these listening environments appear relatively small. Separate statistical analyses were carried out for each listening environment (soft, average, and loud), and are displayed in rows 4 – 6 of Table 2. These results demonstrate that listening effort was significantly affected by listening condition (unaided and four aided) in the soft, average, and loud environments. Planned contrasts revealed that listening with HAs significantly reduced listening effort compared to listening without HAs for the soft and average listening environments, but not for the loud listening environment. The 4th contrast, comparing Brand B’s premium and basic HAs, demonstrated significantly less perceived effort when listening with the premium HAs compared to the basic HAs in the loud condition. This result corresponded to an effect size of d = .36 (Cohen 1988). Conventionally, this is considered to be a small effect. No other comparisons of premium and basic devices were statistically significant.
Figure 4.
Mean listening-effort rating in noise in each condition tested in the laboratory. Data are for listening unaided and with two basic-feature and two premium-feature hearing aids. A higher score indicates greater listening effort. Error bars show 1 standard deviation.
Standardized Questionnaires
Speech understanding in daily life: Unaided vs aided listening
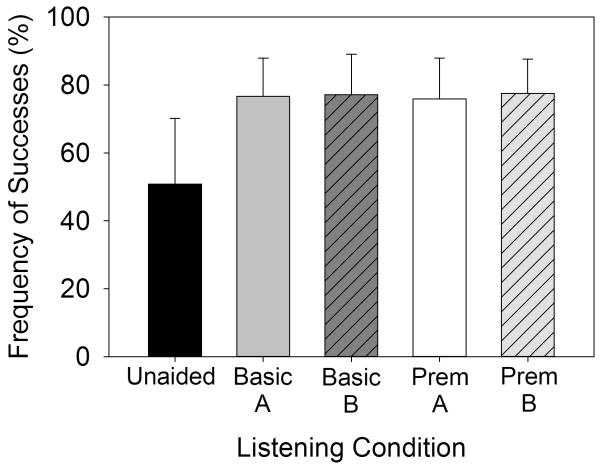
The first research question was addressed using subscales from the two questionnaires that assessed unaided and aided real-world outcomes: the APHAB and the SSQ. The global scores from the APHAB demonstrate frequency of problems with speech understanding in daily life. Kolmogorov-Smirnov test results demonstrated that the distribution of scores for brand B’s basic HA was significantly different from a normal distribution, D (45) = 0.153, p < 0.05. This distribution also possessed significant positive skewness, z = 3.1. The decision was made to refrain from data transformation. This decision was based on the distributions of responses for all other conditions, which were consistent with a normal distribution. Further, because ANOVA is robust against deviations from normality (e.g., Donaldson 1968; Glass et al. 1972) we felt that any transformation would have been minor in effect at best. To facilitate interpretation of these data, the global frequencies of problems scores were reversed to demonstrate frequencies of success. This was accomplished by subtracting the global frequencies of problems scores from 100%. The resulting score range is from 0-100%.
Figure 5 depicts mean frequencies of success (%) with speech understanding in daily life for each condition. This figure demonstrates that unaided listening (black bar) consistently produced fewer successes than each aided listening condition. The differences among the four aided conditions appear relatively small. The planned contrast comparing unaided and aided successes was carried out for these data and is displayed in row 1 of Table 3 (Unaided vs Aided; APHAB). This contrast revealed that use of HAs significantly improved perceived frequency of successes with speech understanding compared to wearing no HAs.
Figure 5.
Mean speech understanding in daily life environments reported on the APHAB questionnaire for unaided listening and listening with two basic-feature and two premium-feature hearing aids. A higher score indicates better reported speech understanding. Error bars show 1 standard deviation.
Table 3.
Summary of results of statistical analyses for self-report outcomes. All values are the F test statistic except where indicated.
| Contrast |
||||
|---|---|---|---|---|
| Outcome | Unaided vs Aided | Premium vs Basic | Premium A vs Basic A |
Premium B vs Basic B |
| 1. Understanding in daily life: APHAB | 97.66* | - | - | - |
| 2. Understanding in daily life: SSQ | t (44) = 16.42* | - | - | - |
| 3. Understanding in daily life: Composite Score |
- | .712 | .45 | .36 |
| 4. Listening effort in daily life: SSQ | t (44) = 10.29* | - | - | - |
| 5. Listening effort in daily life: Composite score |
- | .19 | .01 | .12 |
statistically significant at .05 level
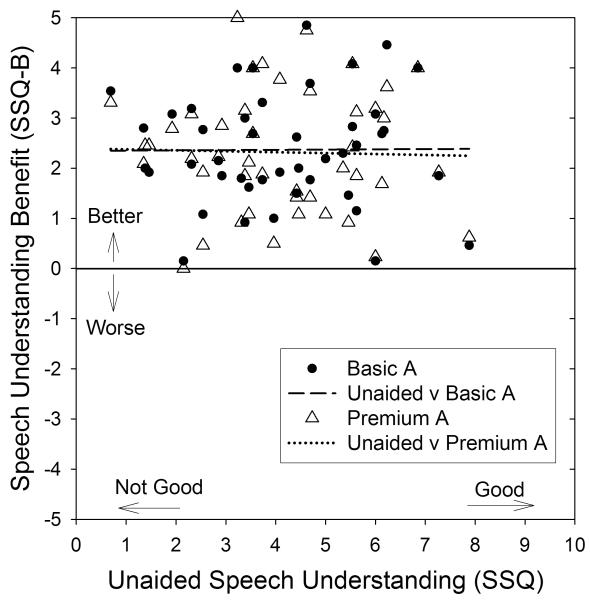
Like the APHAB, the SSQ and SSQ-B also yields information about unaided and aided speech understanding in daily life. Items from the Speech-understanding subscale (SSQ items 1-12 and 14 of the Speech section; Gatehouse and Akeroyd 2006) were averaged to create a speech-understanding score for each condition. Figure 6 depicts each participant’s reported unaided speech-understanding subscale score from the SSQ versus their speech-understanding benefit score from the SSQ-B using brand A’s basic-feature (filled shapes) and premium-feature technologies (open shapes). This figure demonstrates that participants reported a wide range of unaided speech-understanding abilities, and generally reported that these abilities were improved with both basic and premium HAs. There are no clear differences in reported speech-understanding benefit between the basic A and premium A HAs. The regression lines both for unaided listening versus basic A and unaided listening versus premium A HAs are essentially flat, demonstrating no systematic relationship between unaided speech understanding and aided speech-understanding benefit for either level of HA technology. Statistical analysis confirmed that the regression slopes were not different from zero. Results for brand B were essentially the same as for brand A (this figure is not provided).
Figure 6.
Participants’ unaided speech-understanding scores from the SSQ versus their speech-understanding benefit scores from the SSQ-B using brand A’s basic-feature (filled shapes) and premium-feature technologies (open shapes).
Speech-understanding benefit scores from the SSQ-B were averaged across the four aided conditions for each participant. A single-sample t-test was conducted to determine the benefit/deficit of using HAs for self-reported speech understanding. These results, provided in row 2 of Table3 (Unaided vs Aided; SSQ) demonstrated a significant improvement in speech understanding when wearing HAs ( =2.35, SD =0.96) compared to no change (Test Value = 0). This finding echoes the statistical comparison of perceived frequency of successes with unaided and aided speech understanding using data from the APHAB.
Listening effort in daily life: Unaided vs aided listening
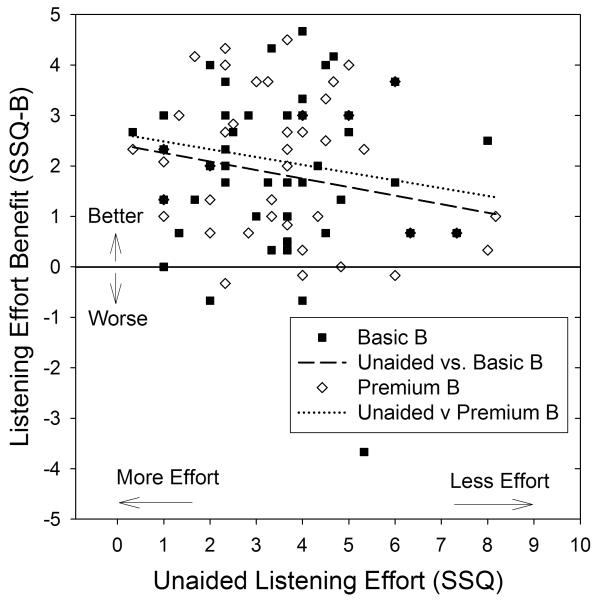
Items from the SSQ Listening-effort subscale (items 14, 15, and 18 of the Qualities section; Gatehouse and Akeroyd 2006) were averaged to create a listening-effort score for each condition. Figure 7 depicts each participant’s reported unaided listening-effort score from the SSQ versus their listening-effort benefit score from the SSQ-B for brand B’s basic-feature (filled shapes) and premium-feature technologies (open shapes). This figure demonstrates that participants reported a wide range of unaided listening effort in daily life. In addition, listening became easier with both basic-feature and premium-feature HAs. The regression lines demonstrate a downward trend as well as a small difference in favor of the premium-feature devices. However, analyses showed that these visual trends were not statistically significant. Similar results were demonstrated for brand A, (this figure is not provided).
Figure 7.
Participants’ unaided listening-effort scores from the SSQ versus their listening-effort benefit scores from the SSQ-B using brand B’s basic-feature (filled shapes) and premium-feature technologies (open shapes.)
Listening-effort benefit scores were averaged across all aided conditions for each participant. A single-sample t-test was conducted to determine the effect of using HAs on self-reported listening effort. These results, provided in row 4 of Table 3 (Unaided vs Aided; SSQ) demonstrated a significant improvement in listening effort when wearing HAs ( =1.95, SD=1.27) compared to no change (Test Value = 0).
Speech understanding in daily life: Comparisons of aided benefit
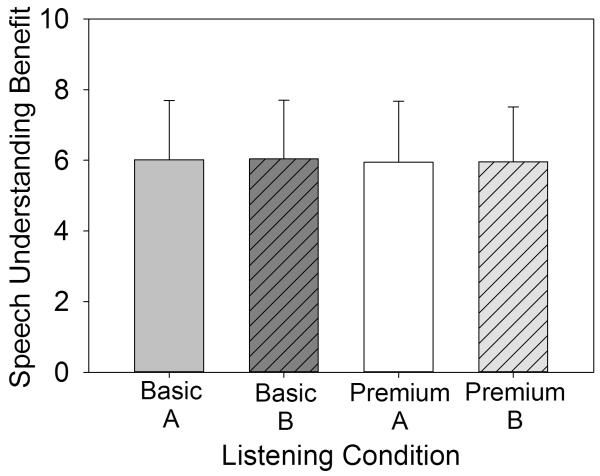
The APHAB, SSQ-B, and DOSO questionnaires each provided information about speech-understanding benefit with HAs. To obtain a comprehensive assessment, a composite speech-understanding benefit score was calculated by combining subscale scores from these three questionnaires. Scores were rescaled to a 0-10 format where 10 represented better speech-understanding benefit. Then the rescaled scores were averaged for each HA for every participant. Figure 8 depicts the mean composite benefit scores for each aided condition. The differences among the four aided conditions appear small, with means for each falling around 6 out of 10. Repeated measures ANOVA with planned contrasts demonstrated that participants’ perceived aided speech-understanding benefit in their daily listening environments was not significantly affected on average by the HA technologies that they used in this research, F (1.801, 79.245) = 0.132, p > 0.05. Planned contrasts of premium and basic hearing aids are provided in row 3 of Table 3. None was statistically significant.
Figure 8.
Mean benefit for speech understanding in daily life situations (three questionnaires combined). Data are for two basic-feature and two premium-feature HAs. A higher score indicates better reported speech-understanding benefit. Error bars show 1 standard deviation.
Listening-effort in daily life: Comparisons of aided benefit
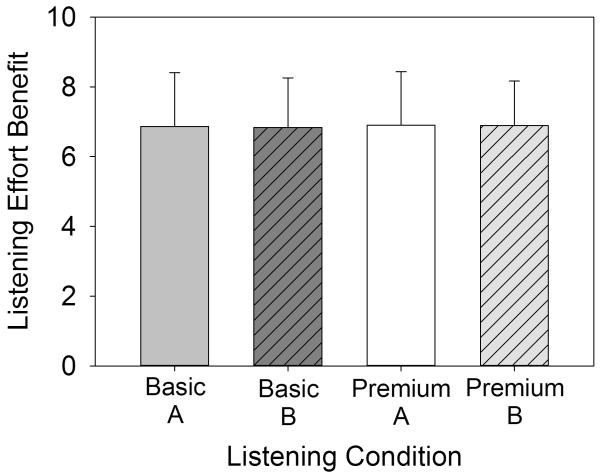
A composite self-reported listening-effort score was calculated by combining subscale scores from two separate questionnaires: SSQ-B and DOSO. The subscale scores were rescaled to a ten point scale, and then averaged. Figure 9 depicts the mean composite benefit scores for each aided condition. Mean listening-effort scores were between 6.75 and 6.9 for all of the HA types. The results of the repeated measures ANOVA showed that typical participants’ perceived listening-effort in their daily listening environments was not significantly affected by the HA technologies that they used for this research, F (2.056, 90.449) = 0.044, p > 0.05. Planned contrasts of premium and basic hearing aids are provided in row 5 of Table 3. None was statistically significant.
Figure 9.
Mean benefit for listening effort in daily life situations (two questionnaires combined). Data are for two basic-feature and two premium-feature HAs. A higher score indicates better reported listening-effort benefit. Error bars show 1 standard deviation.
Analysis of Participant Diaries
Each participant described 1 communication situation that went well and 1 communication situation that went poorly every day for 5 days while they were wearing each of the 4 HAs. This resulted in 40 statements for each participant, and 1800 total statements. Each of these statements served as a meaning unit for analysis. Three trained researchers worked together to describe each meaning unit using 1 or more codes. Dialogue among the coders helped to validate and refine the codes as needed.
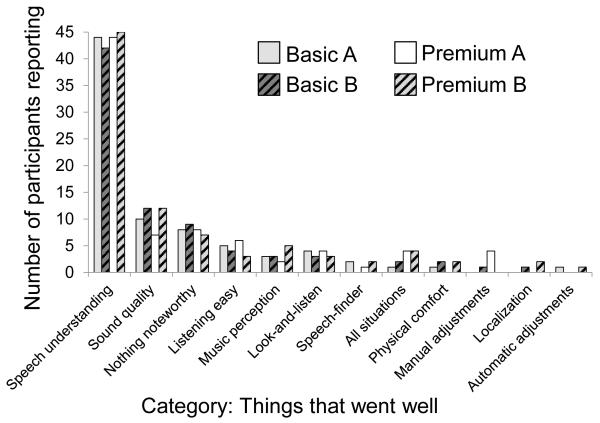
The diary entries for the 45 participants generated 2191 codes and depicted a broad range of daily communication experiences. These codes were compared and grouped under progressively higher-order categories based on similarities of meaning. Only those categories with at least 2 participants reporting were included in the comparison. Figure 10 demonstrates the number of participants out of 45 who made at least 1 diary entry associated with these higher-order categories in response to the question: “Describe one communication situation that went well today.” Counts are displayed for the four pairs of HAs. In this figure it can be seen that the content of the responses were distilled into 12 higher-order categories. The overwhelmingly predominant positive category was related to speech understanding in various situations. Typical responses were: “One on one with a friend – could hear great”, and “Telephone conversations went well.” Satisfactory experiences with sound quality and ease of listening also were noted; yet, compared to observations about speech understanding, these experiences were noted by far fewer participants.
Figure 10.
Everyday experiences that were reported to be positive in daily diaries. The height of each bar gives the number of participants who identified each topic for each HA. The maximum score is 45.
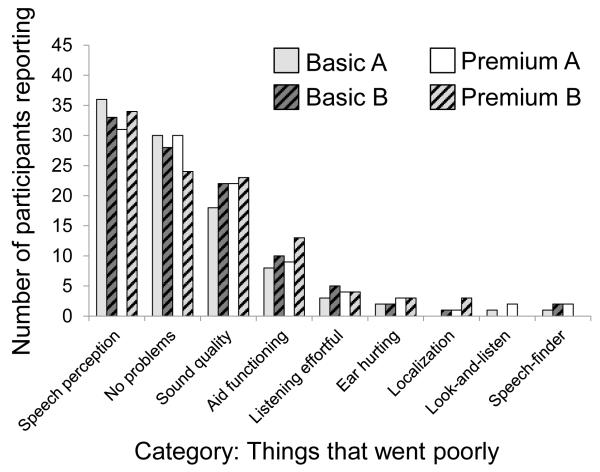
Figure 11 demonstrates the number of participants out of 45 who made at least 1 diary entry associated with the higher-order categories in response to the question: “Describe one communication situation that went poorly today.” Counts are displayed for the four pairs of HA technology. In this figure it is seen that 9 higher-order categories were retained. The most frequently identified negative experiences were related to speech understanding in various situations, problems with sound quality, and problems with the HA functioning. Typical responses for these categories were: “Background noise erased my understanding,” “Background noise is tinny sounding,” and “Got feedback and high noise levels, made hearing difficult.” Effortful listening also was noted for all of the HA exemplars. A response that typifies this category was: “At the grocery store I had to really focus on the cashier to hear him.” However, substantially fewer participants noted problems with listening effort in their daily lives compared to some of the other categories. It is noteworthy that many participants indicated no problems communicating with their HAs.
Figure 11.
Everyday experiences that were reported to be negative in daily diaries. The height of each bar gives the number of participants who identified each topic for each HA. The maximum score is 45.
For the purposes of comparing premium and basic HAs, we were most interested in categories that demonstrated patterns of better performance in daily living with either premium or basic-feature HAs. The only category that exhibited such a pattern was the positive response “all situations.” A typical response for this category was “Everything went well today.” Responses related to this category were noted for only 8 of 90 possible cases when wearing premium-feature HAs and only 3 of 90 cases when wearing basic-feature HAs. Clearly, although the expected pattern was noted, this type of response was not prevalent among the research participants.
DISCUSSION
Benefit/deficit of current HA technology on speech understanding and listening effort compared to unaided listening
The results of this study are consistent with previous research demonstrating that speech understanding is improved and listening effort is reduced when listening with modern HAs compared to listening without HAs. Overall, participants received substantial measureable aided benefit both in the laboratory and in daily life and generally reported positive experiences with each of the research HAs. Although these findings were not surprising, they established a baseline of unaided performance for subsequent interpretation of performance with premium-feature and basic-feature devices. In addition, they confirmed that the laboratory measures were capable of detecting mean differences in performance at least as small as 4% words correct for speech understanding, and approximately ½ of 1 point on the listening effort rating scale. This is particularly important because only 1 significant difference in performance was found between premium-feature and basic-feature HAs.
The only condition where aided improvement was not demonstrated statistically was the measure of listening effort in the laboratory test environment with loud speech (70 dB SPL) and equally loud background noise (0 dB SNR). Figures 3 and 4 show that, compared to the soft and average laboratory test environments, participants received less benefit from HAs in both the speech-understanding and listening-effort domains in the loud condition. Although the small improvements obtained from the HAs at this level resulted in a statistically significant improvement in speech understanding, aided improvements were not sufficient on average to result in statistically lower listening effort in this loud and noisy environment. It is possible that potential aided improvements in listening effort were partially offset by the impact of the simultaneously decreasing SNR and/or increased distortion of the more amplified signals.
Relative impact of premium-feature and basic-feature HAs on speech understanding and listening effort
Although listening with HAs was collectively demonstrated to improve speech understanding and reduce listening effort in the laboratory and in daily life, this study provided little evidence that examples of premium-feature HAs resulted in further improvements in these domains compared to basic-feature HAs. Based on the design of our study, which favored identifying a difference between basic-feature and premium-feature HAs, and generally accepted beliefs about feature-levels, we expected to observe performance differences between the levels of technology. Originally, we planned to measure the extent of these differences. Instead, the finding of no difference in outcomes between premium-feature and basic-feature HAs when the two HA brands were combined offers compelling evidence that fails to support assumptions that real-world speech-understanding and listening-effort outcomes are incrementally improved with premium products like those used for this study. This is consistent with previous research that has demonstrated comparable overall performance with different types of hearing aid processing (see Newman & Sandridge 2002; Shanks et al. 2002; Hornsby 2013). Further support comes from Amlani et al. (2013), who reported a lack of improvement with features commonly included in premium devices (e.g., more compression channels, faster compression time constants).
Comparison of relative impact of premium-feature and basic-feature HAs on speech understanding and listening effort across exemplars from two major brands
No differences in performance were found between using premium-feature and basic-feature HAs when the two HA brands were combined. However, practitioners and patients choose HA technologies from among several different brands. It was of interest to investigate whether these conclusions might differ for technologies from different brands. We compared speech-understanding and listening-effort outcomes when using premium-feature and basic-feature HAs separately for the two different brands selected for this study. The lack of difference that was found in the laboratory and in daily life mostly was maintained across both pairs of basic-feature and premium-feature devices. However, it was observed that when the two brands were compared separately in the loud listening environment, the brand B, premium-feature HA resulted in lower listening effort on average compared to the brand B basic-feature HA (p < 0.001, d = .36). Furthermore, the separation between the basic B and premium B regression lines for Figure 7 demonstrated that listening with the premium B hearing aid produced a small advantage in listening effort in daily life. This advantage was not observed with the brand A products. Even though the self-reported difference in listening effort for brand B’s premium and basic hearing aids was not significant, this trend is consistent with the laboratory result. We explored this finding using visual inspection of waveforms of each model’s processed AFAAF signal. It was noticed that the brand B basic hearing aid resulted in acoustic waveforms that were noisier at all levels compared to brand B’s premium hearing aid, and were especially noisy in the loud condition. It seems likely that this difference in the amplified signal was responsible for the listening effort outcome differences.
Clinically, the significance of the laboratory outcome should be interpreted with some caution. The average advantage that was perceived with the premium B product was less than ½ of 1 rating interval on a 7 point scale. Using conventional cut-offs for interpreting Cohen’s d, the observed effect (d = .36) is considered small. With an effect of d = .36 there is a 60% probability that individuals would have better listening effort outcomes in the loud laboratory environment when listening with the premium B hearing aid compared to the basic B hearing aid. This is compared to a probability of 50% when there is no measureable effect (i.e., d = 0). Further, this small difference was observable in the controlled laboratory, but was not significant in the real world. This is consistent with our a priori expectation that at least a moderate effect would be needed for differences to be clinically meaningful. That being said, it is important to acknowledge that implementations of HA features are engineered differently for different manufacturers. The possibility exists that some features are superior for some brands. Though the precise reason for the difference in findings between the two brands is unclear, it serves as a caution that the findings of this research might have been different for other brands’ premium-feature and basic-feature HAs. This finding emphasizes a need for this type of research for devices from all retailed brands.
Comparisons of participant diaries
The participant diaries allowed HA wearers to identify those situations that were most memorable to them each day. It follows that the communication situations identified were those most salient for participants’ daily life. It was hoped that these data would provide information about existing differences between the HAs that might be important to listeners, but that might not be assessed in the laboratory or from the standardized self-report questionnaires. However, no consistent patterns of better performance in daily living were identified with either premium-feature or basic-feature HAs. It was noted that many of the communication situations described in the diaries fell into the same categories for things that went well for them and things that went poorly (Figs 10 & 11). Consistent with past literature (e.g., Kochkin 2002, Abrams & Kihm 2015), the situations most consistently identified were related to: speech understanding, sound clarity/quality, listening effort, localization, and physical comfort. In addition, participants documented when specific features of the HAs (e.g., automatic adjustment, special programs) were particularly helpful, and also reported negatively when the aid did not function as expected in specific listening environments. It is worth mentioning that these participants responded to a variety of self-report questionnaires, and participated in unaided localization and sound acceptability laboratory tasks before wearing any of the research HAs, and were carefully instructed about the use and purpose of the different programs. As a result, it is possible that these participants were more likely to notice and report about these types of communication situations compared to typical HA wearers. Yet, even with such potential priming, situations related to localization, sound acceptability, and the two manually-selectable programs (Look-and-listen and Speech-finder) were identified far less often than the predominant category: speech understanding. Data from the participant diaries suggest strongly that, for the majority of participants, the incremental technological advancements and features designed for specialized listening circumstances that might be provided by premium-feature HAs were not of greater noticeable value than the technologies incorporated in the basic models for daily communication in the real world.
Additional considerations
This research is a comparison of select technologies at a given moment in time. At the time of this writing, the cost of HAs with premium features is greater than those with basic features, but we have presented evidence that these devices mostly did not result in better performance for typical older hearing aid candidates. We do not claim that this outcome will hold for all brands of all manufactures, at all points in time. However, payers should remain circumspect about device benefits without independent proof of real-world effectiveness.
The participants in this study were typical older hearing aid candidates with uncomplicated mild-to-moderate hearing loss. Some might argue that this population was not representative of individuals who might benefit from premium features. Although it is possible that individuals with different or more complicated hearing losses might obtain greater benefit from premium features, there is no existing evidence to suggest that this would be the case.
The hearing aid fittings used for this research were meticulous. Acoustic coupling, and gain and compression settings were modified to optimize the hearing aids according to individualized fitting prescription targets and participants’ reports of loudness, binaural balance, and sound quality; however, other adjustable feature settings (e.g., DNR strengths, default microphone settings, manually-selectable programs) for the different hearing aids were chosen for each participant based on manufacturer recommendations. The premium-feature HAs defaulted to stronger DNR and narrower directional polar plots, and the manually-selectable programs had more advanced processing compared to the basic-feature HAs. It was emphasized in manufacturer trainings that these were the recommended settings for each device. For some of the feature settings the premium HAs offered more choices of adjustment (as shown in Table 1). It might be argued that our fitting protocol did not capitalize on the potential of the more advanced devices because we did not increase or decrease settings for different participants. However, there are no established guidelines or clear rules for modifying the feature settings away from manufacturer recommendations. This would be an interesting topic for future research.
Our laboratory set-up was designed to highlight the benefits of the hearing aids’ features in selected test conditions according to their different capabilities, but it was not our goal to evaluate the efficacy of the features under idealized conditions. For example, the brief (< 4 sec) laboratory stimuli likely did not allow the devices to fully engage their noise management and directional algorithms (Figs 1 & 2). When measured after exposure to a longer (13 sec) speech signal, the directional behaviors of the four hearing aids showed a greater degree of broad-band directionality for all of the hearing aids and a greater difference between brand B’s basic and premium hearing aids. Likewise, test box measures of DNR established that all hearing aids were capable of engaging DNR when exposed to a longer noise signal. Furthermore, the test-box measures could not verify the effects of any multi-band adaptive capabilities of the premium devices. Thus, the data in Figures 1 and 2 should not be interpreted as representations of these hearing aids’ maximal DNR and directional processing capabilities, or of their activation levels in daily listening. Nevertheless, the self-report data presumably reflected whatever activation levels these did have in the real world. However, it has been observed that noise management and directional processing are activated in the real world relatively infrequently (Banerjee 2011).
One possible point of contention might be our choice of a self-report method to quantify listening effort. Some might not accept the notion that people can accurately self-report listening effort in the laboratory or in the real world and might prefer to evaluate performance using a dual-task methodology. Johnson et al (2015) determined that the laboratory self-report method used for this study is equally valid, and in some conditions, preferred over a dual-task measure. The findings of the current study lend further support for the sensitivity and validity of the laboratory self-report measure of listening effort: the only statistical indication of better performance with premium-feature hearing aids was a rating of listening effort in the lab for one brand. The mean difference for this measure was less than ½ of 1 scoring interval. Examination of the acoustical waveforms showed that internal processing with that brand’s basic HA was noisier than with the premium HA. This subtle difference was only detected using the self-report method. Reductions in listening effort that might be inferred from objective measures but that cannot be perceived by the user might not be adequate justification for recommending different HA technology levels.
CONCLUSION
Modern HAs are capable of providing significant improvements in speech understanding and listening effort for older adults with uncomplicated, acquired, mild-to-moderate sensorineural HI. Hearing aids that are labelled as more advanced and that are retailed at a higher price point generally are presumed to provide further improvements in these domains. However, this research did not provide evidence to validate assumptions of clinically significant improved outcomes with premium-feature HAs, compared to basic-feature HAs. Instead, the combined results of laboratory measures, self-report questionnaires, and participant diary information all point to a conclusion that premium-feature and basic-feature HAs are capable of providing essentially equivalent improvements to speech understanding and listening effort in daily listening for this population. Trained audiologists programmed, fitted, and fine-tuned each HA for this research using systematic, rule-based, individualized protocols. Under these circumstances, each HA exemplar was individually optimized according to scientific evidence. It is unclear whether these findings might have been different had the HAs been fitted differently. Regardless, this research does not provide any scientific basis for routinely recommending higher-priced premium-feature HA technologies over basic-feature technologies for typical older HA candidates.
ACKNOWLEDGEMENTS
This research was funded by a grant to the third author from the U. S. National Institute on Deafness and other Communication Disorders (R01DC011550).
Footnotes
Conflicts of Interest: No conflicts of interest are declared by any author.
Portions of this article were presented at the 42nd Annual Scientific and Technology Meeting of the American Auditory Society, Scottsdale, AZ, March 5, 2014, the Eighth International Adult Aural Rehabilitation Conference, St. Petersburg, FL, June 2, 2015, and to the President’s Council of Advisors on Science and Technology at the Accessible and Affordable Hearing Health Care for Adults Workshop, Washington, D.C., September, 2015.
REFERENCES
- Abrams HB, Kihm J. An introduction to MarkeTrak IX: A new baseline for the hearing aid market. Hear Rev. 2015;22:16–21. [Google Scholar]
- Amlani AM, Bharadwaj SV, Jivani S. Influence of amplification scheme and number of channels on aided speech-intelligibility performance. Proc Mtgs Acoust. 2013;19:060017. [Google Scholar]
- Banerjee S. Hearing aids in the real world: typical automatic behavior of expansion, directionality and noise management. J Am Acad Audiol. 2011;22:34–48. doi: 10.3766/jaaa.22.1.5. [DOI] [PubMed] [Google Scholar]
- Bentler R, Wu YH, Kettel J, et al. Digital noise reduction: outcomes from laboratory and field studies. Int J Audiol. 2008;47:447–460. doi: 10.1080/14992020802033091. [DOI] [PubMed] [Google Scholar]
- Brons I, Houben R, Dreschler WA. Perceptual effects of noise reduction with respect to personal preference, speech intelligibility, and listening effort. Ear Hear. 2013;34:29–41. doi: 10.1097/AUD.0b013e31825f299f. [DOI] [PubMed] [Google Scholar]
- Cohen J. Statistical power analysis for the behavioral sciences. 2nd ed Erlbaum; Hillsdale, NJ: 1988. [Google Scholar]
- Cox RM, Alexander GC. The abbreviated profile of HA benefit. Ear Hear. 1995;16:176–186. doi: 10.1097/00003446-199504000-00005. [DOI] [PubMed] [Google Scholar]
- Cox RM, Johnson JA, Xu J. Impact of advanced hearing aid technology on speech understanding for older listeners with mild-to-moderate, adult-onselt, sensorineural hearing loss. Gerontol. 2014;60:557–568. doi: 10.1159/000362547. [DOI] [PMC free article] [PubMed] [Google Scholar]
- Cox RM, Alexander GC, Xu J. Development of the Device-Oriented Subjective Outcome (DOSO) Scale. J Am Acad Audiol. 2014;25:727–736. doi: 10.3766/jaaa.25.8.3. [DOI] [PMC free article] [PubMed] [Google Scholar]
- Cox RM, Johnson JA, Xu J. Impact of hearing aid technology on outcomes in daily life I: The patient’s perspective. Ear Hear. 2016 doi: 10.1097/AUD.0000000000000277. Advance online publication. [DOI] [PMC free article] [PubMed] [Google Scholar]
- Desjardins JL, Doherty KA. The effect of hearing aid noise reduction on listening effort in hearing-impaired adults. Ear Hear. 2014;35:600–610. doi: 10.1097/AUD.0000000000000028. [DOI] [PubMed] [Google Scholar]
- Donaldson TS. Robustness of the F-test to errors of both kinds and the correlation between the numerator and denominator of the F-ratio. J Am Stat Assoc. 1968;63:660–676. [Google Scholar]
- Gatehouse S. Role of perceptual acclimitization in the selection of requency responses for hearing aids. J Am Acad Audiol. 1993;4:296–306. [PubMed] [Google Scholar]
- Gatehouse S, Akeroyd M. Two-eared listening in dynamic situations. Int J Audiol. 2006;45(Suppl 1):S120–124. doi: 10.1080/14992020600783103. [DOI] [PubMed] [Google Scholar]
- Gatehouse S, Noble W. The speech, spatial and qualities of hearing scale (SSQ) Int J Audiol. 2004;43:85–99. doi: 10.1080/14992020400050014. [DOI] [PMC free article] [PubMed] [Google Scholar]
- Glass GV, Peckham PD, Sanders JR. Consequences of failure to meet assumptions underlying the fixed effects analyses of variance and covariance. Rev Edu Res. 1972;42:237–288. [Google Scholar]
- Hicks C, Tharpe A. Listening effort and fatigue in school-age children with and without hearing loss. J Speech Lang Hear Res. 2002;45:573–584. doi: 10.1044/1092-4388(2002/046). [DOI] [PubMed] [Google Scholar]
- Hornsby B. The effects of hearing aid use on listening effort and mental fatigue associated with sustained speech processing demands. Ear Hear. 2013;34:523–534. doi: 10.1097/AUD.0b013e31828003d8. [DOI] [PubMed] [Google Scholar]
- Jensen NS, Akeroyd MA, Noble W, et al. The Speech, Spatial and Qualities of Hearing scale (SSQ) as a benefit measure. Research poster presented at the National Center for Rehabiliative Auditory Research conference on “The Ear-Brain System: Approaches to the Study and Treatment of Hearing Loss”; Portland, OR. 2009. [Google Scholar]
- Johnson JA, Xu J, Cox RM, et al. A comparison of two methods for measuring listening effort as part of an audiologic test battery. Am J Audiol. 2015;24:419–431. doi: 10.1044/2015_AJA-14-0058. [DOI] [PMC free article] [PubMed] [Google Scholar]
- Keidser G, Dillon H, Carter L, et al. NAL-NL2 Empirical Adjustments. Trends Amplif. 2012;16:211–223. doi: 10.1177/1084713812468511. [DOI] [PMC free article] [PubMed] [Google Scholar]
- Knudsen LV, Laplante-Levesque A, Jones L, et al. Conducting qualitative research in audiology: a tutorial. Int J Audiol. 2012;51:83–92. doi: 10.3109/14992027.2011.606283. [DOI] [PubMed] [Google Scholar]
- Kochkin S. Consumers rate improvements sought in hearing instruments. Hear Rev. 2002;9:18–22. [Google Scholar]
- Lin FR, Thorpe R, Gordan-Salant S, et al. Hearing loss prevalence and risk factors among older adults in the United States. J Gerontol A Bio Sci Med Sci. 2011;66A:582–590. doi: 10.1093/gerona/glr002. [DOI] [PMC free article] [PubMed] [Google Scholar]
- McGarrigle R, Munro KJ, Dawes P, et al. Listening effort and fatigue: What exactly are we measuring? A British Society of Audiology Cognition in Hearing Special Interest Group 'white paper'. Int J Audiol. 2014;53:433–440. doi: 10.3109/14992027.2014.890296. [DOI] [PubMed] [Google Scholar]
- Newman C, Sandridge S. Review of research on digital signal processing. In: Valente M, editor. Hearing Aids: Standards, Options, and Limitations. 2nd ed Thieme; New York, NY: 2002. pp. 347–381. [Google Scholar]
- Pearsons KS, Bennett RL, Fidell S. Speech levels in various noise environments. U.S. Environmental Protection Agency; Washington D.C.: 1977. [Google Scholar]
- Rosenthal R, Rosnow R. Contrast Analysis: Focused Comparisons in the Analysis of Variance. Cambridge University Press; Cambridge: 1985. [Google Scholar]
- Rudner M, Lunner T, Behrens T, et al. Working memory capacity may influence perceived effort during aided speech recognition in noise. J Am Acad Audiol. 2012;23:577–589. doi: 10.3766/jaaa.23.7.7. [DOI] [PubMed] [Google Scholar]
- Sarampalis A, Kalluri S, Edwards B, et al. Objective measures of listening effort: effects of background noise and noise reduction. J Speech Lang Hear R. 2009;52:1230–1240. doi: 10.1044/1092-4388(2009/08-0111). [DOI] [PubMed] [Google Scholar]
- Shanks J, Wilson R, Larson V, Williams D. Speech recognition performance of patients with sensorineural hearing loss under unaided and aided conditions using linear and compression hearing aids. Ear Hear. 2002;23:280–290. doi: 10.1097/00003446-200208000-00003. [DOI] [PubMed] [Google Scholar]
- Smeds K, Wolters F, Rung M. Estimation of signal-to-noise ratios in realistic sound scenarios. J Am Acad Audiol. 2015;26:183–196. doi: 10.3766/jaaa.26.2.7. [DOI] [PubMed] [Google Scholar]
- Studebaker GA. A “rationalized” arcsine transform. J Speech Lang Hear R. 1985;28:455–462. doi: 10.1044/jshr.2803.455. [DOI] [PubMed] [Google Scholar]
- Tabachnick BG, Fidell LS. Using multivariate statistics. 5th ed Allyn & Bacon; Needham Heights: 2007. [Google Scholar]
- Xu J. (Unpublished doctoral dissertation) University of Memphis; Memphis, TN: 2012. Interactions between cognition and hearing aid compression release time: effects of linguistic context of speech test materials on speech-in-noise performance. [DOI] [PMC free article] [PubMed] [Google Scholar]
- Xu J, Cox RM. Effects of lingistic context in speech on release time advantage. Referreed poster presented at the “38th Annual Scientific and Technology Conference of the American Auditory Society”; Scottsdale, AZ. [Retrieved October 15, 2015]. 2011. from www.harlmemphis.org. [Google Scholar]
- Xu J, Cox RM. Recording and evaluation of an American dialect version of the Four Alternative Auditory Feature test. J Am Acad Audiol. 2014;25:737–745. doi: 10.3766/jaaa.25.8.4. [DOI] [PMC free article] [PubMed] [Google Scholar]


