Supplemental Digital Content is available in the text
Abstract
Pulse wave velocity (PWV) and augmentation index (AI) are independent predictors of cardiovascular health. However, the comparability of multiple oscillometric modalities currently available for their assessment was not studied in detail. In the present study, we aimed to evaluate the relationship between indices of arterial stiffness assessed by diastolic and suprasystolic oscillometry.
In total, 56 volunteers from the general population (23 males; median age 70 years [interquartile range: 65–72 years]) were recruited into observational feasibility study to evaluate the carotid-femoral/aortic PWV (cf/aoPWV), brachial-ankle PWV (baPWV), and AI assessed by 2 devices: Vicorder (VI) applying diastolic, right-sided oscillometry for the determination of all 3 indices, and Vascular explorer (VE) implementing single-point, suprasystolic brachial oscillometry (SSBO) pulse wave analysis for the assessment of cfPWV and AI. Within- and between-device correlations of measured parameters were analyzed. Furthermore, agreement of repeated measurements, intra- and inter-observer concordances were determined and compared for both devices.
In VI, both baPWV and cfPWV inter-correlated well and showed good level of agreement with bilateral baPWV measured by VE (baPWV[VI]–baPWV[VE]R: overall concordance correlation coefficient [OCCC] = 0.484, mean difference = 1.94 m/s; cfPWV[VI]–baPWV[VE]R: OCCC = 0.493, mean difference = 1.0 m/s). In contrast, SSBO-derived aortic PWA (cf/aoPWA[VE]) displayed only weak correlation with cfPWV(VI) (r = 0.196; P = 0.04) and ipsilateral baPWV (cf/aoPWV[VE]R–baPWV[VE]R: r = 0.166; P = 0.08). cf/aoPWA(VE) correlated strongly with AI(VE) (right-sided: r = 0.725, P < 0.001). AI exhibited marginal between-device agreement (right-sided: OCCC = 0.298, mean difference: 6.12%). All considered parameters showed good-to-excellent repeatability giving OCCC > 0.9 for 2-point-PWV modes and right-sided AI(VE). Intra- and inter-observer concordances were similarly high except for AI yielding a trend toward better reproducibility in VE (interobserver–OCCC[VI] vs [VE] = 0.774 vs 0.844; intraobserver–OCCC[VI] vs [VE] = 0.613 vs 0.769).
Both diastolic oscillometry-derived PWV modes, and AI measured either with VI or VE, are comparable and reliable alternatives for the assessment of arterial stiffness. Aortic PWV assessed by SSBO in VE is not related to the corresponding indices determined by traditional diastolic oscillometry.
INTRODUCTION
Noninvasive assessment of arterial stiffness is an independent predictor of all-cause mortality and future cardiovascular events in high-risk patients and in the general population.1,2 Based on a large body of evidence, the aortic stiffness, expressed as carotid-femoral pulse wave velocity (cfPWV), is considered a gold standard to estimate cardiovascular risk. Its routine determination is recommended in current guidelines for the management of arterial hypertension.3 Most of available devices assess arterial stiffness on the basis of applanation tonometry and piezoelectric pressure transduction. Owing to high efforts on operator experience and relatively low reliability, these techniques did not find implementation in the every-day practice so far. Pneumatic cuff oscillometry promises, despite some inherent methodological discrepancies, a convenient and more feasible measurement alternative.4 Vicorder (VI, SMT Medical, Würzburg, Germany) and Arteriograph (Tensiomed, Budapest, Hungary) are 2 most extensively studied oscillometric devices currently available on the market, both showing good reliability and comparable strong relationship between measured cfPWV values and gold standard.5,6 Very recently, the standard cut-off values for VI were identified in the general population advocating its use as a reference oscillometric device.7 In order to determine PWV, simultaneous, 2-point pulse recordings at diastolic pressure level are necessary in VI, whereas in Arteriograph, the assessment is reduced to the single-point, suprasystolic brachial oscillometry (SSBO). This simplification further facilitates the PWV measurement process and is therefore of particular interest in clinical routine and epidemiologic research. Another simplifying alternative to cfPWV is the determination of brachial-ankle PWV (baPWV).8–10 The recently approved device Vascular Explorer (VE, Enverdis, Jena, Germany) incorporates both SSBO and baPWV in a user-friendly, comprehensive assessment of vascular status.
In the present study, we aimed to evaluate the comparability and reliability of arterial stiffness measurements performed by VE and VI in a population-based sample.
METHODS
Study Sample
Repeated measurements of arterial stiffness were performed between December 2010 and April 2011 in a convenience sample of 56 subjects selected from the pilot survey of the LIFE Project (Leipzig Research Centre for Civilization Diseases) in LIFE Study Ambulance.11 Probands with critical limb ischemia, ulcera cruris, high-grade carotid atherosclerosis, carotid sinus syndrome, angina pectoris, heart insufficiency, ejection fraction <55%, atrial fibrillation in resting electrocardiogram, lymphoedema, and paraneoplastic lymphadenopathy were excluded from the study. All individuals negated claudication, history of peripheral artery disease, or peripheral revascularization. Descriptives of study population can be found elsewhere.12,13 All subjects included in the study gave their written informed consent. The study was approved by the local ethical committee and was performed according to the Declaration of Helsinki.
Study Design
The study design is presented in Table 1. Details can be found elsewhere.13 In brief, we performed 2 assessments of arterial stiffness with VI and 2 assessments with VE in alternating order by 1 or 2 observers. All combinations were studied to avoid sequential effects resulting in 8 study groups. Subjects were randomly assigned to these groups. All assessments were performed by the same 2 observers (A/B).
TABLE 1.
Study Design

Design of the study allows both, determination of inter- (study groups 1–4) and intra-observer (study groups 5–8) reliability as well as comparisons between the devices on the basis of the same patients. Each assessment is based on 3 measurement replicates.
Since the assessment program of the present study requires high compliance of individuals, only a limit number of cases could be assessed. To analyze the impact of our case numbers to the precision of the quantities of interest, we performed a formal power/case number analysis using the statistical software package PASS 2008 (version 08.0.5). For comparison of parameters between devices we have N = 56 cases while for the analysis of intra- and inter-rater reliability, we have N = 28 cases. Results of analyses can be found in Supplementary Table 1.
Both devices were configured to perform the complete noninvasive examination of vascular status; that is, ankle-brachial index (ABI) was determined prior to arterial stiffness measurements. ABI assessment was validated in both devices in a separated analysis published elsewhere.12,13 Within each set of recordings, all parameters of interest were measured in triplicates. In VE, all parameters, including ABI were measured at the right side, followed by the same measurements at the left side within the time interval of ≥10 min.
Determination of Arterial Stiffness
In preparation for this study, observers were trained for both automated devices according to the instructions of the manufacturers and own standard operating procedures (in German; available upon request). Technical handling was practiced in a training sample of 20 probands prior to the study. All measurements were performed in quiet, well-aired, and temperature-controlled room. Subjects were placed in a supine position for at least 10 min before starting the assessment. All subjects were asked to avoid speaking, and encouraged to breathe calmly during the measurements.
The following parameters were assessed using both VE and VI: brachial (brSBP) and aortic systolic pressure (aoSBP); brachial (brPP) and aortic pulse pressure (aoPP); brachial (brAUG) and aortic augmentation pressure (aoAUG). Brachial and aortic augmentation index (AI) were calculated by the formula: AI = aoAUG/aoPP.
Next, anatomically distinct, in part device-specific PWV modes were determined as ratio of pulse travel distance to pulse transit time (PTT) derived from 2-point diastolic pulse wave analysis and pulse return time (RT) derived from SSBO, respectively.
PTT in VI was determined from foot-to-foot real time shift between simultaneous 2-point-recorded pulse wave curves using in-built cross-correlation algorithm centered on the peak of the second derivative of the pressure curve. Pulse waves were recorded upon automatic cuff inflation to approximately 60 mm Hg over at least 10 pulsations in the following 2 anatomical combinations: carotid-femoral (cf) and brachial-ankle (ba). Finally, AI was in VI assessed applying device-specific brachial pulse wave analysis.
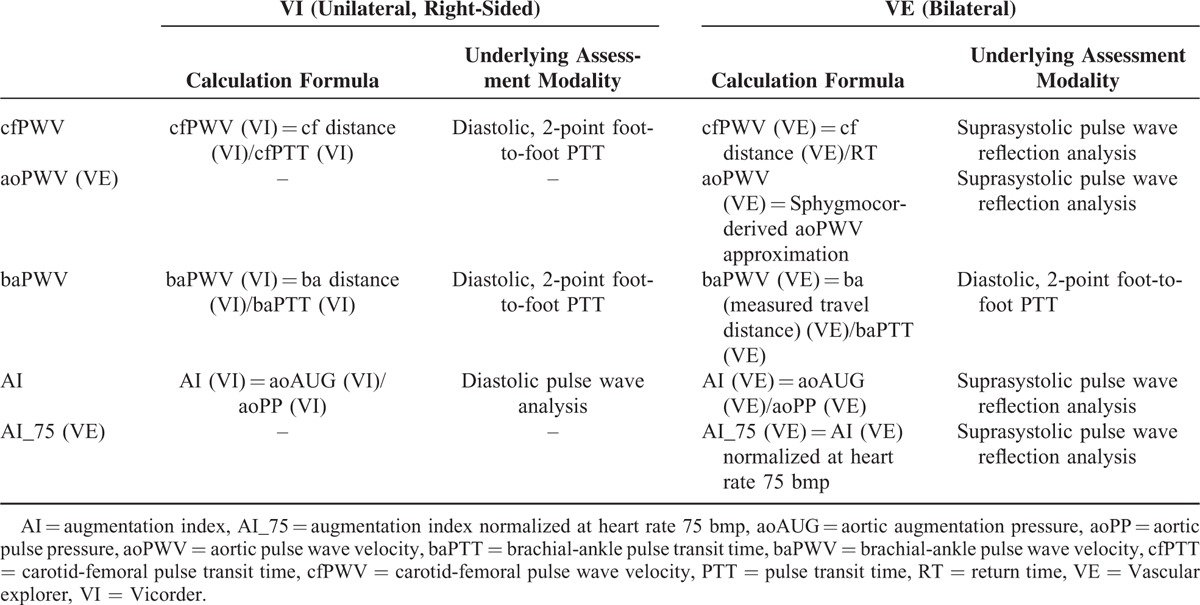
In VE, brachial-ankle pulse transit time (baPTT) necessary for the calculation of brachial-ankle PWV assessed by VE [baPWV(VE)] was determined by device-specific algorithm detecting the real time foot-to-foot difference between brachial and ankle pulse wave. For the determination of baPWV(VE), both measured [baPWV(VE)], and body height-estimated [ba’PWV(VE)] brachial-ankle travel distance was considered. VE-derived AI(VE) and aoPWV(VE) were calculated using aoAUG, aoPP, and RT that were derived from SSBO (i.e., analysis of pulse waves recorded upon complete arterial occlusion at the brachial cuff pressure by about 35 mm Hg above the systolic pressure). RT was assessed applying the reflection method based on measurement of time difference between beginning of the forward and reflected travelling wave acquired by decomposition of the SSSBO pulse recordings (Figure 1). Additionally, the aoPWV values were converted into Sphygmocor-related cfPWV values using formula provided by the manufacturer. For this reason, cfPWV(VE) is reported simultaneously with aoPWV(VE) (i.e., cf/aoPWV[VE]). Considered parameters of vascular stiffness and the method of their assessment are summarized in device-specific manner in Table 2 (for details see also list of abbreviations).
FIGURE 1.
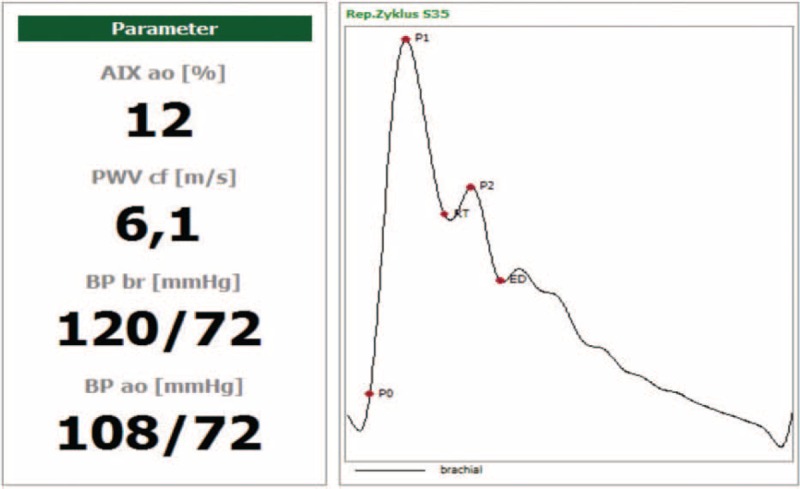
Example of pulse wave recording output in vascular explorer implementing the reflection method. AIX = augmentation index, baPWV = brachial-ankle pulse wave velocity, BP ao = aortic blood pressure, BP br = brachial blood pressure, cfPWV = carotid-femoral wave velocity, ED = ejection duration, P0 = beginning of the forward pressure wave, P1 = peak of the forward pressure wave, P2 = peak of the reflected pressure wave, RT = return time/beginning of the reflected pressure wave (modified from www.enverdis.de).
TABLE 2.
Device-Specific Calculation and Underlying Assessment Method Applied for the Determination of Considered Arterial Stiffness Parameters
In both devices, the following criteria were applied to approve the quality of pressure pulse wave recording:
correct application of the cuffs and the neck band and
PWV-variance of max. 1 m/s over the 10 heart beats recorded artifact-rich recordings were excluded from the analysis.
All travel distances were measured separately for each assessment using a flexible tape as indicated in Figures 2 and 3, respectively. In case of significant android adipositas, a slide calliper was used. Data regarding the acceptability and global time requirements for both devices were collected and published elsewhere in detail.13
FIGURE 2.
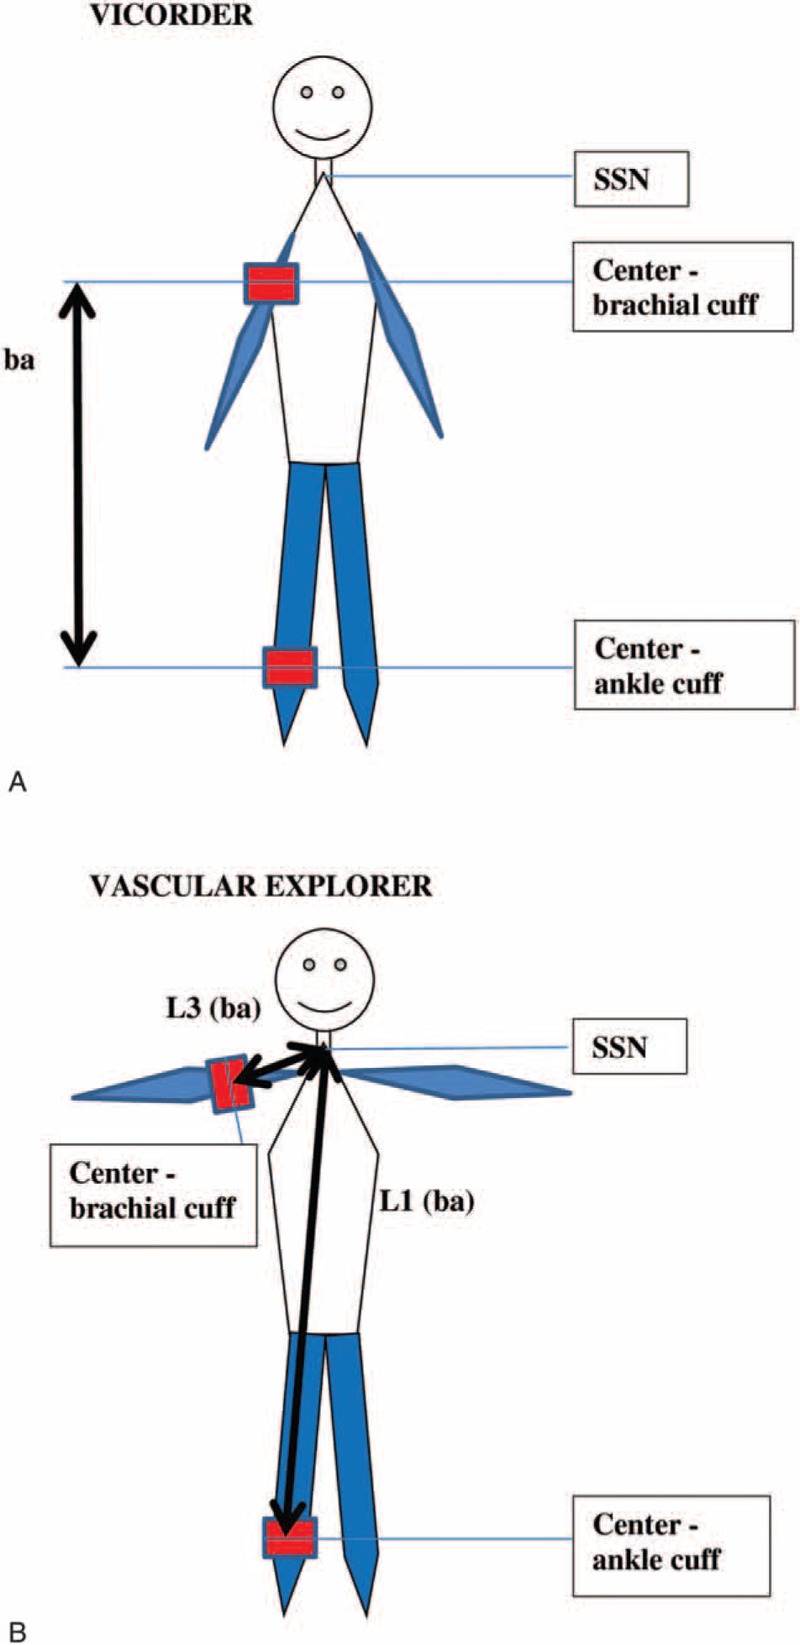
Differences in assessment of baPWV pulse wave travel distance in (A) Vicorder and (B) Vascular explorer. baPWV = brachial-ankle pulse wave velocity, SSN = suprasternal notch.
FIGURE 3.
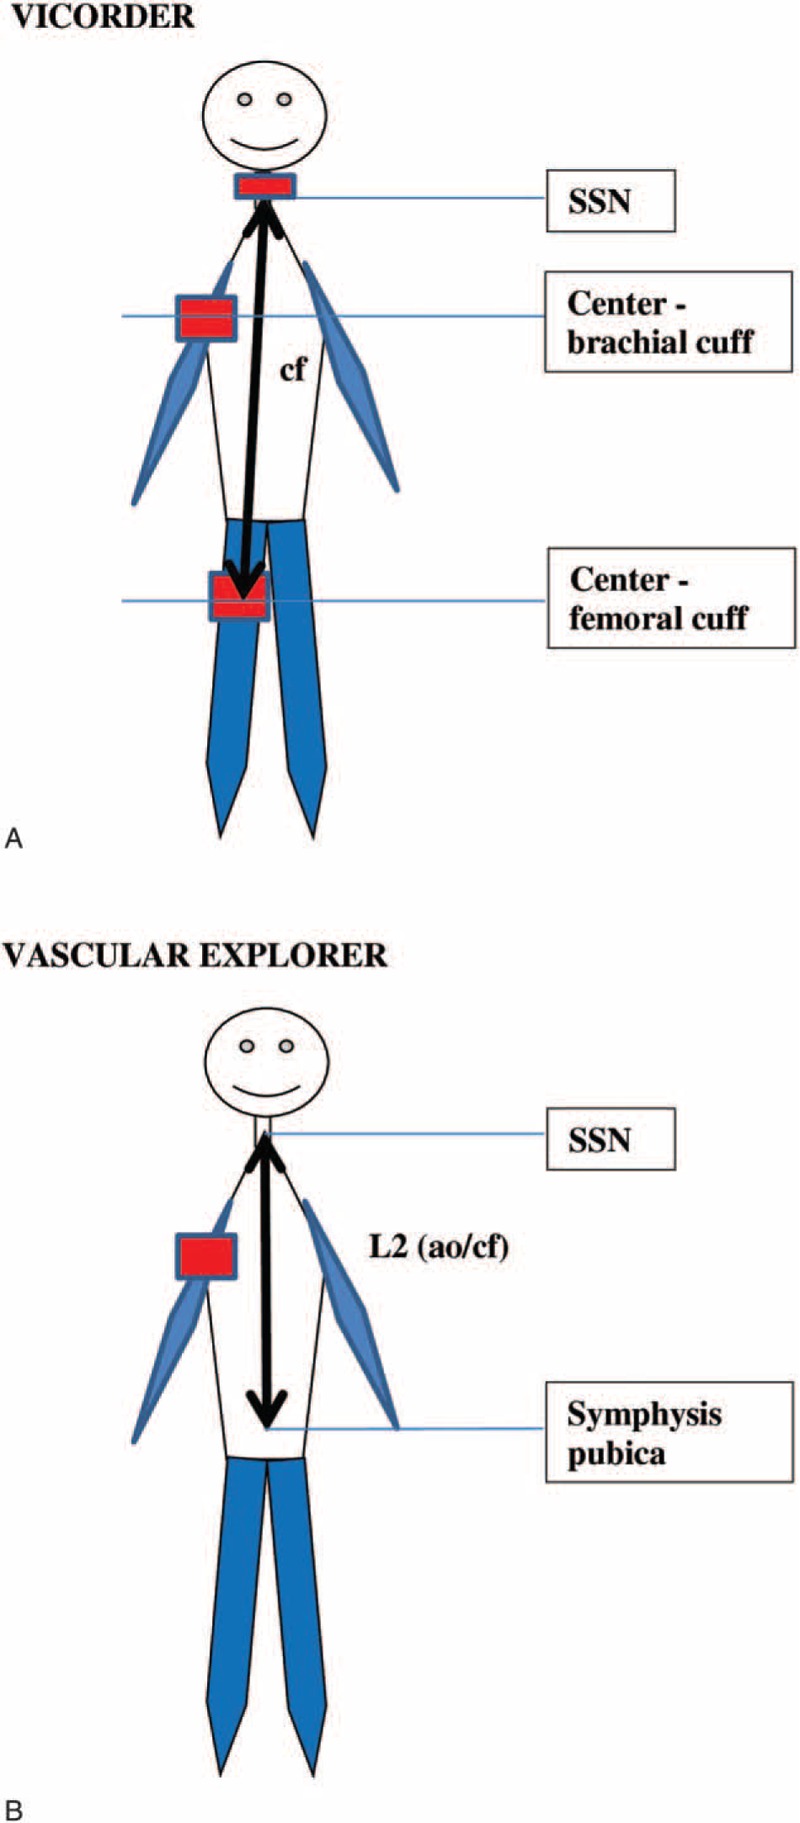
Differences in assessment of travel distance for (A) cfPWV in Vicorder, and (B) cf/aoPWV in Vascular explorer. cf/aoPWV = carotid-femoral/aortic pulse wave velocity, , cfPWV = carotid-femoral pulse wave velocity, SSN = suprasternal notch.
Statistical Analysis
Descriptive statistics are based on averaged measurement triplicates. Paired t test was used to compare first and second measurement series of each device. PWV and AI measurements were further analyzed in order to address the following questions:
Within- and between-device relationship between PWV and AI determined by VE and VI, respectively. This analysis is based on the measurements averaged over the first measurement triplicate of each device.
Agreement of right-sided with left-sided PWV and AI results of VE.
Reliability of repeated measurements that is within-set agreement of PWV- and AI-triplicates (VE and VI).
Inter-observer reliability of averaged PWV and AI measurements (VE and VI, averages were calculated over the 3 measurement replicates) based on groups 1 to 4 of our study (see Table 1).
Intra-observer reliability of averaged PWV and AI measurements (VE and VI) based on groups 5 to 8 of our study (see Table 1).
Agreement of measurements was evaluated using concordance correlation coefficients (CCC).14 CCC values range between −1 and 1 were the latter means perfect agreement. This is achieved if and only if the mean difference between the samples is zero (i.e., no systematic bias), the correlation is 1 and the variances are the same. Similarly, the overall concordance correlation coefficient (OCCC) measures the agreement of more than 2 groups. After Fisher transformation, we calculated Jack–Knife standard errors to establish confidence limits of concordance coefficients.15
Analogously, we established formal statistical tests of the differences of 2 CCC based on the same samples by estimating Jack–Knife standard errors of the difference of 2 CCCs.
Type 1 error is controlled at 5% throughout, that is, no corrections for multiple testing were performed. All analyses were implemented and performed using the statistical software package R 2.13.1 (www.r-project.org).
RESULTS
Study sample comprises of 23 males and 33 females of median age = 69.5 years (interquartile range [IQR] = 65.0–72.0 years) and median body mass index = 27.4 kg/m2 (IQR = 25.4–30.7 kg/m2).
In 26 subjects, an elevated systolic brachial blood pressure ≥140/90 mm Hg was observed based on oscillometric measurements prior to pulse wave analysis averaged over the 3 measurements. Sex-specific distributions of basic sample characteristics are presented in Table 3. Descriptive statistics of all parameters considered for VE and VI are presented in Supplementary Table 2.
TABLE 3.
Basic Characteristics of the Study Sample

Relationship Between Multimodal Determinants of Arterial Stiffness
Within-Device Associations Between Arterial Stiffness Parameters
Considering distinct PWV measurement modalities assessed by the same device, we found moderate correlation between both PWV modes in VI (cfPWV–baPWV: r = 0.691, P < 0.001; OCCC = 0.253, mean difference = 2.95 m/s; Figure 4). Furthermore, AI (VI) displayed no relationship with PWV and peripheral blood pressures, respectively (Figure 4; Supplementary Table 2).
FIGURE 4.
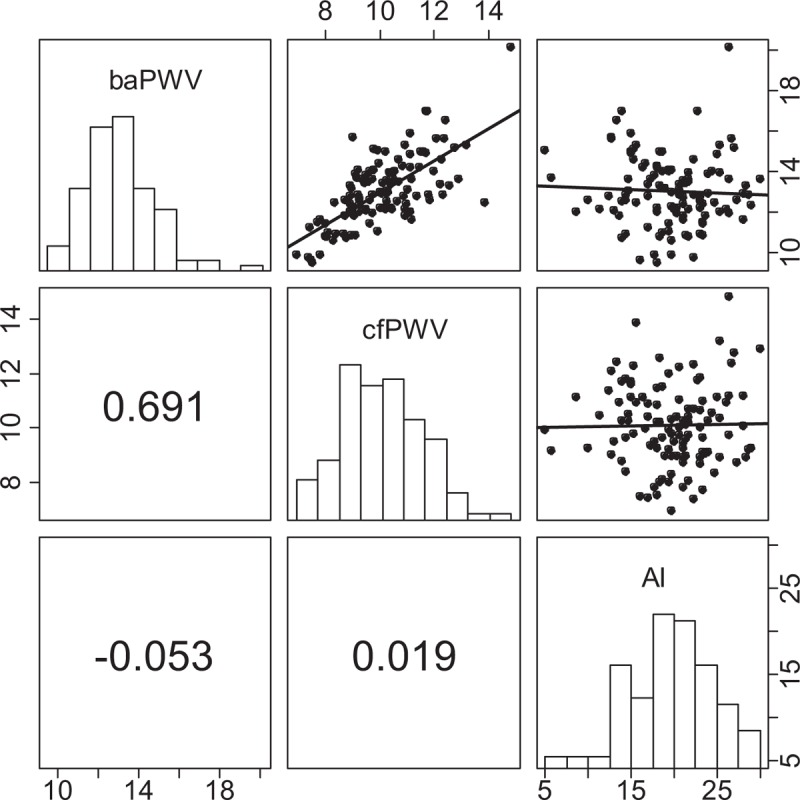
Within-device correlation between baPWV (scale “10, 14, 18”), cfPWV (scale “8, 10, 12, 14”), and AI (scale “5, 15, 25”) assessed by Vicorder. We present Pearson correlation coefficients. ∗P < 0.05, ∗∗P < 0.001. AI = augmentation index, baPWV = brachial-ankle pulse wave velocity, cfPWV = carotid-femoral pulse wave velocity.
In VE, cf/aoPWV(VE) exhibited no significant correlation with ipsilateral baPWV(VE) (r = 0.166; P = 0.08, Figure 5). In contrast to VI, cf/aoPWV(VE), but not baPWV(VE), showed strong positive correlation with AI, more pronounced in right-sided ipsilateral comparisons (r = 0.725; P < 0.001 for cfPWV(VE)R, Figure 5). In both devices, baPWV and cfPWV showed weak-to-moderate correlation with brachial and bilateral ankle pressures. AI(VE), but not AI(VI), correlated weakly with peripheral pressures. No correlations with ABI values were found (Supplementary Tables 3–5).
FIGURE 5.
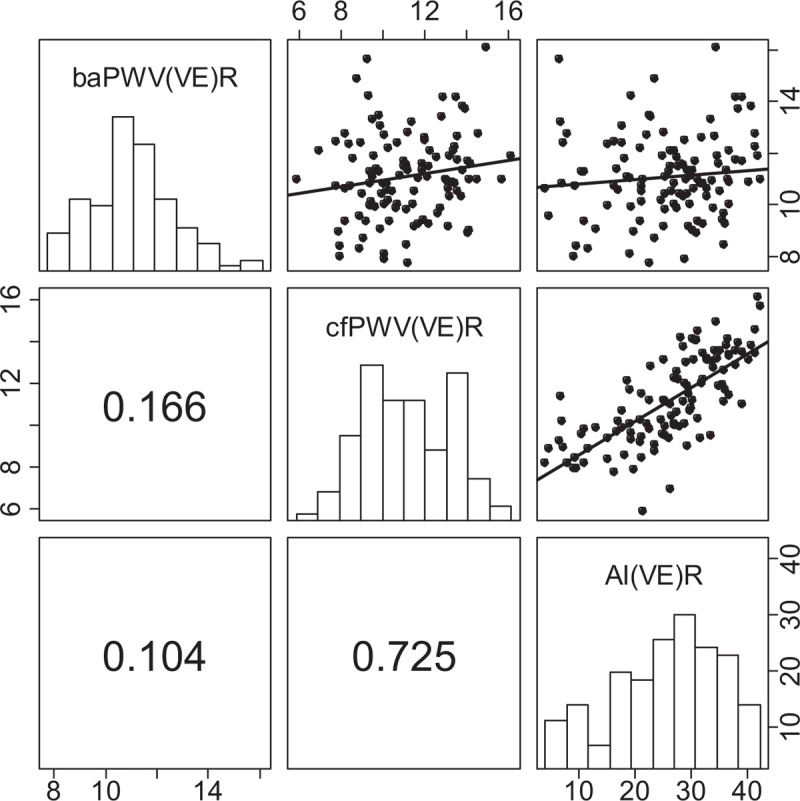
Within-device correlation between right-sided baPWV (scale “8, 10, 14”), cfPWV (scale “6, 8, 12, 16”), and AI (scale “10, 20, 30, 40”) assessed by Vascular explorer. Results for left side are presented in the supplement. We present Pearson correlation coefficients. ∗P < 0.05, ∗∗P < 0.001. AI = augmentation index, baPWV = brachial-ankle pulse wave velocity, cfPWV = carotid-femoral pulse wave velocity, VE = Vascular explorer.
Analyzing the relationship between aortic AI and brachial AI that is derived from brachial pulse wave analysis, strong correlation in VI was observed (r = 0.768, P < 0.001). Analogous analysis in VE revealed perfect linear relationship between central and brachial AI (r = 1.000, P < 0.001; Supplementary Tables 3–5).
In VE, the agreement between right-sided and left-sided mean values from the first measurement triplicate was evaluated (Table 4). In general, the side agreement of the measurements was good-to-moderate, giving the best results for AI_75(VE) values and the lowest concordance for cf/aoPWV(VE). A significant side-related bias of mean ao/cfPWV(VE) was observed giving higher values measured on the right side (mean difference cfPWV[VE] = 0.732 m/s, P = 4.51 × 10⁻⁶; Table 4).
TABLE 4.
Concordance of Right- vs Left-Sided Measurements in Vascular Explorer

Between-Device Relationship of Arterial Stiffness Indices
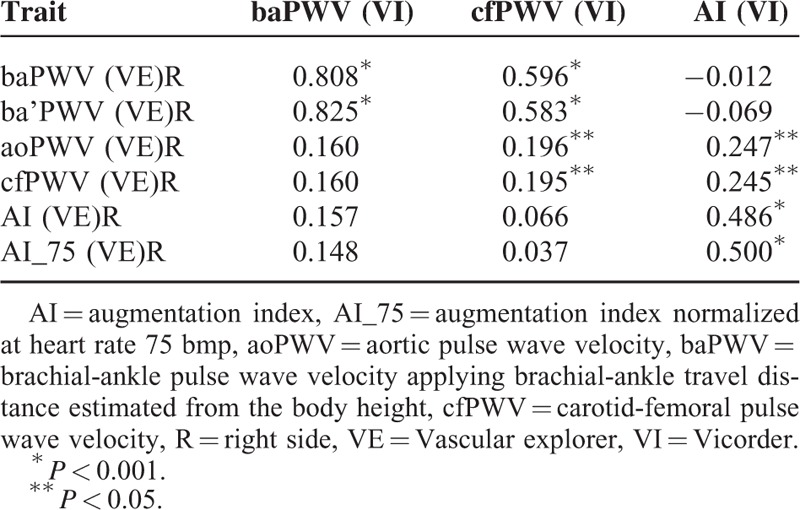
Analyzing the differences between both tested devices, baPWV(VE) was in strong-to-moderate association with both PWV modes determined by VI (baPWV[VI]–baPWV[VE]R: r = 0.808; OCCC = 0.484, mean difference = 1.94 m/s; cfPWV[VI]–baPWV[VE]R: r = 0.596; OCCC = 0.493, mean difference = 1.0 m/s; P < 0.001 for both comparisons; Table 5). As anticipated, this relationship was slightly more pronounced for ipsilateral (right-sided) comparisons (to compare the left-sided analysis, see Supplementary Table 6). In contrast, cf/aoPWV(VE) displayed a weak correlation with cfPWV(VI) (r = 0.196, P = 0.04). Considering the between-device relationship of AI, a weak-to-moderate correlation between AI(VI) and AI(VE) was found (right-sided: r = 0.486; P < 0.001; Table 5). Moreover, AI(VI) exhibited a weak association with cf/aoPWV(VE) (right-sided: r = 0.297; P = 0.01). The same analysis was performed using pulse wave travel times and RT, respectively, thereby eliminating the differences in travel distances. Using this approach, similar results were found showing strong correlation between baPTT(VI) and baPTT(VE) (r = 0.880; P < 0.001) and weak correlation between cfPTT(VI) and RT(VE) (right-sided: r = 0.323; P < 0.001; OCCC = 0.264, mean difference = 7.14 ms).
TABLE 5.
Between Device Pearson Correlation Matrix Comparing PWV and AI Determined by VI vs (VE)R
To evaluate interchangeability, we finally assessed the between-device agreement of equivalent parameters revealing strong concordance between bilateral baPTT(VE) and baPTT(VI) (right side: OCCC = 0.870, mean difference = 0.339 ms; left side: 0.828, mean difference = 1.28 ms). Analyzing device equivalents for baPWV, the concordance was higher when ba’PWV(VE) that implements body height-derived pulse wave travel distances was considered (right side: OCCC = 0.757, mean difference = 0.695 m/s; left side: OCCC = 0.645, mean difference = 0.862 m/s). AI(VI) exhibited marginal concordance with AI(VE) (right side: OCCC = 0.298, mean difference = 6.12%; left side: OCCC = 0.324, mean difference = 5.32%).
Reliability
Concordance of Within-Subset Repeated Measurements
Analysis considering the first measurement triplicates revealed good-to-excellent concordances of repeated measurements in both devices (VI: OCCC range 0.728 [0.534–0.850] for AI(VI) to 0.952 [0.919–0.972] for baPWV (VI); VE: OCCC range 0.802 [0.639–0.896] for cf/aoPWV(VE)R to 0.929 [0.867–0.962] for AI_75(VE)R, see Supplementary Table 7). Pair-wise concordances did not differ significantly between first and second, first and third, or second and third measurements. The normalization of AI(VE) values for heart beat revealed no relevant change in concordance.
Inter- and Intra-Observer Concordance
Series 1–4 were designed to estimate the inter-observer concordance of the automated devices. Both methods showed good inter-observer agreement, and no significant between-observer bias, except for right-sided cf/aoPWV(VE)R (bias = 0.542; P = 0.010 for cfPWV(VE)R; bias = 0.363; P = 0.010 for aoPWV(VE)R, respectively; Supplementary Table 8).
Considering series number 5–8, VI and VE showed good agreement of first and second measurements performed by the same observer. The strongest concordance was shown for baPWV(VI) (OCCC 95% CI: 0.900; 0.808–0.949), the lowest for AI(VI) (OCCC 95% CI: 0.613; 0.307–0.804; Supplementary Table 9), both determined by VI. In VE, the left-sided measurements of cf/aoPWV(VE)L exhibited slightly lower concordance then the right-sided values (Supplementary Table 9).
DISCUSSION
In the present study, we evaluated the multimodal assessment of arterial stiffness by comparing an established oscillometric device VI with VE that implements both diastolic, 2-point oscillometry for baPWV measurement, and SSBO for the determination of cf/aoPWV and AI. To our best knowledge, this is the first comprehensive report on fundamental differences between distinct anatomical and computational oscillometric approaches analyzed in within-device and between-device manner.
Carotid-Femoral, Aortic PWV, and AI
Guideline-determined cfPWV values >10 m/s associate with higher cardiovascular risk.16 Two-point cfPWV assessed by VI showed good reliability and correlation with alternative baPWV. Contrary, the ipsilateral and contralateral reproducibility of cfPWV recordings in VE was lower and cfPWV(VE) displayed no relevant association with other PWV modes. Furthermore, unlike the PWV assessed by 2-point recordings, cfPWV(VE) showed significant relationship with AI. These results suggest that SSBO-based assessment of central PWV has weak or no relationship with the traditional 2-point oscillometry.
For the assessment of cf/aoPWV(VE) an SSBO was used implementing the decomposition and analysis of the aortic pulse wave derived from oscillation recorded upon brachial artery occlusion. Relationship observed between SSBO-derived cfPWV(VE) and AI (VE) can be explained by the fact that both parameters are calculated using correlated indices, that is, amplitude difference between forward and reflection wave (AI), and the velocity of wave reflection, expressed as RT (cfPWV).17 Aortic PWV acquired using SSBO was analysed in 1 study on 20 patients with cardiovascular disease and 24 controls, revealing moderate correlation with SphygmoCor, and Arteriograph.18 Horváth et al validated SSBO against gold standard invasive measurements and showed an acceptable agreement. However, the conclusions drawn from this study are limited by its small sample size.19 Additionally, several authors report on lack of validity of the SSBO working principle and discuss the possibility that SSBO predominantly assess brachial stiffness inter-correlating with central stiffness.20,21 The strong correlation observed in the present study between brachial AI(VE), central AI(VE), and cf/aoPWV(VE) further underpins this hypothesis.
In contrast to the PWV, neither aoPP nor aoAUG necessary for AI computation exhibit direct relationship to central arterial stiffness. Moreover, AI is influenced by additional factors, including sex, body weight, height, heart rate, and medication modulating peripheral resistance.22 In a recent invasive study, Sakurai et al23 demonstrated that PWV measured in aorta lacks association with AI and both indices cannot be used interchangeably. These findings are in line with our results showing no association between PWV and AI when diastolic, 2-point PWV modes are considered. Finally, substantially different pressure levels applied during the pulse wave recordings for AI determination in VI, and VE might explain the observed weak association between AI(VI) and AI(VE).
Brachial-Ankle PWV
The measurement of baPWV emerged recently for estimation of vascular stiffness and is considered more feasible promising better patient compliance. Similarly to ABI, 2-point measurement is necessary at the ankle and brachial side for this modality. In the present study, baPWV was assessed applying analogous techniques in both VI and VE. In agreement with previous studies, we observed a systematic shift of baPWV values being about 20% higher than cfPWV(VI).24,25 Furthermore, we found a good-to-excellent within- and between-device agreement of baPWV. Considering high concordance of baPTT values, both devices can be used interchangeably for baPWV assessment upon equalizing the measurements of pulse wave travel distance.
Sugawara et al26 demonstrated a substantial role of baPWV for the prediction of central vascular stiffness; however, this relation might be blurred by the (considerable) contribution of the peripheral arterial stiffness owing to the anatomical localization of the baPWV recording sites, particularly in case of suspected peripheral artery disease. Brachial-ankle PWV displayed no relevant association with AI or ABI that are both influenced by peripheral arterial stiffness. However, a significant correlation of baPWV with brachial and ankle pressures was observed. The independent association between arterial stiffness and peripheral blood pressure is well documented 27 and the significant left–right difference in ankle pressures was recently found to associate with unequal arterial stiffness expressed by baPWV.28 Additionally, both inter-arm and inter-ankle systolic pressure difference was shown to predict cardiovascular morbidity and mortality.29,30 Considering the significant side-related bias of stiffness indices found in VE, our results favor the bilateral assessment of baPWV.
Several limitations of our study are worthy of note. First, we analyzed a sample of voluntary subjects of older age with a substantial portion of patients with hypertension. However, this enabled us to study the determinants of arterial stiffness at a broader range of blood pressure values. Second, VI was used as standard noninvasive device in the present study, although lacking the validation against invasively assessed arterial stiffness. Besides this limitation, we believe that VI is the most convenient alternative, since the measurement principle of this device is based on oscillometry in standard 2-point recording modus which is comparable to that of VE. Several studies showed that comparisons between devices with distinct core working principles reveal considerable discrepancies further limiting their comparability.31
In conclusion, PWV and AI assessed by diastolic pulse oscillometry are both in VE and VI convenient and reliable for routine assessment of arterial stiffness. The determination of baPWV represents feasible alternative to the traditional 2-point cfPWV, meriting further evaluation in prospective population cohorts. Aortic PWA determined by SSBO displayed no relevant relationship to the corresponding diastolic oscillometry-derived parameters.
Supplementary Material
Acknowledgments
We thank Ms Bauch and Ms Langheinrich for their technical assistance. We express our appreciation to all participants of the study and thank very much for their patience. We acknowledge support from the German Research Foundation (DFG) and Universität Leipzig within the program of Open Access Publishing.
Footnotes
Abbreviations: AI = augmentation index, AI_75 = augmentation index normalized at heart rate 75 bmp, ao = aortic, AUG = augmentation pressure, ba distance (VE) = distance (L3–L1), ba distance (VI) = distance “center brachial cuff–center ankle cuff”, ba = brachial-ankle, ba’ distance (VE) = distance (La–Lb), br = brachial, cf distance (VE) = distance (2 × L2), cf distance (VI) = distance “SSN–center of femoral cuff”, cf = carotid-femoral, L = left-sided, L1 (VE) = distance “SSN–center brachial cuff”, L2 (VE) = distance “SSN–symphysis”, L3 (VE) = distance “SSN–center ankle cuff”, La = body height-estimated L3, Lb = body height-estimated L1, PP = pulse pressure, PTT = pulse transit time, PWV = pulse wave velocity, R = right-sided, RT = return time, SBP = systolic blood pressure, SSBO = suprasystolic brachial oscillometry, SSN = suprasternal notch, VE = Vascular explorer, VI = Vicorder
AT performed the study and wrote the manuscript; FB designed the study and contributed to paper writing; KW performed the study; ML contributed to discussion; MS designed the study, analyzed the data, and revised the manuscript.
The study was funded by the Leipzig Research Center for Civilization Diseases (LIFE). LIFE is funded by means of the European Union, by the European Regional Development Fund, the European Social Fund, and by means of the Free State of Saxony within the framework of the excellence initiative.
The authors have no conflicts of interest to disclose.
REFERENCES
- 1.O’Rourke MF, Hashimoto J. Mechanic factors of arterial aging: a clinical perspective. J Am Coll Cardiol 2007; 50:1–13. [DOI] [PubMed] [Google Scholar]
- 2.Vlachopoulos C, Aznaouridis K, Stefanadis C. Prediction of cardiovascular events and all-cause mortality with arterial stiffness: a systematic review and meta-analysis. J Am Coll Cardiol 2010; 55:1318–1327. [DOI] [PubMed] [Google Scholar]
- 3.ESH/ESC Task Force for the Management of Arterial Hypertension. 2013 Practice guidelines for the management of arterial hypertension of the European Society of Hypertension (ESH) and the European Society of Cardiology (ESC): ESH/ESC Task Force for the Management of Arterial Hypertension. J Hypertens 2013; 31:1925–1938. [DOI] [PubMed] [Google Scholar]
- 4.Tomlinson LA. Methods for assessing arterial stiffness: technical considerations. Curr Opin Nephrol Hypertens 2012; 21:655–660. [DOI] [PubMed] [Google Scholar]
- 5.Hickson SS, Butlin M, Broad J, et al. Validity and repeatability of the Vicorder apparatus: a comparison with the SphygmoCor device. Hypertens Res 2009; 32:1079–1085. [DOI] [PubMed] [Google Scholar]
- 6.Baulmann J, Schillings U, Rickert S, et al. A new oscillometric method for assessment of arterial stiffness: comparison with tonometric and piezo-electronic methods. J Hypertens 2008; 26:523–528. [DOI] [PubMed] [Google Scholar]
- 7.Müller J, Oberhoffer R, Barta C, et al. Oscillometric carotid to femoral pulse wave velocity estimated with the Vicorder device. J Clin Hypertens (Greenwich) 2013; 15:176–179. [DOI] [PMC free article] [PubMed] [Google Scholar]
- 8.Munakata M, Konno S, Miura Y, et al. Prognostic significance of the brachial-ankle pulse wave velocity in patients with essential hypertension: final results of the J-TOPP study. Hypertens Res 2012; 35:839–842. [DOI] [PubMed] [Google Scholar]
- 9.Ninomiya T, Kojima I, Doi Y, et al. Brachial-ankle pulse wave velocity predicts the development of cardiovascular disease in a general Japanese population: the Hisayama Study. J Hypertens 2013; 31:477–483. [DOI] [PubMed] [Google Scholar]
- 10.Takashima N, Turin TC, Matsui K, et al. The relationship of brachial-ankle pulse wave velocity to future cardiovascular disease events in the general Japanese population: the Takashima Study. J Hum Hypertens 2013; doi:10.1038/jhh.2013.103 [Epub ahead of print]. [DOI] [PubMed] [Google Scholar]
- 11.Loeffler M, Engel C, Ahnert P, et al. The LIFE-Adult-Study: objectives and design of a population-based cohort study with 10,000 deeply phenotyped adults in Germany. BMC Public Health 2015; 15:691. [DOI] [PMC free article] [PubMed] [Google Scholar]
- 12.Beutner F, Teren A, Gielen S, et al. Automated photoplethysmography-based determination of ankle-brachial index: a validation study against Doppler sonography. Clin Res Cardiol 2012; 101:875–883. [DOI] [PubMed] [Google Scholar]
- 13.Teren A, Beutner F, Wirkner K, et al. Validity, intra- and inter-observer reliability of automated devices for the assessment of ankle brachial index using photo-plethysmography. BMC Cardiovasc Disord 2013; 13:81. [DOI] [PMC free article] [PubMed] [Google Scholar]
- 14.Barnhart HX, Haber M, Song J. Overall concordance correlation coefficient for evaluating agreement among multiple observers. Biometrics 2002; 58:1020–1027. [DOI] [PubMed] [Google Scholar]
- 15.Efron B. Nonparametric estimates of standard error: the jackknife, the bootstrap and other methods. Biometrika 1981; 68:589–599. [Google Scholar]
- 16.Van Bortel LM, Laurent S, Boutouyrie P, et al. Expert consensus document on the measurement of aortic stiffness in daily practice using carotid-femoral pulse wave velocity. J Hypertens 2012; 30:445–448. [DOI] [PubMed] [Google Scholar]
- 17.Kelly R, Hayward C, Avolio A, et al. Noninvasive determination of age-related changes in the human arterial pulse. Circulation 1989; 80:1652–1659. [DOI] [PubMed] [Google Scholar]
- 18.Nürnberger J, Michalski R, Türk TR, et al. Can arterial stiffness parameters be measured in the sitting position? Hypertens Res 2011; 34:202–208. [DOI] [PubMed] [Google Scholar]
- 19.Horváth IG, Németh A, Lenkey Z, et al. Invasive validation of a new oscillometric device (Arteriograph) for measuring augmentation index, central blood pressure and aortic pulse wave velocity. J Hypertens 2010; 28:2068–2075. [DOI] [PubMed] [Google Scholar]
- 20.Trachet B, Reymond P, Kips J, et al. Numerical validation of a new method to assess aortic pulse wave velocity from a single recording of a brachial artery waveform with an occluding cuff. Ann Biomed Eng 2010; 38:876–888. [DOI] [PubMed] [Google Scholar]
- 21.Parati G, De Buyzere M. Evaluating aortic stiffness through an arm cuff oscillometric device: is validation against invasive measurements enough? J Hypertens 2010; 28:2003–2006. [DOI] [PubMed] [Google Scholar]
- 22.McEniery CM, Yasmin, Hall IR, et al. Normal vascular aging: differential effects on wave reflection and aortic pulse wave velocity: the Anglo-Cardiff Collaborative Trial (ACCT). J Am Coll Cardiol 2005; 46:1753–1760. [DOI] [PubMed] [Google Scholar]
- 23.Sakurai M, Yamakado T, Kurachi H, et al. The relationship between aortic augmentation index and pulse wave velocity: an invasive study. J Hypertens 2007; 25:391–397. [DOI] [PubMed] [Google Scholar]
- 24.Tanaka H, Munakata M, Kawano Y, et al. Comparison between carotid-femoral and brachial-ankle pulse wave velocity as measures of arterial stiffness. J Hypertens 2009; 27:2022–2027. [DOI] [PubMed] [Google Scholar]
- 25.Sugawara J, Hayashi K, Tanaka H. Arterial path length estimation on brachial-ankle pulse wave velocity: validity of height-based formulas. J Hypertens 2014; 32:881–889. [DOI] [PubMed] [Google Scholar]
- 26.Sugawara J, Hayashi K, Yokoi T, et al. Brachial-ankle pulse wave velocity: an index of central arterial stiffness? J Hum Hypertens 2005; 19:401–406. [DOI] [PubMed] [Google Scholar]
- 27.Zheng M, Xu X, Wang X, et al. Age, arterial stiffness, and components of blood pressure in Chinese adults. Medicine (Baltimore) 2014; 93:e262. [DOI] [PMC free article] [PubMed] [Google Scholar]
- 28.Su HM, Lin TH, Hsu PC, et al. Association of bilateral brachial-ankle pulse wave velocity difference with peripheral vascular disease and left ventricular mass index. PLoS ONE 2014; 9:e88331. [DOI] [PMC free article] [PubMed] [Google Scholar]
- 29.Chen SC, Chang JM, Tsai YC, et al. Association of interleg BP difference with overall and cardiovascular mortality in hemodialysis. Clin J Am Soc Nephrol 2012; 7:1646–1653. [DOI] [PMC free article] [PubMed] [Google Scholar]
- 30.Clark CE, Taylor RS, Shore AC, et al. Association of a difference in systolic blood pressure between arms with vascular disease and mortality: a systematic review and meta-analysis. Lancet 2012; 379:905–914. [DOI] [PubMed] [Google Scholar]
- 31.Davies JM, Bailey MA, Griffin KJ, et al. Pulse wave velocity and the non-invasive methods used to assess it: Complior, SphygmoCor, Arteriograph and Vicorder. Vascular 2012; 20:342–349. [DOI] [PubMed] [Google Scholar]
Associated Data
This section collects any data citations, data availability statements, or supplementary materials included in this article.


