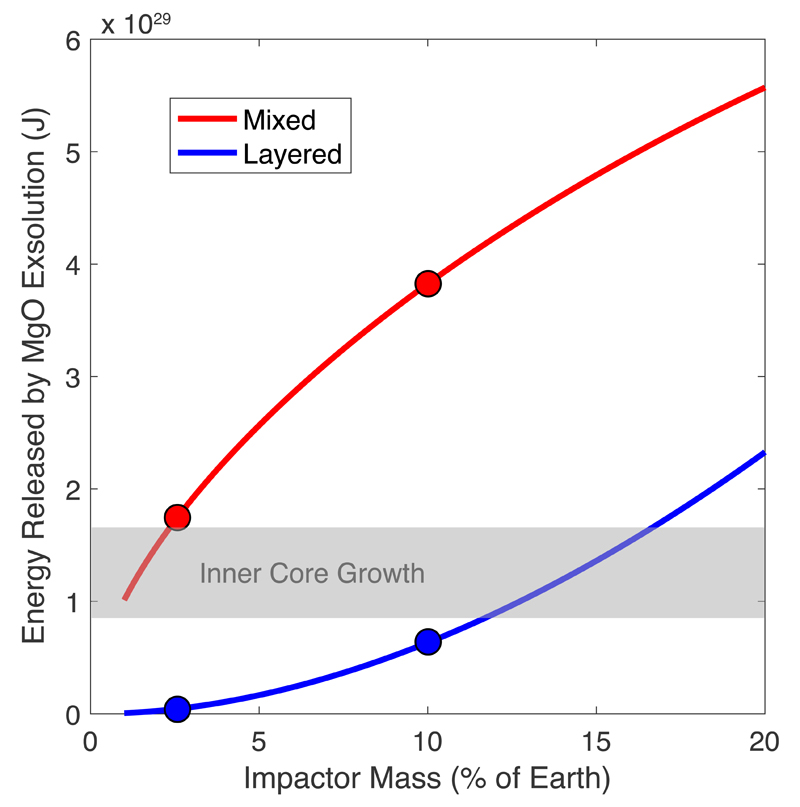
Figure 3. Gravitational energy released by the exsolution of buoyant lithophile components from the core after the giant impact.
Calculated following equation (3), the red curve corresponds to the energy released if the HIC fully mixes with Earth’s core. In that case, MgO exsolution occurs up to the current saturation limit (Fig. 1b). The blue curve corresponds to the energy released if the HIC forms a layer on top of Earth’s core. In that case, the layer is so rich in lithophile elements (Fig. 2a) that the exsolution of all dissolved mantle components (MgO and SiO2) takes place. The 10% Mars-size impact19 and 2.5% “fast-spinning” impact20 are highlighted by circles. The gray horizontal band corresponds to the energy release by inner core growth (gravitational + latent heat) since its inception, and is the main driver for the geodynamo today. The energies released by MgO exsolution are on the order of, if not significantly higher than, those released by inner core growth and show the effectiveness of lithophile element exsolution to drive an early dynamo. The average power of exsolution can be estimated assuming an exsolution time (Extended Data Fig. 9) or a temperature evolution model of the core (Extended Data Fig. 5).

