

Abstract
Metabolomic profiling studies aim to provide a comprehensive, quantitative and dynamic portrait of the endogenous metabolites in a biological system. While contemporary technologies permit routine profiling of many metabolites, intrinsically labile metabolites are often improperly measured or omitted from studies due to unwanted chemical transformations that occur during sample preparation or mass spectrometric analysis. The primary glycolytic metabolite 1,3-bisphosphoglyceric acid (1,3-BPG) typifies this class of metabolites, and, despite its central position in metabolism, has largely eluded analysis in profiling studies. Here we take advantage of the reactive acylphosphate group in 1,3-BPG to chemically trap the metabolite with hydroxylamine during metabolite isolation, enabling quantitative analysis by targeted LC-MS/MS. This approach is compatible with complex cellular metabolome, permits specific detection of the reactive (1,3-) instead of non-reactive (2,3-) BPG isomer, and has enabled direct analysis of dynamic 1,3-BPG levels resulting from perturbations to glucose processing. These studies confirmed that standard metabolomic methods misrepresent cellular 1,3-BPG levels in response to altered glucose metabolism and underscore the potential for chemical trapping to be used for other classes of reactive metabolites.
Graphical abstract

Modern metabolomic profiling experiments utilize both targeted and untargeted mass spectrometry platforms to detect and quantify metabolites in cells, tissues and whole organisms1–3. The combination of diverse chemical extraction, chromatographic separation, and mass spectrometry-based ionization formats allows for distinct subsets of the metabolome to be targeted for analysis in individual experiments. In particular, recent advances in high-resolution mass spectrometers permit the routine detection and quantification of hundreds of metabolites in a single experiment4–6. Despite advances in each of these areas, however, a subset of metabolites dispersed throughout the branches of metabolism are inherently labile, limiting the methods with which they can be measured, or, in some cases, completely omitting them from metabolomic profiling. Examples of labile moieties that limit metabolomic analysis include esters, thioesters, acylphosphates, disulfides, α,β-unsaturated carbonyls, epoxides, dicarbonyls, peroxides and others. While inconvenient to measure, metabolites containing these functionalities play critical roles in primary metabolism7, post-translational modification of proteins8–11, and intracellular second messenger signaling12–14. Thus, methods enabling the detection and quantification of these metabolites are necessary for basic and translational biological studies.
A prime example of an understudied, inherently labile metabolite is the primary glycolytic intermediate 1,3- bisphosphoglycerate (1,3-BPG), discovered nearly a century ago by Warburg and Christian15. This molecule is the product of catalysis by glyceraldehyde-3-phosphate dehydrogenase (GAPDH) on 3-phosphoglyceraldehyde (GAP). As a result of its acylphosphate group, 1,3-BPG is sensitive to spontaneous hydrolysis or isomerization to 3-phosphoglycerate (3PG) and 2,3-bisphosphoglycerate (2,3-BPG), respectively (Scheme 1). These chemical transformations are particularly problematic because 1,3-BPG is enzymatically converted to both 3PG and 2,3-BPG in the natural course of metabolism, thus complicating the analysis of this group of connected metabolites. For these reasons, metabolomic profiling studies either report on the combined levels of 1,3-BPG and 2,3-BPG isomers, or, in a majority of studies, omit them altogether. These complications epitomize the analysis of reactive metabolites throughout the metabolome.
Scheme 1.
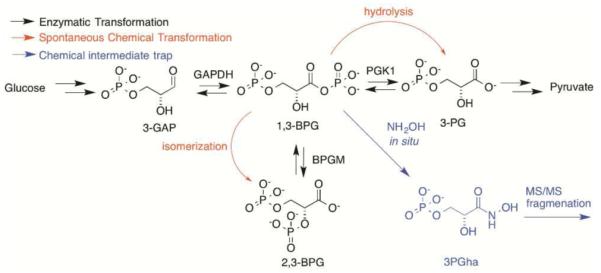
Chemical trapping of 1,3-BPG and competing reactions in central glucose metabolism.
In light of these limitations, we asked whether a potential solution to the transformation or complete loss of labile metabolites during sample preparation and analysis would be to capitalize on their reactivity and convert them to stable analogs in situ? Coupling this chemical trapping approach to high-resolution mass spectrometry analysis would enable metabolite detection and quantification, as well as separation of reactive and non-reactive isomers in the case of 1,3-BPG. Herein we demonstrate the application of this approach by chemical trapping of 1,3-BPG and targeted metabolomic analysis. This method was compatible with the complex matrix of the cellular metabolome and enabled specific detection of 1,3-BPG for the first time. Notably, perturbation of glucose metabolism in cells revealed that standard metabolomic methods misannotate the levels of 1,3-BPG, which results from an unexpected distribution of glucose-derived carbon into distinct metabolite pools under different cellular conditions.
To enable detection and quantification of 1,3-BPG, we sought a chemical trapping route that was: 1) specifically reactive with the 1,3- and not 2,3-BPG isomer; 2) compatible with the aqueous lysis and extraction conditions for polar metabolites; 3) resulted in a stable molecule distinct from other endogenous metabolites and 4) compatible with downstream mass spectrometric analysis. Among the possibilities we explored, hydroxylamine was attractive as a nucleophile that is known to react with electrophilic carbonyls16–17 under mild aqueous conditions. The reaction of 1,3-BPG with hydroxylamine would be expected to yield the stable hydroxamic acid (Scheme 1), which should be compatible with extraction and targeted mass spectrometry. The instability of 1,3-BPG precludes its production commercially, and there-fore we generated the metabolite enzymatically to determine whether hydroxylamine trapping was a viable strategy.
Incubation of human GAPDH with GAP and NAD+ co-factor resulted in the production of 1,3-BPG and NADH (Figure 1A and Suppl. Figure 1). Targeted LC-MS/MS analysis of extracted metabolites from the in vitro reaction revealed production of BPG (either or both 1,3- and 2,3-isomers) and 3-phosphoglycerate (3PG) (Figure 1A, B), verifying the non-enzymatic isomerization and hydrolysis of 1,3-BPG during sample preparation. Treatment of the in vitro reaction with hydroxylamine at pH 6.8 before standard extraction and analysis led to the formation of a molecule with a mass of 199.98 Da, consistent with the expected product 3-phosphoglyceroyl hydroxamic acid (3PGha; Suppl. Figure 2). Targeted fragmentation of this product yielded a strong signal at 79 Da in negative ion mode, which is consistently seen in phosphorylated metabolites upon neutral phosphate loss. This fragment co-eluted with the parent hydroxamic acid product and was formed in a dose-dependent manner with increasing hydroxylamine concentration (Figure 1C, D). Parallel analysis of other extracted metabolites showed that trapping with NH2OH led to near complete loss of the non-enzymatic hydrolysis product 3PG and a dose-dependent reduction in the total BPG signal detected (Figure 1A, B). In contrast, incubation of 2,3-BPG or 3PG alone with hydroxylamine under identical conditions resulted in no degradation of either metabolite as well as no formation 3PGha (Suppl. Figure 3A, B). These data supported the notion that chemical trapping of the labile product not only allows for quantification of 1,3-BPG, but that, as expected, significant chemical isomerization and hydrolysis of 1,3-BPG occurs during the metabolomic workflow. Finally, a synthetic 3PGha standard showed identical fragmentation and coelution by LC-MS/MS (Figure 1E), confirming the identity of trapped product of 1,3-BPG. We subsequently used the 199.98→79 transition for detection and quantification of 3PGha generated by chemical trapping of 1,3-BPG.
Figure 1.

Hydroxylamine trapping of 1,3-BPG in vitro. (A-B) Relative aggregate1,3-BPG/2,3-BPG levels (A) and 3PG levels (B) resulting from in vitro GAPDH enzyme reactions and subsequent standard metabolomic workup and LC- MS/MS analysis. (C) Concentration-dependent formation of 3PGha by NH2OH. (D) LC-MS/MS chromatograms of 3PGha formation measured with the 199.98→79 ion transition shown above. (E) Enzymatic (Enz) and synthetic (syn) 3PGha target ion chromatograms. Data shown represent mean ± S.E.M. from triplicate experiments. Statistical significance was determined by two-way t tests: **p< 0.01,***p< 0.005.
We next sought to determine whether this method would enable detection and quantitation of endogenous 1,3-BPG in the context of a complex cellular metabolome. IMR32 neuroblastoma cells were processed for standard polar metabolite extraction with cold 80% MeOH in water, and NH2OH trapping was incorporated into the workflow (Figure 2A). Inclusion of hydroxylamine into the extraction buffer, either before or after cell lysis by sonication, resulted in robust and roughly equivalent 3PGha formation (Figure 2B), with signal-to-noise ratios greater than 100. Having established the utility of this method to trap and detect endogenous 1,3-BPG we tested the effects of various perturbations on 1,3-, as well as aggregate, BPG levels in cancer cell lines. Treatment of IMR32 cells with NaF, which inhibits the activity of Enolases (e.g. ENO1), resulted in substantial accumulation of 2- and 3- phosphoglycerate, as well as other upstream glycolytic metabolites (Suppl. Figure 4A). Standard metabolomics analysis of BPG levels revealed an increase of approximately 1.8- fold with NaF treatment (Figure 2C). Chemical trapping and conversion to 3PGha, on the other hand, revealed changes in 1,3-BPG levels of approximately 4-fold (Figure 2D, E), indicating that total BPG levels are not representative of changes in labile 1,3-BPG concentrations.
Figure 2.

Chemical trapping of cellular 1,3-BPG in response to altered metabolic conditions. (A) Schematic representation of an in situ trapping workflow for unstable 1,3-BPG. (B) Comparison of 3PGha levels detected in IMR32 cells as a result of altered hydroxylamine trapping methods. (C & D) Extracted ion chromatograms of aggregate BPG (C) and 3PGha (D) in NaF treated IMR32 cells. (+/−) indicates with or without NH2OH trapping. (E) Relative changes in BPG and 3PGha levels in response to NaF treatment. (F & G) Extracted ion chromatograms of aggregate BPG (F) and 3PGha (G) IMR32 cells grown in 0, 10 or 25 mM glucose. (+/−) indicates with or without NH2OH trapping. (H) Relative changes in BPG and 3PGha levels in response to different glucose concentrations. Data shown represent mean ± S.E.M. from triplicate experiments. Statistical significance was determined by two-way t tests: **p< 0.01, ***p< 0.005.
To determine if the discrepancy between standard and chemical trapping measurements of 1,3-BPG was specific to downstream inhibition of glycolysis, we profiled cells exposed to several glucose availability conditions. IMR32 cells that were conditioned to grow in RPMI media containing 10 mM glucose were switched to media with 0, 10 or 25 mM glucose for 12 hrs, followed by quantitative metabolomics profiling. As expected, we observed dramatic changes in the levels of many metabolites between these nutrient conditions (Suppl. Figure 4B). BPG levels measured by standard methods were detectable even in glucose-starved cells and increased 1.2- and 1.7-fold in the 10 mM and 25 mM conditions, respectively (Figure 2F and Suppl. Figure 4B). In stark contrast, BPG- trapping revealed a dramatic 12-fold increase in 1,3-BPG levels between 0 mM and 10 mM glucose treated cells, and a 22-fold difference in 1,3-BPG levels between 0 mM and 25 mM treated cells (Figure 2G, H). These alterations were more inline with those observed for other glycolytic metabolites and established that standard analysis of BPG isomers does not accurately depict the relative changes in 1,3-BPG levels in cells.
We have developed a method to chemically trap and quantitatively profile an inherently labile, endogenous metabolite by targeted mass spectrometry. This metabolite, 1,3-BPG, is a ubiquitous, biologically-critical small molecule that has been shown to participate in numerous aspects of cell physiology, yet has largely remained unexplored for decades due to its reactive nature. In vitro production of 1,3-BPG was shown to result in substantial formation of non-enzymatic byproducts, 2,3-BPG and 3PG, which, while expected, have not been explicitly measured in this context previously. Chemical trapping of 1,3-BPG by hydroxylamine resulted in the formation of 3PGha, and also decreased the formation of these confounding byproducts. Therefore, we expect that this method could result in more accurate detection and quantitation of these metabolites in cellular samples as well. It is important to note, however, that parallel analysis of polar metabolites revealed that while many metabolites were unchanged with hydroxylamine treatment, the levels of a few were altered significantly. For example, hydroxylamine treatment resulted in significantly lower 3-phosphoglyceraldehyde levels, mirrored by the appearance of a compound with the expected mass and fragmentation of its oxime product (Suppl. Figure 5). This result cautions against parallel global analysis of polar metabolites and of 1,3-BPG using this method without specific validation surrounding the metabolites of interest. On the other hand, this observation indicates that this method may be useful to trap and detect other aldehyde or ketone containing metabolites, which often ionize inefficiently18.
Importantly, this method has enabled direct comparison of altered 1,3-BPG levels in response to various cellular perturbations for the first time. These experiments provided answers to two underlying questions posed in this study: 1) Are current metabolomic workflows suitable for the diverse chemical scaffolds found in metabolism? 2) Can specific chemical trapping methods provide more accurate depictions of cellular metabolism? We posit that the data presented here provides strong evidence against the former and in favor of the latter for 1,3-BPG, and likely other reactive metabolites. The significant differences observed here between chemical trapping and standard methods indicate that future studies of 1,3-BPG should employ this method or proceed with caution. Additionally, we believe that similar methods to trap inherently labile metabolites would improve the scope and accuracy of metabolomic studies in diverse branches of metabolism.
Supplementary Material
ACKNOWLEDGMENT
We thank C. Qin for assistance with instrumentation and software. We are grateful for financial support from the Kwanjeong Educational Foundation (fellowship to G.L.); NIH MSTP Training Grant T32GM007281 (fellowship to J.S.C.); NCI R00CA175399 (R.E.M.); the Damon Runyon Cancer Research Foundation (DFS-08-14 to R.E.M.) and the University of Chicago.
Footnotes
Supporting Information
The Supporting Information is available free of charge on the ACS Publications website.
Experimental details, supplementary figures and table (PDF)
Author Contributions
J.W.C. and R.E.M. conceived of the study and designed experiments. J.W.C., G.L. and J.S.C. performed experiments. J.W.C., G.L., J.S.C. and R.E.M. analyzed and interpreted data. J.W.C. and R.E.M. wrote the manuscript. All authors have given approval to the final version of the manuscript.
Notes
The authors declare no competing financial interest.
REFERENCES
- 1.Johnson CH, Ivanisevic J, Siuzdak G. Nat Rev Mol Cell Biol. 2016 doi: 10.1038/nrm.2016.25. in press. [DOI] [PMC free article] [PubMed] [Google Scholar]
- 2.Zamboni N, Saghatelian A, Patti GJ. Mol Cell. 2015;58:699–706. doi: 10.1016/j.molcel.2015.04.021. [DOI] [PMC free article] [PubMed] [Google Scholar]
- 3.Theodoridis GA, Gika HG, Want EJ, Wilson ID. Anal Chim Acta. 2012;711:7–16. doi: 10.1016/j.aca.2011.09.042. [DOI] [PubMed] [Google Scholar]
- 4.Yost RA, Enke CG. Anal. Chem. 1979;51:1251–1264. doi: 10.1021/ac50048a002. [DOI] [PubMed] [Google Scholar]
- 5.Johnson JV, Yost RA, Kelley PE, Bradford DC. Anal. Chem. 1990;62:2162–2172. [Google Scholar]
- 6.Kanu AB, Dwivedi P, Tam M, Matz L, Hill HH., Jr J. Mass Spectrom. 2008;43:1–22. doi: 10.1002/jms.1383. [DOI] [PubMed] [Google Scholar]
- 7.Bar-Even A, Flamholz A, Noor E, Milo R. Nat. Chem. Biol. 2012;17:509–517. doi: 10.1038/nchembio.971. [DOI] [PubMed] [Google Scholar]
- 8.oellering RE, Cravatt BF. Science. 2013;341:549–553. doi: 10.1126/science.1238327. [DOI] [PMC free article] [PubMed] [Google Scholar]
- 9.Zhang Z, Tan M, Xie Z, Dai L, Chen Y, Zhao Y. Nat Chem Biol. 2011;7:58–63. doi: 10.1038/nchembio.495. [DOI] [PMC free article] [PubMed] [Google Scholar]
- 10.Wang T, Kartika R, Spiegel DA. J. Am. Chem. Soc. 2012;134:8958–8967. doi: 10.1021/ja301994d. [DOI] [PMC free article] [PubMed] [Google Scholar]
- 11.Codreanu SG, Zhang B, Sobecki SM, Billheimer DD, Lieber DC. Mol Cell Proteomics. 2009;8:670–680. doi: 10.1074/mcp.M800070-MCP200. [DOI] [PMC free article] [PubMed] [Google Scholar]
- 12.Simmons DL, Botting RM, Hla T. Pharmacol Rev. 2004;56:387–437. doi: 10.1124/pr.56.3.3. [DOI] [PubMed] [Google Scholar]
- 13.Emanuela R, Garret AF. Arterioscler Thromb Vasc Biol. 2011;31:986–1000. doi: 10.1161/ATVBAHA.110.207449. [DOI] [PMC free article] [PubMed] [Google Scholar]
- 14.Barry H. Am J Med. 1991;91:14–22. [Google Scholar]
- 15.Warburg O, Christian W. Biochem. Z. 1939;303:40–68. [Google Scholar]
- 16.Lipmann F, Tuttle LC. J Biol Chem. 1945;161:415. [PubMed] [Google Scholar]
- 17.Fenton SS, Fahey RC. Anal Chem. 1986;154:34–42. doi: 10.1016/0003-2697(86)90492-6. [DOI] [PubMed] [Google Scholar]
- 18.Rabbani N, Thornalley PJ. Nat Protoc. 2014;9:1969–1979. doi: 10.1038/nprot.2014.129. [DOI] [PubMed] [Google Scholar]
Associated Data
This section collects any data citations, data availability statements, or supplementary materials included in this article.