Abstract
Purpose
To describe the association between morphologic features on fundus photography (FP), fluores-cein angiography (FA), and optical coherence tomography (OCT) and visual acuity (VA) in the second year of the Comparison of Age-related Macular Degeneration Treatments Trials (CATT).
Design
Prospective cohort study within a randomized clinical trial.
Participants
Participants in the CATT.
Methods
Study eye eligibility required angiographic and OCT evidence of choroidal neovascularization (CNV) secondary to age-related macular degeneration (AMD) and VA between 20/25 and 20/320. Treatment was assigned randomly to ranibizumab or bevacizumab with 3 different dosing regimens over a 2-year period.
Main Outcome Measures
Fluid type, location, and thickness; retina and subretinal tissue complex thickness on OCT; size and lesion composition on FP and FA; and VA.
Results
Among 1185 CATT participants, 993 (84%) had fluid on OCT at baseline and completed 2 years of follow-up. At 2 years, intraretinal fluid (IRF), subretinal fluid (SRF), sub–retinal pigment epithelium (RPE) fluid, and subretinal tissue complex thickness decreased in all treatment groups. Ranibizumab monthly was best able to resolve each type of fluid. Eyes with SRF in the foveal center on OCT had better mean VA than eyes with no SRF (72.8 vs. 66.6 letters; P = 0.006). Eyes with IRF in the foveal center had worse mean VA than eyes without IRF (59.9 vs. 70.9 letters; P < 0.0001). Eyes with retinal thickness <120 µm had worse VA compared with eyes with retinal thickness 120 to 212 and >212 µm (59.4 vs. 71.3 vs. 70.3 letters; P < 0.0001). At 2 years, the mean VA (letters) of eyes varied substantially by the type of subfoveal pathology on FP and FA: 70.6 for no pathology; 74.1 for fluid only; 73.3 for CNV or pigment epithelial (RPE) detachment; 68.4 for nongeographic atrophy; and 62.9 for geographic atrophy, hemorrhage, RPE tear, or scar (P < 0.0001).
Conclusions
The associations between VA and morphologic features identified through year 1 were maintained or strengthened during year 2. Eyes with foveal IRF, abnormally thin retina, greater thickness of the subretinal tissue complex on OCT, and subfoveal geographic atrophy or scar on FP/FA had the worst VA.
During year 1 of the Comparison of Age-related Macular Degeneration Treatments Trials (CATT), anti–vascular endothelial growth factor (VEGF) therapy with ranibizumab (Lucentis; Genentech, South San Francisco, CA) or bevacizumab (Avastin; Genentech) resulted in rapid and sustained reduction in all types of retinal fluid and thickness, stabilization of lesion growth, and reduction in vascular leakage.1 Intraretinal fluid (IRF), but not subretinal fluid (SRF) or sub–retinal pigment epithelium (RPE) fluid, was independently associated with worse visual acuity (VA). Very thin or thick retinas, thick subretinal tissue, atrophy, and scar were associated with worse VA.
Participants continued to receive anti-VEGF therapy during the second year of CATT. However, it was not known whether the associations between macular morphology and VA observed in year 1 would persist. For example, the observation that SRF was not associated with worse 1-year VA was surprising. In this report, we evaluated the effect at 2 years of different anti-VEGF treatment strategies on the activity and composition of choroidal neovascularization (CNV) lesions as determined by optical coherence tomography (OCT), fundus photography (FP), and fluorescein angiography (FA) in CATT. In addition, we determined the association of lesion activity and composition with VA after 2 years of anti-VEGF therapy.
Methods
Study Population
Details of the design and methods for CATT have been published.1–3 A total of 1185 subjects were enrolled by 43 clinical centers in the United States between February 2008 and December 2009. Only 1 eye per subject, the study eye, was treated as a part of the clinical trial. Inclusion criteria included age ≥50 years, presence of previously untreated active CNV secondary to age-related macular degeneration (AMD) in the study eye, and VA between 20/25 and 20/320. Choroidal neovascularization was considered active when leakage or increased stippling was seen on FA and IRF, SRF, or sub-RPE fluid was documented on OCT. Choroidal neovascularization or its sequelae (i.e., pigment epithelium detachment, hemorrhage, blocked fluorescence, macular edema, or fluid) needed to involve the center of the fovea. For the CNV to be considered secondary to AMD, at least 1 druse >63 µm needed to be present in the study eye or fellow eye, or the fellow eye needed to have CNV or geographic atrophy. Participants were assigned randomly with equal probability to 1 of 4 treatment groups in year 1: (1) ranibizumab monthly, (2) bevacizumab monthly, (3) ranibizumab as needed (pro re nata [PRN]), or (4) bevacizumab PRN. During the second year, participants in the monthly arms were rerandomized to continue monthly treatment or to switch to PRN therapy. The institutional review boards associated with each center approved the study. All participants provided written informed consent.
Study Procedures
The procedures used for the analysis and grading of OCT, FA, and color FP images have been published.1,4,5 Time-domain OCT images were obtained throughout year 1, whereas 22.6% of scans were obtained on spectral-domain OCT in year 2.3 During year 2, all participants underwent OCT imaging at weeks 76 and 104, FP and FA imaging at week 104, and standardized measurement of VA at weeks 76 and 104.
Data and Statistical Analysis
Only participants who met all eligibility criteria for the clinical trial (n=1142) were included in the analysis for this study. The numbers of participants with OCT scans available for grading were 1125, 1116, 1091, 1048, 1015, 1053, 933, and 989 at weeks 0, 4, 8, 12, 24, 52, 76, and 104, respectively. The number of participants with FP and FA available for grading was 1033 and 1017 at weeks 52 and 104, respectively. In addition, specific features on images could be ungradable because of insufficient image quality; the percentage of images ungradable at any particular time was approximately 2% or less each for OCT scans, FP, and FA.
Thickness measurements based on OCT were divided into categories as follows: total thickness: 0–325 µm, 326–425 µm, 426–550 µm, and >550 µm; retinal thickness: 0–119 µm, 120–212 µm, and >212 µm; SRF thickness: 0, 1–25 µm, and >25 µm; and subretinal tissue complex: 0–75 µm, 76–160 µm, 161–275 µm, and >275 µm. Categories reflected baseline quartiles except for retinal thickness, which was determined from the mean (±2 standard deviations) retinal thickness measured manually on time-domain OCT scans from healthy eyes, as reported previously.3,6
General linear models were used to compare the retinal morphology responses or VA responses among 4 treatment groups, between 2 drug groups, or between 2 treatment regimens. Time was treated as a continuous variable to assess the retinal morphology responses (presence of OCT fluid and OCT thickness) or VA responses over time. The interactions of morphologic responses and VA with treatment groups, drug groups, and regimens also were determined. Multiple regression models, using backward elimination processes to retain only the statistically significant variables, were used to analyze the association of retinal morphology findings from FP, FA, or OCT with VA at 104 weeks. All statistical analyses were performed in SAS version 9.2 (SAS Inc., Cary, NC), and 2-sided P values <0.05 were considered to be statistically significant.
Results
Optical Coherence Tomography Morphologic Characteristics Over Time by Treatment Group
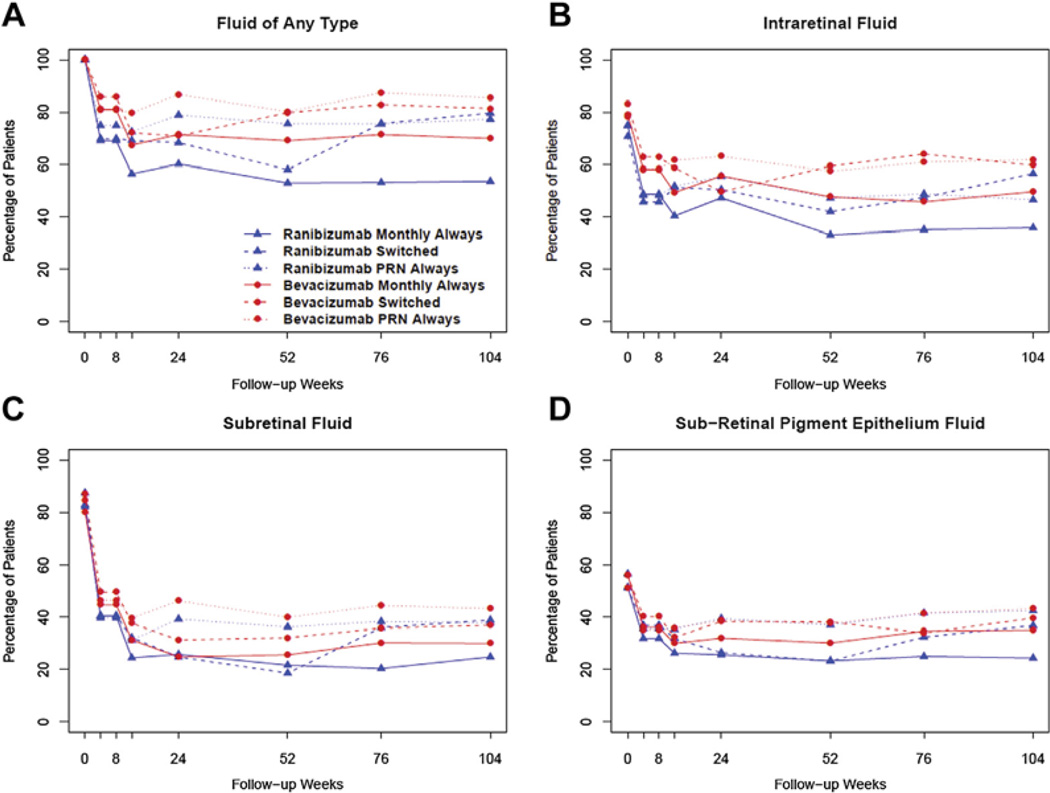
After anti-VEGF therapy, in all treatment groups there was a similar proportion of eyes with fluid of any type (IRF, SRF, or sub-RPE) from week 52 to week 104, except for the ranibizumab switched group, which showed an increase in the relative proportion of participants with fluid of any type (Fig 1A). The majority of this increase in the proportion of participants with fluid of any type in the ranibizumab switched group occurred between weeks 52 and 76. There was relatively little change between weeks 76 and 104. A similar pattern was observed for each of the individual fluid subtypes; the proportion of eyes with IRF, SRF, or sub-RPE fluid did not differ among treatment groups, with the exception of the ranibizumab switched group, in which the proportion of participants with each of the fluid subtypes increased through week 104, an effect that was most pronounced from week 52 to week 76.
Figure 1.
Percentage in each treatment group over time with fluid of any type (A), intraretinal fluid (B), subretinal fluid (C), and sub–retinal pigment epithelium fluid (D). PRN = pro re nata.
When compared with baseline, through week 104, in all groups there was a decrease in any type of fluid (P < 0.0001), IRF (P < 0.0001), SRF (P = 0.01), and sub-RPE fluid (P = 0.007). However, there were differences in fluid resolution among the treatment groups. Ranibizumab monthly at 52 and 104 weeks was better able to eliminate any fluid, and this applied to each of the fluid subtypes compared with any of the other dosing or drug regimens (Fig 1B–D). This treatment drug and regimen effect was least pronounced for SRF (Table 1).
Table 1.
Comparison of Optical Coherence Tomography Fluid among 6 Treatment Groups at Baseline, Year 1, and Year 2 (N = 1143)
| Lucentis (Genentech, South San Francisco, CA) Monthly Always (N = 157) |
Lucentis Switched (N = 134) |
Lucentis PRN Always (N = 286) |
Avastin (Genentech) Monthly Always (N = 149) |
Avastin Switched (N = 125) |
Avastin PRN Always (N = 292) |
Overall P Value |
||
|---|---|---|---|---|---|---|---|---|
| Fluid | Week | n (%) | n (%) | n (%) | n (%) | n (%) | n (%) | |
| Any fluid | 0 | 156 (99.4%) | 134 (100.0%) | 285 (99.7%) | 148 (99.3%) | 125 (100.0%) | 292 (100.0%) | – |
| 52 | 72 (52.2%) | 76 (56.7%) | 198 (72.3%) | 87 (68.0%) | 95 (78.5%) | 207 (79.9%) | <0.0001 | |
| 104 | 67 (53.2%) | 98 (77.8%) | 191 (75.5%) | 86 (68.8%) | 92 (80.0%) | 205 (84.0%) | <0.0001 | |
| IRF | 0 | 116 (73.9%) | 94 (70.1%) | 212 (74.1%) | 113 (75.8%) | 104 (83.2%) | 225 (77.1%) | 0.20 |
| 52 | 44 (31.9%) | 55 (41.0%) | 124 (45.3%) | 60 (46.9%) | 70 (57.9%) | 147 (56.8%) | <0.0001 | |
| 104 | 44 (34.9%) | 69 (54.8%) | 114 (45.1%) | 60 (48.0%) | 68 (59.1%) | 147 (60.2%) | <0.0001 | |
| SRF | 0 | 127 (80.9%) | 117 (87.3%) | 232 (81.1%) | 118 (79.2%) | 108 (86.4%) | 246 (84.2%) | 0.52 |
| 52 | 29 (21.0%) | 24 (17.9%) | 96 (35.0%) | 32 (25.0%) | 36 (29.8%) | 101 (39.0%) | <0.0001 | |
| 104 | 31 (24.6%) | 47 (37.3%) | 91 (36.0%) | 36 (28.8%) | 41 (35.7%) | 102 (41.8%) | 0.01 | |
| Sub-RPE fluid | 0 | 73 (46.5%) | 65 (48.5%) | 150 (52.4%) | 74 (49.7%) | 66 (52.8%) | 140 (47.9%) | 0.75 |
| 52 | 31 (22.5%) | 29 (21.6%) | 95 (34.7%) | 38 (29.7%) | 42 (34.7%) | 93 (35.9%) | 0.004 | |
| 104 | 30 (23.8%) | 43 (34.1%) | 101 (39.9%) | 42 (33.6%) | 42 (36.5%) | 101 (41.4%) | 0.007 |
IRF = intraretinal fluid; PRN = pro re nata; RPE = retinal pigment epithelium; SRF = subretinal fluid.
Optical Coherence Tomography–Determined Thickness Measurements Over Time by Treatment Group
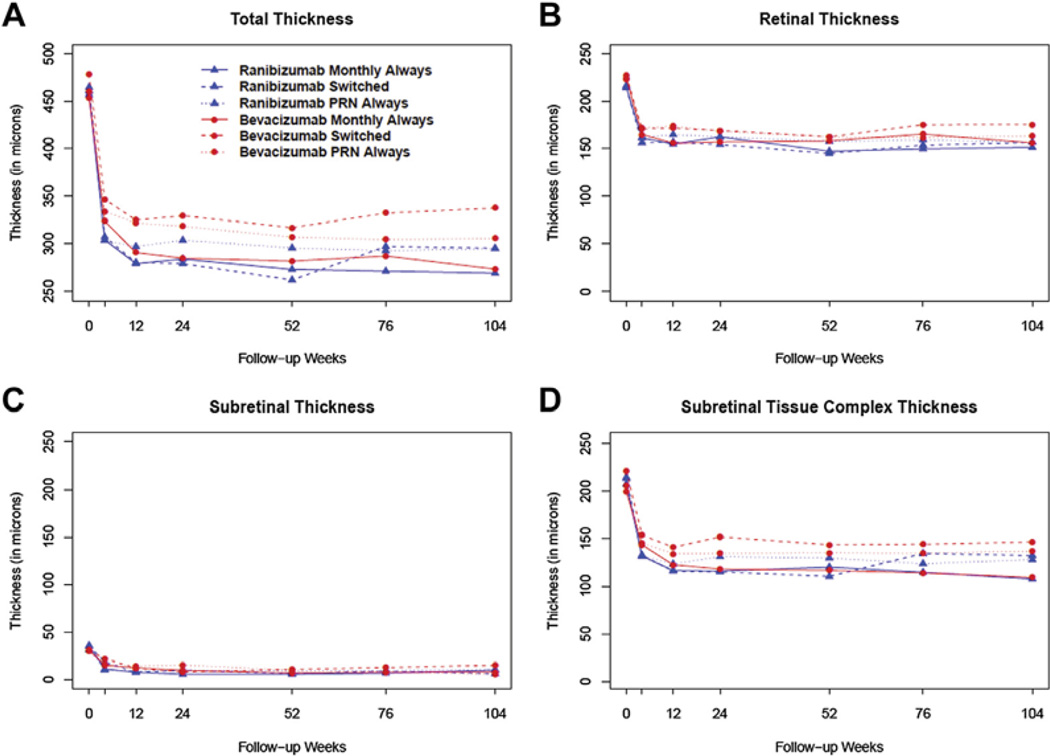
In all treatment groups, anti-VEGF therapy resulted in a substantial reduction in total thickness from baseline to week 52 (Fig 2A). During year 2, there was a sustained reduction in total thickness and subretinal tissue complex thickness for the PRN and monthly always groups for both ranibizumab and bevacizumab; the monthly always groups had the greatest decrease in total thickness. In contrast, the total thickness and subretinal tissue complex thickness increased slightly during year 2 in the bevacizumab switched group and to a greater extent in the ranibizumab switched group (Fig 2D). The differences between groups from week 52 and week 104 were minimal for retinal thickness and SRF thickness (Fig 2B, C). Although there was a difference between groups at week 104 for total thickness (P = 0.003) and subretinal tissue complex thickness (P = 0.01), there was no difference between groups for retinal thickness (P = 0.15) and SRF thickness (P = 0.18).
Figure 2.
Optical coherence tomography thickness over time by treatment group for total thickness (A), retinal thickness (B), subretinal thickness (C), and subretinal tissue complex thickness (D). PRN = pro re nata.
The difference in total thickness between groups was due to the effects of subretinal tissue complex thickness, with both the monthly treatment groups providing the greatest decrease in subretinal tissue complex thickness at week 104 compared with baseline and week 52. The ranibizumab switched group showed the greatest increase in subretinal tissue complex thickness from week 52 to week 104 of any of the treatment groups. However, the bevacizumab switched group showed only a modest increase in subretinal tissue complex thickness from week 52 to week 104.
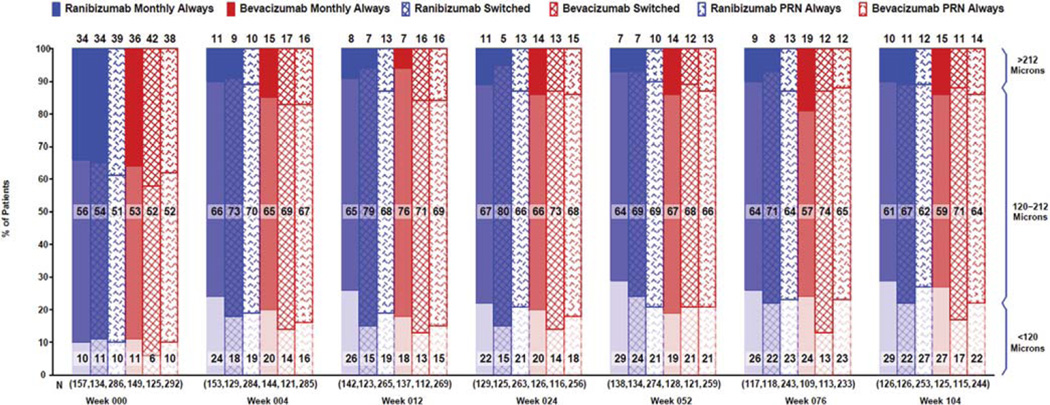
The proportion of eyes with thinner than normal retinas (<120 µm) was greatest for the ranibizumab monthly always group at week 52 and week 104 but did not increase between week 52 and 104 (Fig 3). In contrast, the proportion of eyes with thinner than normal retinas increased between weeks 52 and 104 for the ranibizumab PRN always, bevacizumab monthly always, and bevacizumab switched groups. The proportion of eyes with thicker than normal retinas (>212 µm) increased between week 52 and 104 for all groups except for the bevacizumab switched group. When one considers eyes without residual IRF at the foveal center, eyes with ranibizumab monthly and bevacizumab monthly had nearly identical proportions with abnormally thin retinas at week 104: 31.6% versus 31.7%, respectively (Table 2, available at www.aaojournal.org). This contrasts with week 52, when there was a marked difference between these same 2 groups (31.1% and 19.4%; P = 0.047).
Figure 3.
Retinal thickness category over time by treatment group. PRN = pro re nata.
Lesion Components Under the Foveal Center by Drug and Dosing Regimen
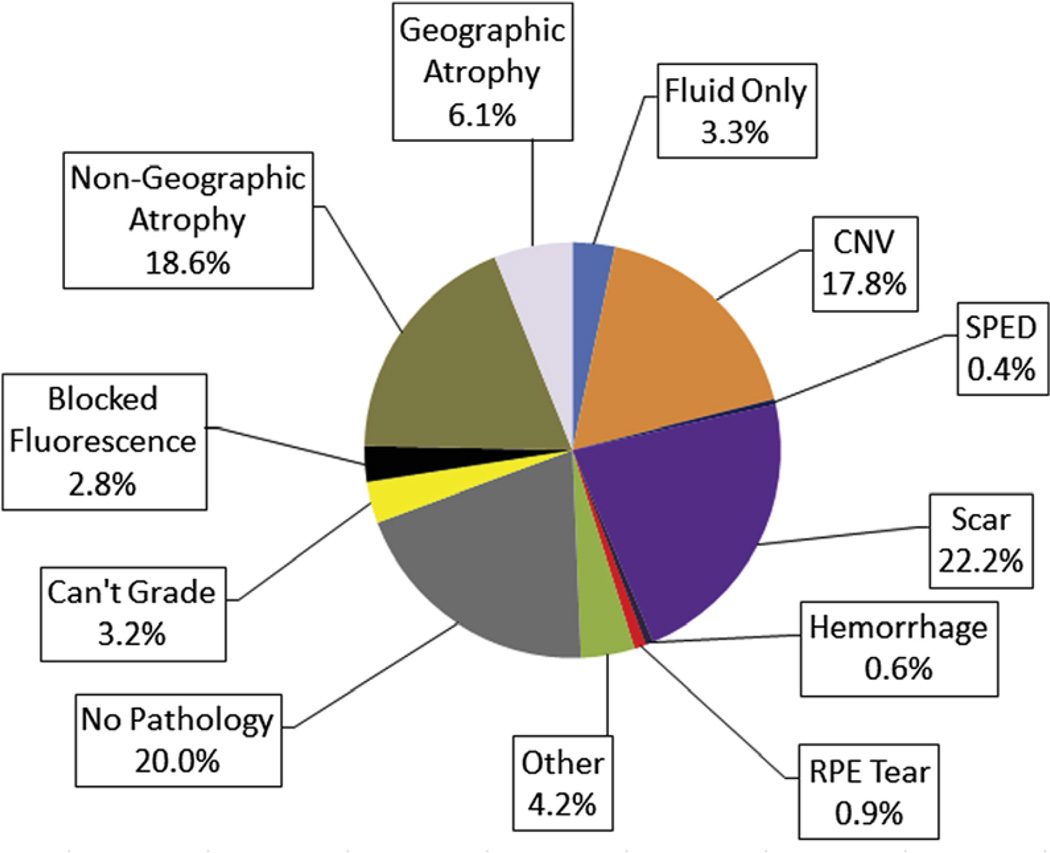
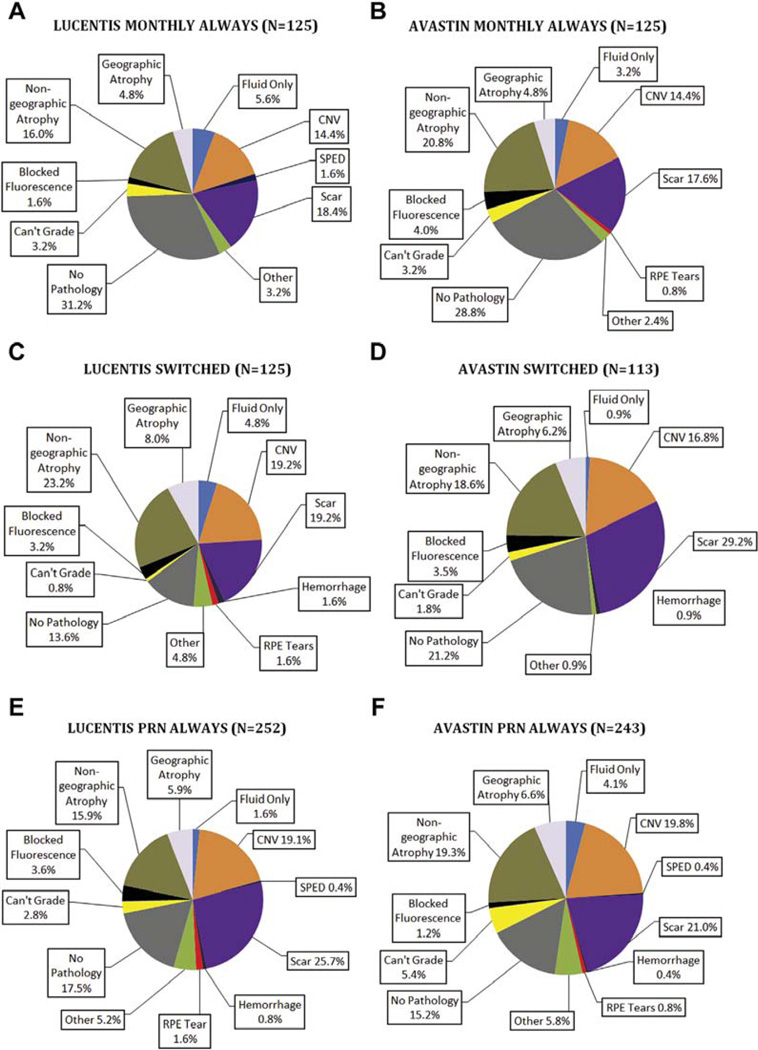
At week 52, 24.8% of eyes had CNV under the foveal center and 8.2% had fluid only; by week 104, these values decreased to 17.8% and 3.3%, respectively (Fig 4). Conversely, at week 52, 14.6% of eyes had nongeographic atrophy (depigmented RPE without clearly defined boundaries), 1.9% had geographic atrophy, and 18.6% had scar, values that increased at week 104 to 18.6%, 6.1%, and 22.2%, respectively. At week 52, there was no foveal center pathology in 19.6% of eyes, and this value remained nearly constant (20.0%) at week 104. At week 104, there was a slightly higher proportion of eyes with CNV in the foveal center in the PRN always and switched groups for both bevacizumab and ranibizumab compared with the monthly always groups for both drugs (Fig 5).
Figure 4.
Involvement of the foveal center by choroidal neovascularization (CNV) or sequelae of CNV at week 104 (N = 983). RPE = retinal pigment epithelium; SPED = serous retinal pigment epithelial detachment.
Figure 5.
Involvement of the foveal center by choroidal neovascularization (CNV) or sequelae of CNV at week 104 for ranibizumab monthly (A), bevacizumab monthly (B), ranibizumab pro re nata (PRN) (C), bevacizumab PRN (D), ranibizumab PRN always (E), and bevicizumab PRN always (F). RPE = retinal pigment epithelium; SPED = serous retinal pigment epithelial detachment.
Correlation of Fluid on Optical Coherence Tomography and Visual Acuity by Univariate Analysis
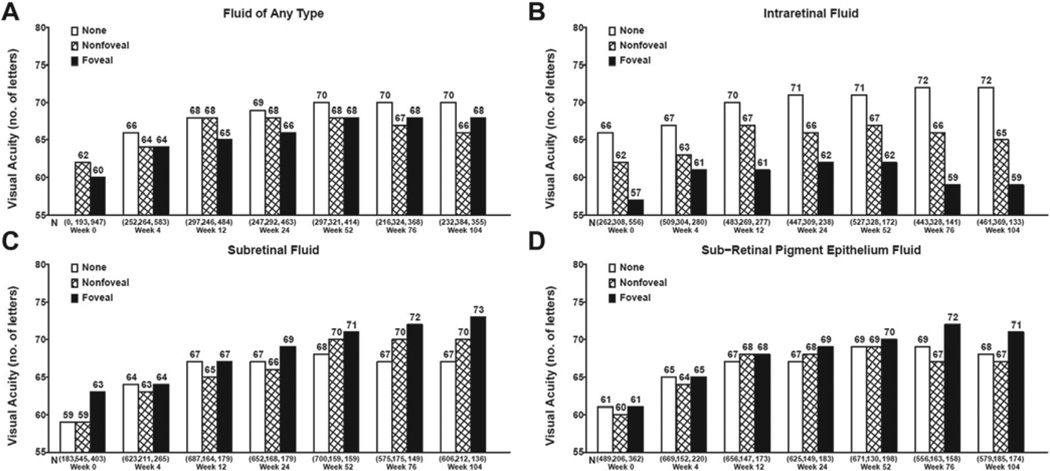
The mean VA did not change significantly from week 52 to week 104 (mean −1.3 letters), improved by >5 letters in approximately 22% (e.g., 23% and 21% of ranibizumab and bevacizumab PRN–treated eyes, respectively), and decreased by >5 letters in approximately 28% (e.g., 28% and 29% of ranibizumab- and bevacizumab-treated eyes); however, the VA change varied depending on the presence and type of fluid. There was no significant change in mean VA for eyes with no fluid or foveal fluid from week 52 to week 104. At week 104, mean (standard error [SE]) VA was better for eyes without any type of fluid in the fovea (69.7 [1.2] letters) than for eyes with any type of fluid in fovea (68.3 [1.0] letters) or extrafoveal fluid (66.2 [0.9] letters; P = 0.049). Likewise, mean (SE) VA at week 104 was better for eyes without IRF (72.2 [0.8] letters) than eyes with foveal (59.3 [1.5] letters) or extrafoveal IRF (65.3 [0.9] letters; P < 0.0001). The adverse effect of IRF worsened over time and was present at all time points in the study.
At week 52, presence and foveal location of SRF and sub-RPE fluid had no significant effect on mean VA (P = 0.051 and 0.40, respectively) (Fig 6C, D); however, by week 104 the mean (SE) VA for eyes with foveal SRF (72.8 [1.5] letters) was significantly better than that in eyes with extrafoveal SRF (69.6 [1.2] letters) or without SRF (66.6 [0.7] letters; P = 0.0005) (Fig 6C). Furthermore, the mean difference in VA between eyes with SRF and eyes without SRF increased over time from week 52 to week 104. Likewise, mean (SE) VA for eyes with foveal sub- RPE fluid (71.2 [1.3] letters) was better than eyes with extrafoveal (66.9 [1.3] letters) or no sub-RPE fluid (68.0 [0.7] letters; P = 0.048) (Fig 6D).
Figure 6.
Mean visual acuity by status of fluid by time for fluid of any type (A), intraretinal fluid (B), subretinal fluid (C), and sub–retinal pigment epithelium fluid (D).
Correlation of Optical Coherence Tomography–Determined Thickness Measurements with Visual Acuity by Univariate Analysis
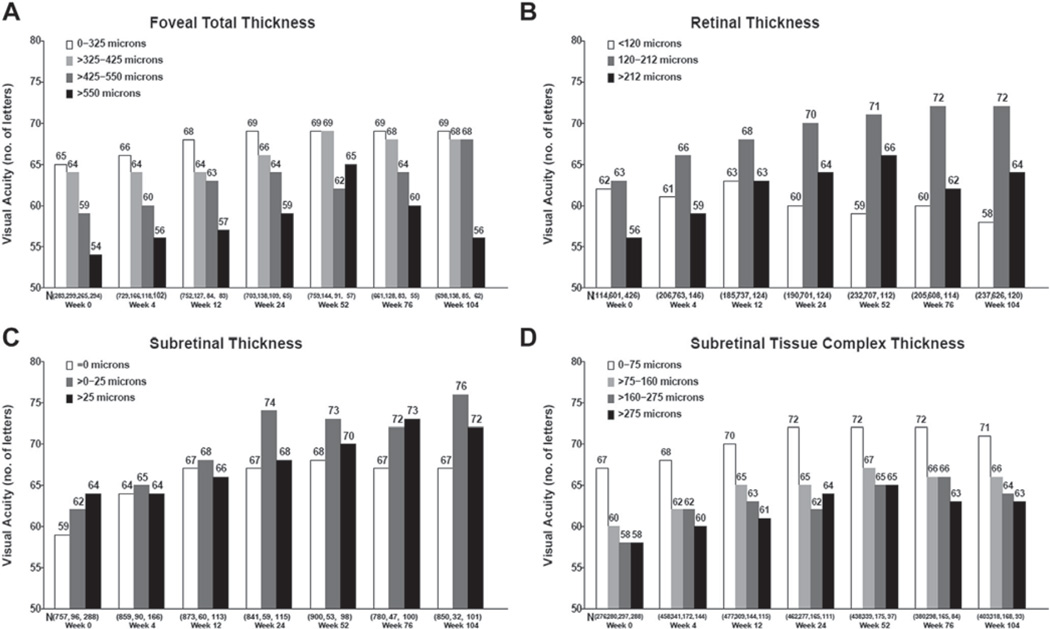
At week 52, eyes with total thickness (retinal thickness plus any SRF and sub-RPE complex thickness) between 0 and 325 µm and 325 and 425 µm had better VA than eyes with total thickness between 425 and 550 µm and >550 µm (P < 0.0001). By week 104, the eyes with total thickness <550 µm had similar VA, regardless of thickness quartile, but it was substantially better than in eyes with total thickness >550 µm (P < 0.0001). The total thickness components that contributed to better VA at week 104 were similar to and even more strongly associated with those found at week 52. Eyes with very thin (<120 µm; 57.7 [1.1] letters) or thick retinas (>212 µm; 64.0 [1.6] letters) had worse mean (SE) VA than eyes with normal retinal thickness (120–212 µm; 72.0 [0.7] letters; P < 0.0001) (Fig 7B). Eyes with 0 to 25 µm of SRF had better mean (SE) VA (76.1 [3.2] letters) than eyes with no SRF (66.8 [0.6] letters) or >25 µm of SRF (71.8 [1.8] letters; P = 0.0008) (Fig 7C). Finally, eyes with a thinner (0–75 µm) subretinal tissue complex were found to have the best mean (SE) VA (71.3 [0.9] letters), and increasing thickness of the subretinal tissue complex was associated with increasingly worse VA (P < 0.0001) (Fig 7D).
Figure 7.
Relationship between retinal thickness and visual acuity at baseline and follow-up: foveal total thickness (A), retinal thickness (B), subretinal thickness (C), and subretinal tissue complex thickness (D).
Correlation of Fundus Features Determined on Fluorescein Angiograms and Color Fundus Photographs with Visual Acuity at 104 Weeks on Univariate Analysis
At week 104, larger neovascular lesion area was associated with worse VA (P < 0.0001) (Table 2, available at www.aaojournal.org). The eyes with lesion area in the smallest quartile had a mean (SE) VA of 73.9 (1.33) letters, whereas the mean VA among the eyes with lesion area in the largest quartile was 60.9 (1.1) letters. These values were not significantly different from the values seen at week 52. The presence of pathology in the foveal center as determined by FP and FA was associated with worse VA (P < 0.0001) (Table 3). Eyes with only fluid in the foveal center had the best mean (SE) VA of 77.7 (3.05) letters, whereas eyes with scar had the worst mean (SE) VA of 59.0 (1.17) letters. These VAs were not significantly different than the mean VA values seen at week 52.
Table 3.
Mean Visual Acuity at Week 104 by Neovascular Lesion Area and Pathology in the Foveal Center at Week 104 (N = 993)
| Fundus Feature at Week 104 | N | Unadjusted Mean (SE) VA Score at Week 104 | P Value* |
|---|---|---|---|
| Neovascular lesion area (mm2) | |||
| ≥0 to ≤1.92 | 176 | 73.9 (1.33) | <0.0001 |
| >1.92 to ≤4.96 | 233 | 71.1 (1.16) | |
| >4.96 to ≤9.62 | 218 | 68.4 (1.20) | |
| >9.62 | 308 | 60.9 (1.01) | |
| Missing | 58 | 62.9 (2.32) | |
| Pathology in foveal center | |||
| None | 197 | 74.6 (1.23) | <0.0001 |
| Fluid only | 32 | 77.7 (3.05) | |
| CNV or serous pigment epithelium detachment | 179 | 72.7 (1.29) | |
| Nongeographic atrophy | 182 | 67.4 (1.28) | |
| Geographic atrophy, hemorrhage, RPE tear, blocked fluorescence | 102 | 59.8 (1.71) | |
| Scar | 218 | 59.0 (1.17) | |
| Other† or missing | 83 | 65.7 (1.89) |
CNV = choroidal neovascularization; RPE = retinal pigment epithelium; SE = standard error; VA = visual acuity.
One-way analysis of variance.
Other includes pigment, drusenoid pigment epithelial detachment, and nonleaking CNV.
Multivariate Analysis of the Association Between Visual Acuity and Optical Coherence Tomography and Fundus Features at 104 Weeks
Multivariate analyses were performed to determine whether morphologic parameters described earlier were independently associated with VA. Accordingly, the presence and foveal involvement of each of the 3 types of fluid on OCT, the thickness of each of the 3 retinal layers, the lesion size, and the foveal pathology were considered simultaneously in a linear regression model of VA (Table 4). We found that the presence and foveal involvement of IRF, the presence of SRF, retinal thickness <120 µm, greater subretinal tissue complex thickness, larger CNV lesion area, and the type of foveal pathology (scar, geographic atrophy) were all independent predictors of worse VA.
Table 4.
Adjusted Mean Visual Acuity for Optical Coherence Tomography and Fundus Features at Week 104 (n = 937)*
| Optical Coherence Tomography and Fundus Features at Week 104 | N | Adjusted Mean (SE) VA Score at Week 104 | P Value |
|---|---|---|---|
| IRF | |||
| No fluid | 460 | 70.9 (0.73) | <0.0001 |
| Fluid not in foveal center | 354 | 68.0 (0.82) | |
| Fluid in foveal center | 123 | 59.9 (1.50) | |
| SRF | |||
| No fluid | 598 | 67.0 (0.65) | 0.006 |
| Fluid not in foveal center | 208 | 70.6 (1.10) | |
| Fluid in foveal center | 131 | 70.9 (1.38) | |
| Retinal thickness | |||
| <120 µm | 219 | 59.4 (1.08) | <0.0001 |
| 120–212 µm | 609 | 71.3 (0.62) | |
| >212 µm | 109 | 70.3 (1.60) | |
| Subretinal tissue complex thickness | |||
| >0 to ≤75 µm | 389 | 70.1 (0.86) | 0.032 |
| >75 to ≤160 µm | 298 | 68.4 (0.90) | |
| >160 to ≤275 µm | 159 | 66.1 (1.30) | |
| >275 µm | 90 | 64.9 (1.74) | |
| CNV lesion area | |||
| ≥0 to ≤1.92 mm2 | 169 | 72.2 (1.27) | <0.0001 |
| >1.92 to ≤4.96 mm2 | 223 | 71.0 (1.03) | |
| >4.96 to ≤9.62 mm2 | 206 | 69.4 (1.08) | |
| >9.62 mm2 | 290 | 63.9 (0.95) | |
| Missing | 49 | 64.8 (2.48) | |
| Pathology in the foveal center | |||
| None | 190 | 70.6 (1.24) | <0.0001 |
| Fluid only | 32 | 74.1 (2.76) | |
| CNV or serous pigment epithelial detachment | 176 | 73.3 (1.28) | |
| Nongeographic atrophy | 178 | 68.4 (1.17) | |
| Geographic atrophy, hemorrhage, RPE tear, blocked fluorescence | 93 | 62.9 (1.60) | |
| Scar | 195 | 62.9 (1.14) | |
| Other or missing | 67 | 70.0 (1.98) |
CNV = choroidal neovascularization; IRF = intraretinal fluid; RPE = retinal pigment epithelium; SE = standard error; SRF = subretinal fluid; VA = visual acuity.
Subjects (n = 56) with missing data for fluid or retinal thickness were excluded.
Discussion
During year 2 of this study, the week 52 associations of morphologic features determined on OCT, FA, and FP and VA were maintained or strengthened at week 104. In contrast to the large decreases in year 1 of the study, anti-VEGF treatment did not further reduce macular fluid, thickness, or vascular leakage, or stabilize lesion growth. Despite a lack of additional year 2 improvement in morphologic features, anti-VEGF therapy maintained or improved the VA gains achieved in year 1 of the study for all groups except for the ranibizumab switched group. Intraretinal fluid, abnormally thin or thick retinas, larger CNV area, increasing sub-RPE tissue complex thickness and foveal scar, and foveal geographic atrophy were associated with the largest decreases in VA at week 104 compared with the other features evaluated.
A key 1-year study finding was that IRF, as determined by OCT, had a negative impact on VA at all time points examined. The strength of this association increased throughout year 2 of this study. When controlling for other potential confounding variables, IRF was independently associated with worse VA at year 2. The presence of other forms of subfoveal pathology, such as CNV or scar, did not alter the negative impact of IRF on VA. At the conclusion of year 1, we postulated that small hyporeflective cystoid structures seen on OCT that persisted on anti-VEGF therapy may have been mediated by non-VEGF mechanisms, such as cell death. The even stronger negative correlation between IRF and VA at year 2 supports this hypothesis given that there was little change overall in the proportion of eyes with IRF from year 1 to year 2 despite continued therapy.
Paradoxically, the presence of SRF was associated with better VA at year 2 even when controlling for other potentially confounding variables. The strength of this effect was greater for eyes with foveal SRF and for small amounts of SRF. We observed this association during the first year of the study,1 and it was further strengthened at year 2. To the best of our knowledge, the only data from a large, randomized, prospective study to show that SRF is associated with better VA are from the Vascular Endothelial Growth Factor VEGF Trap-Eye: Investigation of Efficacy and Safety in Wet Age-Related Macular Degeneration 2 (VIEW2) study, which evaluated aflibercept to treat neovascular AMD.7 In addition, some small retrospective studies found that SRF is compatible with good VA after anti-VEGF therapy.8,9 It would be of interest to learn whether data from large, randomized, comparative ranibizumab versus bevacizumab neovascular AMD treatment trials, such as Inhibition of VEGF in Age-related Choroidal Neovascularization (IVAN),10 similarly showed that eyes with SRF had better VA after 2 years of anti- VEGF treatment.
The reasons for the association between better VA and SRF are unclear. Regardless, this association cannot be simply explained by a protective effect on geographic atrophy, as we have observed previously, because SRF independently correlated with better VA, even when controlling for geographic atrophy. However, we cannot completely exclude this type of relationship because the location of the SRF was not precisely correlated with the location of geographic atrophy. We are currently registering color fundus photographs and fluorescein angiograms with OCT images to better address this question.
Approximately 70% of US retinal specialists now follow a treat-and-extend treatment protocol for neovascular AMD, and 20% follow a PRN treatment protocol, rather than continuing monthly therapy regardless of OCT findings.11 For these clinicians, the criteria to stop aggressively treating small amounts of SRF, sub-RPE fluid, or even IRF are not clear. In the second year of this study, continued aggressive treatment was not associated with further decreases in the proportion of eyes with each type of fluid or in further gains of VA. These data would imply that it may not be necessary to continue to aggressively treat small amounts of fluid, especially if they are not changing significantly from one examination to the next; however, as we have reported previously, switching from monthly to PRN treatments results in lower VA.3 Furthermore, as indicated earlier, eyes with SRF actually had better VA than those without fluid. Conversely, an increased proportion of eyes with each type of fluid and an increase in subretinal tissue complex thickness in the ranibizumab switched group and a greater proportion of subfoveal CNV in the PRN or switched groups with both drugs indicate a possible disadvantage of reduced treatment frequency. Visual acuity was also found to be worse in the groups switched to PRN treatment during the second year. Regardless, CATT was not designed to determine whether VA would be better if eyes with specific fluid subtypes or a specific fluid magnitude are treated according to different treatment strategies; eyes with even a small amount of fluid received anti-VEGF therapy per the treatment protocol. Further studies are warranted to determine whether less aggressive anti-VEGF therapy is appropriate in eyes with persistent SRF or smaller amounts of fluid. For trials with a PRN or “treat-and-extend” arm, there should be a consideration to tolerate small amounts of SRF and to avoid treatment at that visit, assuming there is not another indication to treat the patient. Data from these types of trials would then provide more definitive information to guide the majority of clinicians who treat patients according to a PRN or treat-and-extend strategy.
Among eyes treated with monthly or PRN injections in year 1 that received the same treatment regimen in year 2, the majority of morphologic improvements occurred in year 1 and were stable in year 2. Furthermore, the VA gains seen in year 1 were maintained or improved in year 2. These results suggest that if a clinician elects to begin treatment with a PRN dosing strategy that is largely based on OCT fluid findings, he/she should continue to evaluate the OCT to guide therapy, at least during the first 2 years of treatment, to achieve visual stability or improvement achieved with this PRN strategy.
Eyes in the ranibizumab switched group had been on monthly ranibizumab during year 1 and were randomly selected to switch to a PRN dosing regimen. This group had significant increases in the proportion of eyes with all types of fluid, in total retinal thickness, and in subretinal tissue complex thickness from week 52 to week 104, the majority of the increase occurring between weeks 52 and 76 and stabilizing thereafter. In contrast, eyes that were in the bevacizumab switched group maintained the gains that they achieved during year 1 of the study, with no significant increase in any of these parameters from week 52 to week 104. The significance of the increase in the proportion of eyes with various forms of fluid and increase in retinal thickness in the ranibizumab switched group is unclear given the lack of significant change in eyes switched from bevacizumab monthly to a PRN dosing regimen.
As seen at the end of year 1, abnormally thin or thick retinas were associated with worse VA. The strength of this relationship was even greater in year 2 and was seen at all time points in the study. It is possible that neural tissue loss accounted for the greater proportion of retinas with abnormal thinning and could explain decreased VA in this group. When this analysis was restricted to those eyes with no residual fluid on OCT, monthly treatment with bevacizumab or ranibizumab resulted in the greatest thinning compared with any of the other treatment regimens. This is in contrast to the end of year 1 of the study when monthly ranibizumab had the greatest proportion of eyes with abnormal thinning. The fact that both ranibizumab and bevacizumab monthly treatment resulted in the same proportion of abnormal thinning at the end of year 2 suggests that monthly anti-VEGF therapy results in more retinal atrophy regardless of the drug, although it may occur more rapidly with ranibizumab. The potential small VA benefit of monthly anti-VEGF injections also must be balanced by potentially adverse effects on retinal thickness and injection-related side effects.
Acknowledgments
Supported by cooperative agreements U10 EY017823, U10 EY017825, U10 EY017826, U10 EY017828, and R21EY023689 from the National Eye Institute, National Institutes of Health, Department of Health and Human Services, Bethesda, Maryland. The funding organization participated in the design and conduct of the study and review of the manuscript. ClinicalTrials.gov identifier NCT00593450.
Abbreviations and Acronyms
- AMD
age-related macular degeneration
- CATT
Comparison of Age-related Macular Degeneration Treatments Trials
- CNV
choroidal neovascularization
- FA
fluorescein angiography
- FP
fundus photography
- IRF
intraretinal fluid
- OCT
optical coherence tomography
- PRN
pro re nata
- RPE
retinal pigment epithelium
- SE
standard error
- SRF
subretinal fluid
- VA
visual acuity
- VEGF
vascular endothelial growth factor
Footnotes
Presented in part at the Association for Research in Vision and Ophthalmology Meeting, May 4–8, 2014, Orlando, Florida.
Financial Disclosure(s):
The author(s) have made the following disclosure(s): C.A.T.: Grants – Duke from the National Eye Institute, during the conduct of the study; Grants – Genentech, Bioptigen; Personal fees – Thrombogenics, outside the submitted work; Patent – OCT technology and software (pending).
M.G.M.: Personal fees – Genentech.
G.-S.Y.: Personal fees – Janssen R & D.
G.J.J.: Personal fees – Heidelberg Engineering, Neurotech, Alcon/Novartis, Genentech/Roche.
Author Contributions:
Conception and design: Sharma, Toth, Daniel, Grunwald, Maguire, Ying, Huang, Martin, Jaffe
Data collection: Sharma, Toth, Daniel, Grunwald, Maguire, Ying, Huang, Martin, Jaffe
Analysis and interpretation: Sharma, Toth, Daniel, Grunwald, Maguire, Ying, Huang, Martin, Jaffe
Obtained funding: Not applicable
Overall responsibility: Sharma, Toth, Daniel, Grunwald, Maguire, Ying, Huang, Martin, Jaffe
References
- 1.Jaffe GJ, Martin DF, Toth CA, et al. Macular morphology and visual acuity in the comparison of age-related macular degeneration treatments trials. Ophthalmology. 2013;120:1860–1870. doi: 10.1016/j.ophtha.2013.01.073. [DOI] [PMC free article] [PubMed] [Google Scholar]
- 2.CATT Research Group. Martin DF, Maguire MG, Ying GS, et al. Ranibizumab and bevacizumab for neovascular age-related macular degeneration. N Engl J Med. 2011;364:1897–1908. doi: 10.1056/NEJMoa1102673. [DOI] [PMC free article] [PubMed] [Google Scholar]
- 3.Comparison of Age-related Macular Degeneration Treatments Trials Research Group. Martin DF, Maguire MG, Fine SL, et al. Ranibizumab and bevacizumab for treatment of neovascular age-related macular degeneration: two-year results. Ophthalmology. 2012;119:1388–1398. doi: 10.1016/j.ophtha.2012.03.053. [DOI] [PMC free article] [PubMed] [Google Scholar]
- 4.DeCroos FC, Toth CA, Stinnett SS, et al. Optical coherence tomography grading reproducibility during the Comparison of Age-related Macular Degeneration Treatments Trials. Ophthalmology. 2012;119:2549–2557. doi: 10.1016/j.ophtha.2012.06.040. [DOI] [PMC free article] [PubMed] [Google Scholar]
- 5.Grunwald JE, Daniel E, Ying GS, et al. Photographic assessment of baseline fundus morphologic features in the Comparison of Age-Related Macular Degeneration Treatments Trials. Ophthalmology. 2012;119:1634–1641. doi: 10.1016/j.ophtha.2012.02.013. [DOI] [PMC free article] [PubMed] [Google Scholar]
- 6.Chan A, Duker JS, Ko TH, et al. Normal macular thickness measurements in healthy eyes using Stratus optical coherence tomography. Arch Ophthalmol. 2006;124:193–198. doi: 10.1001/archopht.124.2.193. [DOI] [PMC free article] [PubMed] [Google Scholar]
- 7.Schmidt-Erfurth U, Waldstein SM, Deak GG, et al. Pigment epithelial detachment followed by retinal cystoid degeneration leads to vision loss in treatment of neovascular age-related macular degeneration. Ophthalmology. 2015;122:822–832. doi: 10.1016/j.ophtha.2014.11.017. [DOI] [PubMed] [Google Scholar]
- 8.Bhavsar KV, Freund KB. Retention of good visual acuity in eyes with neovascular age-related macular degeneration and chronic refractory subfoveal subretinal fluid. Saudi J Ophthalmol. 2014;28:129–133. doi: 10.1016/j.sjopt.2014.03.001. [DOI] [PMC free article] [PubMed] [Google Scholar]
- 9.Gianniou C, Dirani A, Jang L, Mantel I. Refractory intraretinal or subretinal fluid in neovascular age-related macular degeneration treated with intravitreal ranizubimab: functional and structural outcome. Retina. 2015;35:1195–1201. doi: 10.1097/IAE.0000000000000465. [DOI] [PubMed] [Google Scholar]
- 10.IVAN Study Investigators. Chakravarthy U, Harding SP, Rogers CA, et al. Ranibizumab versus bevacizumab to treat neovascular age-related macular degeneration: one-year findings from the IVAN randomized trial. Ophthalmology. 2012;119:1399–1411. doi: 10.1016/j.ophtha.2012.04.015. [DOI] [PubMed] [Google Scholar]
- 11.Stone TW, editor. ASRS 2014 Preferences and Trends Membership Survey. Chicago, IL: American Society of Retina Specialists; 2014. [Google Scholar]


