

Abstract
Allogeneic hematopoietic cell transplantation (HCT) is the only known treatment with curative potential for myelodysplastic syndromes (MDS), but relapse is a major cause of failure. We studied results in 289 patients transplanted between June 2004 and December 2013. Minimal Identifiable Disease (MID) markers pre-HCT were determined by multiparameter flow cytometry (MFC) and cytogenetics on marrow aspirates. The impact of MID on outcome after low and high intensity conditioning HCT was determined. Among 287 evaluable patients, 68 (23.7%) had more than 5% marrow blasts at HCT; 219 patients were in morphologic remission but 154 (53.7%) were MID positive, while 65 (22.6%) were MID negative. The impact of MID on outcome was significantly different between patients who received low-intensity conditioning and patients who received a high-intensity regimen. The impact of conditioning intensity differed across the various MID categories. In particular, the risk of overall mortality was higher with low-intensity than with high-intensity regimens for patients who were positive for MID by cytogenetics regardless of positivity by MFC (HR=1.67 if MFC+/cytogenetics+, HR=7.23 if MFC−/cytogenetics+). On the other hand, patients who were MID-negative by both MFC and cytogenetics had similar risks of mortality with low- and high-intensity regimens (HR=0.99). The main factor responsible for mortality after low-intensity conditioning in MID positive patients was relapse. The presence of MID should be considered when deciding on conditioning intensity as it identifies subgroups of patients who may benefit from high- or low-intensity conditioning, respectively.
Keywords: MDS, minimal residual disease, minimal identifiable disease, allogeneic transplantation, conditioning regimen
Introduction
Allogeneic hematopoietic cell transplantation (HCT) is the only treatment with proven curative potential for many patients with myelodysplastic syndrome (MDS) [1]. However, high-dose conditioning HCT may not be an option in older patients or patients with comorbidities because of potential toxicities associated with the procedure. The development of low-intensity conditioning regimens has resulted in a significant reduction in non-relapse mortality (NRM), and growing numbers of previously ineligible patients are undergoing successful HCT [2]. This is of particular importance with MDS since more than 80% of newly diagnosed patients are older than 60 years [3]. However, the advantage gained due to lower NRM may be negated by a higher incidence of relapse. Past experience has shown, indeed, that the major cause of death following HCT after low-intensity conditioning in MDS is relapse, particularly in patients with more advanced disease [4–7]. Even for patients in morphological remission at HCT, the best conditioning strategy remains controversial. A randomized trial comparing high-intensity to low-intensity conditioning for patients with MDS or AML under the auspices of the Bone Marrow Transplant Clinical Trials Network was recently closed due to a perceived benefit with high-intensity regimens. Results, published in abstract form, do show inferior overall survival among patients conditioned with reduced intensity conditioning regimens [8].
Monitoring of minimal residual disease (MRD) with multicolor flow cytometry (MFC), cytogenetics or genomic technologies, is now widely used as a guide to adjust treatment with the goal of improving outcomes, and to design new clinical trials for patients with acute leukemias [9,10]. Walter et al. reported a single center retrospective analysis of 99 AML patients in first complete remission (CR) treated with high-intensity conditioning and HCT [9]. After adjustment for multiples variables, patients who had MRD by MFC at the time of HCT suffered a significantly higher relapse incidence than MRD negative controls (HR, 8.49; 95% CI 3.67–19.65; p<0.001). Similar conclusions were recently reached by the same group in patients treated with low-intensity conditioning [11]. There is growing interest in MRD assessment as a pre-HCT prognostic predictor in acute leukemias and non-Hodgkin lymphomas [12,13]; however, no such data have been reported in patients with MDS.
We report a retrospective analysis involving 289 sequential patients with MDS transplanted at our institution between June 2004 and December 2013. Our objectives were to identify disease and treatment parameters that would predict transplant outcomes, specifically relapse of MDS.
Patients and Methods
Patients
Between June 2004 (FDA approval of Azacitidine), and December 2013, 289 consecutive patients with MDS (including patients whose disease had progressed to AML) underwent HCT at the Fred Hutchinson Cancer Research Center (FHCRC); 43% of HCT were carried out since January 2010. The median age at HCT was 57 (range, 6–77) years, 171 patients (59%) were male and 118 (41%) female. There were 207 patients (72%) with de novo MDS, and 82 (28%) with secondary MDS, following an antecedent hematologic disorder or cytotoxic therapy for various conditions (Supplemental Table S1).
Donors were human leukocyte antigen (HLA)-matched family members in 116 cases (40%), including 2 HLA-matched parents; haploidentical in 2 cases (1%); unrelated in 171 cases (59%), including 153 HLA-matched donors, 34 donors with at least 1 mismatch, and 18 cord blood units. The stem cell source was peripheral blood in 243 patients (84%), bone marrow in 28 patients (10%), and cord blood in 18 patients (6%). Fifty patients with de novo MDS (24%) and 16 (20%) with secondary MDS had advanced to AML before HCT. Cytogenetic risks as defined by the International Prognostic Scoring System (IPSS) criteria were comparable for patients conditioned with high intensity and those with reduced intensity regimens. Patient and disease characteristics are summarized in Table 1.
Table 1.
Patient and disease characteristics
| Characteristics | Overall | Low intensity | High intensity | p-value |
|---|---|---|---|---|
|
| ||||
| Patients, no. | 289 | 94 | 195 | |
|
| ||||
| Male/female, no. (%) | 171 (59)/118 (41) | 62 (66)/32 (34) | 109 (56)/86 (44) | 0.13 |
|
| ||||
| Median age at diagnosis, years (range) | 56 (5 – 76) | 64 (24 – 76) | 52 (5 – 74) | <0.001 |
|
| ||||
| Median age at HCT, years (range) | 57 (6 – 77) | 66 (25 – 77) | 53 (6 – 76) | <0.001 |
|
| ||||
| Diagnosis – WHO 2008 criteria | ||||
| RCMD, no. (%) | 97 (34) | 34 (36) | 63 (32) | 0.6 |
|
| ||||
| RARS, no. (%) | 6 (2) | 3 (3) | 3 (2) | 0.39 |
|
| ||||
| Del 5q, no. (%) | 3 (1) | 2 (2) | 1 (1) | 0.25 |
|
| ||||
| MDS-U, no. (%) | 21 (7) | 6 (6) | 15 (8) | 0.81 |
|
| ||||
| RCUD, no. (%) | 17 (6) | 5 (5) | 12 (6) | 1 |
|
| ||||
| RAEB-1, no. (%) | 55 (19) | 18 (19) | 37 (19) | 1 |
|
| ||||
| RAEB-2, no. (%) | 86 (30) | 23 (24) | 63 (32) | 0.22 |
|
| ||||
| CMML, no. (%) | 4 (1) | 3 (3) | 1 (1) | 0.1 |
|
| ||||
| Etiology | ||||
| Primary, no. (%) | 207 (72) | 62 (66) | 145 (74) | |
|
| ||||
| Secondary, no. (%) | 82 (28) | 32 (34) | 50 (26) | 0.16 |
|
| ||||
| Disease duration | ||||
| Median time between diagnosis and | ||||
| HCT, months (range) | 7 (1 – 82) | 10 (1 – 82) | 6 (1 – 82) | <0.001 |
| IPSS risk at diagnosis | ||||
| Low, no. (%) | 18 (6) | 6 (6) | 12 (6) | 1 |
|
| ||||
| Intermediate-1, no. (%) | 123 (43) | 41 (44) | 82 (42) | 0.8 |
|
| ||||
| Intermediate-2, no. (%) | 110 (38) | 35 (37) | 75 (38) | 1 |
|
| ||||
| High, no (%) | 33 (11) | 10 (11) | 23 (12) | 1 |
|
| ||||
| Not evaluable, no (%) | 5* (2) | 2 (2) | 3 (2) | 0.66 |
| IPSS-R risk at diagnosis | ||||
| Very low, no. (%) | 10 (3) | 4 (4) | 6 (3) | 0.73 |
|
| ||||
| Low, no. (%) | 52 (18) | 19 (20) | 33 (17) | 0.52 |
|
| ||||
| Intermediate, no. (%) | 79 (27) | 24 (26) | 55 (28) | 0.67 |
|
| ||||
| High, no (%) | 77 (27) | 28 (30) | 49 (25) | 0.4 |
|
| ||||
| Very high, no (%) | 66 (23) | 17 (18) | 49 (25) | 0.23 |
|
| ||||
| Not evaluable, no (%) | 5 (2) | 2 (2) | 3 (2) | 0.66 |
|
| ||||
| IPSS-R cytogenetics risk at diagnosis | ||||
| Very good/good, no (%) | 124 (43) | 41 (44) | 83 (43) | 0.9 |
|
| ||||
| Intermediate, no (%) | 58 (20) | 21 (22) | 37 (19) | 0.53 |
|
| ||||
| Poor/very poor, no (%) | 103 (36) | 31 (33) | 72 (37) | 0.6 |
|
| ||||
| Not evaluable, no (%) | 3 (1) | 1 (1) | 2 (1) | – |
|
| ||||
| Preceding therapies | ||||
| Induction chemotherapy as a first treatment, no. (%) | 81 (28) | 18 (19) | 63 (32) | 0.025 |
|
| ||||
| Hypomethylating agents as a first treatment, no. (%) | 117 (40) | 54 (57) | 63 (32) | <0.001 |
|
| ||||
| No therapy, no. (%) | 80 (28) | 19 (20) | 61 (31) | 0.05 |
|
| ||||
| Other, no. (%) | 11 (4) | 3 (3) | 8 (4) | 1 |
|
| ||||
| Disease status at HCT – IWG 2006 criteria | ||||
| Complete remission, no. (%) | 68 (24) | 29 (31) | 39 (20) | 0.05 |
|
| ||||
| Marrow CR, no. (%) | 75 (26) | 27 (29) | 48 (25) | 0.48 |
|
| ||||
| Partial remission, no. (%) | 9 (3) | 2 (2) | 7 (4) | 0.72 |
|
| ||||
| Stable disease/untreated, no. (%) | 97 (34) | 28 (30) | 69 (35) | 0.59 |
|
| ||||
| Disease progression or relapse, no. (%) | 40 (14) | 8 (9) | 32 (16) | 0.07 |
| Donors | ||||
| HLA-matched family members, no. (%) | 116** (40) | 33 (35) | 83* (43) | 0.3 |
|
| ||||
| Haploidentical, no. (%) | 2 (1) | 0 | 2 (1) | 1 |
|
| ||||
| Matched unrelated, no. (%) | 119 (41) | 41 (44) | 78 (40) | 0.61 |
|
| ||||
| Mismatched unrelated, no. (%) | 34 (12) | 9 (10) | 25 (13) | 0.56 |
|
| ||||
| Cord, no. (%) | 18 (6) | 10 (11) | 8 (4) | 0.04 |
| Source of stem cells | ||||
| Peripheral blood, no. (%) | 243 (84) | 84 (89) | 159 (82) | 0.12 |
|
| ||||
| Marrow, no. (%) | 28 (10) | 0 | 28 (14) | <0.001 |
|
| ||||
| Cord, no. (%) | 18 (6) | 10 (11) | 8 (4) | 0.04 |
| IPSS risk at HCT | ||||
| Low, no. (%) | 61 (21) | 25 (27) | 36 (18) | 0.13 |
|
| ||||
| Intermediate-1, no. (%) | 136 (47) | 40 (43) | 96 (49) | 0.32 |
|
| ||||
| Intermediate-2, no. (%) | 68 (24) | 25 (27) | 43 (22) | 0.46 |
|
| ||||
| High, no (%) | 22 (8) | 3 (3) | 19 (10) | 0.06 |
|
| ||||
| Not evaluable, no (%) | 2 (1) | 1 (1) | 1 (1) | 0.54 |
| IPSS-R risk at HCT | ||||
| Very low, no. (%) | 40 (14) | 21 (22) | 19 (10) | 0.006 |
|
| ||||
| Low, no. (%) | 77 (27) | 22 (23) | 55 (28) | 0.48 |
|
| ||||
| Intermediate, no. (%) | 69 (24) | 23 (24) | 46 (24) | 1 |
|
| ||||
| High, no (%) | 61 (21) | 19 (20) | 42 (22) | 0.88 |
|
| ||||
| Very high, no (%) | 40 (14) | 8 (9) | 32 (16) | 0.10 |
|
| ||||
| Not evaluable, no (%) | 2 (1) | 1 (1) | 1 (1) | 0.54 |
| IPSS-R cytogenetics risk at HCT | ||||
| Very good/good, no (%) | 135 (47) | 47 (50) | 88 (45) | 0.45 |
| Intermediate, no (%) | 59 (20) | 18 (19) | 41 (21) | 0.76 |
| Poor/very poor, no (%) | 94 (33) | 29 (31) | 65 (33) | 0.69 |
| Not evaluable, no (%) | 1 (0) | 0 (0) | 1 (1) | – |
|
| ||||
| AML evolution before HCT | ||||
|
| ||||
| Yes, no. (%) | 66 (23) | 23 (25) | 43 (22) | |
|
| ||||
| No, no. (%) | 223 (77) | 71 (76) | 152 (78) | 0.66 |
3 missing cytogenetics, 2 missing peripheral blood counts;
2 HLA matched parents. Abbreviations: WHO = World Health Organization; RCMD = refractory cytopenia with multilineage dysplasia; RARS = refractory anemia with ring sideroblasts; Del 5q = myelodysplastic syndrome associated with isolated deletion 5q; MDS-U = myelodysplastic syndrome unclassified; RCUD = refractory cytopenia with unilineage dysplasia; RAEB = refractory anemia with excess blasts; CMML = chronic myelomonocytic leukemia; HCT = allogeneic hematopoietic cell transplantation; IWG = International Working Group; IPSS = International Prognostic Scoring System; IPSS-R = Revised International Prognostic Scoring System; CR = complete remission; HLA = human leukocyte antigen; AML = acute myeloid leukemia.
Patients or legal guardians for patients younger than 18 years gave informed consent to use medical information for the purposes of research approved by the Institutional Review Board of the FHCRC in accordance with the Declaration of Helsinki.
HCT Procedure
Patients were prepared for HCT with various conditioning regimens, categorized on the basis of treatment components and dose intensities (Table 2). Regimens considered to be of high or low intensity were administered to 195 (67.5%) and 94 patients (32.5%), respectively. The conditioning regimen was selected according to active protocols at the time of HCT and considering patient age and comorbidities. For patients receiving high-intensity regimens, prophylaxis for graft-versus-host-disease (GvHD) consisted of methotrexate (MTX) plus cyclosporine (CSP) or tacrolimus in 139 patients; mycophenolate mofetil (MMF) and CSP or tacrolimus in 38 patients; cyclophosphamide with or without CSP or tacrolimus in 13 patients; MTX, CSP, and sirolimus in 3 patients; MMF, CSP, and sirolimus in 2 patients. Among low intensity-conditioned patients, prophylaxis for GvHD consisted of MMF and CSP or tacrolimus in 82 patients; MMF, CSP, and sirolimus in 10; MTX and CSP in 2 patients.
Table 2.
Transplant conditioning regimens
| High intensity regimens (N=195) | Low intensity regimens (N=94) | ||
|---|---|---|---|
| BU16/CY, no. (%) | 90 (46) | FLU/TBI200–300, no. (%) | 60 (64) |
| BU16/FLU, no. (%) | 27 (14) | FLU/TBI400–450, no. (%) | 20 (21) |
| TREO42/FLU/TBI200, no. (%) | 31 (16) | CY/FLU/TBI200–300, no. (%) | 9 (10) |
| RAB/FLU/TBI200, no. (%) | 17 (9) | CLOFA/TBI200, no. (%) | 3 (3) |
| TREO42/FLU, no. (%) | 12 (6) | CY/FLU/TBI400, no. (%) | 1 (1) |
| TBI1200–1320/CY, no. (%) | 7 (4) | BU8/FLU, no. (%) | 1 (1) |
| RDB/BC8SA/FLU/TBI200, no. (%) | 5 (3) | ||
| RAB/FLU/TBI200/CY, no. (%) | 2 (1) | ||
| TBI1320/THIO/FLU, no. (%) | 2 (1) | ||
| TBI1320/CY/FLU, no. (%) | 1 (1) | ||
| RAB/FLU/TBI/LI1400, no. (%) | 1 (1) | ||
Abbreviations: BU = busulfan; CY = cyclophosphamide; FLU = fludarabine; TREO = treosulfan; TBI = total body irradiation; RAB = radiolabeled antibodies; RDB = radiolabeled dota-biotin; BC8SA = streptavidin-conjugated antiCD45 antibodies; THIO = thiotepa; LI = localized irradiation; CLOFA = clofarabine.
Graft Failure
The day of engraftment was defined as the first of 3 consecutive days with an absolute neutrophil count of ≥ 0.5 × 10⁹/L. Primary graft failure was defined as not reaching this neutrophil count by day 28 (day 55 for cord blood recipients). Secondary graft failure was defined as a progressive decline in peripheral neutrophil counts after initial recovery. For the majority of patients the analyses were performed on days 28, 56, 84, 180 and 365, and then as clinically indicated. In addition, donor CD3+ T cells <5% on day 28 or donor T-cell decline to <5% after previous evidence of engraftment were considered evidence of primary or secondary graft failure, respectively [14].
Disease Status at HCT and Minimal Identifiable Disease (MID)-based Classification
In the entire cohort, 112 patients (38.8%) received induction chemotherapy as a frontline approach or as salvage. Among the remaining 177 patients, 86 (29.8%) were treated with hypomethylating agents, 7 (2.4%) with immunosuppression, 4 (1.4%) with lenalidomide or thalidomide, and 80 (27.7%) with supportive care only. The majority of patients (221; 76%) had less than 5% marrow blasts by morphology at the time of HCT.
We used the 2006 modified International Working Group (IWG) response criteria to assess the disease status at the time of HCT [15]. Sixty-eight patients (24%) were in CR, 75 (26%) were in marrow CR, 9 (3%) were in Partial Remission (PR), 40 (14%) had progressive disease, 29 (10%) were classified as having stable disease (following therapy), and 68 (24%) were untreated. Since the IWG criteria had been developed to classify disease response to therapy, their use in untreated patients is not appropriate, and the concept of MRD (following treatment) is not applicable. Further, patients without identifiable cytogenetic abnormalities at diagnosis generally have been considered as non-informative for cytogenetic assessment at HCT [9,16]. In order to account for those factors, we decided to use the term “Minimal Identifiable Disease” (MID) for pre-HCT disease stage classification of patient with less than 5% marrow blasts. Patients having 5% or more marrow blasts by morphology were defined as NO-CR. Thus, patients in PR by IWG response criteria were considered in the NO-CR group. Among the 221 patients (76%) with less than 5% marrow blasts at HCT, regardless of induction treatment received, we distinguished two groups, MID positive and MID negative. The criterion for MID positivity was the presence of an identifiable clonal cytogenetic abnormality by conventional cytogenetic studies [17] or by Fluorescence In Situ Hybridization (FISH), or, alternatively, the presence of a positive MFC test. Of note, FISH yielded a positive result only in 3 patients with normal cytogenetics. All other abnormal FISH results were observed in patients with abnormal cytogenetics. Despite the different sensitivity level of the two techniques, we decided to consider patients with isolated FISH positive results in the MID positive group. We defined as MID negative, patients with less than 5% marrow blasts and no cytogenetic, FISH, or MFC abnormalities (Table 3). We collected data on conventional cytogenetics performed at diagnosis and at the time of HCT using standard G-banding karyotype analysis on 20 metaphases at the Seattle Cancer Care Alliance (SCCA) Cytogenetics laboratory. One patient with isolated deletion Y was not included in the MID analysis. FISH was performed at SCCA according to standard procedures [16]. MFC methods for minimal disease detection rely on the immunophenotypic deviation of malignant cells from normal hematopoietic maturation and, hence, have a variable sensitivity that, for myeloid neoplasms, ranges from 0.1% to 0.001% of leukocytes [18–20]. Data for low- and high-intensity conditioning subgroups are summarized in Table 1.
Table 3.
MID classification at HCT
| Disease status | Definition | Patients (%) |
|---|---|---|
| NO-CR | 5% or more marrow blasts by morphology on marrow aspirate smear | 68 (23.5) |
| MID negative | Less than 5% marrow blasts and no cytogenetics, FISH, or MFC abnormalities | 65 (22.5) |
| MID positive | Less than 5% marrow blasts and cytogenetics, FISH, or MFC abnormalities | 154 (53.3) |
| Unknown | Less than 5% marrow blasts and cytogenetics, FISH, or MFC results not available | 2 (0.7) |
Abbreviations: MID = minimal identifiable disease; HCT = hematopoietic cell transplantation; CR = complete remission; FISH = Fluorescence In Situ Hybridization; MFC = multicolor flow cytometry.
Statistical Analysis
Kaplan-Meier estimates were used to determine the unadjusted probabilities of overall survival (OS) and relapse-free survival (RFS) for the listed categories, and cumulative incidence estimates were used to summarize the probabilities of relapse and NRM, where NRM was regarded a competing risk for relapse, and relapse a competing risk for NRM. The risk of overall mortality was compared between the MID groups using Cox regression. We used a forward stepwise method to select the variables for our model. Candidate variables included patient age, gender, WHO 2008 MDS classification [21], performance status at diagnosis (ECOG), secondary MDS, IPSS-R at diagnosis, time from diagnosis to HCT, IWG 2006 disease status at HCT [15], pre-HCT evolution to AML, stem cell source, pre-HCT treatments (induction chemotherapy given as first line treatment or as salvage, hypomethylating agents only, no therapy, or other). The MID status and conditioning intensity were not included in the stepwise selection as they were to be included in the model regardless. Due to the limited number of events we restricted the final model to include only MID (4 groups), conditioning intensity, pre-HCT evolution to AML, and pre-HCT treatments, as the other factors had little or no impact on the magnitude of the effects due to MID and conditioning.
Of particular interest was the potential interaction between MID and conditioning intensity, and appropriate interaction terms were included in regression models for assessment. Given that power to detect statistically significant interactions is less than that to detect main effects (the main effect being MID status), we considered interaction p-values less than 0.15 as worthy of further investigation. No adjustments were made for multiple comparisons, and all the two-sided p values from the regression models were derived from the Wald test.
Results
Overall Outcome
Patient characteristics are summarized in Table 1. Overall, 149 patients (51.6%) had died by the time of last contact, including 93 patients (32.2%) who had relapsed. Fifty-six patients (19.4%) died from non-relapse causes. This resulted in 3-year estimates of OS (Figure 1), RFS, relapse, and NRM of 51%, 46%, 37%, and 18%, respectively. Median follow-up among the 140 survivors was 52.4 months (range, 3.5–120.6), and the median OS was 37.3 months. Among the 15 surviving patients who relapsed, 6 received a second HCT as salvage.
Figure 1. Overall survival of all patients.
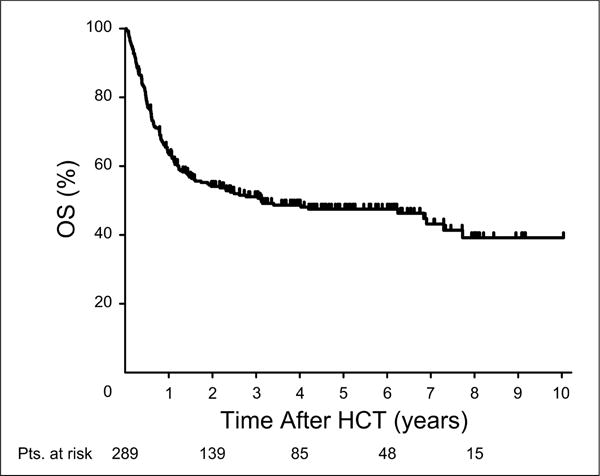
Abbreviations: OS = overall survival; HCT = hematopoietic cell transplantation.
Grades II–IV acute GVHD occurred in 188 (68.2%) of 276 evaluable patients, and 38 patients (14%) had grades III–IV disease. Chronic GVHD occurred in 135 (54%) of 249 evaluable patients.
MID, Conditioning Intensity, and Mortality
We utilized both MFC and cytogenetics (including FISH) as indicators of MID to assess the association between MID and overall mortality and studied 4 groups: positive MFC/positive cytogenetics, positive MFC/negative cytogenetics, negative MFC/positive cytogenetics, and negative MFC/negative cytogenetics). Results that summarize the comparison of these groups after adjusting for the factors detailed above are shown in Table 4. These results suggested that both MFC and cytogenetics contributed information to the association of MID with the risk of overall mortality.
Table 4.
Multivariable regression model for Overall Survival considering MID and conditioning regimens
| Group | Covariate | HR | 95% CI | p-value |
|---|---|---|---|---|
| MID MFC+/Cyto+ | Conditioning Intensity | |||
| N 75; events 43 | Low | 1.67 | 0.89 – 3.13 | 0.11 |
|
| ||||
| High (Baseline) | ||||
|
| ||||
| MID MFC+/Cyto− | Conditioning Intensity | |||
| N 40; events 21 | Low | 1.00 | 0.39 – 2.60 | 0.99 |
|
| ||||
| High (Baseline) | ||||
|
| ||||
| MID MFC−/Cyto+ | Conditioning Intensity | |||
| N 38; events 14 | Low | 7.23 | 2.38 – 22.00 | <0.001 |
|
| ||||
| High (Baseline) | ||||
|
| ||||
| MID MFC−/Cyto− | Conditioning Intensity | |||
| N 65; events 26 | Low | 0.99 | 0.45 – 2.16 | 0.98 |
|
| ||||
| High (Baseline) | ||||
|
| ||||
|
HIGH intensity N 138; events 58 |
MID | |||
| MFC−/Cyto− (Baseline) | ||||
|
| ||||
| MFC+/Cyto+ | 1.98 | 1.00 – 3.92 | 0.05 | |
|
| ||||
| MFC+/Cyto− | 1.44 | 0.69 – 2.99 | 0.33 | |
|
| ||||
| MFC−/Cyto+ | 0.67 | 0.24 – 1.92 | 0.46 | |
|
| ||||
|
LOW intensity N 80; events 46 |
MID | |||
| MFC−/Cyto− (Baseline) | ||||
| MFC+/Cyto+ | 3.33 | 1.58 – 7.03 | <0.01 | |
| MFC+/Cyto− | 1.61 | 0.60 – 4.36 | 0.34 | |
|
| ||||
| MFC−/Cyto+ | 4.90 | 1.98 – 12.09 | <0.001 | |
The model is adjusted for pre-HCT evolution to AML, pre-HCT treatments (induction chemotherapy given as first line treatment or as salvage, hypomethylating agents only, no therapy, or other), MID, and conditioning intensity.
Abbreviations: HR = hazard ratio; CI = confidence intervals; MID = minimal identifiable disease; MFC = multiparameter flow cytometry; Cyto = cytogenetics; HCT = hematopoietic cell transplant.
While the above results indicated an association between MID status and the risk of mortality, there was evidence that the impact of MID on overall mortality was different if patients were conditioned with a high-intensity regimen compared to low-intensity conditioning. As shown in Table 1, cytogenetic risk (by IPSS-R criteria) at diagnosis and at HCT was equally distributed between the two conditioning intensity groups. A statistical test of interaction between intensity and MID status (4 groups, as defined above) yielded p=.02, suggesting that the difference in mortality between MID groups was not the same across conditioning regimens, or, similarly, that the difference in mortality between high- and low-intensity conditioning was not the same across the 4 MID groups (Table 4). These results suggested that among patients who received a low-intensity conditioning regimen, the impact of a positive marker for MID by cytogenetics was more detrimental than the presence of such a marker among patients who received a high-intensity regimen. The results also suggested that patients who were MID-negative by cytogenetics had a similar risk of mortality if conditioned with low-intensity or high-intensity regimens, while patients who were MID-positive by cytogenetics and were conditioned with a low-intensity regimen had a higher risk of mortality than patients conditioned with a high-intensity regimen (Figure 2). The 3 patients with isolated FISH positivity in the MID positive group did not allow for a separate analysis. Exclusion of those 3 patients from the overall analysis did not impact results (Data not shown).
Figure 2. Overall survival by MID subgroups.

A. High intensity conditioning patients. B. Low intensity conditioning patients. Abbreviations: OS = overall survival; HCT = hematopoietic cell transplantation; MID = minimal identifiable disease; MFC = multiparameter flow cytometry; Cyto = cytogenetics.
Impact of MID and Conditioning Intensity on Relapse
Results on impact of MID and conditioning intensity on relapse yielded the same qualitative conclusion as those for overall mortality (Supplemental Table S2). A test for an interaction between conditioning and MID yielded p=.10, where patients who were MID-positive by cytogenetics had a higher risk of relapse if they received a low-intensity regimen compared to a high-intensity regimen. However, low-intensity regimens were associated with a higher risk of relapse than high-intensity regimens for each of the MID groups, although the difference did not reach statistical significance.
Impact of MID and Conditioning Intensity on NRM
NRM did not differ across the levels of conditioning intensity, with an interaction p-value of p=0.45. However, with few NRM events occurring (N=38) the power to detect even suggestive interactions was very limited (Supplemental Table S3).
Discussion
In contrast to AML [22], data on the utility of MRD in patients with MDS as an HCT risk marker are limited [20]. In AML Chen et al. showed that the impact of unfavorable cytogenetics or the presence of FLT3-internal tandem duplication lost its statistical significance after adjusting for post-induction parameters as well as peripheral count recovery and MRD. However, AML and MDS are different diseases; more than 60% of MDS patients in the present analysis did not receive high-dose cytotoxic chemotherapy before HCT. Therefore, the impact of MRD, as defined for AML, may differ in patients with MDS.
A major question in our analysis was how to weigh discordant MID results by cytogenetics/FISH versus MFC. Studies in AML reported discordant results in 22% of 424 evaluable patients [16]. The rate of discordant results among the 221 evaluable patients in the current study was, similarly, 22.2%. Conventional cytogenetics have limited sensitivity, which may explain the absence/non-detection of previously present cytogenetic abnormalities in patients with positive MFC results. The reverse finding, positive cytogenetics/FISH results and negative MFC, in view of the high sensitivity of MFC, is more likely to be related to the absence of immunophenotypic markers. Further methodologic improvements are desirable.
The current results were consistent with previous reports that showed an increased risk of mortality in patients with MRD detected by either MFC or cytogenetics [16]. In addition, however, the current results showed differences in outcome between MID groups, dependent on whether patients were conditioned with low- (non-myeloablative) or high-intensity (myeloablative) regimens. We stratified conditioning regimens into low- or high-intensity groups according to the 2006 Reduced-Intensity Conditioning Regimen Workshop convened by the Center for International Blood and Marrow Transplant Research (CIBMTR) [23]. The impact of conditioning intensity varied according to MID status, where patients positive for MID as determined by cytogenetics, had a higher risk of mortality if conditioned with a low-intensity regimen as compared to a high-intensity regimen.
Most noteworthy was the observation that for patients who were negative for MID by both MFC and cytogenetics, a low-intensity conditioning regimen was as effective as a high-intensity regimen in preventing relapse, and overall survival was similar, even though patients treated with low-intensity conditioning were significantly older and had a longer interval between diagnosis and HCT than the remaining patients. This outcome suggests that a subgroup of patients usually treated with high-intensity conditioning can benefit from a less toxic low-intensity conditioning. This is important considering that the median age of MDS patients at diagnosis is 70 – 75 years, and comorbidities are prevalent [24]. Our results also support the conclusion that MID has a more profound impact on outcome among patients who receive low-intensity conditioning than among those who receive high-intensity conditioning. This outcome is distinctly different from observations in patients with AML, where the impact of MRD positivity appeared to be independent from conditioning intensity [11]. Therefore, our data suggest that MDS patients who are MID positive by cytogenetics should be conditioned with a high-intensity regimen, while this may not be beneficial in MID negative patients, in whom the focus should be on reducing NRM.
Results of the present analysis do not invalidate previously published data on the impact of prognostic scores [25–29], particularly the IPSS-R, which gives more weight to the presence of cytogenetic abnormalities [30]. However, our analysis was adjusted for those factors and, thus, adds a refinement to risk assessment. Further, it incorporates the impact of the transplant conditioning regimen, which is not a factor in non-transplanted patients for whom IPSS and IPSS-R were originally developed.
Our study has some limitations. First, as in all retrospective studies, patients were not assigned to the conditioning intensity group in a randomized fashion, and a selection bias cannot be excluded. Second, the numbers of patients in some subgroups, based on MID status and conditioning intensity, were small, making it difficult to draw more definitive conclusions. Third, our data do not allow to draw conclusions regarding the impact of isolated FISH positivity (normal cytogenetics) at pre-HCT evaluation.
In summary, MID by cytogenetics appears to be a powerful predictor of post-HCT outcome after low-intensity conditioning HCT. High-intensity conditioning was able to overcome the profound prognostic impact of MID. We propose to include MID in the risk classification of patients with MDS who are being considered for HCT. Finally, the recent identification with genomic technologies of molecular abnormalities such as mutations in TET2, DNMT3A, RUNX1, ASXL1, EHZ2, ETV6 and TP53 [31,32], which influence survival in non-transplanted patients and, presumably, after HCT, will likely increase our ability of MID and MRD detection and monitoring, once available in clinical practice. Together with the refinement of cytogenetic classification, the HCT-CI, and the newly identified somatic mutations, the MID classification will affect the decision on transplant procedures and, as a result, should improve HCT outcomes in MDS patients.
Supplementary Material
Highlights.
Minimal Identifiable Disease (MID) was assessed by cytogenetics and flow cytometry
MID status at transplant had significant impact on post-transplant outcome
MID-positive patients by cytogenetics had inferior outcome with low intensity conditioning
MID-negative patients had similar outcome with high intensity and low intensity conditioning
Acknowledgments
We thank and Elizabeth Soll and Peg Boyle for updating and maintaining the data base, all physicians and physician assistants involved in the clinical care of patients transplanted at our Center, the referring physicians, and all patients who agreed to participate in clinical research. We thank Bonnie Larson and Helen Crawford for their help with manuscript preparation. We thank Dr. Elihu Estey, Roland B. Walter, Benedetto Bruno, and Mario Boccadoro for their suggestions and support throughout this project.
From 2004 to 2006 MFC analyses were performed by Hematologics Inc, Seattle, WA.
This work was supported in part by the National Institutes of Health (grants HL084054, HL36444, CA18029, CA15704, and HL088021). The content of this publication does not necessarily reflect the views or policies of the Department of Health and Human Services, nor does mention of trade names, commercial products, or organizations imply endorsement by the US government.
Footnotes
Publisher's Disclaimer: This is a PDF file of an unedited manuscript that has been accepted for publication. As a service to our customers we are providing this early version of the manuscript. The manuscript will undergo copyediting, typesetting, and review of the resulting proof before it is published in its final citable form. Please note that during the production process errors may be discovered which could affect the content, and all legal disclaimers that apply to the journal pertain.
Authors’ Contributions: M.F., H.J.D., and B.L.S. designed the study. M.F. collected and assembled data. M.F., H.J.D., T.A.G., K.B., B.L.W., M.Fa., B.M.S., and B.L.S. analyzed and interpreted data. H.J.D. and B.L.S. provided study material or patients. M.F., H.J.D., T.A.G., K.B., B.L.W., M.Fa., B.M.S., and B.L.S. wrote the manuscript.
Authors’ Disclosures of Potential Conflicts of Interest
Moreno Festuccia
No relationship to disclose
H. Joachim Deeg
Consulting or Advisory Role: MEDAC
Research Funding: MEDAC
Travel, Accommodations, Expenses: MEDAC
Theodore A. Gooley
No relationship to disclose
Kelsey Baker
No relationship to disclose
Brent L. Wood
Honoraria: Abbvie, Seattle Genetics
Consulting or Advisory Role: Abbvie, Seattle Genetics
Research Funding: Seattle Genetics, Amgen, Coronado, Pfizer
Travel, Accommodations, Expenses: Abbvie, Seattle Genetics
Min Fang
Research Funding: Affymetrix (Inst)
Brenda M. Sandmaier
Stock or Other Ownership: Blaze Bioscience (I), EpiThany (I)
Honoraria: Gilliad, ArevaMed, Jazz Pharmaceuticals; Seattle Genetics
Consulting or Advisory Role: Frazier (I)
Research Funding: Ambit, Bellicum
Patents, Royalties, Other Intellectual Property: Gilliad(I)
Bart L. Scott
No relationship to disclose
References as of 02-10-2016
- 1.Malcovati L, Hellstrom-Lindberg E, Bowen D, et al. Diagnosis and treatment of primary myelodysplastic syndromes in adults: recommendations from the European LeukemiaNet. Blood. 2013;122:2943–2964. doi: 10.1182/blood-2013-03-492884. [DOI] [PMC free article] [PubMed] [Google Scholar]
- 2.Laport GG, Sandmaier BM, Storer BE, et al. Reduced-intensity conditioning followed by allogeneic hematopoietic cell transplantation for adult patients with myelodysplastic syndrome and myeloproliferative disorders. Biol Blood Marrow Transplant. 2008;14:246–255. doi: 10.1016/j.bbmt.2007.11.012. [DOI] [PMC free article] [PubMed] [Google Scholar]
- 3.Ma X, Does M, Raza A, Mayne ST. Myelodysplastic syndromes: incidence and survival in the United States. Cancer. 2007;109:1538–1542. doi: 10.1002/cncr.22570. [DOI] [PubMed] [Google Scholar]
- 4.Martino R, Iacobelli S, Brand R, et al. Retrospective comparison of reduced-intensity conditioning and conventional high-dose conditioning for allogeneic hematopoietic stem cell transplantation using HLA-identical sibling donors in myelodysplastic syndromes. Blood. 2006;108:836–846. doi: 10.1182/blood-2005-11-4503. [DOI] [PubMed] [Google Scholar]
- 5.de Witte T, Hermans J, Vossen J, et al. Haematopoietic stem cell transplantation for patients with myelo-dysplastic syndromes and secondary acute myeloid leukaemias: a report on behalf of the Chronic Leukaemia Working Party of the European Group for Blood and Marrow Transplantation (EBMT) Br J Haematol. 2000;110:620–630. doi: 10.1046/j.1365-2141.2000.02200.x. [DOI] [PubMed] [Google Scholar]
- 6.Deeg HJ, Storer B, Slattery JT, et al. Conditioning with targeted busulfan and cyclophosphamide for hemopoietic stem cell transplantation from related and unrelated donors in patients with myelodysplastic syndrome. Blood. 2002;100:1201–1207. doi: 10.1182/blood-2002-02-0527. [DOI] [PubMed] [Google Scholar]
- 7.Luger SM, Ringdén O, Zhang M-J, et al. Similar outcomes using myeloablative vs reduced-intensity allogeneic transplant preparative regimens for AML or MDS. Bone Marrow Transplant. 2012;47:203–211. doi: 10.1038/bmt.2011.69. [DOI] [PMC free article] [PubMed] [Google Scholar]
- 8.Scott BL, Pasquini MC, Logan B, et al. Results of a phase III randomized, multi-center study of allogeneic stem cell transplantation after high versus reduced intensity conditioning in patients with myelodysplastic syndrome (MDS) or acute myeloid leukemia (AML): Blood and Marrow Transplant Clinical Trials Network (BMT CTN) 0901. Blood. 2015 https://ash.confex.com/ash/2015/webprogram/Paper87386.html-(LBA-8) [abstr.]
- 9.Walter RB, Gooley TA, Wood BL, et al. Impact of pretransplantation minimal residual disease, as detected by multiparametric flow cytometry, on outcome of myeloablative hematopoietic cell transplantation for acute myeloid leukemia. J Clin Oncol. 2011;29:1190–1197. doi: 10.1200/JCO.2010.31.8121. [DOI] [PMC free article] [PubMed] [Google Scholar]
- 10.Gokbuget N, Kneba M, Raff T, et al. Adult patients with acute lymphoblastic leukemia and molecular failure display a poor prognosis and are candidates for stem cell transplantation and targeted therapies. Blood. 2012;120:1868–1876. doi: 10.1182/blood-2011-09-377713. [DOI] [PubMed] [Google Scholar]
- 11.Walter RB, Gyurkocza B, Storer BE, et al. Comparison of minimal residual disease as outcome predictor for AML patients in first complete remission undergoing myeloablative or nonmyeloablative allogeneic hematopoietic cell transplantation. Leukemia. 2015;29:137–144. doi: 10.1038/leu.2014.173. [DOI] [PMC free article] [PubMed] [Google Scholar]
- 12.Paganin M, Fabbri G, Conter V, et al. Postinduction minimal residual disease monitoring by polymerase chain reaction in children with acute lymphoblastic leukemia. J Clin Oncol. 2014;32:3553–3558. doi: 10.1200/JCO.2014.56.0698. [DOI] [PubMed] [Google Scholar]
- 13.Ladetto M, Bruggemann M, Monitillo L, et al. Next-generation sequencing and real-time quantitative PCR for minimal residual disease detection in B-cell disorders. Leukemia. 2014;28:1299–1307. doi: 10.1038/leu.2013.375. [DOI] [PubMed] [Google Scholar]
- 14.Baron F, Baker JE, Storb R, et al. Kinetics of engraftment in patients with hematologic malignancies given allogeneic hematopoietic cell transplantation after nonmyeloablative conditioning. Blood. 2004;104:2254–2262. doi: 10.1182/blood-2004-04-1506. [DOI] [PubMed] [Google Scholar]
- 15.Cheson BD, Greenberg PL, Bennett JM, et al. Clinical applications and proposal for modification of the International Working Group (IWG) response criteria in myelodysplasia. Blood. 2006;108:419–425. doi: 10.1182/blood-2005-10-4149. [DOI] [PubMed] [Google Scholar]
- 16.Fang M, Storer B, Wood B, Gyurkocza B, Sandmaier BM, Appelbaum FR. Prognostic impact of discordant results from cytogenetics and flow cytometry in patients with acute myeloid leukemia undergoing hematopoietic cell transplantation. Cancer. 2012;118:2411–2419. doi: 10.1002/cncr.26539. [DOI] [PMC free article] [PubMed] [Google Scholar]
- 17.International Standing Committee on Human Cytogenetic Nomenclature. ISCN 2013: An International System for Human Cytogenetic Nomenclature. Basel: Karger; 2013. [Google Scholar]
- 18.Wood BL. Myeloid malignancies: myelodysplastic syndromes, myeloproliferative disorders, and acute myeloid leukemia (Review) Clin Lab Med. 2007;27:551–575. doi: 10.1016/j.cll.2007.05.006. [DOI] [PubMed] [Google Scholar]
- 19.Wood B. 9-color and 10-color flow cytometry in the clinical laboratory. Archives of Pathology & Laboratory Medicine. 2006;130:680–690. doi: 10.5858/2006-130-680-CACFCI. [DOI] [PubMed] [Google Scholar]
- 20.Scott BL, Wells DA, Loken MR, Myerson D, Leisenring WM, Deeg HJ. Validation of a flow cytometric scoring system as a prognostic indicator for posttransplantation outcome in patients with myelodysplastic syndrome. Blood. 2008;112:2681–2686. doi: 10.1182/blood-2008-05-153700. [DOI] [PMC free article] [PubMed] [Google Scholar]
- 21.Vardiman JW, Thiele J, Arber DA, et al. The 2008 revision of the World Health Organization (WHO) classification of myeloid neoplasms and acute leukemia: rationale and important changes. Blood. 2009;114:937–951. doi: 10.1182/blood-2009-03-209262. [DOI] [PubMed] [Google Scholar]
- 22.Chen X, Xie H, Wood BL, et al. Relation of clinical response and minimal residual disease and their prognostic impact on outcome in acute myeloid leukemia. J Clin Oncol. 2015 doi: 10.1200/JCO.2014.58.3518. Epub ahead of print. [DOI] [PubMed] [Google Scholar]
- 23.Gyurkocza B, Sandmaier BM. Conditioning regimens for hematopoietic cell transplantation: one size does not fit all. Blood. 2014;124:344–353. doi: 10.1182/blood-2014-02-514778. [DOI] [PMC free article] [PubMed] [Google Scholar]
- 24.Sorror ML, Sandmaier BM, Storer BE, et al. Comorbidity and disease status-based risk stratification of outcomes among patients with acute myeloid leukemia or myelodysplasia receiving allogeneic hematopoietic cell transplantation. J Clin Oncol. 2007;25:4246–4254. doi: 10.1200/JCO.2006.09.7865. [DOI] [PubMed] [Google Scholar]
- 25.Naqvi K, Garcia-Manero G, Sardesai S, et al. Association of comorbidities with overall survival in myelodysplastic syndrome: development of a prognostic model. J Clin Oncol. 2011;29:2240–2246. doi: 10.1200/JCO.2010.31.3353. [DOI] [PMC free article] [PubMed] [Google Scholar]
- 26.Greenberg P, Cox C, LeBeau MM, et al. International scoring system for evaluating prognosis in myelodysplastic syndromes [erratum appears in Blood 1998 Feb 1;91(3):1100] Blood. 1997;89:2079–2088. [PubMed] [Google Scholar]
- 27.Della Porta MG, Alessandrino EP, Bacigalupo A, et al. Predictive factors for the outcome of allogeneic transplantation in patients with MDS stratified according to the revised IPSS-R. Blood. 2014;123:2333–2342. doi: 10.1182/blood-2013-12-542720. [DOI] [PubMed] [Google Scholar]
- 28.Deeg HJ, Scott BL, Fang M, et al. Five-group cytogenetic risk classification, monosomal karyotype, and outcome after hematopoietic cell transplantation for MDS or acute leukemia evolving from MDS. Blood. 2012;120:1398–1408. doi: 10.1182/blood-2012-04-423046. [DOI] [PMC free article] [PubMed] [Google Scholar]
- 29.Gauthier J, Amaj G, Anglois C, et al. Contribution of revised International Prognostic Scoring System cytogenetics to predict outcome after allogeneic stem cell transplantation for myelodysplastic syndromes: A study from the French Society of Bone Marrow Transplantation and Cellular Therapy. Transplantation. 2015 doi: 10.1097/TP.0000000000000649. [Epub ahead of print] [DOI] [PubMed] [Google Scholar]
- 30.Greenberg PL, Tuechler H, Schanz J, et al. Revised international prognostic scoring system for myelodysplastic syndromes. Blood. 2012;120:2454–2465. doi: 10.1182/blood-2012-03-420489. [DOI] [PMC free article] [PubMed] [Google Scholar]
- 31.Bejar R, Stevenson K, Abdel-Wahab O, et al. Clinical effect of point mutations in myelodysplastic syndromes. N Engl J Med. 2011;364:2496–2506. doi: 10.1056/NEJMoa1013343. [DOI] [PMC free article] [PubMed] [Google Scholar]
- 32.Bejar R, Stevenson KE, Caughey B, et al. Somatic mutations predict poor outcome in patients with myelodysplastic syndrome after hematopoietic stem-cell transplantation. J Clin Oncol. 2014;32:2691–2698. doi: 10.1200/JCO.2013.52.3381. [DOI] [PMC free article] [PubMed] [Google Scholar]
Associated Data
This section collects any data citations, data availability statements, or supplementary materials included in this article.