Abstract.
Quantification of sun-related changes in conjunctival ultraviolet autofluorescence (CUVAF) images is a subjective and tedious task, in which reproducibility of results is difficult. Thus, we have developed a semiautomatic method in MATLAB® to analyze CUVAF images retrospectively. The algorithm was validated on 200 images from 50 randomly selected participants from the Western Australian Pregnancy Cohort (Raine) study 20-year follow-up assessment, in which CUVAF area measurements were available from previous manual analysis. Algorithm performance was compared to manual measurements and yielded better than 95% correspondence in both intra- and interobserver agreement. Furthermore, the semiautomatic method significantly reduced analysis time by 50%.
Keywords: image processing, photography, sunlight, ophthalmohelioses
1. Introduction
Conjunctival ultraviolet autofluorescence (CUVAF) photography was developed based on the principle of Wood’s light used in dermatology to detect and characterize preclinical ocular sunlight-induced changes on the conjunctiva.1,2 A pilot study on school-aged children demonstrated that CUVAF was a more sensitive method of detecting precursors of ocular sun damage than traditional reflected visible light (control) photography. As precursors of sun damage occur years before clinical manifestation of sunlight-associated ophthalmic disease, early detection could be a key step in prevention of ophthalmohelioses.1 Furthermore, the area of CUVAF has been found to be highly correlated with time spent outdoors, suggesting that CUVAF could be used as an objective marker for sun exposure.3 CUVAF photography has since been used in studies to explore the epidemiology and pathogenesis of ophthalmohelioses as well as the association between sun exposure and other eye disorders.
In a study led by Ooi et al.,4 ultraviolet (UV) fluorescence patterns of pterygia were described using CUVAF photography, furthering our understanding of pterygium pathophysiology. In 2011, the first quantifiable estimates of CUVAF in the general population were reported as part of the Norfolk Island Eye Study. The aim of the study was to determine the relationship among age, gender, and CUVAF in an adult population study, using CUVAF as a clinical marker of facial UV exposure.5 Other studies have investigated the association between area of CUVAF and established ophthalmic disease such as pterygium and refractive error. Increasing CUVAF is associated with prevalent pterygia in both the adult population and the young adult population.6,7 In contrast, myopia in young adults is inversely correlated to the amount of CUVAF.3,8 These studies were conducted in Australia and Norfolk Island, where the level of exposure to UV radiation is high due to an outdoor lifestyle, relatively low latitudes, and subtropical climate.9 A similar study using CUVAF photography was conducted in the United Kingdom to investigate the prevalence of CUVAF in a diverse population of European and Middle Eastern eye care practitioners.10
The CUVAF area was quantified using Adobe Photoshop CS4 Extend (Adobe Systems Inc., San Jose, California) in the Australian studies5–8,11 and ImageJ (US National Institute of Health, Bethesda, Maryland) in the United Kingdom study.10 For each photograph, the region of CUVAF was manually delineated by an assessor, requiring great attention to detail and a steady hand. Once the area was defined, the area was converted to using a calibration factor determined by photographing a ruler with the same camera system. Although the reliability of this method has been validated,2 it is inherently subjective, tedious, and prone to human error. Furthermore, the marked images were not saved, making retrospective review of the CUVAF region impossible.
The aim of this study was to develop and validate the reliability of a semiautomatic method for CUVAF analysis and to determine whether it could replace the current manual method. Ideally, if both the area measurements and saved images showing manual delineation of the CUVAF region were available, it might be possible to utilize a machine-learning technique to develop a fully automatic algorithm to eliminate subjectivity. However, as only area measurements were available, an algorithm for semiautomatic CUVAF quantification is proposed.
2. Methods
2.1. Retrospective Data
Data for this validation were derived from the Raine study 20-year follow-up assessment, in which CUVAF images were previously measured using the manual method. Full details of the study can be found in a previous publication.11 In brief, 1344 individuals were enrolled in the 20-year follow-up study and completed a comprehensive eye assessment, which included the acquisition and analysis of CUVAF photographs as described in Ref. 11. Written informed consent was obtained from all participants prior to the examinations. The study obtained ethics approval from the Human Research Ethics Committee at the University of Western Australia and adhered to the Declaration of Helsinki.
CUVAF images from 50 participants (total of 200 images) were randomly selected from the Raine study to validate the algorithm. Two assessors (E.H. and D.M.B.) analyzed these images using the proposed algorithm (see Sec. 2.2). Both assessors were given an inclusion criterion to define what constitutes a CUVAF region. The results from each assessor were compared with the existing manual measurements to determine whether the manual and semiautomatic methods for CUVAF analysis could be used interchangeably. Furthermore, intra- and interobserver reliabilities were also evaluated for the semiautomatic method. The Bland–Altman test was used to assess the level of agreement between each dataset, in which the limits of agreement (LOA) were defined as standard deviation (SD).12,13
2.2. Algorithm
The algorithm for semiautomatic quantification of sun-related changes in CUVAF images was implemented in MATLAB® 2011b. A Graphic User Interface (GUI) was designed to allow users to interact with the algorithm to assist defining the CUVAF regions. The measured areas, delineated images, and parameters required to reproduce the results were automatically saved in the process. The source code and executable can be found in Ref. 14.
2.2.1. Preprocessing
CUVAF digital images often need to be adjusted to enable assessors to see signs of sun-related changes. To ensure no bias was introduced in the process, all images were preprocessed as follows. Images were resized by a factor of 0.5 to reduce processing time and the red channel was removed to reduce the effects of red/white light artifacts arising from the reflection of the camera flash off the surface of the eye. To enhance the brightness and contrast of the images, the tolerance values to saturate 2% of the darkest pixels and 1% of the brightest pixels in the blue channel were determined using “stretchlim.” This tolerance value was used as an argument for the contrast stretching function “imadjust” that was applied to the green and blue channels. The preprocessed RGB image was reconstructed by concatenating a zeroed red channel with the modified green and blue channels, which were converted to grayscale for analysis. An example of a preprocessed image for the selection of the region of interest (ROI) is shown in Fig. 1(b).
Fig. 1.
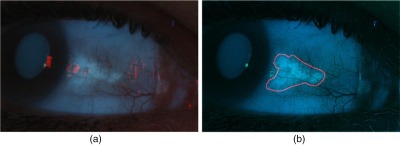
(a) Original image and (b) preprocessed image with user-defined ROI shown in red.
2.2.2. Region of interest selection
If CUVAF is present, the ROI is defined by the assessor by roughly marking the region of UV-induced autofluorescence using “roipoly.” As the algorithm can be confounded by imaging artifacts, these should be excluded from the ROI. A binary mask was created from the ROI and applied to the grayscale image. The coordinates of the ROI are automatically saved in the excel spreadsheet.
2.2.3. Local thresholding
Due to the presence of uneven illumination in CUVAF photographs, a local thresholding method is used to segment the CUVAF regions from the ROI in the masked grayscale image. As the amount of CUVAF in each photograph is highly variable in a population, having a fixed window size to process all images would not be effective in cases in which the CUVAF region is much larger or smaller than the window. Therefore, we chose to define a square window for local thresholding that is adapted to the size of the CUVAF region, by making it approximately equal to 15% of the ROI area (), where the width is determined as follows
| (1) |
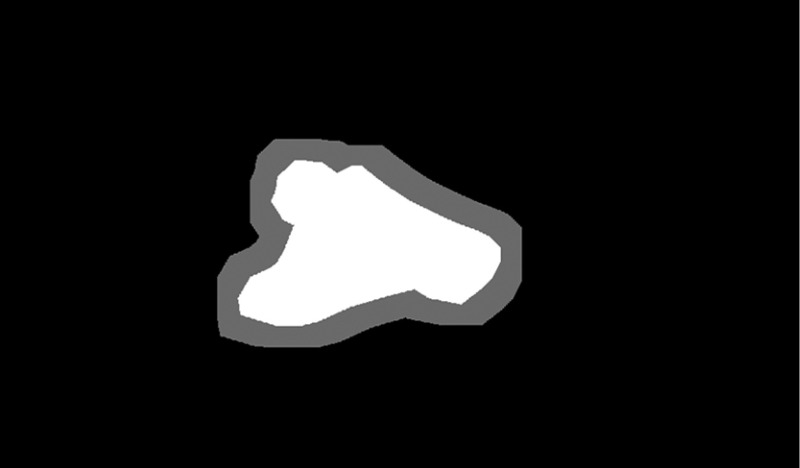
A sliding window approach is used to segment the CUVAF region in the ROI, where the center is shifted at steps equal to 1/3 the width across the grayscale image to allow overlap. To ensure the edges of the potential CUVAF regions are not underrepresented from overlapping the windows, a dilated ROI mask is created to discriminate between the ROI and its surrounding edge. The ROI mask is dilated by a factor equal to the step size, which is then added to the original ROI mask, such that the pixels representing the original mask have a value of 2, and the dilated edges, a value of 1 (Fig. 2). The original window size is used for thresholding regions on the mask with a value of 2, whereas a window a quarter of the size of the original was used for edge regions with value 1. Reducing the window size at the edges helps to preserve local details and as well as to better distinguish CUVAF from the background as the local region under scrutiny is more likely to contain an even proportion of CUVAF and background.
Fig. 2.
Example of the dilated mask used to distinguish the edges of the potential CUVAF regions. White regions (value 2) represent the ROI undergoing local thresholding with the original window size. Gray regions (value 1) represent the dilated ROI that are thresholded with a window, a quarter of the size of the original.
A modified version of Niblack’s local thresholding method15 is used to binarize each window. The local threshold () is calculated using Eq. (2), where and are the mean and SD of the intensity in the local window, respectively, and is a constant set as 0.5
| (2) |
Pixels with intensities greater than or equal to the local threshold are considered to represent sun-related changes and are given a value of 1, and 0 otherwise. After processing the whole image, the binarized local windows are summed together creating what we call the overlap map. An example of an overlap map is shown in Fig. 3(a), where colors are used to represent the number of times a pixel was identified as CUVAF by the local windows. The overlap map is smoothed with a Gaussian filter of dimensions equal to the sliding window step [Fig. 3(b)], to remove horizontal and vertical lines introduced from summing overlapping windows. Furthermore, smoothing the overlap map also “joins” any gaps in the affected regions such that the final result would be more similar to the results expected from the manual measurements. The overlap map image was multiplied with the dilated mask to remove any noise picked up from the local thresholding method. Small regions were also removed as they were deemed insignificant.
Fig. 3.

(a) Color map of the summed thresholded windows and (b) smoothed overlap map. The color bar shows the number of overlaps for each pixel.
2.2.4. Refining the conjunctival ultraviolet autofluorescence region
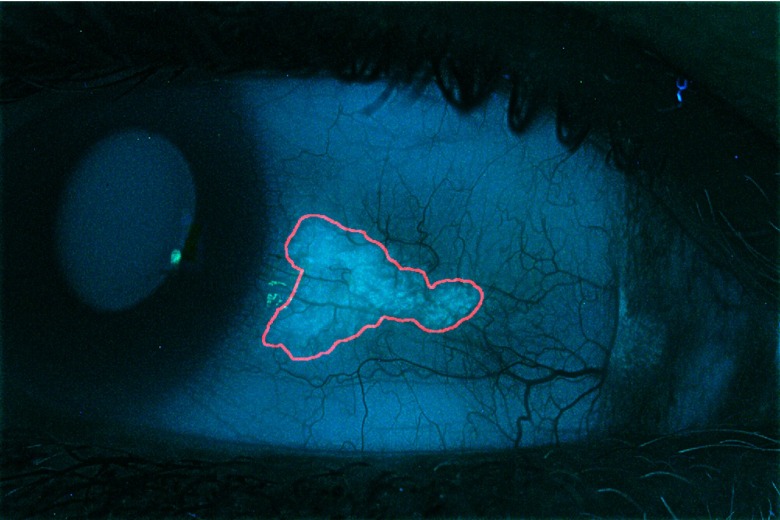
Pixels on the overlap map with a value greater or equal to the default overlap threshold of 1 are considered to represent CUVAF regions. The GUI allows the assessor to adjust the overlap threshold to refine the CUVAF region. If the assessor is not satisfied with any of the threshold values for the overlap map, the ROI can be redrawn to obtain a different overlap map. Increasing/decreasing the size of the ROI can change the distribution of values in the overlap map. The CUVAF region can also be refined by removing isolate regions. An example of the refined CUVAF region is shown in Fig. 4.
Fig. 4.
Output image of semiautomatic CUVAF analysis algorithm, where the CUVAF region is delineated in red.
2.2.5. Conjunctival ultraviolet autofluorescence area calculation
To determine the CUVAF area in , the number of pixels constituting the CUVAF region is counted. The number of pixels is then converted to using Eq. (3), where and represent the marked CUVAF area expressed in and number of pixels, respectively, and () is the calibration factor that has been adjusted according to the image resize factor in the preprocessing step
| (3) |
2.2.6. Saving data
A Microsoft excel spreadsheet containing information from CUVAF analysis is automatically created for each subject. The data are saved in a specific format, allowing for easy collation, using a macro written in visual basics for applications in Microsoft excel. In this spreadsheet, the measured area, as well as the parameters: resize factor, overlap threshold, window width ratio, area threshold filter, ROI coordinates, and coordinates of removed regions, are saved, enabling us to reproduce the marked image for retrospective review.
2.2.7. Graphic user interface
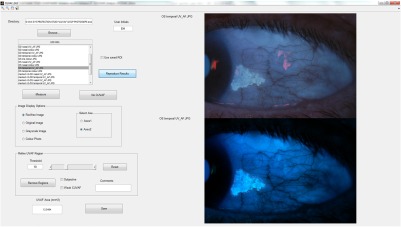
The GUI (Fig. 5) was developed to provide a convenient platform in which the assessor can access all CUVAF images for analysis, and have the results automatically saved. The GUI has functions that allow users to: (1) preview the preprocessed images; (2) change image display during CUVAF delineation (original, enhanced, grayscale, or color image); (3) identify assessor with initials; (4) flag images as subjective or weak CUVAF; (5) write comments on individual images; and (6) use a previously saved ROI or reproduce results for postanalysis modifications.
Fig. 5.
Screenshot of the GUI for CUVAF analysis.
3. Results
The algorithm and GUI provided an efficient method to access, measure, and save all data and was found to reduce analysis time by when compared to the manual method. The results of the Bland–Altman tests comparing the semiautomatic and the manual method for CUVAF measurement, as well as the reliability and validity of the semiautomatic method, are shown in Table 1 with the plots in Fig. 6.
Table 1.
Results of the Bland–Altman test comparing the semiautomatic and manual method, and the inter- and intraobserver reliabilities of the semiautomatic method.
| Type of comparison | Assessors | Mean (SD) difference () | 95% LOA () | % Agreement |
|---|---|---|---|---|
| Semiautomatic versus manual | 1A versus manual | (9.93) | to 11.36 | 96 |
| 2 versus manual | (11.83) | to 11.25 | 96 | |
| Interobserver | 1A versus 2 | (6.70) | to 9.29 | 96 |
| Intraobserver | 1A versus 1B | 0.72 (2.96) | to 6.53 | 98 |
Fig. 6.
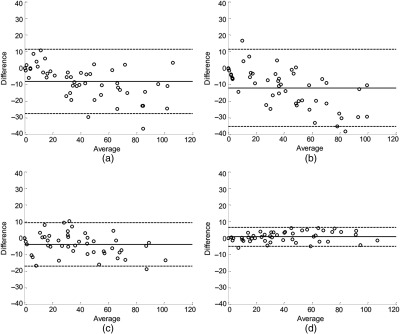
Bland–Altman plot of difference against mean CUVAF comparing: (a) assessor 1A and manual measurements, (b) assessor 2 and manual measurements, (c) assessors 1A and 2 (interobserver reliability), and (d) assessors 1A and 1B (intraobserver reliability). The solid lines represent the mean bias and the LOAs are shown by the dashed lines.
3.1. Manual Versus Semiautomatic Method for Conjunctival Ultraviolet Autofluorescence Analysis
Comparing the semiautomatic and manual method for CUVAF analysis, the LOA ranged from to 11.36 for assessor 1 and to 11.25 for assessor 2, with a mean bias of and , respectively (Table 1). The negative mean bias observed in the results of both assessors suggests that measurements made using the semiautomatic method yields a smaller CUVAF area than with the manual method. Both assessors using the semiautomatic method achieved 96% agreement with the manual method, where % agreement is the percentage of the points lying within their respective LOA. As over 95% agreement was attained, the semiautomatic and manual methods of quantifying CUVAF can be used interchangeably, provided that the observed difference would not impact clinical management.12 Looking at the Bland–Altman plots in Figs. 6(a) and 6(b), respectively, we note that there is a slight negative relationship between the measurement variability and range of CUVAF measurements. As the CUVAF area increases, there appears to be a larger negative difference between manual and semiautomatic method.
3.2. Interobserver Reliability Assessment
In an assessment of interobserver reliability between assessors 1A and 2 using the semiautomatic method, the LOA was found to range from to 9.29 with a mean bias of (6.70) (Table 1). The negative mean bias indicates that assessor 2 has a tendency to mark a slightly smaller CUVAF region than assessor 1. 96% agreement was achieved between the two assessors using the semiautomatic method. The Bland–Altman plot between assessors 1A and 2 [Fig. 6(c)] showed no significant change in interobserver variability for the range of measured CUVAF areas.
3.3. Intraobserver Reliability Assessment
In an assessment of intraobserver reliability, an agreement of 98% was achieved with a mean bias of 0.72 (2.96) and LOA ranging from to 6.53 from the measurements of assessor 1 at two different time points. As the Bland–Altman plot shows no significant change in intraobserver variability for the range of CUVAF measurements, and the mean difference is close to zero and LOA range is small, we conclude that measurements made using the semiautomatic method are repeatable.
4. Discussion
A previous study by Sherwin et al.2 looked at the inter- and intraobserver reliabilities and validity of quantifying CUVAF using the manual method. In their study, 196 photographs from 49 participants from the Norfolk Island Eye study were analyzed for interobserver reliability assessment, and 60 photographs (15 participants) for the intraobserver assessment. It was noted the LOA and mean bias increases with the number of images analyzed.2 Direct comparison of the results of the our study with the Sherwin study cannot be made due to the large differences in age of the participants (inverse relationship between age and CUVAF5) as well as the difference in the number of images analyzed for intraobserver reliability assessment. However, they can be used as a guide for tolerable ranges of variation.
The interobserver reliability assessment results from the Sherwin study reported the LOA between its two assessors using the manual method to be to 19.71 with a mean difference of 3.02 (8.52) compared to the semiautomatic method, in which the LOA was to 9.29 and mean bias was (6.70). A similar number of images was analyzed in both these studies and a comparable mean bias was observed. The smaller LOA range and SD value produced by the semiautomatic method show that it is a more reliable method for quantifying CUVAF.
For intraobserver reliability assessment, the Sherwin study reported the LOA of to 2.39 with a mean bias of (1.90) compared to our findings of LOA ranging from to 6.53 and mean bias of 0.72 (2.96). The Sherwin study analyzed only 15 participants for intraobserver reliability compared to the 50 participants we analyzed, which could account for the wider LOA observed in our analysis. Regardless, the variations noted in our study are small enough suggesting that the semiautomatic method also has high reliability.
The increasing difference of CUVAF area between the manual and semiautomated methods observed in the Bland–Altman plots [Figs. 6(a) and 6(b)] could be attributed to amplification of observer bias during calculation of the area. For example, if we consider the CUVAF region as a circle and say that one assessor consistently marks the radius 2 units greater than the other, the corresponding areas would be and , respectively. Thus, with greater area of CUVAF, the observer bias increases.
One limitation of our study was that the manual assessor of the retrospective data was not recruited to analyze the subset of images using the semiautomatic method. As a result, larger measurement error is expected when comparing the manual and semiautomatic method for quantifying CUVAF as it would include variability due to both interobserver and measurement method. Hence, two assessors were recruited to measure the retrospective data using the semiautomatic method and a mean bias of (9.93) and (11.83) was reported between the manual and semiautomatic method. As the mean bias for both assessors was within the LOA defined for interobserver reliability assessment of both the Sherwin study ( to 19.71) and our study ( to 9.29), we find that this is an acceptable variation between the two methods considering the circumstances and the lack of a gold standard. It is also noteworthy to emphasize that the semiautomated method developed in this study was based on analysis of retrospective data and thus is constrained as such due to the inherent limitations of using prior data for image reproduction. In our future study, we aim to additionally provide validation of image reproduction for quantifying CUVAF.
CUVAF quantification is difficult due to variability in the shape, size, and intensity of the detected changes. Furthermore, reflections of the surface of the eye, eye conditions (e.g., hemorrhages and nevi), or debris on camera lenses create artifacts in the image that can obscure or be mistaken for an area of autofluorescence. These aberrations in addition to poor image acquisition techniques result in unfocussed, decentered, or low-contrast images that contribute to the difficulty of accurate CUVAF quantification. Ideally, measurements obtained using the semiautomatic method would match the manual method as this data have already been published and used in a number of studies. However, there is no clear definition of what constitutes a CUVAF region and no gold standard for CUVAF measurements, which would be necessary for future comparative studies.
The semiautomatic method allows users to flag images as “subjective” or “weak CUVAF” to help identify images susceptible to highly variable measurements. Subjective images are defined as those in which CUVAF is present, but the border of the region is difficult to define due to factors such as flash artifacts obscuring the region, or regions with diffuse edges. A weak CUVAF region was defined as one in which CUVAF appears to be present, but the signal is so weak such that it could be mistaken for uneven illumination or a camera artifact, especially when the image is not in focus. Having these options allows these images to be included/excluded in data analysis, or to be reanalyzed by one or more assessors to reach a consensus on the true area of CUVAF. Furthermore, users can write comments on the image that can be used to characterize the appearance of the CUVAF region. Both qualitative and quantitative data obtained from this computerized analysis can help to establish a universally accepted criterion for characterizing CUVAF and work toward developing a standard method for CUVAF analysis across the globe.
5. Conclusions
The aim of this study was to validate whether the proposed semiautomatic method could replace the manual method for CUVAF analysis. Although it has been previously established that the measurement of CUVAF using the manual method is reliable,2 this method is subjective and tedious and results cannot be retrospectively reviewed. Having a semiautomatic method can provide a more efficient means of quantifying CUVAF that is less prone to human error, with reduced subjectivity and enhanced reproducibility. The length of time taken to perform manual measurements is onerous, requiring many hours or even days of researcher time that could be spent on other research activity. The time-consuming nature of manual measurement also effectively limits the number of study participants that can be analyzed, making the technique impractical for very large population-based cohorts. A semiautomatic method of measurement reduces the time and cost burden of the technique, and potentially allows analysis of very large cohorts. As both assessors achieved over 95% agreement with the manual measurements, we conclude that the two methods agree sufficiently well for them to be used interchangeably, and that the semiautomatic method is a valid tool for assessment of ocular sun exposure in the research setting.12 Furthermore, the semiautomatic method for CUVAF analysis also shows high reliability, with both intra- and interobserver agreement over 95%. An additional benefit of the computer program is that all steps of the analysis process, including the outline of the area of fluorescence, are saved and can be retrospectively reviewed at any time. This will be of high importance for characterizing the CUVAF region for defining a standard inclusion criterion as well as for future studies that may want to investigate other metrics of CUVAF such as intensity.
Further work on methods for CUVAF analysis would be focused on defining a universally accepted inclusion criteria and developing a fully automated algorithm to remove the subjectivity involved in evaluating CUVAF images. Our semiautomatic method was developed to complement future work using machine-learning techniques. An input feature vector containing discriminatory features on CUVAF and non-CUVAF regions could be derived from the saved data. A supervised learning approach would then be used to train and validate a machine-learning model such as support vector machine, neural network, and/or sparse dictionary learning to classify pixels as CUVAF or background. These models have been used successfully in imaging applications such as face recognition16 and disease detection and diagnosis.17
Determining accurately and objectively lifetime sun exposure is fundamental to research into the detrimental and beneficial effects of UV radiation on human health. This semiautomatic method for analyzing preclinical ocular sun damage is efficient and enables retrospective review of images, giving it great potential for large cohort and interventional studies.
Acknowledgments
We are grateful to the Raine study participants and thank the Raine study and the Lions Eye Institute research staff for cohort coordination and data collection. We would like to acknowledge ongoing support from Professor Minas Coroneo and his group from the University of New South Wales. The Raine study 20-year follow-up was supported by the National Health and Medical Research Council (No. 1021105) and the Ophthalmic Research Institute of Australia grants awarded to David Mackey. Ajmal Mian was supported by the Australian Research Council (No. DP110102399).
Biographies
Emily Huynh completed her master of engineering (biomedical) at the University of Melbourne. Currently, she works at the Lions Eye Institute (LEI) as a research assistant, where she is involved with developing software for image and data analysis. Her research interests are image processing, computer vision, and machine learning for medical applications.
Danuta M. Bukowska received her PhD from the Nicolaus Copernicus University, Torun, Poland, under the supervision of Professor Maciej Wojtkowski, a leading researcher in optical coherence tomography. Since October 2014, she has been employed as a full time research associate in the Imaging and Informatics Group at the LEI, Perth, Western Australia. The main objective of her present work is design and development of methodology for data visualization and analysis.
Seyhan Yazar received her PhD from the University of Western Australia, Perth, Australia, under the supervision of Professor David A. Mackey and associate Professor Alex W. Hewitt. Her main research focus has been the genetic and environmental factors in common, complex eye diseases such as myopia, corneal astigmatism, and keratoconus. In 2016, she received the Australian National Health and Medical Research Council’s CJ Martin Overseas Biomedical Fellowship to incorporate bioinformatics methods into eye research.
Charlotte M. McKnight received her master of philosophy from the Centre for Ophthalmology and Visual Science, University of Western Australia. She is a trainee ophthalmologist in the Western Australian training network of the Royal Australian and New Zealand College of Ophthalmologists.
Ajmal Mian is a research fellow at the School of Computer Science and Software Engineering, University of Western Australia. His research interests include computer vision, face and three-dimensional object recognition, and multispectral image analysis.
David A. Mackey is the managing director of the LEI and professor of ophthalmology and director of the Centre for Ophthalmology and Vision Science at the University of Western Australia. He has achieved international recognition as a genetic ophthalmologist. His original research into the genetics of glaucoma and in the fields of optic atrophy and congenital cataract has received continued research funding support for the past two decades.
References
- 1.Ooi J. L., et al. , “Ultraviolet fluorescence photography to detect early sun damage in the eyes of school-aged children,” Am. J. Ophthalmol. 141(2), 294–298 (2006). 10.1016/j.ajo.2005.09.006 [DOI] [PubMed] [Google Scholar]
- 2.Sherwin J. C., et al. , “Reliability and validity of conjunctival ultraviolet autofluorescence measurement,” Br. J. Ophthalmol. 96(6), 801–805 (2012). 10.1136/bjophthalmol-2011-301255 [DOI] [PubMed] [Google Scholar]
- 3.Sherwin J. C., et al. , “The association between time spent outdoors and myopia in children and adolescents: a systematic review and meta-analysis,” Ophthalmology 119(10), 2141–2151 (2012). 10.1016/j.ophtha.2012.04.020 [DOI] [PubMed] [Google Scholar]
- 4.Ooi J. L., et al. , “Ultraviolet fluorescence photography: patterns in established pterygia,” Am. J. Ophthalmol. 143(1), 97–101 (2007). 10.1016/j.ajo.2006.08.028 [DOI] [PubMed] [Google Scholar]
- 5.Sherwin J. C., et al. , “Distribution of conjunctival ultraviolet autoflourescence in a population-based study: the Norfolk Island eye study,” Eye 25(7), 893–900 (2011). 10.1038/eye.2011.83 [DOI] [PMC free article] [PubMed] [Google Scholar]
- 6.Sherwin J. C., et al. , “The association between pterygium and conjunctival ultraviolet autofluorescence: the Norfolk Island eye study,” Acta Ophthalmol. 91(4), 363–370 (2013). 10.1111/aos.2013.91.issue-4 [DOI] [PubMed] [Google Scholar]
- 7.McKnight C. M., et al. , “Pterygium and conjunctival ultraviolet autofluorescence in young Australian adults: the Raine study,” Clin. Exp. Ophthalmol. 43(4), 300–307 (2014). 10.1111/ceo.12455 [DOI] [PubMed] [Google Scholar]
- 8.McKnight C. M., et al. , “Myopia in young adults is inversely related to an objective marker of ocular sun exposure: the Western Australian Raine cohort study,” Am. J. Ophthalmol. 158(5), 1079–1085 (2014). 10.1016/j.ajo.2014.07.033 [DOI] [PMC free article] [PubMed] [Google Scholar]
- 9.Yazar S., et al. , “Genetic and environmental factors in conjunctival UV autofluorescence,” JAMA Ophthalmol. 133(4), 406–412 (2015). 10.1001/jamaophthalmol.2014.5627 [DOI] [PMC free article] [PubMed] [Google Scholar]
- 10.Wolffsohn J. S., Drew T., Sulley A., “Conjunctival UV autofluorescence—prevalence and risk factors,” Contact Lens Anterior Eye 37(6), 427–430 (2014). 10.1016/j.clae.2014.07.004 [DOI] [PubMed] [Google Scholar]
- 11.Yazar S., et al. , “Raine eye health study: design, methodology and baseline prevalence of ophthalmic disease in a birth-cohort study of young adults,” Ophthalmic Genet. 34(4), 199–208 (2013). 10.3109/13816810.2012.755632 [DOI] [PubMed] [Google Scholar]
- 12.Bland J. M., Altman D. G., “Comparing methods of measurement: why plotting difference against standard method is misleading,” Lancet 346(8982), 1085–1087 (1995). 10.1016/S0140-6736(95)91748-9 [DOI] [PubMed] [Google Scholar]
- 13.Altman D. G., Bland J. M., “Measurement in medicine: the analysis of method comparison studies,” J. R. Stat. Soc. Ser. D 32(3), 307–317 (1983). 10.2307/2987937 [DOI] [Google Scholar]
- 14.Huynh E., “CUVAF analysis,” 2016, Version 1.0, Github repository, https://github.com/hewittlab/CUVAF-Analysis (20 July 2016).
- 15.Niblack W., An Introduction to Digital Image Processing, p. 215, Strandberg Publishing Company, Copenhagen, Denmark: (1985). [Google Scholar]
- 16.Amaro E. G., Nuno-Maganda M. A., Morales-Sandoval M., “Evaluation of machine learning techniques for face detection and recognition,” in 22nd Int. Conf. on Electrical Communications and Computers (CONIELECOMP ‘12) (2012). [Google Scholar]
- 17.Sajda P., “Machine learning for detection and diagnosis of disease,” Annu. Rev. Biomed. Eng. 8(1), 537–565 (2006). 10.1146/annurev.bioeng.8.061505.095802 [DOI] [PubMed] [Google Scholar]


