

Abstract
Objective:
To examine neurodegenerative imaging biomarkers in Alzheimer disease (AD) dementia from middle to old age.
Methods:
Persons with AD dementia and elevated brain β-amyloid with Pittsburgh compound B (PiB)-PET imaging underwent [18F]-fluorodeoxyglucose (FDG)-PET and structural MRI. We evaluated 3 AD-related neurodegeneration biomarkers: hippocampal volume adjusted for total intracranial volume (HVa), FDG standardized uptake value ratio (SUVR) in regions of interest linked to AD, and cortical thickness in AD-related regions of interest. We examined associations of each biomarker with age and evaluated age effects on cutpoints defined by the 90th percentile in AD dementia. We assembled an age-, sex-, and intracranial volume-matched group of 194 similarly imaged clinically normal (CN) persons.
Results:
The 97 participants with AD dementia (aged 49–93 years) had PiB SUVR ≥1.8. A nonlinear (inverted-U) relationship between FDG SUVR and age was seen in the AD group but an inverse linear relationship with age was seen in the CN group. Cortical thickness had an inverse linear relationship with age in AD but a nonlinear (flat, then inverse linear) relationship in the CN group. HVa showed an inverse linear relationship with age in both AD and CN groups. Age effects on 90th percentile cutpoints were small for FDG SUVR and cortical thickness, but larger for HVa.
Conclusions:
In persons with AD dementia with elevated PiB SUVR, values of each neurodegeneration biomarker were associated with age. Cortical thickness had the smallest differences in 90th percentile cutpoints from middle to old age, and HVa the largest differences.
Neurodegeneration imaging biomarkers allow us to monitor directly the pathophysiology of Alzheimer disease (AD). To explore the entire natural history of AD including its preclinical and earliest overt manifestations, it is necessary to understand the distribution of the imaging biomarkers in persons at the most impaired end of the spectrum—those with AD dementia. While much work in imaging biomarkers in AD dementia has gone into investigations for clinical diagnostic purposes, the definition of a minimum threshold for abnormal neurodegeneration is critical for studying early stages of AD. We therefore conducted analyses of MRI and PET in persons with clinically diagnosed AD dementia who had elevated β-amyloid by Pittsburgh compound B (PiB)-PET imaging. To help us distinguish between disease-related and age-related changes, we also examined a group of clinically normal (CN) individuals who were well matched to the patients with AD dementia. Our goal was to develop definitions of neurodegeneration imaging biomarkers that were as free as possible of age interactions. Our a priori hypothesis was that the burden of disease would tend to overshadow age-related changes in neurodegeneration imaging biomarkers in persons with dementia.
METHODS
Participants.
We identified 116 persons with AD dementia who were initially recruited and diagnosed in the Mayo Alzheimer's Disease Research Center and Mayo Clinic Study of Aging (MCSA) by R.C.P., B.F.B., or D.S.K. They were diagnosed using National Institute of Neurological and Communicative Disorders and Stroke and the Alzheimer's Disease and Related Disorders Association criteria1 for probable AD, which also corresponds to clinically diagnosed AD dementia by the National Institute on Aging and the Alzheimer's Association workgroup criteria.2 Five persons who had received a diagnosis of probable AD were excluded on further review because they had prominent secondary etiologic diagnoses. All participants underwent a standard neurologic examination, underwent an interview (along with an informant) to complete a Clinical Dementia Rating (CDR),3 and received a Mini-Mental State Examination (MMSE) or Short Test of Mental Status.4 Scores on the Short Test of Mental Status were converted to MMSE scores using an internally developed nomogram. The CDR is reported as a summary of the domain scores and referred to as the Sum of Boxes or CDR-SB. APOE genotyping was done using standard methods. All underwent MRI, [18F]-fluorodeoxyglucose (FDG)-PET, and PiB-PET imaging. Three additional individuals were excluded because their scans could not be analyzed by the FreeSurfer pipeline. For the current study, we included only individuals with elevated PiB-PET defined as standardized uptake value ratio (SUVR) >1.6. A value of 1.6 was chosen based on our prior work5 in order to correspond to a Thal amyloid stage of ≥2 (post hoc, on inspection of the distribution of PiB-PET SUVR in our cases clinically diagnosed with AD dementia, there were no participants with PiB-PET SUVR between 1.6 and 1.8). Based on PiB SUVR values below the cutoff, we excluded 11 persons clinically diagnosed with AD dementia, leaving 97 (of 108, 90%) in the analytic sample.
The 97 participants with AD dementia were matched on a 2:1 basis with 194 CN persons from the MCSA on age, sex, and total intracranial volume. We did not exclude any CN participants because of elevated PiB-PET SUVR. Some of the data on hippocampal volume6 and FDG-PET imaging7 in CN participants have been previously reported, but are presented here in order to compare to the AD dementia group.
Standard protocol approvals, registrations, and patient consents.
These studies were approved by the Mayo Clinic and Olmsted Medical Center institutional review boards. Written informed consent was obtained from all participants.
Imaging.
Our imaging methods have been described in prior publications.6–10 For additional details, see e-Methods on the Neurology® Web site at Neurology.org. In the Mayo Alzheimer's Disease Research Center and the MCSA, all participants who agree to brain imaging undergo a brain MRI on one day and then PiB-PET and FDG-PET on a second day. CT scans were also obtained at the time of PET imaging for attenuation correction.
PiB-PET images were acquired at 40 to 60 minutes after injection of 11C-PiB. PiB-PET scans were analyzed with our in-house, fully-automated, image-processing pipeline8 in which each participant's11 PiB image voxel values were extracted from automatically labeled regions of interest (ROIs) derived from an atlas12 that we modified. The PET ROIs were derived from a T1-weighted MRI template that was generated for each participant.11 A global cortical PiB SUVR was defined as the median PiB uptake value across voxels in the prefrontal, orbitofrontal, parietal, temporal, anterior cingulate, and posterior cingulate/precuneus ROIs from both hemispheres divided by the median PiB uptake value from the cerebellar gray matter ROI. A partial volume correction using segmented coregistered MRI was applied to the PiB-PET data, to account for voxel CSF content.
For FDG-PET scanning,7,10 participants were imaged 30 to 38 minutes after injection of FDG, with an 8- to 10-minute image acquisition period consisting of four 2- to 2.5-minute dynamic frames. During the 30 minutes between injection and imaging, participants sat in a darkened room and were not disturbed. They were told to keep their eyes open and to rest quietly. During image acquisition, they were asked to keep their eyes open. Quantitative image analysis for FDG-PET was performed using the same automated pipeline of image extraction and normalization as was described above for PiB-PET.8 As in our previous work,13,14 we focused on glucose uptake in a group of isocortical temporoparietal regions invariably affected in AD.15 These regions—angular gyrus, posterior cingulate, and middle/inferior temporal cortical ROIs—were defined in each participant's native space, and an FDG SUVR was created by normalizing the median values in each region to the median in the pons and vermis and then averaging the SUVR values across regions. We did not use partial volume correction for FDG-PET data.
The MRI methods are described in detail.8 Three-dimensional magnetization-prepared radiofrequency pulses and rapid gradient echo sequences were performed on one of three 3-tesla MRI machines from the same manufacturer. We analyzed 2 MRI measures of neurodegeneration. The first, termed HVa, was calculated as right plus left hippocampal volumes from FreeSurfer (v5.3; https://surfer.nmr.mgh.harvard.edu/) adjusted for total intracranial volume (TIV). To derive HVa, we fit a linear regression model among 133 CN participants aged 30 to 59 years predicting hippocampal volume from TIV.16 HVa was defined as the residual from this model, i.e., the difference between a participant's observed and expected hippocampal volume expressed in cubic centimeters. TIV was estimated using a TIV mask generated from each participant's magnetization-prepared radiofrequency pulses and rapid gradient echo image with SPM1217 of all gray matter, white matter, and CSF voxels, excluding voxels that were clearly extracranial.
The second MRI measure, AD signature ROI cortical thickness, was an average of mean cortical thickness across both hemispheres generated from the following FreeSurfer (v5.3) ROIs: entorhinal, inferior temporal, middle temporal, and fusiform.9 These regions were selected from an analysis in which the differences were maximized between groups of participants with mild cognitive impairment or AD dementia who had elevated β-amyloid levels and who were older than 60 years (including 52 participants in the current analysis) and age-, sex-, and TIV-matched CN participants without elevated β-amyloid. The cortical thickness measure was not significantly correlated with TIV.9
Analyses.
We used linear regression to assess associations of age, sex, APOE genotype, and MMSE with the 3 neurodegeneration imaging biomarkers among CN and AD dementia groups separately. Possible nonlinearity in age associations was accommodated via restricted cubic splines with knots at ages 60, 70, and 80. To test for differences in age effects between the AD dementia and CN groups, we fit a similar linear regression model among all participants including diagnosis group plus interactions with diagnosis and all other variables in the model.
In addition, in AD dementia only, interactions with age and sex, age and MMSE, and age and APOE genotype were evaluated. Cohen d statistic was used to describe age effect sizes relative to the extent of variability in the biomarkers. For cortical thickness and HVa, it was calculated as the difference in the mean biomarker value for an 85-year-old compared to a 55-year-old divided by the SD of the biomarker among all participants. Because of the nonlinear relationship with age and FDG, Cohen d was calculated as the difference in the mean FDG SUVR at the age where the curve peaked compared to a 55-year-old. Bootstrap methods with 10,000 replicate samples were used to calculate confidence intervals for the Cohen d statistic. To evaluate age effects on cutpoints, we computed 90th percentile values for the neurodegeneration biomarkers for those younger than 65 years, those 65 years and older, and the group as a whole. We chose age 65 years as the age division because that is the traditional cutpoint between early- and late-onset dementias. The 90th percentile was originally chosen13 because we wanted a cutpoint with high sensitivity, i.e., one that would capture the majority of the participants with AD dementia, but also wanted to avoid a percentile that might be influenced by extreme values.
RESULTS
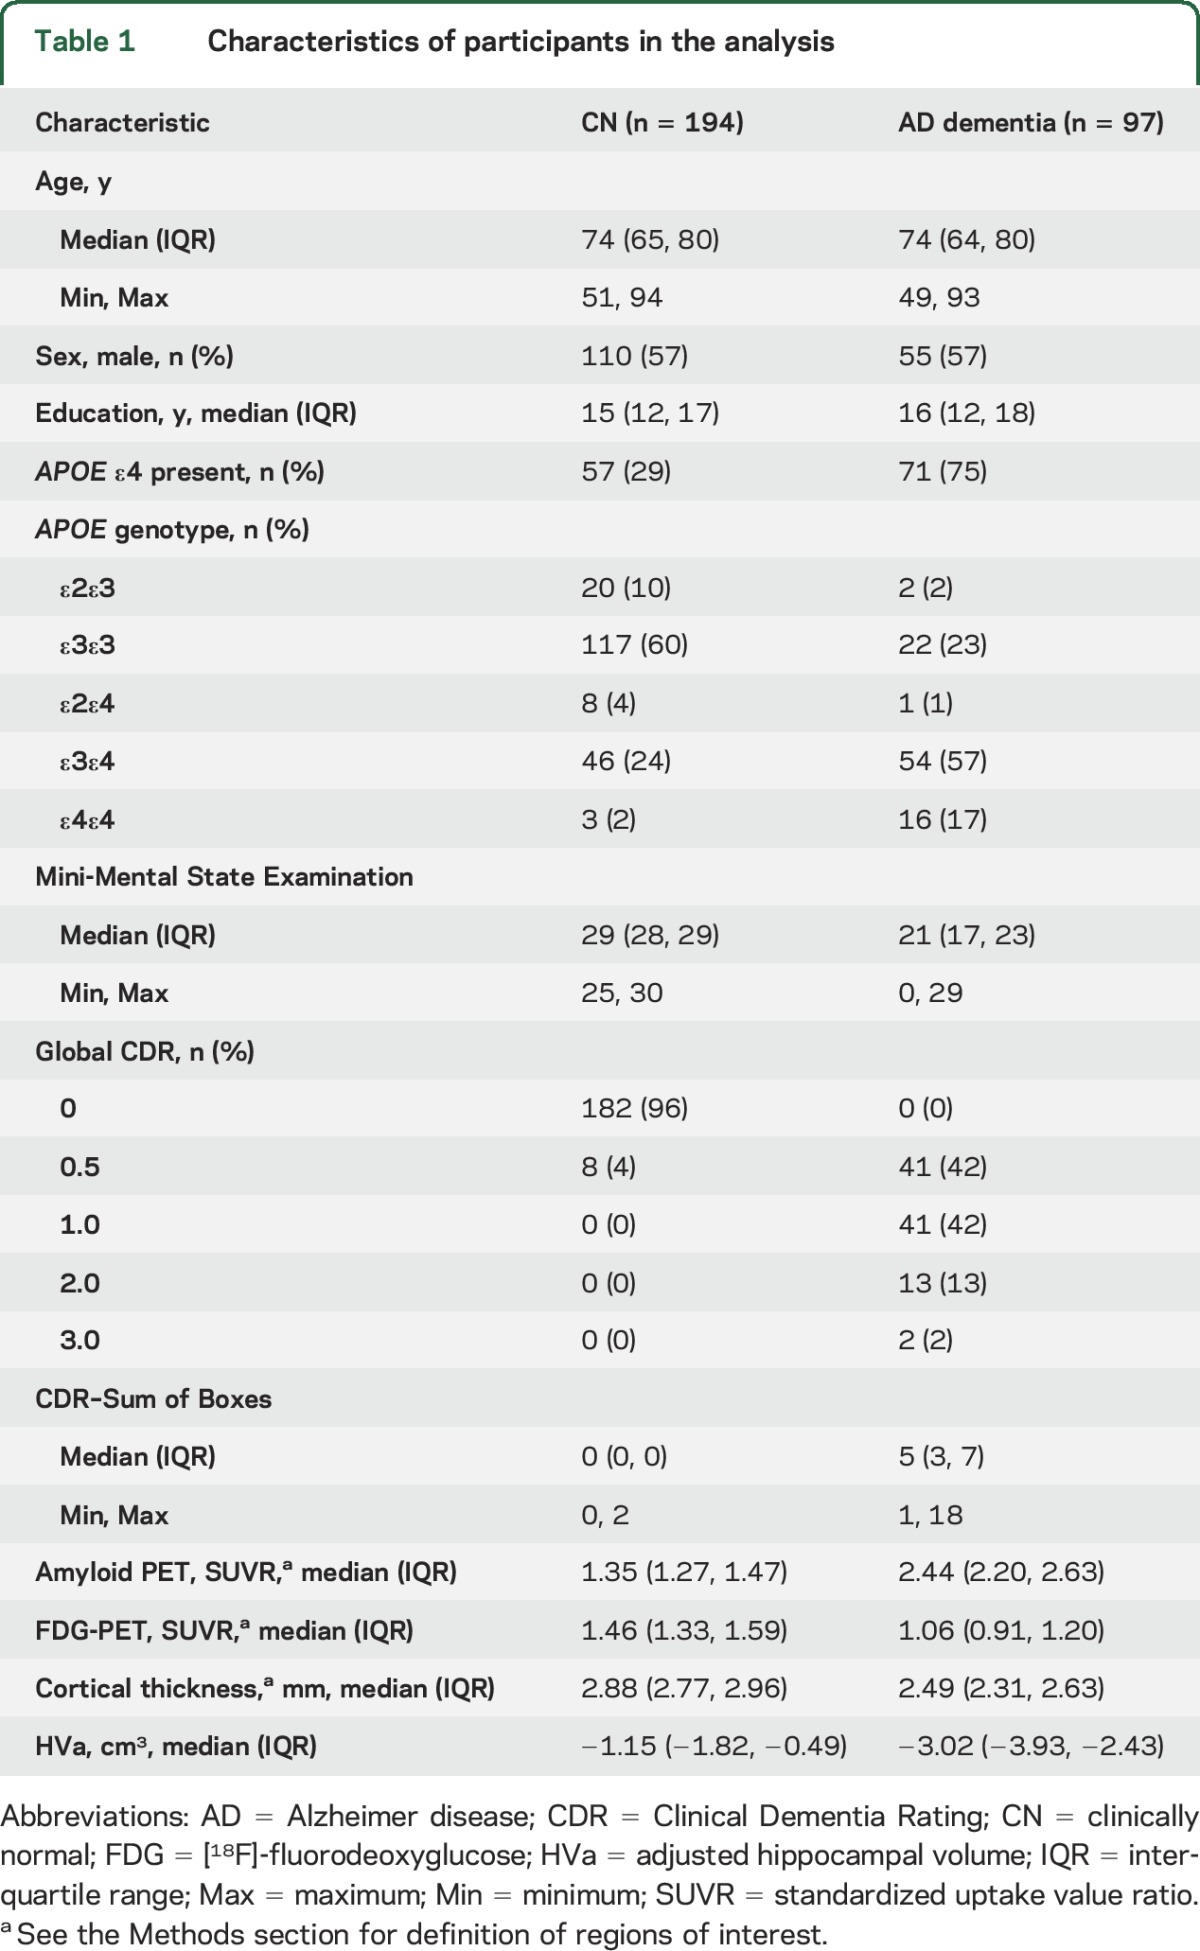
The participants with AD dementia and matched CN participants are described in table 1. The participants with AD dementia ranged in age from 49 to 93 years. Men were slightly overrepresented (n = 55, 57%). The majority of participants with AD dementia (n = 71, 75%) were APOE ε4 allele carriers. The CN participants had an expected minority (n = 57, 29%) who were APOE ε4 allele carriers. Although the interquartile ranges of the MMSE and CDR-SB in the AD dementia group were not large, there were both milder and much more impaired individuals in the study group. There was no significant association between PiB SUVR and MMSE, or MMSE and age, in the AD dementia group (figure e-1). The association between PiB SUVR and age was also not significant (p = 0.06 for the overall age association and the nonlinear association) (figure e-2).
Table 1.
Characteristics of participants in the analysis
There were significant differences in mean values of FDG SUVR, HVa, and cortical thickness by age in both CN and AD dementia groups (tables 2 and 3, figure 1).
Table 2.
Model summary estimates of age effects among cognitively normal participants by biomarker
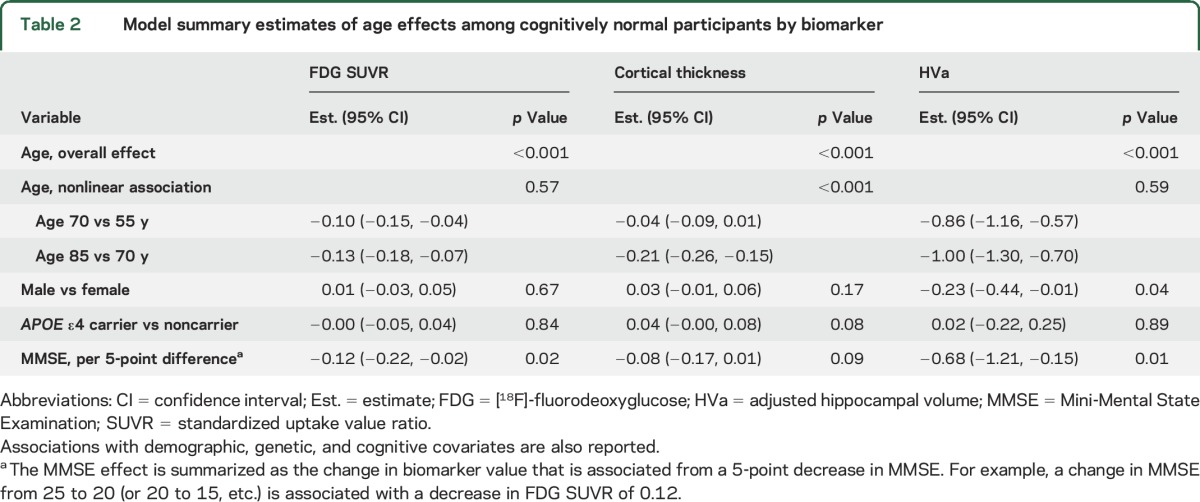
Table 3.
Model summary estimates of age effects among participants with AD dementia by biomarker
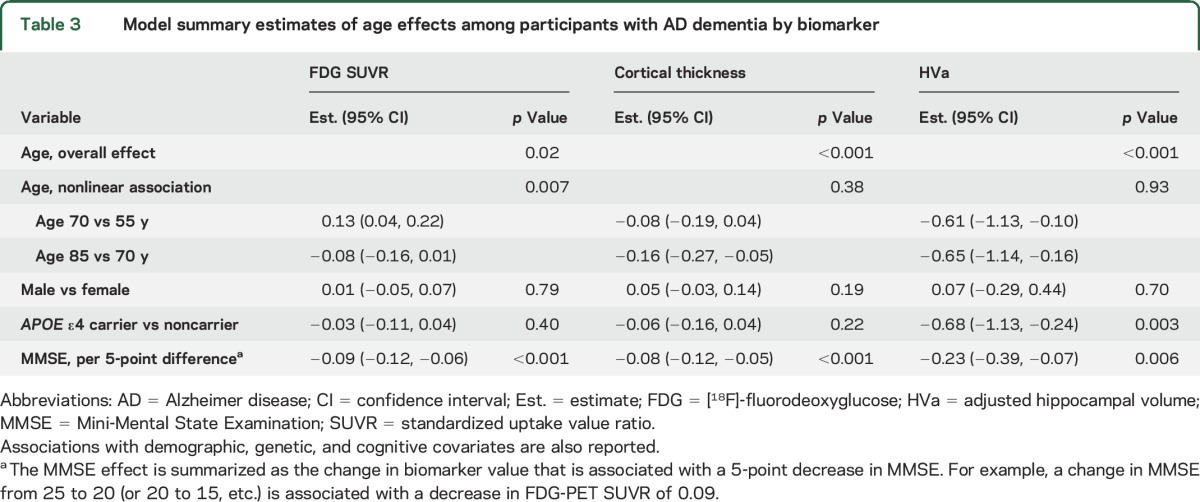
Figure 1. Scatterplots of each imaging biomarker by age within CN and AD dementia groups.

(A) AD meta-region of interest FDG SUVR; (B) AD signature region of interest cortical thickness; (C) adjusted hippocampal volume. Separate regression models were fit for each biomarker within groups. Age was modeled with a restricted cubic spline with knots at ages 60, 70, and 80 years. The models were adjusted for sex and MMSE. Regression lines are shown for APOE ε4 carriers vs noncarriers for the median MMSE (29 for CN, 21 for AD) and averaged across sex. Since sex and MMSE were modeled as additive effects, the mean biomarker values for men vs women, or for different MMSE values, would shift the lines shown in the figure only up or down, but would not change the shape of the curves. Difference plots were estimated from a model fit among all participants with age, sex, APOE genotype, MMSE, and diagnosis as well as interactions with diagnosis and all other variables. The difference plots show estimated difference in mean biomarker levels for a participant with AD dementia vs CN participant by age. For cortical thickness, a 15-year increase (i.e., 55–70 or 70–85 years) in age was associated (with above adjustments) with a 0.1- to 0.2-mm cortical thinning in the AD dementia group, while a 15-year increase in age was associated with a 0.04- to 0.2-mm cortical thinning in the CN group. For HVa, in the AD dementia group, a 15-year increase (i.e., 55–70 or 70–85 years) in age was associated with a 0.6- to 0.7-cm3 decrease in HVa after adjustments, while a 15-year increase in age was associated with a 0.9- to 1.0-cm3 decrease in HVa in the CN group. For FDG SUVR, in the AD dementia group, average FDG SUVR was 0.13 units greater for a 70-year-old compared to a 55-year-old but 0.08 units lower for an 85-year-old compared to a 70-year-old in adjusted analyses. In the CN group, a 15-year increase in age (i.e., 55–70 or 70–85 years) was associated with a 0.1 decrease in FDG SUVR with adjustments. AD = Alzheimer disease; CN = clinically normal; DEM = dementia; FDG = [18F]-fluorodeoxyglucose; HVa = adjusted hippocampal volume; MMSE = Mini-Mental State Examination; SUVR = standardized uptake value ratio.
Older age was associated with reduced cortical thickness (p < 0.001) with no significant evidence of nonlinearity in the AD dementia group (p = 0.38). There was a nonlinear association of age for cortical thickness in the CN group (p < 0.001), such that older age was associated with reduced cortical thickness primarily after age 70. However, the age × diagnosis group interaction was not significant (p = 0.68). Figure 1 shows that group differences were similar across the age spectrum.
Older age was linearly associated with smaller HVa in the AD dementia and CN groups (both, p < 0.001). There was no significant age × group interaction (p = 0.12) (figure 1, difference plot).
FDG SUVR was the only biomarker with a significant difference in the age association between the AD dementia group and the CN group (p < 0.001). In the AD dementia group, there was a significant nonlinear (inverted-U-shape) association (p = 0.007) with FDG SUVR such that older age was associated with higher FDG SUVR until age 70, then associated with lower FDG SUVR. However, in the CN group, older age was linearly associated with lower FDG SUVR (p < 0.001). Because of the significant age–diagnosis group interaction (see difference plot in figure 1), the difference in mean FDG SUVR values between AD dementia and CN groups was much greater at younger ages than older ages. We also examined each region that made up the FDG AD signature ROI and found that the age associations were similar in all 3 regions for both the CN and AD dementia group. However, the effect sizes were somewhat attenuated in the posterior cingulate region for the CN group and the temporal region for the AD group (figure e-3, table e-1).
While there was variability within groups for all of the biomarkers, the age effect sizes were moderate to large in the AD dementia group. Cohen d for FDG SUVR was 0.7 (95% confidence interval [CI]: 0.2–1.1) as compared to 1.1 (95% CI: 0.5–1.5) for cortical thickness and 1.2 (95% CI: 0.7–1.6) for HVa. With a moderate sample size available, these differences were not conclusively different from one another. However, based on Cohen d bootstrap replicates, we estimate a 91% probability that the age effect size for HVa is greater than for FDG SUVR, an 84% probability that the age effect size for cortical thickness is greater than for FDG SUVR, and a 74% probability that the age effect size for HVa is greater than for cortical thickness.
Lower MMSE values (table 3) were associated with lower FDG SUVR (p < 0.001), cortical thickness (p < 0.001), and HVa (p = 0.006) as expected in the AD group. However, there were no significant interactions between age and MMSE for the 3 neurodegeneration biomarkers (p = 0.20, 0.56, and 0.28, respectively), indicating that cognitive status did not account for the age relationships of the biomarkers.
There were no significant associations in the AD dementia group with the 3 imaging biomarkers and sex (table 3). APOE ε4 allele carriage was associated with smaller HVa (p = 0.003) but not the other 2 imaging biomarkers in the AD dementia group. There was no interaction between APOE ε4 carriage and age (p = 0.48).
Figure 2 shows the effects of age on cutpoints defined as the 90th percentile of the AD distribution for the 3 neurodegeneration biomarkers by age younger than 65 years vs age 65 years and older and in all participants combined. Differences in cutpoints across age were very small for FDG SUVR and cortical thickness, but rather large for HVa. The values from the CN group are presented for comparison, but might differ from a population-based group. The percentages of this nonrepresentative group of CN falling into the abnormal range for HVa varied considerably using the cutpoint defined in <65 (37% abnormal) compared to the cutpoint defined in ≥65 (11% abnormal). Differences in the proportion of CN defined as abnormal by the <65 and ≥65 cutpoints were also noted for FDG SUVR (6% vs 17%) and less so for cortical thickness (25% vs 20%).
Figure 2. Boxplots for each biomarker among CN participants and younger, older, and all AD dementia groups.

Boxplots for each biomarker (A: FDG-PET; B: AD signature thickness; C: HVa) among all CN participants (n = 194), younger participants with AD dementia (age younger than 65 years, n = 26), older participants with AD dementia (age 65 years or older, n = 71), and all participants with AD dementia (n = 71). Cutpoints are shown in the AD groups using the 90th percentile. The boxes indicate the 25th and 75th percentile. The line within the box represents the median value. Vertical lines extending from the boxes are extended out to the data point furthest from the box that is within 1.5 times the interquartile range, defined as the 75th percentile minus the 25th percentile. AD = Alzheimer disease; CN = clinically normal; DEM = dementia; FDG = [18F]-fluorodeoxyglucose; HVa = adjusted hippocampal volume; SUVR = standardized uptake value ratio.
DISCUSSION
There were 2 important sets of observations from our analysis. First, within persons with AD dementia who had elevated PiB SUVR, the age effect sizes for the 3 neurodegeneration biomarkers were moderate to large. Our results disprove the hypothesis that disease overshadows age in AD for these biomarkers. Second, for use as a cutpoint for abnormality among less impaired individuals, the 90th percentile value for cortical thickness in AD dementia did not vary with age. In contrast, cutpoint values for both HVa (linearly) and FDG SUVR (nonlinearly) varied with age. The generalizability of claims that rely on cutpoints for a neurodegenerative abnormality based on HVa or FDG SUVR will invariably be conditioned on the particular age composition of the study cohorts.
The overall decline with age in isocortex and hippocampus that occurred in both the AD dementia and CN groups was consistent with prior work in MRI in CN6,18–21 and in AD dementia studies that did not account for β-amyloid status.20,22–25 The greater age dependence of HVa compared to cortical thickness suggests that hippocampal structural integrity is influenced more strongly by AD-independent processes than is isocortical structural integrity. Thickness of isocortical regions, while less age-dependent, has the additional benefit as an effective AD neurodegeneration biomarker of being strongly associated with cognition both clinically (e.g., figure 2) and neuropathologically.26
The association between FDG SUVR and age in AD dementia was unlike the age relationships in the other 2 biomarkers. The relationship was nonlinear (inverted U-shaped) and significantly differed from the inverse linear association seen in the CN group. Therefore, at younger ages, there was a larger difference in mean FDG SUVR values between AD and CN groups than at older ages. This inverted U-shaped relationship between age and FDG SUVR in AD-relevant ROIs resulted in less variability in cutpoints defined by the 90th percentile across different age groups for this biomarker. In earlier studies in mild cognitive impairment, we had observed age effects on AD-related FDG SUVR patterns,27 but we are not aware of other studies that have documented an age × cognitive status interaction for FDG SUVR. The basis for the hypometabolism in younger patients with AD dementia is unclear but could reflect different neuropathologic subtypes of AD. Lower FDG SUVR in younger compared to older patients with AD dementia would not be surprising given the overrepresentation of isocortical-dominant, hippocampal-sparing AD variants in younger patients,28–31 often, but not always, appearing as nonamnestic syndromes. While none of our participants had clinical diagnoses of nonamnestic syndromes, we suspect that the hippocampal-sparing, isocortical-involving pattern exists on a continuum with combined hippocampal and isocortical involvement, some of which was represented by younger persons in our study. The “typical” pathologic form of AD28 involving both hippocampus and posterior association isocortex and the limbic form of AD are more common in older individuals.
Strengths of our study include the large, well-characterized group of persons with AD dementia and a CN group that was well matched in age, sex, and TIV. There are some important caveats to our study. Because most of the participants with AD dementia were recruited from our clinical dementia practice, they cannot be considered representative of a population-based sample, and, furthermore, the numbers of younger persons with dementia exceeds what would occur in a representative population. Our participants were also notable for lacking additional clinically overt diseases. In patients with AD dementia recruited in an unbiased manner from a population, multiple other conditions might be present (at least among the most elderly). Those second or third diseases might alter the age relationships seen here. The near-significant association between age and PiB SUVR is consistent with a changing role of other diseases with age. Because our CN group was created to match the AD dementia group, it too was nonrepresentative of a population-based cohort. Thus, our CN group's imaging values cannot be used to estimate cutpoints or to estimate specificity of the AD dementia–derived cutpoints. Finally, the cutpoints were derived to define the most impaired end of the neurodegenerative spectrum, and were not intended to optimize diagnostic separation of AD dementia from some other clinical group.
Supplementary Material
ACKNOWLEDGMENT
The authors thank the staff and participants in the Mayo Clinic Study of Aging and the Mayo Alzheimer Research Center for their invaluable contributions to this work.
GLOSSARY
- AD
Alzheimer disease
- CDR
Clinical Dementia Rating
- CDR-SB
Clinical Dementia Rating–Sum of Boxes
- CI
confidence interval
- CN
clinically normal
- FDG
[18F]-fluorodeoxyglucose
- HVa
adjusted hippocampal volume
- MCSA
Mayo Clinic Study of Aging
- MMSE
Mini-Mental State Examination
- PiB
Pittsburgh compound B
- ROI
region of interest
- SUVR
standardized uptake value ratio
- TIV
total intracranial volume
Footnotes
Supplemental data at Neurology.org
AUTHOR CONTRIBUTIONS
Dr. Knopman: generated first draft and completed final draft, study concept and design, acquisition of data, analysis and interpretation, critical revision of the manuscript for important intellectual content. Dr. Jack: analysis and interpretation, critical revision of the manuscript for important intellectual content, study supervision. Ms. Wiste: analysis and interpretation, critical revision of the manuscript for important intellectual content. Mr. Weigand: analysis and interpretation, critical revision of the manuscript for important intellectual content. Dr. Vemuri: critical revision of the manuscript for important intellectual content. Dr. Mielke: critical revision of the manuscript for important intellectual content. Dr. Machulda: critical revision of the manuscript for important intellectual content. Dr. Lowe: critical revision of the manuscript for important intellectual content. Dr. Kantarci: critical revision of the manuscript for important intellectual content. Dr. Gunter: critical revision of the manuscript for important intellectual content. Mr. Senjem: critical revision of the manuscript for important intellectual content. Dr. Jones: critical revision of the manuscript for important intellectual content. Dr. Roberts: critical revision of the manuscript for important intellectual content. Dr. Boeve: acquisition of data, critical revision of the manuscript for important intellectual content. Dr. Petersen: acquisition of data, critical revision of the manuscript for important intellectual content, study supervision.
STUDY FUNDING
This work was supported by NIH grants P50 AG16574, U01 AG06786, R01 AG11378, and R01 AG41851, the Elsie and Marvin Dekelboum Family Foundation, and the Robert H. and Clarice Smith and Abigail Van Buren Alzheimer's Disease Research Program of the Mayo Foundation.
DISCLOSURE
D. Knopman serves on a data safety monitoring board for Lundbeck Pharmaceuticals and for the DIAN Study; is an investigator in clinical trials sponsored by Biogen, TauRX Pharmaceuticals, Lilly Pharmaceuticals, and the Alzheimer's Disease Cooperative Study; and receives research support from the NIH. C. Jack serves on a scientific advisory board for Eli Lilly & Company; receives research support from the NIH/National Institute on Aging (NIA), and the Alexander Family Alzheimer's Disease Research Professorship of the Mayo Foundation; and holds stock in Johnson & Johnson. H. Wiste and S. Weigand report no disclosures relevant to the manuscript. P. Vemuri receives research grants from the NIH/NIA. V. Lowe serves on scientific advisory boards for Bayer Schering Pharma, Piramal Life Sciences and receives research support from GE Healthcare, Siemens Molecular Imaging, AVID Radiopharmaceuticals, and the NIH (NIA, NCI). K. Kantarci receives research grants from the NIH/NIA. J. Gunter and M. Senjem report no disclosures relevant to the manuscript. M. Mielke receives research grants from the NIH/NIA, Alzheimer Drug Discovery Foundation, Lewy Body Dementia Association, and the Michael J. Fox Foundation. M. Machulda receives research support from the NIH/NIA and NIDCD. R. Roberts reports no disclosures. She receives research grants from the NIH/NIA. B. Boeve receives royalties from the publication of Behavioral Neurology of Dementia and receives research support from Cephalon, Inc., Allon Therapeutics, GE Healthcare, the NIH/NIA, and the Mangurian Foundation. D. Jones reports no disclosures relevant to the manuscript. R. Petersen serves on data monitoring committees for Pfizer, Inc., Janssen Alzheimer Immunotherapy, and is a consultant for Biogen, Roche, Inc., Merck, Inc., and Genentech, Inc.; receives publishing royalties from Mild Cognitive Impairment (Oxford University Press, 2003), and receives research support from the NIH. Go to Neurology.org for full disclosures.
REFERENCES
- 1.McKhann G, Drachman D, Folstein M, et al. Clinical diagnosis of Alzheimer's disease: report of the NINCDS-ADRDA Work Group under the auspices of Department of Health and Human Services Task Force on Alzheimer's Disease. Neurology 1984;34:939–944. [DOI] [PubMed] [Google Scholar]
- 2.McKhann GM, Knopman DS, Chertkow H, et al. The diagnosis of dementia due to Alzheimer's disease: recommendations from the National Institute on Aging–Alzheimer's Association workgroups on diagnostic guidelines for Alzheimer's disease. Alzheimers Dement 2011;7:263–269. [DOI] [PMC free article] [PubMed] [Google Scholar]
- 3.Morris JC. The Clinical Dementia Rating (CDR): current version and scoring rules. Neurology 1993;43:2412–2414. [DOI] [PubMed] [Google Scholar]
- 4.Kokmen E, Smith GE, Petersen RC, Tangalos E, Ivnik RC. The short test of mental status: correlations with standardized psychometric testing. Arch Neurol 1991;48:725–728. [DOI] [PubMed] [Google Scholar]
- 5.Murray ME, Lowe VJ, Graff-Radford NR, et al. Clinicopathologic and 11C-Pittsburgh compound B implications of Thal amyloid phase across the Alzheimer's disease spectrum. Brain 2015;138:1370–1381. [DOI] [PMC free article] [PubMed] [Google Scholar]
- 6.Jack CR Jr, Wiste HJ, Weigand SD, et al. Age, sex, and APOE ε4 effects on memory, brain structure, and beta-amyloid across the adult life span. JAMA Neurol 2015;72:511–519. [DOI] [PMC free article] [PubMed] [Google Scholar]
- 7.Knopman DS, Jack CR Jr, Wiste HJ, et al. (18)F-fluorodeoxyglucose positron emission tomography, aging, and apolipoprotein E genotype in cognitively normal persons. Neurobiol Aging 2014;35:2096–2106. [DOI] [PMC free article] [PubMed] [Google Scholar]
- 8.Jack CR Jr, Lowe VJ, Senjem ML, et al. 11C PiB and structural MRI provide complementary information in imaging of Alzheimer's disease and amnestic mild cognitive impairment. Brain 2008;131:665–680. [DOI] [PMC free article] [PubMed] [Google Scholar]
- 9.Jack CR Jr, Wiste HJ, Weigand SD, et al. Different definitions of neurodegeneration produce similar frequencies of amyloid and neurodegeneration biomarker groups by age among cognitively non-impaired individuals. Brain 2015;138:3747–3759. [DOI] [PMC free article] [PubMed] [Google Scholar]
- 10.Lowe VJ, Kemp BJ, Jack CR Jr, et al. Comparison of 18F-FDG and PiB PET in cognitive impairment. J Nucl Med 2009;50:878–886. [DOI] [PMC free article] [PubMed] [Google Scholar]
- 11.Senjem ML, Gunter JL, Shiung MM, Petersen RC, Jack CR Jr. Comparison of different methodological implementations of voxel-based morphometry in neurodegenerative disease. Neuroimage 2005;26:600–608. [DOI] [PMC free article] [PubMed] [Google Scholar]
- 12.Tzourio-Mazoyer N, Landeau B, Papathanassiou D, et al. Automated anatomical labeling of activations in SPM using a macroscopic anatomical parcellation of the MNI MRI single-subject brain. Neuroimage 2002;15:273–289. [DOI] [PubMed] [Google Scholar]
- 13.Jack CR Jr, Knopman DS, Weigand SD, et al. An operational approach to National Institute on Aging–Alzheimer's Association criteria for preclinical Alzheimer disease. Ann Neurol 2012;71:765–775. [DOI] [PMC free article] [PubMed] [Google Scholar]
- 14.Knopman DS, Jack CR Jr, Wiste HJ, et al. Short-term clinical outcomes for stages of NIA-AA preclinical Alzheimer disease. Neurology 2012;78:1576–1582. [DOI] [PMC free article] [PubMed] [Google Scholar]
- 15.Landau SM, Harvey D, Madison CM, et al. Associations between cognitive, functional, and FDG-PET measures of decline in AD and MCI. Neurobiol Aging 2011;32:1207–1218. [DOI] [PMC free article] [PubMed] [Google Scholar]
- 16.Jack CR Jr, Wiste HJ, Weigand SD, et al. Age-specific population frequencies of cerebral beta-amyloidosis and neurodegeneration among people with normal cognitive function aged 50–89 years: a cross-sectional study. Lancet Neurol 2014;13:997–1005. [DOI] [PMC free article] [PubMed] [Google Scholar]
- 17.Ashburner J. Computational anatomy with the SPM software. Magn Reson Imaging 2009;27:1163–1174. [DOI] [PubMed] [Google Scholar]
- 18.Raz N, Lindenberger U, Rodrigue KM, et al. Regional brain changes in aging healthy adults: general trends, individual differences and modifiers. Cereb Cortex 2005;15:1676–1689. [DOI] [PubMed] [Google Scholar]
- 19.Driscoll I, Davatzikos C, An Y, et al. Longitudinal pattern of regional brain volume change differentiates normal aging from MCI. Neurology 2009;72:1906–1913. [DOI] [PMC free article] [PubMed] [Google Scholar]
- 20.Fjell AM, McEvoy L, Holland D, Dale AM, Walhovd KB. What is normal in normal aging? Effects of aging, amyloid and Alzheimer's disease on the cerebral cortex and the hippocampus. Prog Neurobiol 2014;117:20–40. [DOI] [PMC free article] [PubMed] [Google Scholar]
- 21.Thambisetty M, Wan J, Carass A, et al. Longitudinal changes in cortical thickness associated with normal aging. Neuroimage 2010;52:1215–1223. [DOI] [PMC free article] [PubMed] [Google Scholar]
- 22.Jack CR Jr, Petersen RC, Xu YC, et al. Medial temporal atrophy on MRI in normal aging and very mild Alzheimer's disease. Neurology 1997;49:786–794. [DOI] [PMC free article] [PubMed] [Google Scholar]
- 23.van de Pol LA, Hensel A, Barkhof F, et al. Hippocampal atrophy in Alzheimer disease: age matters. Neurology 2006;66:236–238. [DOI] [PubMed] [Google Scholar]
- 24.Schuff N, Woerner N, Boreta L, et al. MRI of hippocampal volume loss in early Alzheimer's disease in relation to ApoE genotype and biomarkers. Brain 2009;132:1067–1077. [DOI] [PMC free article] [PubMed] [Google Scholar]
- 25.Raji CA, Lopez OL, Kuller LH, Carmichael OT, Becker JT. Age, Alzheimer disease, and brain structure. Neurology 2009;73:1899–1905. [DOI] [PMC free article] [PubMed] [Google Scholar]
- 26.Savva GM, Wharton SB, Ince PG, et al. Age, neuropathology, and dementia. N Engl J Med 2009;360:2302–2309. [DOI] [PubMed] [Google Scholar]
- 27.Kantarci K, Senjem ML, Lowe VJ, et al. Effects of age on the glucose metabolic changes in mild cognitive impairment. AJNR Am J Neuroradiol 2010;31:1247–1253. [DOI] [PMC free article] [PubMed] [Google Scholar]
- 28.Murray ME, Graff-Radford NR, Ross OA, et al. Neuropathologically defined subtypes of Alzheimer's disease with distinct clinical characteristics: a retrospective study. Lancet Neurol 2011;10:785–796. [DOI] [PMC free article] [PubMed] [Google Scholar]
- 29.Whitwell JL, Dickson DW, Murray ME, et al. Neuroimaging correlates of pathologically defined subtypes of Alzheimer's disease: a case-control study. Lancet Neurol 2012;11:868–877. [DOI] [PMC free article] [PubMed] [Google Scholar]
- 30.Rabinovici GD, Furst AJ, Alkalay A, et al. Increased metabolic vulnerability in early-onset Alzheimer's disease is not related to amyloid burden. Brain 2010;133:512–528. [DOI] [PMC free article] [PubMed] [Google Scholar]
- 31.Lehmann M, Ghosh PM, Madison C, et al. Greater medial temporal hypometabolism and lower cortical amyloid burden in ApoE4-positive AD patients. J Neurol Neurosurg Psychiatry 2014;85:266–273. [DOI] [PMC free article] [PubMed] [Google Scholar]
Associated Data
This section collects any data citations, data availability statements, or supplementary materials included in this article.