Abstract
The vibrational spectrum of a six-coordinate nitrosyl iron porphyrinate, mono-[Fe(TpFPP)(1-MeIm)(NO)], has been studied by oriented single-crystal nuclear resonance vibrational spectroscopy (NRVS). The crystal was oriented to give spectra perpendicular to the porphyrin plane and two in-plane spectra perpendicular or parallel to the projection of the FeNO plane. These enable assignment of the FeNO bending and stretching modes. The measurements reveal that the two in-plane spectra have substantial differences that result from the strongly bonded axial NO ligand. The direction of the in-plane iron motion is found to be largely parallel and perpendicular to the projection of the bent FeNO on the porphyrin plane. The out-of-plane Fe–N–O stretching and bending modes are strongly mixed with each other as well as with porphyrin ligand modes. The stretch is mixed with ν50 as was also observed for dioxygen complexes. The frequency of the assigned stretching mode of eight Fe–X–O (X = N, C, and O) complexes is correlated with the Fe–XO bond distances. The nature of highest frequency band at ~560 cm−1 has also been examined in two additional new derivatives. Previously assigned as the Fe–NO stretch (by resonance Raman), it is better described as the bend as the motion of the central nitrogen atom of the FeNO group is very large. There is significant mixing of this mode. The results emphasize the importance of mode mixing; the extent of mixing must be related to the peripheral phenyl substituents.
Keywords: vibrational spectra, nuclear resonance vibrational spectroscopy (NRVS or NIS), nitric oxide, iron porphyrinates
Graphical abstract
The oriented single-crystal iron vibrations in the six-coordinate low-spin mono-[Fe(TpFPP)(1-MeIm)(NO)] have been examined by nuclear resonance vibration spectroscopy (NRVS). The NO orientation has a strong effect on the in-plane iron motion.
Introduction
The importance of nitric oxide as a significant messenger in biology has only increased since being named Science’s molecule of the year in 1992.[1] The biological significance of nitric oxide is multi-faceted with importance in blood pressure regulation, as a neurotransmitter, as well as a (toxic) defense mechanism in neutrophils and macrophages.[2]−[19] NO is synthesized by a family of heme enzymes that catalyze the 7-electron oxidation of L-arginine to NO.[20]−[26] There is also a reductive pathway in which nitrite is reduced to NO under hypoxic conditions.[27]–[30]
Vibrational spectroscopy has long been used as a structural probe for nitrosyl iron porphyrinates. In biological signaling processes, heme proteins discriminate between NO, CO and O2 quite efficiently in a number of systems.[31]–[34] This selectivity is not always explained by weak-force interactions between the diatomic and the binding pocket, and phenomena intrinsic to the heme prosthetic group may be in part responsible. Vibrational frequencies can be used to illuminate coordination-site and ligand bonding subtleties beyond that discernible by X-ray crystallography alone.[35]
The dynamics of iron and NO in nitrosyl iron porphyrinates are interestingly diverse. In solid-state structures of iron porphyrin derivatives, the nitrosyl ligand is often found to be disordered, starting from the first structurally characterized nitrosyl heme derivative, [Fe(TPP)-(NO)].[36, 37] In the {FeNO}7 systems,[38] this disorder appears to be simple rotation around the Fe–N(NO) bond, which is a relatively low barrier process.[40]–[42] A number of recent temperature-dependent crystal structures shows that the nitrosyl disorder can be dynamic even in the solid state.[41]–[43] These systems displayed two or more orientations of the NO at room temperature that merged into a single NO site at 100 K. Only in one system known thus far is a solid-state phase change involved.[43] Moreover, as described in more detail below along with the experimental method (NRVS) used to define the directionality of the iron motion, we find that the orientation of the bent, axial Fe–N–O group has a profound effect on the directions of the in-plane iron motion.
Nuclear resonance vibrational spectroscopy (NRVS, sometimes NRIXS) is a relatively new addition to the vibrational spectroscopy toolbox that allows for a more robust vibrational evaluation of heme complexes in the low frequency region of the spectrum. NRVS detects the displacement of iron (or other Mössbauer active nuclides) along the direction of the incident monochromated X-ray beam, and so peak intensity measured from single crystals is dependent upon sample orientation.[44]–[54] In our initial NRVS experiments with oriented single crystals, we carried out measurements on crystalline species in which all porphyrin planes were parallel. In the initial experiments we measured the spectrum with the X-ray beam perpendicular to the heme plane and a second measurement along the porphyrin plane in an arbitrary direction that was chosen for experimental convenience. These are the out-of-plane and (general) in-plane measurements. In these experiments, the arbitrarily chosen in-plane direction was taken to be a good representation of the in-plane vibrational spectra. Although this assumption is sometimes reasonable, it is not a good one when there is significant in-plane vibrational anisotropy as shown by the examples below.
The first set of out-of-plane and generalized in-plane NRVS measurements applied to a six-coordinate nitrosyl derivative was that for [Fe(TPP)(1-MeIm)(NO)].[52] From this direct measurement of the iron contribution to the peak, we were able to conclude that the highest frequency band (~560 cm−1) could not be described as a simple Fe–N(NO) stretch even though the peak showed a substantial 15NO isotope shift in the resonance Raman spectrum.[55, 56]
In more recent work we have explored NRVS spectra in which spectra are taken in three orthogonal directions. In addition to a measurement perpendicular to the porphyrin plane (the out-of-plane spectrum), additional measurements are taken with the X-ray beam along the porphyrin plane and in the direction parallel to a feature of chemical significance in the complex (in-plane-x) and a second normal to the first (in-plane-y). Chemically significant features are typically defined by either a planar ligand or a (nonlinear) three atom Fe–X–O group. Spectra taken in the three mutually perpendicular directions together ensure the observation of intensity from all vibrational modes with iron displacement, and importantly reveal the spatial trajectory of the iron center within each mode.
The application of this set of three orthogonal measurements in an initial experiment on [Fe(OEP)(NO)], an {FeNO}7 species,[37] clearly showed that there was substantial differences in the in-plane-x and the in-plane-y spectra, i.e., there was significant in-plane anisotropy.[57] A combination of this experiment and DFT-based vibrational predictions led to the unanticipated conclusion that the orientation of the axial Fe–N–O group and not the direction of the porphyrin Fe–N bonds largely controlled the direction of the in-plane motions of iron.[57] An exploration of the use of several different DFT functionals also led to the conclusion that the most appropriate functional for these species is the M06-L functional.[58]
A second set of oriented single-crystal measurements on the related five-coordinate nitrosyl species, [Fe(DPIX)(NO)], whose structure had been previously determined,[59] was also executed. Deuteroporphyrin IX (DPIX) is closely related to protoporphyrin IX, the heme b prosthetic group found in many hemoproteins. DPIX has an asymmetric group of β-pyrrole peripheral substituents with four methyls, two hydrogen atoms, and two proprionic acid side chains. A comparison of this study with [Fe(OEP)(NO)] allowed us to examine the possible effects of the asymmetric peripheral on the vibrational spectrum. Although there are some modest peripheral effects, we find that in [Fe(DPIX)(NO)] the orientation of the NO ligand strongly controls the direction of the in-plane iron motion as well.[60]
However, similar oriented crystal measurements on the high-spin, five-coordinate imidazole derivative, [Fe(OEP)(2-MeHim)],[61] demonstrated that the imidazole orientation had little influence on the in-plane iron motion.[62] Finally, oriented single-crystal measurements on low-spin [Fe(OEP)(2-MeHim)(NO)]+ allowed the resolution of the FeNO stretching and bending modes[63] that were not well resolved in the powder spectrum of a related species.[64]
Herein, we extend the three orthogonal NRVS measurements for the first time to a six-coordinate low-spin {FeNO}7 derivative, the monoclinic crystalline form of [57Fe(TpFPP)(1-MeIm)(NO)].[41, 53] The two orthogonal in-plane measurements show significant anisotropy; spectral predictions by DFT were also made. Taken together, the observed in-plane anisotropy is consistent with the relative orientation of the axial NO ligand having a dominant effect of the direction on the in-plane iron motion, similar to that seen in five-coordinate nitrosyl species.[57, 60]
We further examined the nature of the highest frequency band in the spectrum, which had been assigned as an Fe–NO stretch by resonance Raman spectroscopy. However, our earlier NRVS measurement led us to suggest that this band is better regarded as a combination of an FeNO stretch and FeNO bend with the majority of the kinetic energy contributed by the central nitrogen atom of the FeNO group. We find that for [Fe(TpFPP)(1-MeIm)(NO)], the band has less in-plane character than that found for [Fe(TPP)(1-MeIm)(NO)]. Nonetheless, the mode is still dominated by a large kinetic energy contribution of the nitrogen atom of the NO. We also made less extensive single-crystal NRVS measurements for two additional six-coordinate nitrosyls to further explore the nature and possible variation of this highest frequency band. Observed differences appear to be the result of the mixing of the FeNO bending and stretching modes with ligand modes that differ owing to the peripheral phenyl substituents. From this series of measurements, we still regard this mode as best described as a combination of an FeNO stretch and FeNO bend mode. The results further demonstrate the power of oriented single-crystal NRVS in defining the nature of mode localization.
Experimental Section
General Information
All reactions and manipulations for the preparation of the iron(II) porphyrin derivatives were carried out under argon using a double manifold vacuum line, Schlenkware, and cannula techniques. Dichloromethane, toluene and hexanes were distilled under argon over CaH2 and sodium/benzophenone, respectively. Chlorobenzene was purified by washing with concentrated sulfuric acid, then with water until the aqueous layer was neutral, dried with sodium sulfate and distilled twice over P2O5. 95% 57Fe2O3 was purchased from Cambridge Isotopes. H2OEP was synthesized by literature methods.[65] Nitric oxide (Mittler Specialty Gases) was purified by fractional distillation through a trap containing 4A molecular sieves bathed in a dry-ice/ethanol slurry.[66]
Small-Scale Metallation
Insertion of 57Fe into free-base porphyrins was conducted in purified chlorobenzene according to a modified Landergren method as follows.[67] Approximately 2 mL of 12 M HCl was used to dissolve ~0.20 mmol 95% 57Fe enriched Fe2O3 contained in a 250 mL Schlenk flask. After 5 min of stirring, HCl was removed under vacuum to near dryness, and subsequent steps of the metallation reaction were done in an inert environment using standard Schlenk procedures. Failure to maintain an inert environment will likely result in incomplete metal insertion. One hundred mL of freshly distilled chlorobenzene was added via cannula, and the mixture was refluxed for 2 h in a hot oil bath. Half of the chlorobenzene was removed by distillation, and 10 mL of a chlorobenzene solution containing ~0.15 mmol H2Porph and 0.4 mL 2,4,6-collidine was added via cannula. After refluxing for 3 h, chlorobenzene was removed under vacuum, and the residue was dissolved in 50 mL CH2Cl2. The solution was washed twice with 50 mL DI water, thrice with 50 mL 1 M HCl, and once with 50 mL DI water. After drying over Na2SO4 and filtration through a sintered-glass filter, solvent was removed by rotoevaporation. Minimal CH2Cl2 was used to redissolve the product and transfer to an evaporation dish. The remaining solvent was evaporated using very low heat.
Synthesis of the Six-Coordinate Nitrosyl Derivatives
The monoclinic form of [57Fe(TpFPP)(1-MeIm)(NO)] was prepared by a modification of a previously reported synthesis.[68] Approximately 40 mg of [57Fe(TpFPP)(Cl)] was placed into a 15 mL Schlenk tube along with 2 mL of chloroform and 0.4 mL of 1-methylimidazole. The solution was bubbled with Ar and then NO for 10 min. The mother liquor was then divided equally between 6 clear glass vials (26 mm ID × 55 mm, 18 mm mouth) using a disposable 10 mL syringe. The vials were purged with NO until no brown gas remained, then sealed with a tight-fitting 19/22 septa (17.5 mm OD). Duct tape was used to keep the septa from popping off during crystal growth. Shard-like crystals were recovered after about 15 h. Crystal growth took place by strict evaporation as there was no counter solvent, and the rubber septa absorbed the solvent vapor. Only the monoclinic phase was present which is in contrast to prior vapor diffusion crystal growth methods in which the triclinic phase dominated.[41] The triclinic form of [57Fe(TpFPP)(1-MeIm)(NO)] and [57Fe(TpOCH3PP)(1-MeIm)(NO)] were synthesized as described earlier using liquid diffusion methods.[41]
Crystal Mounting
Crystals were mounted onto specially prepared dual arc goniometer heads. Copper wire, 4-5 cm in length and 18 gauge, was affixed to the goniometer and bent into a u-shape. A glass fiber, 5-8 mm in length, was then super-glued to project along the goniometer φ-axis. The connection of the wire into the goniometer head was fortified with epoxy resin. A crystal was then affixed to the tip of the glass fiber using super glue. The wire was then carefully bent so that the crystal was approximately on the φ-axis, and then stretched to the required height for centering. Crystals were then oriented for NRVS analysis along specified in-plane axes by methods described in the Supporting Information.
NRVS Spectra
Spectra were measured at Sector 3-ID of the Advanced Photon Source, Argonne National Laboratory, Argonne IL. Powders were mulled with a minimal amount of Apiezon-M vacuum grease then put into the 1 × 2 × 10 mm3 cavity of 3 × 8 × 15 mm3 polystyrene sample “coffin” which was directly mounted in a He flow cryostat, and cooled to 20 K. Single-crystal samples that had been previously mounted and aligned on goniometer heads were now screwed into place on a rotating stage. The mounted crystals were then navigated into the X–ray beam by translations of the stage and rotated to the predetermined φ-angle required for the particular direction of analysis desired. Data were recorded using an in-line high-resolution monochromator operating at 14.4125 keV with 1.0 meV bandwidth scanning the energy of incident X-ray beam.[69] Spectra were recorded between −30 and 80 meV in steps of 0.25 meV, and all scans (3–6 replicates) were normalized to the intensity of the incident beam and added. NRVS raw data were converted to the vibrational density of states (VDOS) using the program PHOENIX.[44],[70]
Vibrational Predictions and Predicted Mode Composition Factors e2
The Gaussian09 program package[71] was used to optimize the structures and for frequency analysis. The S = 1/2 complex [57Fe(TpFPP)(1-MeIm)(NO)] was fully optimized using the spin unretricted DFT method. The starting structure was obtained from the crystal structure of triclinic [57Fe(TpFPP)(1-MeIm)(NO)][41, 53] Calculations for two idealized geometries were carried out. The first has the Fe–N–O and imidazole planes parallel to each other; this is within 1° of the actual structure. The second structure has the Fe–N–O and imidazole planes perpendicular to each other. An additional set of calculations and spectral predictions were made on the derivative [57Fe(TpOCH3PP)(1-MeIm)(NO)].
Frequency calculations were performed on the fully optimized structures at the same level to obtain the vibrational frequencies of the 57Fe isotope set. The frequencies reported here were not scaled. The frequency data have been created using the high precision format vibrational frequency eigenvectors in order to calculate Mode Composition Factors (e2) and Vibrational Density of States (VDOS) as described below. These were studies with the Generalized Gradient Approximation (GGA) functional (M06-L),[72] which is a local meta-GGA functional. In general, we used triple-ζ valence basis sets with polarization functions (TZVP)[73] on iron and 6-31G* for all other atoms.
The G09 output files from the DFT calculations can be used to generate predicted Mode Composition Factors with our scripts.[58] The mode composition factors for atom j and mode α are the fraction of total kinetic energy contributed by atom j (here: 57Fe, the NRVS active nucleus). The normal mode calculations are obtained from the atomic displacement matrix together with the equations:
| (1) |
| (2) |
where the sum over i runs over all atoms of the molecule, mi is the atomic mass of atom i and ri is the absolute length of the Cartesian displacement vector for atom i. The polarized Mode Composition Factors are defined in terms of two distinct in-plane directions, which can be calculated from a projection of the atomic displacement vectors onto x and y (eqn. 1).[74] Equation (1) describes the result for a generalized in-plane measurement where φ measures the angular displacement of the X-ray beam from the projection of FeNO plane onto the heme plane. A more detailed experimental determination of the in-plane vibrational spectrum can be obtained when two orthogonal measurements are made with the exciting beam along the coordinate x direction (φ = 0°) and along the y direction (φ = 90° ). The out-of-plane atomic displacement perpendicular to the porphyrin plane for a normal mode is obtained from a projection of the atomic displacement vector z (eqn. 2). The calculated x, y, and z components of the iron normal mode energy for [57Fe(TpFPP)(1-MeIm)(NO)] and [57Fe(TpOCH3PP)(1-MeIm)(NO)] with ≥ 0.005 are given in Tables S1 and S2 of the Supporting Information.
The predicted mode composition factors can also be compared to the integrated spectral areas obtained from NRVS. Therefore Vibrational Density of States (VDOS) intensities can be simulated from the Mode Composition Factors using the Gaussian normal distributions function, where the full width at half height (FWHH) is defined appropriately by considering the spectral resolution in the experiment. In this study, the MATLAB R2010a software was used to generate the predicted NRVS curves.
Results
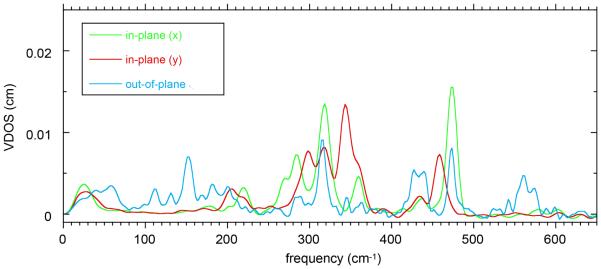
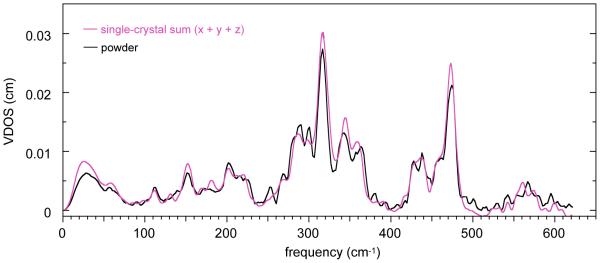
Two types of oriented single-crystal NRVS measurements have been made on six-coordinate iron(II) porphyrinates with NO and 1-methylimidazole as the trans ligands. The species are two crystalline forms of [Fe(TpFPP)(1-MeIm)(NO)] and [Fe(TpOCH3PP)(1-MeIm)(NO)]. In a first set of spectral measurements detailed information was obtained for the monoclinic phase of [Fe(TpFPP)(1-MeIm)(NO)]. In these experiments spectra were taken in three orthogonal directions; the in-plane measurements were taken with the X-ray beam perpendicular and parallel to the imidazole plane. Since the imidazole and FeNO planes are effectively coplanar, these measurements are also effectively perpendicular and parallel to the FeNO plane. The directionally dependent NRVS spectra in the three orthogonal directions are shown in Figure 1. The agreement between the sum of the three components with the powder spectrum (which should agree and attest to the quality of the measurements) is shown in Figure 2.
Figure 1.
Directional contributions to the vibrational density of states for mono-[Fe(TpFPP)(1-MeIm)(NO)]: out-of-plane (blue line), in-plane-x (green line, parallel to imidazole plane), and in-plane-y (red line, perpendicular to imidazole plane) obtained from the NRVS experiments.
Figure 2.
Comparison of the sum of out-of-plane, in-plane(x), and in-plane(y) by experimentally determined vibrational density of states (mauve line) with the powder spectrum (black line) for mono-[Fe(TpFPP)(1-MeIm)(NO)].
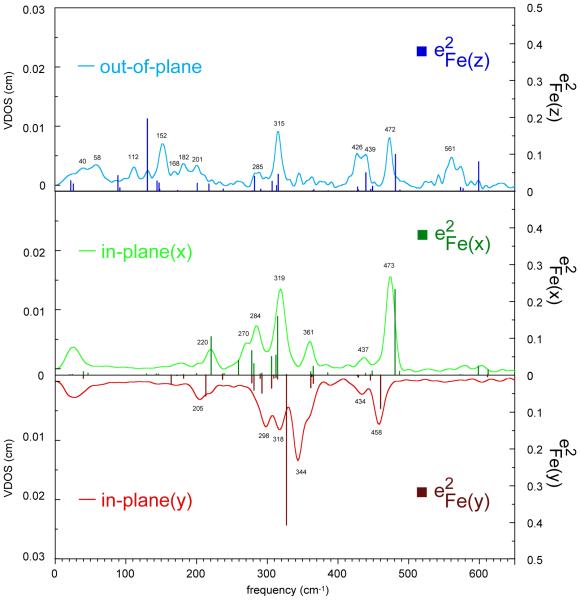
The dominant in-plane NRVS region occurs between 200 and 380 cm−1. This region includes a peak of moderate intensity at 361 cm−1, a stronger peak at 319 cm−1 and additional peaks at 284, 270, and 220 cm−1 for in-plane-x and for in-plane-y a shoulder at 363 cm−1, a strong peak at 344 cm−1 and additional peaks at 318, 298, and 205 cm−1. The x and y in-plane spectra are clearly distinct and will be discussed subsequently. The two higher in-plane frequencies are found at 473 cm−1 (x) and 458 cm−1 (y). The first is porphyrin based ν50 mixed with the Fe–NO stretch to yield iron motion that is both in-plane and out-of-plane; the 458 cm−1 mode is perpendicular to that mixed mode.
The out-of-plane NRVS spectrum displays the Fe–N(NO) stretching and bending modes, a high frequency mode that has a modest in-plane component (to be discussed subsequently) and a number of low frequency modes that includes the doming mode and modes involving the simultaneous motion of iron and imidazole.
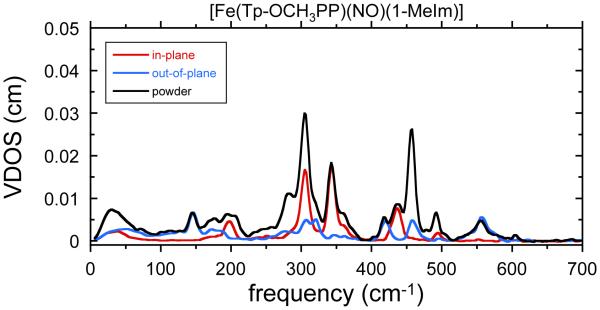
In the second set of oriented crystal measurements, the X-ray beam was oriented along the heme normal (the out-of-plane or “z” direction) and in a general, nonspecific direction in the porphyrin plane, which we will denote “gen-ip.” In this latter measurement, only a portion of the iron motion is captured. However, in general, such a set of measurement is more than adequate for understanding the complete iron dynamics. The spectra for [Fe(TpOCH3PP)(1-MeIm)(NO)] are shown in Figure 3 and those for the monoclinic and triclinic crystalline forms of [57Fe are shown in the Supporting Information (Figures S1 and S2, respectively). These spectra were measured specifically to examine the nature of the highest frequency band at ~560 cm−1.
Figure 3.
Comparison of the experimental density of states from a powder sample of [Fe(TpOCH3PP)(1-MeIm)(NO)] with two oriented crystal components: out-of-plane (blue line), and general in-plane (“gen-ip,” red line).
Spectral Predictions
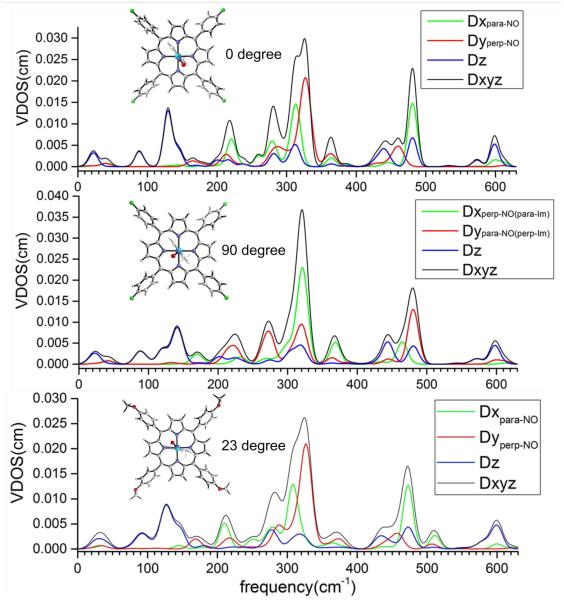
The 57Fe vibrational predictions for the three orthogonal measurements of [57Fe(TpFPP)(1-MeIm)(NO)] and [57Fe(TpOCH3PP)(1-MeIm)(NO)], based on calculations with the M06-L functional, are shown in Figure 4. The predictions are for two different relative orientations of the FeNO and imidazole planes in [57Fe(TpFPP)(1-MeIm)(NO)] and the observed orientation in [57Fe(TpOCH3PP)(1-MeIm)(NO)]. In the top panel, the two planes are coplanar (observed orientation) and in the middle panel the two planes have a dihedral angle of 90°. The top panel represents the observed structure for the measured monoclinic phase. The vibrational predictions made for [57Fe(TpOCH3PP)(1-MeIm)(NO)] are shown in the bottom panel of Figure 4.
Figure 4.
Predicted vibrational spectra for mono-[Fe(TpFPP)(1-MeIm)(NO)] as a function of the relative orientation of the FeNO and imidazole planes and the observed orientation in [57Fe(TpOCH3PP)(1-MeIm)(NO)].
Discussion
One particular advantage of oriented single-crystal NRVS measurements is the explicit information obtained on the direction of iron motion in the observed frequency. This is of considerable value in understanding the nature of the mode observed. Distinguishing modes with in-plane and/or out-of-plane motion is relatively straightforward. For example, such measurements allowed the resolution of the stretching and bending modes in six-coordinate [Fe(OEP)(2-MeHIm)(NO)]+,[63] establishing the distinct assignments for the stretching and bending modes in bona fide five-coordinate heme carbonyls,[75] and defining the in-plane anisotropy in [Fe(OEP)-(NO)].[57] The latter anisotropy is the result of the effect of the specific orientation of the bent axial Fe–N–O group on the in-plane iron motion. The observation that the orientation of the axial ligand has profound effects on the equatorial iron dynamics prompted this study of six-coordinate {FeNO}7 nitrosyls.
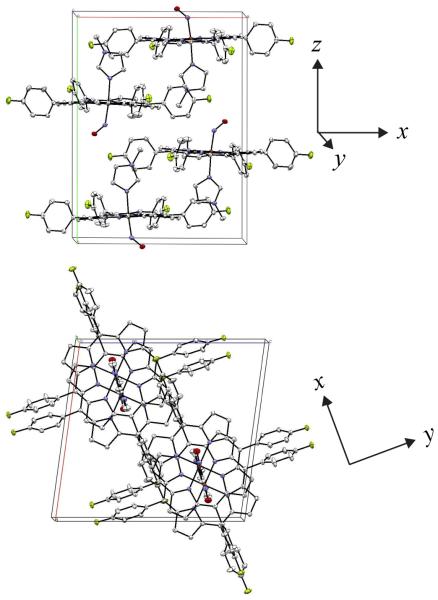
Meaningful oriented crystal measurements of porphyrin NRVS spectra in three orthogonal directions requires that the molecules in the crystal have particular orientations with respect to each other. Specifically, all porphyrin planes need to be parallel to each other and the axial ligands must all have a common orientation (inversion symmetry related molecules are allowed). These requirements are clearly met for monoclinic [Fe(TpFPP)(1-MeIm)(NO)] as shown in the diagrams of Figure 5; the porphyrin planes are coplanar to within 3°, although not required by any crystallographic constraints. The dihedral angle between the FeNO plane and the 1-methylimidazole plane is ~1°,[41] again this is not required by any symmetry constraints.
Figure 5.
Unit cell of monoclinic [Fe(TpFPP)(1-MeIm)(NO)] with view down the c-axis (top image) illustrating that the porphyrin planes are effectively parallel though not required by symmetry. The view down the b-axis (lower image) demonstrating that all Fe–N–O planes are perpendicular to the special in-plane NRVS y-axis, shown to the right of each unit cell.
The three experimental orthogonal NRVS spectra are displayed in Figure 6 as the solid lines; the M06-L predicted frequencies and intensities are shown as the solid bars. A similar figure is given in the SI (Figure S3) for a B3LYP prediction. The bottom two panels show in a “mirror image” view of the x and y in-plane vibrational anisotropy. Recall that the x direction is in the heme plane and parallel to the imidazole and FeNO planes and that y is perpendicular to the two planes. The observed peak at 473 cm−1 has already been noted as the mixed ν50 and Fe–NO stretch. A similar mixed mode in [Fe(TPP)(1-MeIm)(NO)] is observed at 472 cm−1.[52] The band observed at 458 cm−1 and predicted at 460 cm−1 is the y component of ν50 (using the notation originally established by Spiro and coworkers[76]). The second (orthogonal) component of ν50 is mixed with the Fe–N(NO) stretch at 426 and 439 cm−1. This mode had been previously found as a single band at 437 cm−1 in [Fe(TPP)(1-MeIm)(NO)][52, 54] and provides another example of the effects of peripheral substituents on the iron vibrations.
Figure 6.
Comparison of the experimental (lines) and predicted (bars)vibrational spectra for mono-[Fe(TpFPP)(1-MeIm)(NO)] based on a prediction generated using DFT and the M06-L functional.
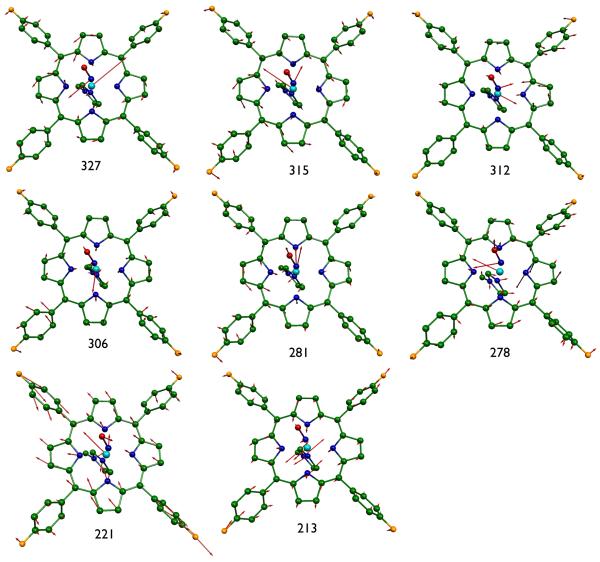
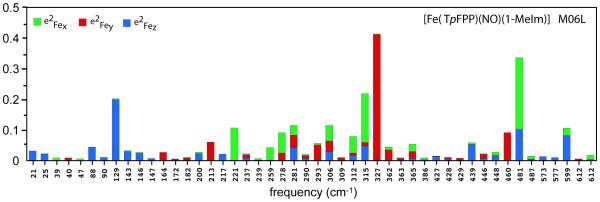
What is the origin of the in-plane iron vibrational anisotropy shown in the bottom two panels of Figure 6? We had observed for two different five-coordinate nitrosyl derivatives, [Fe(OEP)(NO)][57] and [Fe(DPIX)(NO)],[60] that the direction of the in-plane iron motion is largely found to be either parallel or perpendicular to the FeNO plane and not along the in-plane Fe–Np bonds. A similar study for a five-coordinate imidazole derivative, [Fe(OEP)(2-MeHIm)]+,[62] found that the predicted iron motions were effectively along the Fe–Np directions. There was, however, in-plane vibrational anisotropy. Accordingly we had anticipated that the in-plane anisotropy for mono-[Fe(TpFPP)(1-MeIm)(NO)] would show preferential orientational in-plane motion similar to that of the five-coordinate nitrosyls. However, the results are more nuanced. Figure 7 displays the M06-L predictions for the eight most intense vibrations with substantial in-plane motion. Although the iron motion direction of the two most intense modes (and many others) are seen to be parallel and perpendicular to the FeNO plane, a number of in-plane modes are either along the in-plane Fe–Np bond direction or intermediate between the limiting cases. A detailed breakdown of the predicted mode composition factors for mono-[Fe(TpFPP)(1-MeIm)(NO)] are shown in Figure 8. The results depicted in this figure suggests that the FeNO orientation indeed has a substantial effect on the iron in-plane motion but not as overwhelming as in the five-coordinate cases. The vibrational differences may reflect the slightly stronger Fe–NO bonding in the five-coordinate derivatives compared to the six-coordinate species. (There is a ~0.02 Å increase in the Fe–N bond distance and a ~6° decrease in the Fe-N–O bond angle for the six-coordinate species.[77])
Figure 7.
MOLEKEL depictions of the eight most intense in-plane vibrations of mono-[Fe(TpFPP)(1-MeIm)(NO)] ( > 0.061). All numerical values are frequencies given in cm−1.
Figure 8.
Mode composition factors of [Fe(TpFPP)(1-MeIm)(NO)]. Total column height represents iron kinetic energy fraction for modes. Height of colored segments reflects the directional components of the iron kinetic energy fraction: (green), (red) and (blue). Predictions made using M06L/TZVP.
There are several out-of-plane vibrations observed below ~200 cm−1 in mono-[Fe(TpFPP)(1-MeIm)(NO)] and the out-of-plane spectrum for this derivative are especially rich compared to the other six-coordinate nitrosyls. DFT spectral predictions for the low frequency region have always been problematic in predicting frequencies. For this system, the B3LYP prediction (Figure S3, Supporting Information) appears to produce a better description than the M06-L calculation. Most of the the low-frequency bands involve a combination of iron and imidazole motion, with both Fe–Im stretching and imidazole torsional motions. The 152–153 cm−1 band is the likely Fe–Im stretch and the 131 cm−1 band is the likely doming mode.
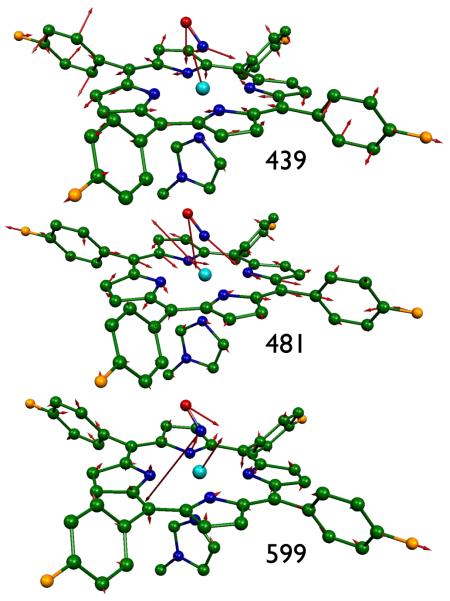
The out-of-plane region above 400 cm−1 is the remaining portion of the vibrational spectrum to be considered. In principle, the FeNO group should have two major modes in this region, the Fe–NO stretch and the Fe–N–O bend. There are however, as can be seen in Figure 1, several bands in this region. The peak observed at 473 cm−1 is, as already noted, the Fe–NO stretch mixed with ν50. The other component of the Fe–NO stretch at 426 and 439 cm−1, is also mixed with ν50. Mode mixing of the FeNO group and porphyrin ligand clearly makes the out-of-plane assignments challenging. The modes are illustrated in Figure 9.
Figure 9.
The M06-L calculated character of three out-of-plane bands in mono-[Fe(TpFPP)(1-MeIm)(NO)]. For the highest frequency band, note the large contribution of the nitrogen of NO. The iron motion is even more a pure out-of-plane motion from the experimental data.
In addition, there is the highest frequency peak in the spectrum of mono-[Fe(TpFPP)(1-MeIm)(NO)], a major feature at 561 cm−1 with a smaller component at 571 cm−1. This peak is characteristic of six-coordinate {FeNO 7 nitrosyls with a trans imidazole and its appearance can be readily used to monitor the conversion of the five-coordinate to the six-coordinate species.[78] This peak was initially assigned as the Fe–N(NO) stretch by Raman spectroscopy based on the large shift in the frequency when 14NO was replaced by 15NO. An oriented crystal NRVS study on [Fe(TPP)(1-MeIm)(NO)][52] showed this peak at 565 cm−1 and that the iron contribution to the kinetic energy distribution of the mode was small. The majority of the motion of the FeNO group is associated with the motion of the nitrogen atom. The single-crystal study also showed that the in-plane contribution was about half that of the out-of-plane iron motion component. We concluded that this high frequency peak was best assigned as the FeNO bend, albeit with some mixing of the Fe–NO stretch.
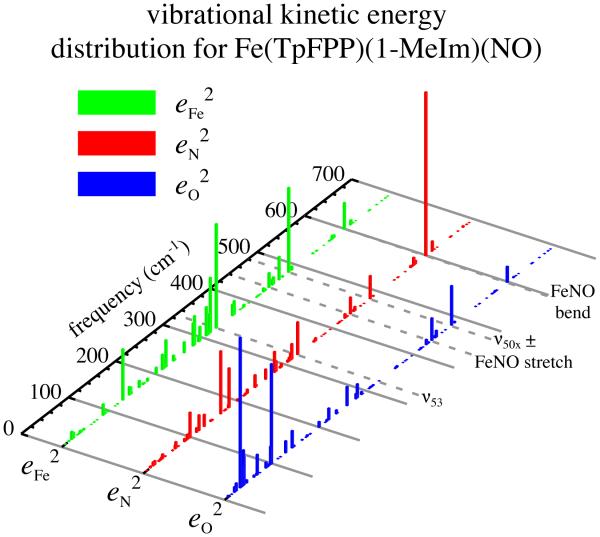
The substantial contribution of in-plane motion to the 565 cm−1 band in the Fe(TPP)(1-MeIm)(NO)] derivative is not observed in the equivalent band in mono-[Fe(TpFPP)(1-MeIm)(NO)] where almost all of the iron motion is in the out-of-plane direction. However the majority of motion of the entire FeNO group is again predicted to be that of the nitrogen atom of NO as shown in Figures 9 and 10. The differences in iron motion between these two derivatives led us to question whether there could be a ligand orientation effect. Although the NO group of [Fe(TPP)(1-MeIm)(NO)] is disordered over two positions at the temperature of the NRVS measurements,[52] the dihedral angle between the imidazole plane and the major FeNO plane is 63°, in contrast to the effectively coplanar orientation for mono-[Fe(TpFPP)(1-MeIm)(NO)]. We explored, via DFT calculations, the predicted vibrational spectral differences for two limiting species: one with the two axial ligand planes coplanar and a second with the two ligands perpendicular. The results are depicted in Figure 4. Essentially no differences are predicted in the spectral regions > 400 cm−1 and < 200 cm−1. The spectra for the > 400 cm−1 region are clearly dominated by the NO orientation (shown by the reversal of the x and y axes for the two orientations). Predictions for the in-plane region do show effects of differing ligand orientation. A similar calculation was made for [57Fe(TpOCH3PP)(1-MeIm)(NO)] and those results are also consistent with no orientation effect.
Figure 10.
The M06-L calculated vibrational kinetic energy distribution for mono-[Fe(TpFPP)(1-MeIm)(NO)].
The relative orientation of the axial ligands is thus seen to have little effect on the iron motion of the highest frequency band. Rather the peripheral phenyl substituents appear to be the major influence on the character of the observed band. We further examined the issue by additional oriented crystal experiments with NRVS measurements perpendicular to the heme plane and a single in-plane measurement. The in-plane measurements were taken at general orientations with respect to the molecular features and try to capture an overall view of the iron in-plane motion; however, they do not capture all of the vibrational intensity and directionality. The missing intensity and especially the directionality can be assessed by comparing the difference between the powder spectrum and the sum of the one measured in-plane spectrum and the out-of-plane spectrum. This difference represents what would have been measured in a spectrum after the sample had been rotated by 90° around the heme normal from the original in-plane position.[80] Such measurements were made for [Fe(TpOCH3PP)(1-MeIm)(NO)], mono-[Fe(TpFPP)(1-MeIm)(NO)], and tri-[Fe(TpFPP)(1-MeIm)(NO)], where mono and tri refer to the particular crystalline polymorph. The results are displayed in Figures 3, S1, and S2. The measurements support the idea that the highest frequency band (~560 cm−1) of all three newly measured six-coordinate nitrosyls have iron motion that has little or no in-plane motion of iron and distinct from that found for [Fe(TPP)(1-MeIm)(NO)].
The varying character of the highest frequency band is the result of mixing between the Fe–N–O bending mode, porphyrin modes, and the Fe–NO stretching mode; the differing peripheral substituents must lead to differences in mixing with ligand modes. Nonetheless the highest frequency peak is still considered to be similar in all four species. The NRVS spectra of all [Fe(Porph)(1-MeIm)(XO)] species where XO = NO, CO, or O2 are given in Table 1. Peripheral group effects are seen in the simpler spectrum of MbNO, where the prosthetic group protoporphyrin IX has only β-pyrrole substituents. It can also be seen that are distinct differences in the species according to whether or not the FeXO group is linear or bent. Species with linear FeXO groups do not display the lower frequency out-of-plane bands assigned to the Fe–XO stretch/ν50. A key similarity is the large kinetic energy contribution of the X atom in all species that is especially pronounced in the non-linear species.
Table 1.
Observed Frequencies from Oriented Single-Crystal NRVS Spectra and X-ray Structures at 100K.
| Complex | Fe-XO stretch/v50a | FeXO benda,b | FeXOc | Fe–XOd | Fe–Npd | Fe–N(Im)d | Ref. |
|---|---|---|---|---|---|---|---|
| [Fe(TPP)(1-MeIm)(NO)] | 472, 437 | 566 | 137.2e | 1.749 | 2.007 | 2.170 | 52 |
| mono-[Fe(TpFPP)(1-MeIm)(NO)] | 473, 439, 426 | 561 | 137.3f | 1.748 | 2.002 | 2.131 | tw |
| tri-[Fe(TpFPP)(1-MeIm)(NO)] | 466, 432 | 560 | 138.6f | 1.752 | 2.011 | 2.169 | tw |
| [Fe(TpOCH3PP)(1-MeIm)(NO)] | 455, 421 | 557 | 136.2f | 1.753 | 2.010 | 2.170 | tw |
| MbNOg | 452 | 558 | – | – | – | – | 81 |
| [Fe(OEP)(2-MeHIm)(NO)]ClO4 | 600 | 574/580 | 176.6 | 1.641 | 1.997 | 2.028 | 63 |
| [Fe(OEP)(1-MeIm)(CO)] | 499/513 | 582/575 | 175.7h | 1.773 | 2.010 | 2.054 | 83 |
| [Fe(TPP)(1-MeIm)(CO)] | 507 | 561/586 | 177.0i | 1.760 | 2.005 | 2.050 | 83 |
| [Fe(TpivPP)(1-EtIm)(O2)] | 417, 393 | 571 | 126.6j | 1.798 | 1.990 | 2.043 | 50 |
| [Fe(TpivPP)(2-MeHIm)(O2)] | 419, 389 | 563 | 129.9j | 1.804 | 1.995 | 2.088 | 50 |
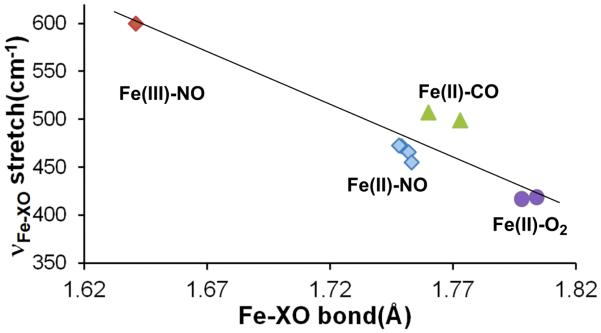
There is a correlation between the frequency observed for the band with major bend character and that found for the stretch for the iron(II) species of Table 1. This is displayed in Figure S5 that shows that a higher value for the frequency is associated with a higher frequency for the bend. For the NO derivatives this might result from mode mixing, but this is not likely for the CO complexes. The {FeNO 6 and the dioxygen complexes doe not follow the correlation. The band with major Fe–XO stretch character is also strongly correlated with the known Fe–X distances given in Table 1. This correlation is plotted in Figure 11.
Figure 11.
Plot showing the correlation of the Fe–XO stretched (determined by NRVS, (highest frequency chosen when two are observed) with the observed (X-ray) Fe–X bond lengths. The correlation coefficient for the fit for the the nonlinear Fe–X–O derivatives is 0.96.
Clearly, the unique capabilities of NRVS have allowed for a detailed description of the mode localization for the ~560 cm−1 band as well as describing the other out-of-plane modes above 400 cm−1. The spectra also show that there are detailed differences for the in-plane region but the differences cannot be analyzed in detail. The spectra again show the effects of the differing peripheral substituents owing to mode mixing.
Supplementary Material
Summary.
Detailed iron vibrational spectra from oriented single-crystals of mono-[Fe-(TpFPP)(1-MeIm)(NO)] by NRVS shows that the orientation of the axial NO group has a stronger influence on the direction of iron motion than the equatorial Fe–Np bonds. The inplane iron motion is predominantly either parallel or perpendicular to the FeNO plane and oblique to the Fe–Np bonds. The lower frequency out-of-plane peaks are the Fe–NO stretch mixed with the porphyrin mode ν50; the highest frequency band at ~560 cm−1, previously assigned by Raman spectroscopy as the Fe–NO stretch, is better assigned as the FeNO bend but it is also mixed with the Fe–NO stretch. NRVS measurements on two additional six-coordinate nitrosyls were also made and the general pattern of vibrations in all three species are similar. Subtle differences in mode character between these three derivatives and the previously studied [Fe(TPP)(1-MeIm)(NO)] must reflect the differences in mixing of the iron modes with various porphyrin ligand modes.
ACKNOWLEDGMENTS
We thank the National Institutes of Health for support of this research under Grant GM-38401 to WRS and the National Science Foundation under CHE-1026369 to JTS. Use of the Advanced Photon Source, an Office of Science User Facility operated for the US Department of Energy (DOE) Office of Science by Argonne National Laboratory, was supported by the U.S. DOE under Contract No. DE-AC02-06CH11357. We thank Dr. Allen G. Oliver for assistance with crystal alignments. We are grateful for the loan of an Oxford cryocooler from BioCARS.
Footnotes
Notes
The authors declare no competing financial interest.
References and Notes
- [1].Culotta E, Koshland DE. Science. 1992;258:1862. doi: 10.1126/science.1361684. [DOI] [PubMed] [Google Scholar]
- [2].Kots AY, Martin E, Sharina IG, Murad F. In: In Handbook of Experimental Pharmacology. Schmidt HH, Hofmann F, Stasch J-P, editors. Springer- Verlag; Berlin: 2009. p. 1. [DOI] [PMC free article] [PubMed] [Google Scholar]
- [3].Ignarro LJ. “Nitric Oxide as a Communication Signal in Vascular and Neuronal Cells,”. In: Lancaster J, editor. Nitric Oxide: Principles and Actions. Academic Press; New York: 1996. p. 111. [Google Scholar]
- [4].Ignarro LJ, editor. Nitric Oxide, Biology and Pathobiology. Academic Press; San Diego: p. 2000. [Google Scholar]
- [5].Miranda KM, Espey MG, Jourd’heuil D, Grisham MB, Fukuto JM, Feelisch M, Wink DA. Nitric Oxide. 2000;22:41. [Google Scholar]
- [6].Feelisch M, Olson KR. Nitric Oxide. 2013;35:2. doi: 10.1016/j.niox.2013.06.004. [DOI] [PubMed] [Google Scholar]
- [7].Lehnert N, Berto TC, Galinato MGI, Goodrich LE. ”The Role of Heme-Nitrosyls in the Biosynthesis, Transport, Sensing, and Detoxification of Nitric Oxide (NO) in Biological Systems: Enzymes and Model Complexes,”. In: Kadish KM, Smith K, Guilard R, editors. The Handbook of Porphyrin Science. Vol. 14. World Scientific; Singapore: 2011. p. 1. [Google Scholar]
- [8].Cary SPL, Winger JA, Derbyshire ER, Marletta MA. [Google Scholar]
- [9].Russwurm M, Koesling D. EMBO J. 2004;23:4443. doi: 10.1038/sj.emboj.7600422. [DOI] [PMC free article] [PubMed] [Google Scholar]
- [10].Moncada S, Palmer RMJ, Higgs EA. Pharmacol. Rev. 1991;43:109. [PubMed] [Google Scholar]
- [11].Snyder SH. Science. 1992;257:494. doi: 10.1126/science.1353273. [DOI] [PubMed] [Google Scholar]
- [12].Butler AR, Williams DLH. Chem. Soc. Rev. 1993:233. [Google Scholar]
- [13].Stamler JS, Singel DJ, Loscalzo J. Science. 1992;258:1898. doi: 10.1126/science.1281928. [DOI] [PubMed] [Google Scholar]
- [14].Hughes MN. Biochim. Biophys. Acta. 1999;1411:263. doi: 10.1016/s0005-2728(99)00019-5. [DOI] [PubMed] [Google Scholar]
- [15].Walker FA. J. Inorg. Biochem. 2005;99:216. doi: 10.1016/j.jinorgbio.2004.10.009. [DOI] [PubMed] [Google Scholar]
- [16].Cooper CE. Biochim. Biophys. Acta. 1999;1411:290. doi: 10.1016/s0005-2728(99)00021-3. [DOI] [PubMed] [Google Scholar]
- [17].Drapier J-C, Pellat C, Henry Y. J. Biol. Chem. 1991;266:10162. [PubMed] [Google Scholar]
- [18].Stadler J, Bergonia HA, Di Silvio M, Sweetland MA, Billiar TR, Simmons RL, Lancaster JR. Arch. Biochem. Biophys. 1993;302:4. doi: 10.1006/abbi.1993.1173. [DOI] [PubMed] [Google Scholar]
- [19].Terenzi F, Diaz-Guerra MJM, Casado M, Hortelano S, Leoni S, Bosca L. J. Biol. Chem. 270. 1995:6017–6021. doi: 10.1074/jbc.270.11.6017. [DOI] [PubMed] [Google Scholar]; (3) Maia LB, Moura JJG. Chem. Rev. 2014;114:5273. doi: 10.1021/cr400518y. [DOI] [PubMed] [Google Scholar]
- [20].Griffith W, Stuehr DJ. Anu Rev. Phys. 1995;57:707. doi: 10.1146/annurev.ph.57.030195.003423. [DOI] [PubMed] [Google Scholar]
- [21].Wang J, Stuehr DJ, Ikeda-Saito M, Rousseau DL. J. Biol. Chem. 1993;268:22255. [PubMed] [Google Scholar]
- [22].Crane BR, Arvai AS, Ghosh DK, Wu C, Getzoff ED, Stuehr DJ, Tainer JA. Science. 1998;279:2121. doi: 10.1126/science.279.5359.2121. [DOI] [PubMed] [Google Scholar]
- [23].Li H, Poulos TL. J. Inorg. Biochem. 2005;99:293. doi: 10.1016/j.jinorgbio.2004.10.016. [DOI] [PubMed] [Google Scholar]
- [24].Marletta MA. J. Biol. Chem. 1993;268:12231. [PubMed] [Google Scholar]
- [25].Rousseau DL, Li D, Couture M, Yeh S-R. J. Inorg. Biochem. 2005;99:306. doi: 10.1016/j.jinorgbio.2004.11.007. [DOI] [PubMed] [Google Scholar]
- [26].Bredt DS, Snyder SH. Annu. Rev. Biochem. 1994;63:175. doi: 10.1146/annurev.bi.63.070194.001135. [DOI] [PubMed] [Google Scholar]
- [27].Maia LB, Moura JJG. Chem. Rev. 2014;114:5273. doi: 10.1021/cr400518y. [DOI] [PubMed] [Google Scholar]
- [28].Dezfulian C, Raat N, Shiva S, Gladwin MT. Cardiovasc. Res. 2007;75:327. doi: 10.1016/j.cardiores.2007.05.001. [DOI] [PMC free article] [PubMed] [Google Scholar]
- [29].Gladwin MT, Grubina R, Doyle MP. Acc. Chem. Res. 2009;42:157. doi: 10.1021/ar800089j. [DOI] [PubMed] [Google Scholar]
- [30].van Faassen EE, Bahrami S, Feelisch M, Hogg N, Kelm M, Kim-Shapiro DB, Kozlov AV, Li H, Lundberg JO, Mason R, Nohl H, Rassaf T, Samouilov A, Slama-Schwok A, Shiva S, Vanin AF, Weitzberg E, Zweier J, Gladwin MT. Med. Res. Rev. 2009;29:683. doi: 10.1002/med.20151. [DOI] [PMC free article] [PubMed] [Google Scholar]
- [31].Rodgers KR. Curr. Opin. Chem. Biol. 1999;3:158. doi: 10.1016/S1367-5931(99)80028-3. [DOI] [PubMed] [Google Scholar]
- [32].Ma X, Sayed N, Bueve A, van den Akker F. EMBO J. 2007;26:578. doi: 10.1038/sj.emboj.7601521. [DOI] [PMC free article] [PubMed] [Google Scholar]
- [33].Nioche P, Berka V, Vipond J, Minton N, Tsai A, Raman CS. Science. 2004;306:1550. doi: 10.1126/science.1103596. [DOI] [PubMed] [Google Scholar]
- [34].Erbil WK, Price MS, Wemmer DE, Marletta MA. Proc. Natl. Acad. Sci. U.S.A. 2009;106:19753. doi: 10.1073/pnas.0911645106. [DOI] [PMC free article] [PubMed] [Google Scholar]
- [35].Zhu L, Sage JT, Champion PM. Science. 1994;266:629. doi: 10.1126/science.7939716. [DOI] [PubMed] [Google Scholar]
- [36].Scheidt WR, Frisse ME. J. Am. Chem. Soc. 1975;97:17. doi: 10.1021/ja00834a005. [DOI] [PubMed] [Google Scholar]
- [37]. The following abbreviations are used in this paper: TpFPP, dianion of tetra-para-fluorophenylporphyrin; TpOCH3PP, dianion of tetra-para-methoxyphenylporphyrin; TPP, dianion of tetraphenylporphyrin; OEP, dianion of 2,3,7,8,12,13,17,18-octaethylporphyrin; DPIX, dianion of deuteroporphyrin IX dimethyl ester; PPIX, dianion of protoporphyrin IX dimethyl ester; MPIX, dianion of mesoporphyrin IX dimethyl ester; TpivPP, dianion of picket fence porphyrin; Porph, dianion of generalized porphyrin; 1-MeIm, 1-methylimidazole; 2-MeHIm, 2-methylimidazole; 1-EtIm, 1-ethylimidazole; VDOS, vibrational density of states; NRVS, nuclear resonance vibrational spectroscopy.
- [38]. The {FeNO}n notation is that of Enemark, Feltham[39] where n is the number of d electrons plus the number of electrons in the π* orbitals of NO. The notation is designed to strongly emphasize the highly covalent nature of the triatomic FeNO unit.
- [39].Enemark JH, Feltham RD. Coord. Chem. Rev. 1974;13:339. [Google Scholar]
- [40].Patchkovskii S, Ziegler T. Inorg. Chem. 2000;39:5354. doi: 10.1021/ic0005691. [DOI] [PubMed] [Google Scholar]
- [41].Silvernail NJ, Pavlik JW, Noll BC, Schulz CE, Scheidt WR. Inorg. Chem. 2008;47:912. doi: 10.1021/ic701700p. [DOI] [PMC free article] [PubMed] [Google Scholar]
- [42].Silvernail NJ, Barabanschikov A, Sage JT, Noll BC, Scheidt WR. J. Am. Chem. Soc. 2009;131:2131. doi: 10.1021/ja8055613. [DOI] [PMC free article] [PubMed] [Google Scholar]
- [43].Silvernail NJ, Olmstead MM, Noll BC, Scheidt WR. Inorg. Chem. 2009;48:971. doi: 10.1021/ic801617q. [DOI] [PMC free article] [PubMed] [Google Scholar]
- [44].Sage JT, Paxson C, Wyllie GRA, Sturhahn W, Durbin SM, Champion PM, Alp EE, Scheidt WR. J. Phys: Condens. Mater. Phys. 2001;13:7707. [Google Scholar]
- [45].Scheidt WR, Durbin SM, Sage JT. J. Inorg. Biochem. 2005;99:60. doi: 10.1016/j.jinorgbio.2004.11.004. [DOI] [PubMed] [Google Scholar]
- [46].Sturhahn W. J. Phys.: Condens. Mater. Phys. 2006;16:S497. [Google Scholar]
- [47].Kohn VG, Chumakov AI, Rüffer R. Phys. Rev. B. 1998;58:8437. [Google Scholar]
- [48].Parlinski K, Laẓewski J, Jochym PT, Chumakov AI, Rüffer R, Kresse G. Europhys. Lett. 2001;56:275. [Google Scholar]
- [49].Petrenko T, Sturhahn W, Neese F. Hyperfine Interact. 2007;175:165. [Google Scholar]
- [50].Li J-F, Peng Q, Barabanchikov A, Pavlik JW, Alp EE, Sturhahn W, Zhao J, Schulz CE, Sage JT, Scheidt WR. Chemistry Eur. J. 2011;17:11178. doi: 10.1002/chem.201101352. [DOI] [PMC free article] [PubMed] [Google Scholar]
- [51].Li J-F, Peng Q, Barabanchikov A, Pavlik JW, Alp EE, Sturhahn W, Zhao J, Sage JT, Scheidt WR. Inorg. Chem. 2012;51:11769. doi: 10.1021/ic301719v. [DOI] [PMC free article] [PubMed] [Google Scholar]
- [52].Zeng W, Silvernail NJ, Wharton DC, Georgiev GY, Leu BM, Scheidt WR, Zhao J, Sturhahn W, Alp EE, Sage JT. J. Am. Chem. Soc. 2005;127:11200. doi: 10.1021/ja051052x. [DOI] [PMC free article] [PubMed] [Google Scholar]
- [53].Silvernail NJ, Barabanschikov A, Pavlik JW, Noll BC, Zhao J, Alp EE, Sturhahn W, Sage JT, Scheidt WR. J. Am. Chem. Soc. 2007;129:2200. doi: 10.1021/ja066869k. [DOI] [PMC free article] [PubMed] [Google Scholar]
- [54].Lehnert N, Sage JT, Silvernail NJ, Scheidt WR, Alp EE, Sturhahn W, Zhao J. Inorg. Chem. 2010;49:7197. doi: 10.1021/ic1010677. [DOI] [PMC free article] [PubMed] [Google Scholar]
- [55].Tomita T, Hirota S, Ogura T, Olson JS, Kitagawa T. J. Phys. Chem. B. 1999;103:7044. [Google Scholar]
- [56].Hu S, Kincaid JR. J. Am. Chem. Soc. 1991:2843. /em 113. [Google Scholar]
- [57].Pavlik JW, Barabanschikov A, Oliver AG, Alp EE, Sturhahn W, Zhao J, Sage JT, Scheidt WR. Angew. Chem., Int. Ed. Engl. 2010;49:4400. doi: 10.1002/anie.201000928. [DOI] [PMC free article] [PubMed] [Google Scholar]
- [58].Peng Q, Pavlik JW, Scheidt WR, Wiest O. J. Chem. Theory Comput. 2012;8:214. doi: 10.1021/ct2006456. This paper explored eight different functionals with varying basis sets and tabulated comparisons of experimental and predicted structural and vibrational data. [DOI] [PMC free article] [PubMed] [Google Scholar]
- [59].Wyllie GRA, Scheidt WR. Inorg. Chem. 2003;42:4259. doi: 10.1021/ic034364e. [DOI] [PMC free article] [PubMed] [Google Scholar]
- [60].Pavlik JW, Peng Q, Silvernail NJ, Alp EE, Hu MY, Zhao J, Sage JT, Scheidt WR. Inorg. Chem. 2014;53:2582. doi: 10.1021/ic4028964. [DOI] [PMC free article] [PubMed] [Google Scholar]
- [61].Hu C, An J, Noll BC, Schulz CE, Scheidt WR. Inorg. Chem. 2006;45:4177. doi: 10.1021/ic052194v. [DOI] [PMC free article] [PubMed] [Google Scholar]
- [62].Peng Q, Li M, Hu C, Pavlik JW, Oliver AG, Alp EE, Hu MY, Zhao J, Sage JT, Scheidt WR. Inorg. Chem. 2013;52:11361. doi: 10.1021/ic401644g. [DOI] [PMC free article] [PubMed] [Google Scholar]
- [63].Li J, Peng Q, Oliver AG, Alp EE, Hu MY, Zhao J, Sage JT, Scheidt WR. J. Am. Chem. Soc. 2014;136:18100. doi: 10.1021/ja5105766. [DOI] [PMC free article] [PubMed] [Google Scholar]
- [64].Praneeth VKK, Paulat F, Berto TC, DeBeer George S, Naether C, Sulok CD, Lehnert N. J. Am. Chem. Soc. 2008;132:15288. doi: 10.1021/ja801860u. [DOI] [PubMed] [Google Scholar]
- [65].Milgram BC, Eskildsen K, Richter SM, Scheidt WR, Scheidt KA. J. Org. Chem. 2007;72:3941. doi: 10.1021/jo070389+. [DOI] [PMC free article] [PubMed] [Google Scholar]
- [66].Dodd RE, Robinson PL. Experimental Inorganic Chemistry. Elsevier; New York: 1957. p. 253. [Google Scholar]
- [67].Landergren M, Baltzer L. Inorg. Chem. 1990;29:556. [Google Scholar]
- [68].Wyllie GRA, Schulz CE, Scheidt WR. Inorg. Chem. 2003;42:5722. doi: 10.1021/ic034473t. [DOI] [PMC free article] [PubMed] [Google Scholar]
- [69].Toellner TS. Hyperfine Interact. 2000;125:3. [Google Scholar]
- [70].Sturhahn W, Toellner TS, Alp EE, Zhang XW, Ando M, Yoda Y, Kikuta S, Seto M, Kimball CW, Dabrowski B. Phys. Rev. Lett. 1995;74:3832. doi: 10.1103/PhysRevLett.74.3832. [DOI] [PubMed] [Google Scholar]
- [71].Frisch MJ, Trucks GW, Schlegel HB, Scuseria GE, Robb MA, Cheeseman JR, Scalmani G, Barone V, Mennucci B, Petersson GA, Nakatsuji H, Caricato M, Li X, Hratchian HP, Izmaylov AF, Bloino J, Zheng G, Sonnenberg JL, Hada M, Ehara M, Toyota K, Fukuda R, Hasegawa J, Ishida M, Nakajima T, Honda Y, Kitao O, Nakai H, Vreven T, Montgomery JA, Jr., Peralta JE, Ogliaro F, Bearpark M, Heyd JJ, Brothers E, Kudin KN, Staroverov VN, Kobayashi R, Normand J, Raghavachari K, Rendell A, Burant JC, Iyengar SS, Tomasi J, Cossi M, Rega N, Millam JM, Klene M, Knox JE, Cross JB, Bakken V, Adamo C, Jaramillo J, Gomperts R, Stratmann RE, Yazyev O, Austin AJ, Cammi R, Pomelli C, Ochterski JW, Martin RL, Morokuma K, Zakrzewski VG, Voth GA, Salvador P, Dannenberg JJ, Dapprich S, Daniels AD, Farkas O, Foresman JB, Ortiz JV, Cioslowski J, Fox DJ. Gaussian, Inc.; Wallingford CT: 2009. Gaussian 09, Revision A. 02. [Google Scholar]
- [72].Zhao Y, Truhlar DG. J. Chem. Phys. 2006;125:194101. doi: 10.1063/1.2370993. [DOI] [PubMed] [Google Scholar]
- [73].Schäafer A, Horn H, Ahlrichs R. J. Chem. Phys. 1992;97:2571. [Google Scholar]
- [74]. The definitions of the x and y in this paper has x parallel to the Fe-N-O plane and y perpendicular to the Fe-N-O plane.
- [75].Linder DP, Silvernail NJ, Barabanschikov A, Zhao J, Alp EE, Sturhahn W, Sage JT, Scheidt WR, Rodgers KR. J. Am. Chem. Soc. 2014;136:9818. doi: 10.1021/ja503191z. [DOI] [PMC free article] [PubMed] [Google Scholar]
- [76].Li XY, Czernuszewicz RS, Kincaid JR, Stein P, Spiro TG. J. Chem. Phys. 1990;94:47. [Google Scholar]
- [77].Wyllie GRA, Scheidt WR. Solid-State Structures of Metalloporphyrin NOx Compounds. Chem. Rev. 2002;102:1067. doi: 10.1021/cr000080p. [DOI] [PubMed] [Google Scholar]
- [78].a) Rodgers KR, Lukat-Rodgers GS, Tang L. J. Biol. Inorg. Chem. 2000;5:642–654. doi: 10.1007/s007750000150. [DOI] [PubMed] [Google Scholar]; (b) Thomas MR, Brown D, Franzen S, Boxer SG. Biochemistry. 2001;40:15047. doi: 10.1021/bi011440l. [DOI] [PubMed] [Google Scholar]; (c) Andrew CR, George SJ, Lawson DM, Eady RR. Biochemistry. 2002;41:2353. doi: 10.1021/bi011419k. [DOI] [PubMed] [Google Scholar]
- [79]. Oriented crystal spectra for [Fe(TPP)(1-MeIm)(NO)] is given as Figure S4 of the Supporting Information.
- [80]. The validity of the analysis is easily seen from the comparison of the three components and the powder spectrum shown in Figure 2.
- [81].Zeng W, Silvernail NJ, Scheidt WR, Sage JT. Nuclear Resonance Vibrational Spectroscopy (NRVS) In: Scott RA, Lukehart CM, editors. Applications of Physical Methods to Inorganic and Bioinorganic Chemistry. John Wiley and Sons, Ltd.; Chichester, UK.: 2007. pp. 401–421. [Google Scholar]
- [82].Silvernail NJ, Roth A, Schulz CE, Noll BC, Scheidt WR. J. Am. Chem. Soc. 2005;127:14422. doi: 10.1021/ja053148x. [DOI] [PMC free article] [PubMed] [Google Scholar]
- [83].Leu BM, Silvernail NJ, Zgierski MZ, Wyllie GRA, Ellison MK, Scheidt WR, Zhao J, Sturhahn W, Alp EE, Durbin SM, Sage JT. Biophys. J. 2007;92:3764. doi: 10.1529/biophysj.106.093773. [DOI] [PMC free article] [PubMed] [Google Scholar]
- [84].Li J, Noll BC, Oliver AG, Schulz CE, Scheidt WR. J. Am. Chem. Soc. 2013;135:15627. doi: 10.1021/ja408431z. [DOI] [PMC free article] [PubMed] [Google Scholar]
Associated Data
This section collects any data citations, data availability statements, or supplementary materials included in this article.


