Abstract
Familiarity participates in the pathogenesis of hypertension, although only recently, whole genome studies have proposed regions of the human genome possibly involved in the transmission of the hypertensive phenotype. Although studies have mainly focused on autosome, hitherto the influence of sex on familial transmission of hypertension has not been considered. We analysed the database of the Campania Salute Network of Hypertension center of the Federico II University Hospital of Naples (Italy), using dichotomous variables for paternal and maternal familiarity and gender (male and female) of 12 504 hypertensive patients (6868 males and 5636 females) and 6352 controls (3484 males and 2868 females), totaling 18 856 subjects. In the hypertensive group, familiarity was present in 75% of cases with odds of 3.77 and in only 26% of the normotensives with odds of 0.94. The odds ratio (OR) indicated that familiarity increases the risk of developing hypertension by 2.91 (95% confidence interval (CI)=2.67–3.17, P<0.001) times. Additionally, maternal familiarity was 37% (OR=3.01, 95% CI=2.66–3.41, P<0.001), paternal familiarity was 21% (OR=2.31, 95% CI=2.01–2.68, P<0.001) and the double familiarity was 17% (OR=3.45, 95% CI=2.87–4.01, P<0.001), thus suggesting a plausible association between maternal familiarity and development of hypertension; this finding was observed both in male and in female patients, although the phenomenon was larger in males. Given the dominance of maternal transmission in males, by genome-wide analysis of the X chromosome, we found two regions that were differently distributed in male hypertensives with maternal hypertension. Our data highlight the importance of genetic variants in the X chromosome to the maternal transmission of the hypertensive phenotype.
Introduction
Blood pressure, like height and weight, is a continuous biological variable. The relationship between the level of blood pressure and cardiovascular risk has led to a definition of hypertension for those of arterial blood pressure associated with doubling of long-term cardiovascular risk.1
About one-fourth of the world's population (70 million in the United States and 1 billion worldwide) is affected by arterial hypertension, which is the main cardiovascular risk factor and the leading cause for an outpatient visit to physician.2
Currently, about 54% of strokes and 47% of ischaemic heart disease worldwide are attributable to high blood pressure. In addition, because of increasing rates in obesity and aging, hypertension is projected to affect 1.5 billion people, that is, about one-third of the world population, by the year 2025.2
Essential hypertension is a disease with a significant phenotypic heterogeneity and among hypertensives several differences can be considered. Indeed, hypertension phenotypes can involve different mechanisms, such as the increase in aortic stiffness, the presence of metabolic syndrome and endothelial dysfunction, which influence can greatly differ within populations.3 For example, aortic stiffness accounts for mostly of the isolated systolic hypertension observed in elderly patients.4, 5 On the contrary in young adult, hypertension is often associated with metabolic abnormalities or metabolic syndrome that includes different clinical conditions such as the association of visceral obesity and metabolic disorders.6 Nonetheless, clinical manifestations of hypertension can be determined by the variability of genetic variants along with epigenetic components in the human genome.
In essential hypertension, familiarity is present in 90% of cases, but a Mendelian transmission of hypertension is rarely observed. For complex and polygenic diseases such as hypertension, two main strategies are available to map and identify the genes involved: (1) Linkage studies (Genome Wide Linkage), which are based on a known genetic model or when the model is unknown, studying pairs of affected relatives; and (2) Association studies (Genome Wide Association), where disease genes can be mapped using allelic association studies under a hypothesis-free approach.7 The influence of specific genes on blood pressure level has been demonstrated by family studies, showing increased prevalence among siblings and between parents and children. Moreover, blood pressure level can be accounted for by genetic factors, spanning from 25% in pedigree studies to 65% in twin studies.8, 9
Two measures are typically used to evaluate the genetic component of a phenotype: (1) heritability (h2), measuring susceptibility to develop the disease due to genetic factors and (2) sibling recurrent risk (λs), which is the degree of risk of illness for a sibling of an affected individual compared with the general population. However, both heritability and sibling recurrent risk have shown a high variability on the related impact of the genetic trait to the observed phenotype. In hypertension, heritability changes from 15 to 40% and 15 to 30% for systolic and diastolic blood pressure, respectively, while the sibling recurrent risk ranges from 1.2 to 1.5, indicating a phenotype with a modest genetic effect.10, 11
Therefore, the overall search for genetic determinants of hypertension has incurred in several difficulties mainly related to the extreme variability of hypertensive phenotypes.10, 11
A different approach may involve evaluation of intermediate phenotypes of hypertension by using techniques of genetic association. Specifically, patients clustering could be helpful in reducing the interference produced by the background and leading to a more homogeneous sample.
In the present study, we aimed to a selected population from the ‘Campania Salute Network—CSN' database following a clustering approach taking into account phenotype, gender and familiarity, and found that prevalence of maternal transmission is a strong contributor for development of hypertension in the male population.
Materials and methods
Population sample-CSN database
For this study, we selected a total of 18 856 subjects consisting of 12 520 hypertensive patients (6868 males and 5636 females) and 6352 patients (3484 males and 2868 females) with cardiovascular disease excluding hypertension, which were used as controls. All parameters, including anamnesis, physical examination, blood and urinary biochemistry, EKG, cardiac and vascular ultrasound and ambulatory blood pressure monitoring were collected during ambulatory visits and stored in the server of the CSN outpatient clinic, an open registry collecting information from general practitioners and community hospitals in Campania Region, Italy. The Federico II University Institutional Ethic Committee approved both the database and the informed consent form of CSN. Detailed characteristics of CSN population have been previously reported.12, 13, 14
DNA extraction
Genomic DNA was extracted from whole blood sample of 1200 patients using a commercially available extraction kit (QuiagenMidi, Chicago, IL, USA).15
Informed consensus to the study was obtained from patients, which was previously approved by the Institutional Ethics Committee. The study was conducted according to the ethical principles that have their origins in the Declaration of Helsinki.
Genotyping
Genotyping was performed with 320 K Infinium II Assay-HumanHap 317 K duo BeadChip system SNP-array, according to the manufacturer's protocol (Illumina, San Diego, CA, USA). Quality of genotypes was evaluated by the GenCall score, which reflects the proximity within a cluster plot of the intensities of that genotype to the centroid of the nearest cluster. The score ranges from 0 to 1.
Quality control
Single-nucleotide polymorphisms (SNPs) with call rate <95%, minor allele frequency <5% and Hardy–Weinberg Equilibrium P<1 × 10⁻³ were excluded from the analysis. Quality control filters output 218 000 SNPs from the 317 K array. Samples that had call rate <95% were also excluded. Moreover, exclusion of samples due to population stratification was performed using principal component analysis, which was conducted on a reduced set of autosomal markers showing r2<0.2 and using the default outliers removal threshold (sigma=6) as implemented in Eigenstrat software.16
Imputation
Quality-controlled data set was imputed using build 36, release 22 HapMap CEU populations as the reference. Approximately 2.5 million SNPs were imputed using maximum likelihood method implemented in the MACH 1.0 software.17, 18
Linkage disequilibrium analysis
Haploview v4.2 software was used for linkage disequilibrium analysis.19 We estimated Haplotype blocks using the confidence intervals rule while Haplotype phases were inferred using the default expectation maximization algorithm.
Power calculation
QUANTO software was performed to evaluate Power Calculation. Specifically, we used the following settings: allele frequency ranging from 0.05 to 0.95, and significance threshold (P) for the screening analysis set to P<1 × 10⁻⁴ evaluating allelic, dominant and recessive genetic models.20
This last was identified by estimating the false-positive fraction on simulated data sets. Data simulation was carried out by generating 100 independent data sets composed by 317 K SNPs, with minor allele frequency distribution ranging from 5 to 50%, and 963 controls of which 410 were labelled as ‘case' and 553 as ‘control' in a random manner. We tested for association between each marker and case/control status assuming allelic, dominant and recessive genetic models and then selected the most significant model as the most informative for the SNP of interest.
For each significant threshold (ranging 0.05<P<1x10⁻⁷), the mean fraction of false-positive associations (a false-positive association was defined as an SNP with P lower than the selected significance threshold, P) was estimated over 100 simulated data sets for each P.
Statistical analysis for association
Distribution analysis was performed using the chi-squared test. When comparing family history of hypertension frequencies, those observed in male hypertensive patients were referred to those observed in female hypertensives.
Association between the set of SNPs passing the quality control criteria and the phenotype selected was tested by Pearson chi-squared allelic association test with one degree of freedom (df) (a (minor allele) vs A (major allele), assuming a dominant (aa/aA vs AA, 1 df) and a recessive (aa vs aA/AA, 1 df) genetic effect. Logistic regression under additive, dominant and recessive genetic models was applied to estimate the odd ratio (OR) and 95% confidence interval (CI) for each of the different genetic models to ascertain potentially confounding gender-specific effects. Adjustment for potential confounding effects was considered by genomic control approach.21 PLINK 22 was used for all statistical procedures, except when specified.
Results
Population
Our study was carried out in a total of 18 856 subjects, that is, 12 504 patients with clinical history of hypertension (6868 males and 5636 females), and 6352 cardiovascular patients without diagnosis of hypertension (3484 males and 2868 females) that are enrolled in the database, and that had access to the outpatient clinic for possible diagnosis hypertension that was eventually excluded, or for ischaemic, cardiac valve or arrhythmic disease that was not associated with hypertensive status. Population was homogenous for prevalence of cardiovascular disease (coronary artery disease, heart failure and implantation of electrical stimulation devices) (Table 1).
Table 1. Anthropometric data of 12 504 patients with clinical history of hypertension (6868 male and 5636 female) compared with the data of 6352 patients without diagnosis of hypertension (designated as controls).
| Age (years) | Gender F/M(%) | Weight (kg) | Height (cm) | BMI (kg m−2) | SBP (mm Hg) | DBP (mm Hg) | |
|---|---|---|---|---|---|---|---|
| Hypertensive | 52.44±0.1 | 44%/56% | 78.2±0.2 | 167.41±0.1 | 27.85±0.05 | 142.25±0.2 | 88.44±0.1 |
| No hypertensive | 45±0.54 | 48%/52% | 74.91±0.7 | 169.18±0.5 | 26.3±0.6 | 128.44±2.1 | 81.06±1.8 |
Abbreviations: BMI, body mass index; DBP, diastolic blood pressure; SBP, systolic blood pressure.
Phenotype and familiarity
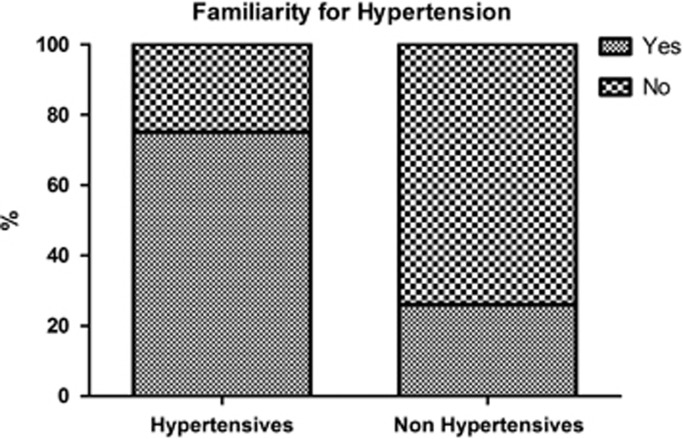
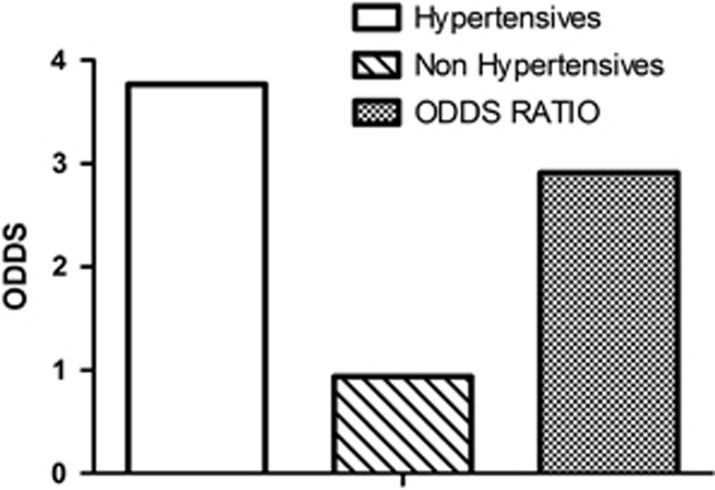
Familiarity was present in 75% of the hypertension cases and only in 26% of the normotensives (Figure 1). The likelihood (defined by the odds) of familiarity was significantly higher in the hypertensive group with respect to the normotensive patients (3.77 vs 0.94). Likewise, the relative risk expressed as OR was 2.91 (95% CI=2.66–3.17, P<0.001) times more frequent in the hypertensive patients than in normotensives (Figure 2). These results suggest that offspring of parents with hypertension have three times higher risk to develop hypertension in adult life than children of normotensive parents.
Figure 1.
Higher frequency of family history of hypertension among hypertensive patients. Patients with hypertension presented more often family history of hypertension (left column) than non-hypertensive patients used as a control (right column). Statistic significance was assessed by chi-square test, P<0.001.
Figure 2.
Likelihood of a family history of hypertension expressed as odds is different between hypertensive patients (in green) and non-hypertensive patients used as controls (in red). The relative risk expressed as the OR indicates that familiarity increases the risk of developing hypertension by 2.91 (95% CI=2.67–3.17, P<0.001) times.
Familiarity and gender in the hypertensive group
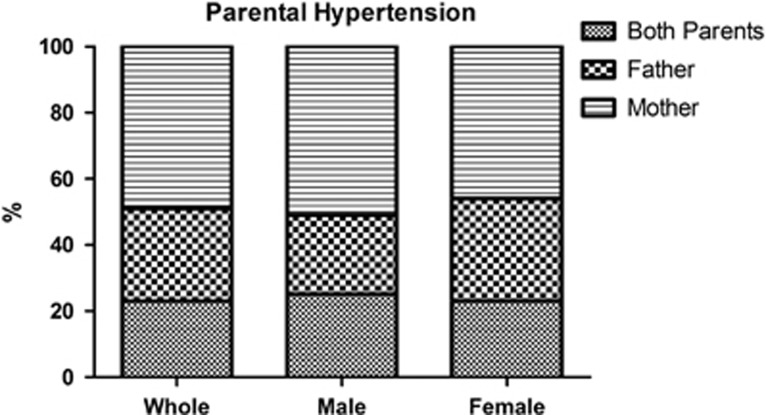
We divided hypertensive patients with family history of hypertension into subcategories according to the presence of maternal, paternal or double familiarity. We found that almost 50% of hypertensive patients had maternal familiarity, and this number increased to almost 75% when considering those hypertensives with double familiarity, as illustrated in Figure 3. Analysis of familiarity in relation to gender revealed that in the female hypertensive group, 69% had maternal familiarity, alone or in double familiarity (Figure 3), whereas in the male hypertensive group this percentage raised to 76%, as 51% had maternal familiarity and 25% had double familiarity (Figure 3). The difference in the observed cases of maternal hypertension observed in hypertensive males compared with those observed in hypertensive females was very statistically significant, when compared by the chi-square test (P<0.0001). Therefore, the maternal transmission of hypertension is more often observed in male than in female hypertensives in our population.
Figure 3.
Presence of maternal, paternal or double familiarity of hypertension among the hypertensive patients with family history of hypertension, as whole or divided by gender. The number of observed cases of maternal hypertension history among hypertensive males was much larger than that expected using hypertensive female as a reference (5220 vs 4769, P<0.0001, chi-square test).
X-chromosome SNPs and hypertensive familiarity
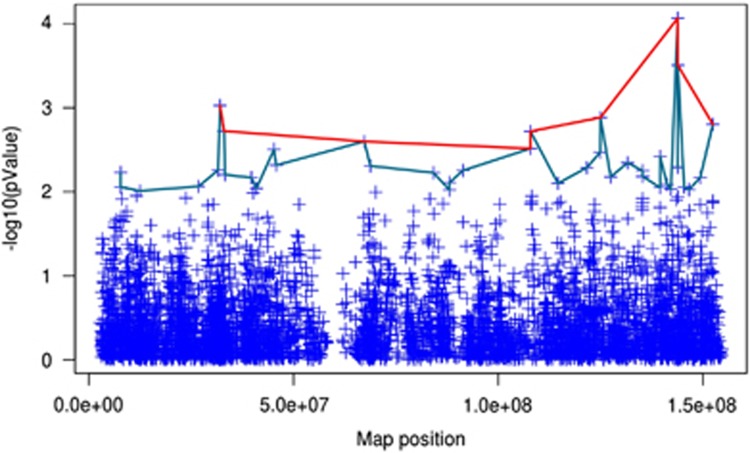
Prevalence of maternal familiarity of hypertension suggests that the X chromosome is involved in determining the hypertensive phenotype. To explore this hypothesis, we used genome-wide genotype data of 615 hypertensive patients currently available in our database. Our analysis identified two genetic regions in the X chromosome that were significantly associated with the familiarity phenotype (Figure 4). The polymorphisms included in these regions, with levels of association by a P-value of <10−3, are illustrated in Tables 2 and 3.
Figure 4.
Summary of the levels of significance for all SNPs on the X chromosome as two peaks are observed. The green line links SNPs that have −log10 (P-value)>2.5 (i.e., P<0.001), while the red line links SNPs with −log10 (P-value)>2 (i.e, P<3.1 × 10⁻³). Two regions of chromosome X associate with a higher level of significance to maternal history of hypertension: one is comprised between 10000000 and 52058362 bp; the other one ranges from 123825787 to 168825787 bp.
Table 2. Summary of SNPs that are located in the region of the X chromosome that extends up to the position 52058362.
| SNPs | Position | −log10 (P-value) | P-value | Gene |
|---|---|---|---|---|
| rs3915296 | 7788738 | 2.22879 | 0.005905 | No |
| rs845122 | 7790764 | 2.055776 | 0.008795 | No |
| rs2304605 | 12537957 | 2.011001 | 0.00975 | FRMPD4 |
| rs5986678 | 26751837 | 2.063741 | 0.00864 | No |
| rs10521976 | 31606813 | 2.255675 | 0.00555 | DMD |
| rs1317098 | 32058362 | 3.027029 | 0.00094 | DMD |
| rs2182289 | 33035448 | 2.722287 | 0.0019 | DMD |
| rs4366220 | 33277344 | 2.203242 | 0.00626 | No |
| rs5917336 | 39704495 | 2.167296 | 0.0068 | No |
| rs2284116 | 40936724 | 2.039422 | 0.00913 | USP9X |
| rs5952767 | 45222263 | 2.504622 | 0.00313 | No |
| rs2148106 | 45783625 | 2.470942 | 0.00338 | No |
Abbreviations: DMD, Duchenne Muscular Dystrophy; SNP, single-nucleotide polymorphism.
Table 3. SNPs located within the region of the X chromosome that extends from 123825787 to 168825787 base pairs.
| SNPs | Position | −log10 (P-value) | P-value | Gene |
|---|---|---|---|---|
| rs582694 | 125000000 | 2.471 | 0.00338 | No |
| rs209637 | 125000000 | 2.885 | 0.00130 | No |
| rs5932441 | 127000000 | 2.176 | 0.00666 | No |
| rs243451 | 132000000 | 2.345 | 0.00452 | HS6ST2 |
| rs912002 | 135000000 | 2.250 | 0.00562 | GPR112 |
| rs6635268 | 135000000 | 2.181 | 0.006586 | GPR112 |
| rs6634180 | 140000000 | 2.051 | 0.00889 | No |
| rs6528726 | 140000000 | 2.419 | 0.00381 | No |
| rs5908269 | 141000000 | 2.086 | 0.00820 | No |
| rs1989382 | 142000000 | 2.029 | 0.00934 | No |
| rs5920360 | 144000000 | 4.066 | 0.00009 | No |
| rs5966378 | 144000000 | 2.291 | 0.00512 | No |
| rs7881233 | 144000000 | 3.507 | 0.00031 | No |
| rs5920193 | 145000000 | 2.056 | 0.00880 | No |
| rs7883888 | 147000000 | 2.025 | 0.00945 | No |
| rs524400 | 149000000 | 2.169 | 0.00678 | MAMLD1 |
| rs743642 | 152000000 | 2.803 | 0.00158 | BGN |
Abbreviation: SNP, single-nucleotide polymorphism.
Weight of X-chromosome SNPs in clustered hypertensive patients
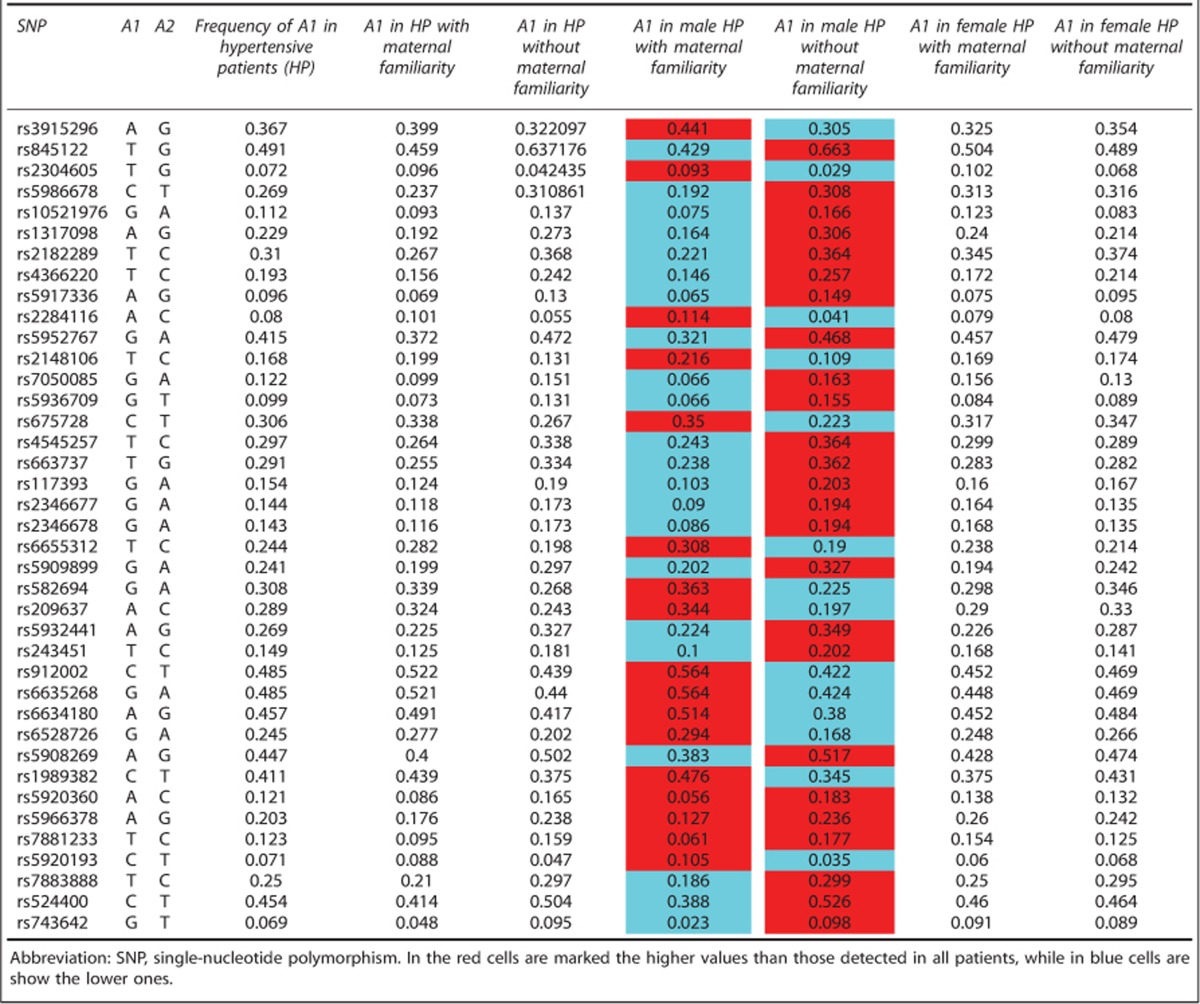
The specific weight of the X chromosome in the transmission of the hypertensive phenotype was evaluated by dividing the hypertensive population by gender and maternal familiarity (Table 4). This table shows all SNPs located in the X chromosome with P<0.001. We observed a difference in allele frequency distribution of SNPs in male patients compared with female patients. Moreover, within male group, a comparison of SNPs allele frequency between ‘hypertensive mother male' and ‘not hypertensive mother male' showed opposite findings. For example, the frequency of allele B in the first group was higher than the one detected in all hypertensive patients and lower in the second group, or vice versa. However, these observations were not found in the female group (Table 4). Therefore, these data show that in males, a maternal family history of hypertension is associated with a higher SNPs variability on the X chromosome with respect to either female group or the general hypertensive population.
Table 4. Minor allele frequency distribution of captured SNPs located in the X chromosome P-value<0.001 among various categories.
Discussion
This work can be summarized in three key points: (1) the prevalence of maternal familiarity in the hypertensive population, (2) the association between familiarity and maternal X chromosome and (3) the observation that maternal familiarity has a greater weight in hypertensive men.
The link between familiarity and hypertension is well demonstrated in the literature.8, 9 Moreover, in selected populations the role of genetic factors appears to be likely predominant with respect to the environment.23, 24 However, the specific weight of familiarity is still underestimated for confounding factors in the general population. Our data support the hypothesis that the role of genetic trait on hypertension phenotypes can be unveiled by filtering and clustering a selected population, and allows to identify specific genetic factors for hypertension.
Our study takes place by the observed lack of data on maternal familiarity, probably due also to the low diffusion of detailed database. We overcame this limitation by using a digital medical record, started in 1997 with a high level of Information Communication Technology. This technology has allowed an easy clustering of patients present in the database into subcategories.
The association between maternal familiarity and hypertension has been previously occasionally reported, with opposite outcomes.25 The genetics analysis was previously performed on the variation of the mitochondrial DNA, which is maternally transmissed.26 Our study identifies for the first time the possible role of the X chromosome in familiar transmission of hypertension. The X chromosome appears to be neglected in genome-wide association studies despite several works in the literature showing the role of sex chromosomes in increased susceptibility to hypertensive mice.25, 27
Therefore, using a Genome Wide Analysis method in combination with a clustering approach for investigating the role of the X chromosome, we identified a number of SNPs that are associated with defined trait ‘maternal familiarity for hypertension'.
The X-chromosome SNPs observed in our study are also associated with other diseases, such as SNP rs10521976 located in the DMD gene, which is responsible for Duchenne Muscular Dystrophy (DMD) and Becker Muscular Dystrophy. DMD is a fatal X-linked recessive disease that affects 1 in 3500 males and at an advanced stage the disease progresses to left ventricular dysfunction and development of pulmonary hypertension.28 This observation supports the role of the X chromosome in the determination of blood pressure and hypertensive phenotype with mechanisms that are yet to be elucidated. The male patients, genetically equipped with only one X chromosome, appear to be a category in which the weight of the X-chromosome variability is stronger.
Some limitations of this study need to be considered: (1) the small number of patients subjected to genetic evaluations for which the values of P-values are not genome-wide significant (defined as P<1x10⁻⁸). However, the clustering of data from a well-documented database allowed us to be confident that the results presented herein are plausible; (2) we did not propose a specific pathogenic hypothesis since we have considered only two regions in the X chromosome and the relative SNPs without focusing on specific gene(s). However, this could also be considered as a more realistic approach given the multifactorial nature of hypertension.
In the future, investigation of the role of sex in transmittance of the hypertensive phenotype should take into account the X chromosome and the mitochondrial DNA variability in an integrated manner.
Finally, trying to translate our findings onto the clinical scenario, we found that the presence of maternal familiarity can predict development of hypertension in males.
The authors declare no conflict of interest.
References
- Chobanian AV, Bakris GL, Black HR, Cushman WC, Green LA, Izzo JL Jr. et al. Seventh report of the Joint National Committee on Prevention, Detection, Evaluation, and Treatment of High Blood Pressure. Hypertension 2003; 42: 1206–1252. [DOI] [PubMed] [Google Scholar]
- Mancia G, Fagard R, Narkiewicz K, Redon J, Zanchetti A, Bohm M et al. 2013 ESH/ESC guidelines for the management of arterial hypertension: the Task Force for the Management of Arterial Hypertension of the European Society of Hypertension (ESH) and of the European Society of Cardiology (ESC). Eur Heart J 2013; 34: 2159–2219. [DOI] [PubMed] [Google Scholar]
- Franklin SS, Gustin Wt, Wong ND, Larson MG, Weber MA, Kannel WB et al. Hemodynamic patterns of age-related changes in blood pressure. The Framingham Heart Study. Circulation 1997; 96: 308–315. [DOI] [PubMed] [Google Scholar]
- Franklin SS, Khan SA, Wong ND, Larson MG, Levy D. Is pulse pressure useful in predicting risk for coronary heart disease? The Framingham Heart Study. Circulation 1999; 100: 354–360. [DOI] [PubMed] [Google Scholar]
- Franklin SS. Hypertension in older people: part 1. J Clin Hypertens (Greenwich) 2006; 8: 444–449. [DOI] [PMC free article] [PubMed] [Google Scholar]
- Expert Panel on Detection, Evaluation, and Treatment of High Blood Cholesterol in Adults. Executive Summary of The Third Report of The National Cholesterol Education Program (NCEP) Expert Panel on Detection, Evaluation, And Treatment of High Blood Cholesterol In Adults (Adult Treatment Panel III). JAMA 2001; 285: 2486–2497. [DOI] [PubMed] [Google Scholar]
- Mein CA, Caulfield MJ, Dobson RJ, Munroe PB. Genetics of essential hypertension. Hum Mol Genet 2004; 13, Spec No 1 R169–R175. [DOI] [PubMed] [Google Scholar]
- Feinleib M, Garrison RJ, Fabsitz R, Christian JC, Hrubec Z, Borhani NO et al. The NHLBI twin study of cardiovascular disease risk factors: methodology and summary of results. Am J Epidemiol 1977; 106: 284–285. [DOI] [PubMed] [Google Scholar]
- Mongeau JG, Biron P, Sing CF. The influence of genetics and household environment upon the variability of normal blood pressure: the Montreal Adoption Survey. Clin Exp Hypertens A 1986; 8: 653–660. [DOI] [PubMed] [Google Scholar]
- Padmanabhan S, Melander O, Hastie C, Menni C, Delles C, Connell JM et al. Hypertension and genome-wide association studies: combining high fidelity phenotyping and hypercontrols. J Hypertens 2008; 26: 1275–1281. [DOI] [PubMed] [Google Scholar]
- Padmanabhan S, Newton-Cheh C, Dominiczak AF. Genetic basis of blood pressure and hypertension. Trends Genet 2012; 28: 397–408. [DOI] [PubMed] [Google Scholar]
- De Luca N, Izzo R, Iaccarino G, Malini PL, Morisco C, Rozza F et al. The use of a telematic connection for the follow-up of hypertensive patients improves the cardiovascular prognosis. J Hypertens 2005; 23: 1417–1423. [DOI] [PubMed] [Google Scholar]
- Iaccarino G, Trimarco V, Lanni F, Cipolletta E, Izzo R, Arcucci O et al. beta-Blockade and increased dyslipidemia in patients bearing Glu27 variant of beta2 adrenergic receptor gene. Pharmacogenomics J 2005; 5: 292–297. [DOI] [PubMed] [Google Scholar]
- de Simone G, Izzo R, Aurigemma GP, De Marco M, Rozza F, Trimarco V et al. Cardiovascular risk in relation to a new classification of hypertensive left ventricular geometric abnormalities. J Hypertens 2015; 33: 745–754 discussion 754. [DOI] [PubMed] [Google Scholar]
- Iaccarino G, Izzo R, Trimarco V, Cipolletta E, Lanni F, Sorriento D et al. Beta2-adrenergic receptor polymorphisms and treatment-induced regression of left ventricular hypertrophy in hypertension. Clin Pharmacol Ther 2006; 80: 633–645. [DOI] [PubMed] [Google Scholar]
- Price AL, Patterson NJ, Plenge RM, Weinblatt ME, Shadick NA, Reich D. Principal components analysis corrects for stratification in genome-wide association studies. Nat Genet 2006; 38: 904–909. [DOI] [PubMed] [Google Scholar]
- Li Y, Willer CJ, Ding J, Scheet P, Abecasis GR. MaCH: using sequence and genotype data to estimate haplotypes and unobserved genotypes. Genet Epidemiol 2010; 34: 816–834. [DOI] [PMC free article] [PubMed] [Google Scholar]
- Marchini J, Howie B, Myers S, McVean G, Donnelly P. A new multipoint method for genome-wide association studies by imputation of genotypes. Nat Genet 2007; 39: 906–913. [DOI] [PubMed] [Google Scholar]
- Barrett JC, Fry B, Maller J, Daly MJ. Haploview: analysis and visualization of LD and haplotype maps. Bioinformatics 2005; 21: 263–265. [DOI] [PubMed] [Google Scholar]
- Gauderman W, Morrison J: QUANTO 1.1: a computer program for power and sample size calculations for genetic-epidemiology studies. Available at http://biostats.usc.edu/Quanto.html.
- Devlin B, Roeder K. Genomic control for association studies. Biometrics 1999; 55: 997–1004. [DOI] [PubMed] [Google Scholar]
- Purcell S, Neale B, Todd-Brown K, Thomas L, Ferreira MA, Bender D et al. PLINK: a tool set for whole-genome association and population-based linkage analyses. Am J Hum Genet 2007; 81: 559–575. [DOI] [PMC free article] [PubMed] [Google Scholar]
- Rotimi CN, Cooper RS, Cao G, Ogunbiyi O, Ladipo M, Owoaje E et al. Maximum-likelihood generalized heritability estimate for blood pressure in Nigerian families. Hypertension 1999; 33: 874–878. [DOI] [PubMed] [Google Scholar]
- Fermino RC, Seabra A, Garganta R, Maia JA. Genetic factors in familial aggregation of blood pressure of Portuguese nuclear families. Arq Bras Cardiol 2009; 92: 199–204 203-199. [DOI] [PubMed] [Google Scholar]
- Ellis JA, Wong ZY, Stebbing M, Harrap SB. Sex, genes and blood pressure. Clin Exp Pharmacol Physiol 2001; 28: 1053–1055. [DOI] [PubMed] [Google Scholar]
- Yang Q, Kim SK, Sun F, Cui J, Larson MG, Vasan RS et al. Maternal influence on blood pressure suggests involvement of mitochondrial DNA in the pathogenesis of hypertension: the Framingham Heart Study. J Hypertens 2007; 25: 2067–2073. [DOI] [PubMed] [Google Scholar]
- Yagil C, Sapojnikov M, Kreutz R, Zurcher H, Ganten D, Yagil Y. Role of chromosome X in the Sabra rat model of salt-sensitive hypertension. Hypertension 1999; 33: 261–265. [DOI] [PubMed] [Google Scholar]
- Yotsukura M, Miyagawa M, Tsuya T, Ishihara T, Ishikawa K. Pulmonary hypertension in progressive muscular dystrophy of the Duchenne type. Jpn Circ J 1988; 52: 321–326. [DOI] [PubMed] [Google Scholar]


