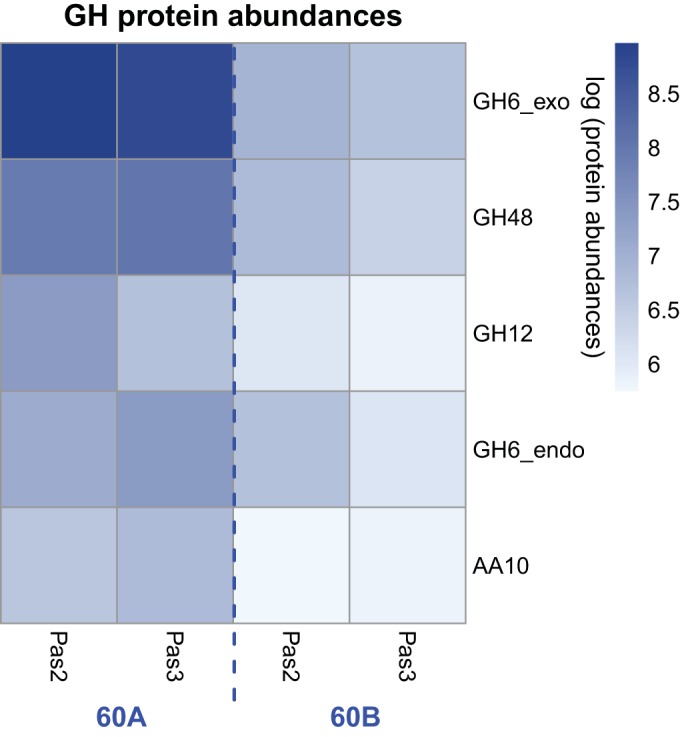
FIG 3 .

Heat map representing the proteomic abundances of the T. bispora cellulases (the GH12, GH6_exo, GH48, GH6_endo, and AA10 proteins) as measured by LC-MS/MS-based iTRAQ quantification. Lighter colors indicate lower log proteomic abundances of each cellulase in four different samples, and darker colors indicate higher log abundances. Pas2 and Pas3 represent supernatants recovered from passage 2 and passage 3 of each culture lineage, respectively.
