

Abstract
Sirolimus is increasingly being used in neonates and infants, but the mechanistic basis of age‐dependent changes in sirolimus disposition has not been fully addressed yet. In order to characterize the age‐dependent changes, serial sirolimus clearance (CL) estimates in individual young pediatric patients were collected and analyzed by population modeling analysis. In addition, sirolimus metabolite formation was also investigated to further substantiate the corresponding age‐dependent change in CYP3A activity. The increasing pattern over time of allometrically size‐normalized sirolimus CL estimates vs. age was well described by a sigmoidal Emax model. This age‐dependent increase was also observed within each individual patient over a 4‐year study period. CYP3A‐dependent sirolimus metabolite formation changed in a similar fashion. This study clearly demonstrates the rapid increase of sirolimus CL over time in neonates and infants, indicating the developmental change. This developmental pattern can be explained by a parallel increase in CYP3A metabolic activity.
Study Highlights.
WHAT IS THE CURRENT KNOWLEDGE ON THE TOPIC?
☑ Sirolimus is increasingly being used in young children, but there is limited dosing experience in neonates and infants. Furthermore, there is lack of mechanistic understanding of age‐dependent changes in sirolimus disposition in these populations.
• WHAT QUESTION DID THIS STUDY ADDRESS?
☑ The relationship between patient's age and allometrically size‐normalized sirolimus clearance estimate could be described by a sigmoidal Emax model. The ratio of sirolimus metabolite concentration to parent concentration increased in a similar age‐dependent manner.
• WHAT THIS STUDY ADDS TO OUR KNOWLEDGE
☑ This study demonstrates the age‐dependent trajectory of sirolimus clearances in neonates and infants after considering the effect of body size. It also suggests that developmental change in CYP3A expression is the most important factor for the age‐dependent trajectory in neonates and infants.
• HOW THIS MIGHT CHANGE DRUG DISCOVERY, DEVELOPMENT, AND/OR THERAPEUTICS
☑ The age‐dependent sirolimus clearance will facilitate the development of age‐appropriate dosing guidelines for neonates and infants. Our study also demonstrates the effective utilization of sparse clinical trial data collected from neonates and infants to explore the mechanism of the developmental trajectory.
Sirolimus is an mTOR (mammalian target of rapamycin) inhibitor1 that was first approved in the US in 1999 and in Europe in 2001 as an immunosuppressive drug intended to prevent organ rejection in renal transplantation. Recently, sirolimus is increasingly being used in pediatric patients for the treatment of various rare diseases such as vascular anomalies and neurofibromatosis.2, 3, 4 However, there is still limited dosing experience in neonates and infants. In general, age‐dependent changes in pharmacokinetics of a drug over the course of childhood are considered to be attributed to two aspects: one is an age‐dependent increase in body size and anatomical organ size (size effect); the other is developmental changes in physiological parameters related to organ function (maturation effect).5, 6 In this study, sirolimus blood concentration data in pediatric patients obtained from a real‐time concentration‐controlled clinical trial were utilized to investigate age‐dependent changes in pharmacokinetics of sirolimus over the course of childhood based on the principles of size and maturation effects.5, 6
Sirolimus is extensively metabolized through CYP3A4 and CYP3A5 pathways.7, 8 These CYP3A enzymes exist predominantly in the liver and small intestine.9, 10 Intestinal metabolism was estimated to be a major elimination pathway, as recently shown in an in vitro‐in vivo extrapolation (IVIVE) study.8 As one of the age‐dependent physiological changes related to sirolimus clearance, developmental change in CYP3A enzyme expression needs to be considered as well as increases in organ size. There are several in vitro studies showing age‐dependent changes in each hepatic CYP3A isoform expression,11, 12 but information on intestinal CYP3A ontogeny is limited.13 In this study, sirolimus CYP3A‐mediated formation of metabolite was also investigated in patients to understand the cause of the age‐dependent changes in sirolimus clearance (CL).
The aim of this study was to capture the developmental trajectory of sirolimus CL by utilizing sequential sirolimus CL observations in individual patients whose concentrations were periodically monitored over a 4‐year period as part of a concentration‐controlled clinical trial.4 In addition, the relationship between formation of five CYP3A‐dependent sirolimus metabolites and patient's postmenstrual age was examined to further clarify the impact of CYP3A metabolism on the age‐dependent increase in sirolimus CL.
MATERIALS AND METHODS
Patients and clinical data
This study was conducted using data from patients participating in a concentration‐controlled sirolimus phase II study in children with complicated vascular anomalies (www.clinicaltrials.gov; NCT00975819).4, 14 The pediatric study population included neonates and infants. Briefly, all patients had adequate liver and renal functions and did not receive CYP3A4 inhibitors or inducers at study entry. In addition, patients on chronic systemic steroid treatment or other immunosuppressive agents were excluded from this analysis with the exclusion of one diagnosis, kaposiform hemangioendothelioma (KHE), which usually presents in the newborn to toddler period. In the phase II study, sirolimus was started at an oral dose of 0.8 mg/m2 twice a day.14 Subsequent dosing was pharmacokinetically guided to achieve and maintain a target trough concentration of 10 to 15 ng/mL during the 4‐year study period.14 Demographic information was collected on all patients and is summarized in Table 1.
Table 1.
Demographics in pediatric patients with vascular anomalies
| Parameters | Median | Min–Max | 25–75% Percentiles |
|---|---|---|---|
| Age (years) | 4.8 | 0.058–19 | 1.6–12 |
| Body weight (kg) | 18 | 4.0–101 | 11–43 |
| Height (cm) | 108 | 53–183 | 76–154 |
| BSA (m2) | 0.77 | 0.23–2.2 | 0.46–1.3 |
| Sex | Male (20); female (32) | ||
| Race | Caucasian (39), American African (7); Asian (1); other (4), unknown (1) | ||
| Ethnic | Hispanic (2), non‐Hispanic (49), unknown (1) | ||
Total number of patients was 52. All demographics at the start of therapy are shown.
Sirolimus and its metabolite concentration measurements in blood from patients
Sirolimus whole blood concentrations were determined at our institution by a validated high‐performance liquid chromatography‐tandem mass spectrometry (LC/MS‐MS) assay used for routine therapeutic drug monitoring as described previously.15 For this study, blood concentrations of sirolimus metabolites, 24‐, 25‐, and 46‐hydroxysirolimus and 16‐ and 39‐O‐demethysirolimus were separately determined by LC/MS‐MS using an ABSciex API4000 mass spectrometer (ABSciex, Concord, ON, Canada) in the single ion mode (SIM), as previously described.16 Key assay performance parameters were as follows: lower limit of quantitation, 0.05 ng/mL; range of linear response, 0.05–25.0 ng/mL (r > 0.997); interday precision, 3.3–12.3%; and interday accuracy, 86.7–120%. There was no significant matrix effect or carryover. Autosampler stability at +4°C was at least 24 hours.
Individual clearance estimates by Bayesian estimation
Multiple blood samples were collected for sirolimus concentration measurement from each patient during the 4‐year study period in the sirolimus phase II study. By using each sirolimus concentration measurement, a maximum a posteriori probability (MAP) Bayesian sirolimus CL estimate was generated at each sampling point. These sirolimus CL estimates were used to characterize the developmental trajectory of sirolimus CL within individual patients younger than 4 years old. In addition, by using all sirolimus concentrations observed during the first 3 months of treatment, sirolimus CL was also estimated. The sirolimus CL estimate was used as the averaged CL for each patient aged 3–19 years to examine the correlation between body weights and CL estimates (see Body size normalization by allometric scaling, below).
All CL estimates were generated by using a Bayesian estimator (MW/Pharm v. 3.82, Mediware, Groningen, Netherlands) as previously described.17 As sirolimus concentrations obtained were mostly predose trough measurements, only individual clearances were estimated.
Body size normalization by allometric scaling
In this study we applied the concept of size and maturation to sirolimus disposition as proposed by Anderson and Holford,18 with the following assumptions in the analysis: 1) the central tendency of age‐dependent change in sirolimus clearance is explained by size and maturation; 2) the maturation of sirolimus CL is considered to be complete in children 3 years and older. Based on these assumptions, in children older than 3 years size is then the major factor considered associated with sirolimus clearance changes and the correlation was explored in that fashion.
Individual CL estimates were normalized to a subject with a standard body of 70 kg using allometric scaling by applying the following equation to determine the standardized clearance in individuals:
In this study, the power exponent best applicable to take into account the central tendency of change in sirolimus clearance due to body‐size increase was explored based on the relationship between observed CL and body weight in patients older than 3 years of age.
Population modeling analysis for characterization of developmental change in sirolimus clearance
A population modeling analysis was performed using NONMEM v. 7.2 (ICON Development Solutions, Ellicott City, MD) to describe the relationship between age and the sirolimus CL estimates. Postmenstrual age (PMA, in weeks) and body size‐normalized post‐hoc CL were used as the parameter for age and CL, respectively, in this analysis. Since this clinical trial had no premature babies, PMA was calculated by the following equation:
The following sigmoidal Emax model (simple Emax model if Hill = 1.0) was tested to describe the nonlinear relationship between PMA and sirolimus CL estimate:
In the population modeling analysis, three parameters, CLmatured (CL at fully matured level), TM50 (postmenstrual age at which CL is half of CLmatured), and Hill coefficient were explored and determined according to the objective function value (OFV) and visual inspections with goodness‐of‐fit plots (NONMEM analysis details are described in the Supplemental Materials).
Statistical analyses
Data were analyzed based on linear and nonlinear regression analysis using GraphPad Prism (v. 5.0, GraphPad Software, Inc., San Diego, CA). Linear regression analysis was used to assess the correlation in log scale between a patient's body weight and sirolimus CL estimate. In this analysis, the sirolimus averaged clearance estimates in the first 3 months were used.
The correlation between sirolimus CL estimate and the ratio of sirolimus metabolite concentration to sirolimus concentration was accessed using GraphPad Prism by linear regression analysis to identify sirolimus metabolites correlated to sirolimus CL. A nonlinear regression analysis was performed using a simple Emax model to describe the relationship between age and the ratios of metabolite concentration to sirolimus concentration for the identified five sirolimus metabolites.
RESULTS
Participants
Data from 52 pediatric patients were available for this study. Patient demographics at the start of therapy are summarized in Table 1. Age at therapy initiation ranged from 21 days to 19 years. Median (range, Min to Max) of body weight (BW), height, and body surface area (BSA) were 18 kg (4.0–101), 108 cm (53–183), and 0.77 m2 (0.23–2.2), respectively.
Correlation between observed sirolimus clearance and body weight in pediatric patients older than 3 years old
Sirolimus CL estimates in patients older than 3 years (n = 32) were used in this analysis to explore the correlation of the sirolimus CL change associated with body size increase. The log‐transformed sirolimus CL estimates were linearly correlated with the corresponding patient's body weight log‐transformed as shown in Supplemental Figure 1A (slope of 0.67, 95% confidence interval (CI) 0.47–0.88). According to the observed correlation (Supplemental Figure 1A), the following equation was proposed to determine the standardized clearance (CLsize‐normalized to 70kg). Obtained CLsize‐normalized to 70kg showed no trend against body weight (Supplemental Figure 1B).
Developmental changes in sirolimus clearance estimates in pediatric patients
All serial sirolimus CL estimates in patients younger than 4 years old were used to describe the developmental change in sirolimus CL estimates over time. A total of 316 sirolimus CL estimates were available from 24 patients for this population modeling analysis. All CL estimates were size‐normalized according to the equation described above to obtain the standardized CL prior to the analysis. The remaining nonlinear relationship between age and size‐normalized sirolimus CL estimates was well described by a sigmoidal Emax model (Figure 1). The implication of age‐dependent CL is also shown in the visual predictive check plots (Figure 2). The sigmoidal Emax model better described the data than a simple Emax model, as indicated by the significant decrease in the objective function value of −14.813 (P < 0.01). Model parameter estimates and interindividual variability are summarized in Table 2. The population parameter estimates were: CLmatured (CL at fully matured level), 18.1 L/h/70kg; TM50 (postmenstrual age at which CL is half of CLmatured), 62.9 weeks; and a Hill coefficient of 2.94. Goodness‐of‐fit plots did not show systematic bias for the sigmoidal Emax model predictions (Supplemental Figure 2). Median values and 95% CIs from the bootstrap analysis are listed in Table 2. All model parameter estimates were within the 95% CIs of median value obtained by the bootstrap analysis, indicating good stability of the model.
Figure 1.
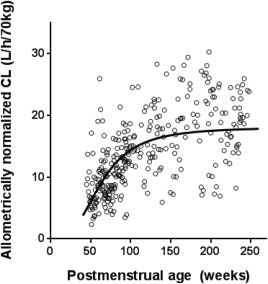
The developmental trajectory of sirolimus clearance over age. A maximum a posteriori probability (MAP) Bayesian sirolimus clearance (CL) estimate was generated using sirolimus concentration measurement at each sampling point. Open circles represent observed sirolimus CL estimates size‐normalized by an allometric scaling with a power exponent of 0.67 (n = 316 points from 24 patients younger than 4 years old). The patient demographics for this analysis are summarized in Supplemental Table 2. Seven patients were on weaning doses of steroids as part of the initial treatment in kaposiform hemangioendothelioma (KHE) patients and the doses were tapered off after 1 to 2 months. As steroid administration in KHE patients did not show a significant effect on the estimation of population parameters in the covariate analysis, their data were included in the analysis. A black line represents the developmental trajectory of sirolimus clearance based on mean population parameter estimates of the sigmoidal Emax model: CLmatured (CL at fully matured level), 18.1 L/h/70kg; TM50 (postmenstrual age at which CL is half of CLmatured), 62.9; and Hill coefficient, 2.94.
Figure 2.
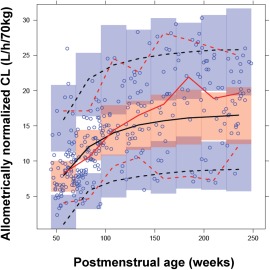
Visual predictive check of the NONMEM model. Open circles, observed allometrically size‐normalized sirolimus clearance; solid red line, median of observed; dashed red lines, lower (5th) and upper (95th) percentiles of the observed data; solid black line, median of predicted data; dashed black lines, 5th and 95th percentiles of the predicted data; shaded areas, confidence intervals around the prediction intervals in each bin.
Table 2.
Population parameter estimates in the sigmoidal Emax model
| Parameters | Estimated | %RSE | 95% CI | IIV (CV%) | Bootstrap estimates | |
|---|---|---|---|---|---|---|
| Estimated | 95% CI | |||||
| CLmatured (L/h/70kg) | 18.1 | 4.7 | 16.4–19.8 | 11.3 | 18.1 | 16.5–20.3 |
| TM50 (weeks) | 62.9 | 8.4 | 52.5–73.3 | 17.4 | 61.9 | 51.2–76.3 |
| Hill | 2.94 | 16.4 | 2.00–3.89 | 102 | 3.01 | 1.89–5.75 |
| Proportional residual error | 0.066 | 0.067 | ||||
CLmatured, clearance (CL) at fully matured level, which is allometrically size‐normalized with a power of 0.67; TM50, postmenstrual age at which CL is half of CLmatured; RSE, relative standard error; CI, confidence interval; and IIV, interindividual variability.
A total of 316 concentrations from 24 patients younger than 4 years old were used for sirolimus CL estimation. Sirolimus CL was estimated with Bayesian estimation using MW/Pharm v. 3.82 based on each concentration measurement. Obtained CL estimate was allometrically size‐normalized with a power of 0.67 to obtain the standardized CL. The nonlinear relationship between postmenstrual age and allometrically scaled CL estimates was evaluated with the sigmoidal Emax model through a nonlinear mixed effect modeling using NONMEM v. 7.2.
Sirolimus metabolite formation in pediatric patients
Sirolimus metabolite formation was investigated to explore the underlying mechanism of the age‐dependent increase in sirolimus CL estimates. Five sirolimus primary metabolites, which are formed through the CYP3A pathways,7 were quantifiable in the blood samples obtained from patients younger than 4 years. The ratio of the concentrations of 25‐hydroxysirolimus (25‐OH) and 16‐O‐demethysirolimus (16‐O‐DM) to sirolimus concentration were significantly correlated with sirolimus CL estimates (r = 0.66, P < 0.0001 and r = 0.47, P < 0.05, respectively). The ratio of the three other metabolites, 24‐hydroxysirolimus, 46‐hydroxysirolimus, and 39‐O‐demethysirolimus, did not show any significant association. Both ratios of 25‐OH and 16‐O‐DM to sirolimus concentration increased over time in an age‐dependent manner in this population of very young patients. These observed nonlinear relationships were described by a simple Emax model for both metabolites with R2 of 0.34 for 25‐OH and 0.30 for 16‐O‐DM (Figure 3).
Figure 3.
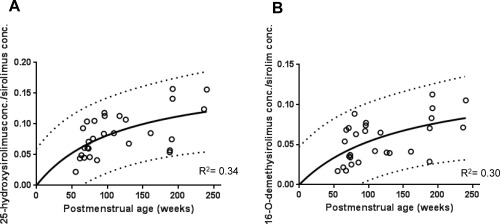
Age‐dependent change in the metabolite formation of sirolimus. The ratios of metabolite concentration to sirolimus concentration were described against age by a simple Emax model for 25‐hydroxysirolimus (25‐OH, A) and 16‐O‐demethysirolimus (16‐O‐DM, B). Solid lines show the regression lines. Dashed lines show 95% confidence intervals of prediction band.
DISCUSSION
This is the first study to describe the developmental change in sirolimus clearance using serial clearance estimates monitored continuously in individuals over time in neonates and infants. In addition, this study found that sirolimus metabolite formation changed in an age‐dependent fashion.
The sirolimus CL estimates in neonates and infants showed an increasing trend over time, after accounting for the effect of body size/growth. The size‐normalized sirolimus CL estimates reached what was considered the mature level (18.1 L/h/70kg) at around 2–3 years of age (PMA of 144–196 weeks). This CLmatured estimated in the population analysis using patients younger than 4 years was in concordance with the centered CLsize‐normalized to 70kg estimated in older patients (18.2 L/h/70kg in Supplemental Figure 1B). Parallel age‐dependent increases were observed in the formation of sirolimus metabolites 25‐OH and 16‐O‐DM measured in blood samples from neonates and infants. Both sirolimus metabolites are predominantly formed by CYP3A4 and CYP3A5.7 Our previous study suggested that intestinal CYP3A metabolism plays a major role in sirolimus elimination pathways.8 For these reasons, the observed developmental change in sirolimus oral clearance is likely to be reflected by the developmental changes in intestinal CYP3A protein expression. Thus, this clinical observation could supplement the limited information available on the intestinal CYP3A ontogeny profile, which would then help improve our understanding of age‐dependent changes in intestinal metabolism.
Unlike 25‐OH and 16‐O‐DM, three other metabolites, 24‐hydroxysirolimus, 46‐hydroxysirolimus, and 39‐O‐demethysirolimus, did not show a significant association with sirolimus CL estimates. This difference among the metabolites may be due to the sequential formation of secondary metabolites, such as dihydroxy‐ and di‐demethylsirolimus.19 The contribution of conjugate enzymes to secondary metabolism of sirolimus was considered to be negligible, since it was reported that glucuronide and sulfate conjugates of sirolimus were not present in any of the biologic matrices.20 Another potential factor to consider may be the difference in the contribution of transporters to tissue distribution of these metabolites, since all five metabolites were reported to be substrates of P‐glycoprotein.21 Further investigation of the metabolic and transport pathways of these metabolites is needed to explain the differences in age‐dependent metabolic ratios among the metabolites.
This study focused on developmental changes in organ function/metabolism in relation to sirolimus clearance. In order to obtain the standardized CL, observed sirolimus CL estimates were first normalized to body weight by allometric scaling. In this study, correlation between observed sirolimus CL estimates and body weight was originally evaluated in patients aged 3–19 years and then was described linearly in log scale with a slope of 0.67. This value of 0.67 was used as the power exponent in the allometric scaling. In general, body size normalization has been widely conducted by linear BW, BSA, and allometric scaling with the power of 0.75 (body weight0.75).22, 23, 24, 25 Of note, BSA normalization is nearly equal to allometric scaling with the power exponent of 2/3 (0.67). Johnson reported that scaling methods with BSA and body weight0.75 performed better than that with linear BW in the 7‐year and 12‐year aged groups in predicting maintenance doses of 30 different drugs for children from those used in adults.24 There are many supportive observations for normalization methods with either BSA or with allometric scaling body weight0.75 rather than with linear body weight. In this study, the power exponent for the relationship between observed CL and patient's BW was explored and found to be 0.67 (Supplemental Figure 1); however, the 95% CI (0.47–0.88) of the value included the theoretical‐based power exponent of 0.75. In addition, Anderson and Holford18 mentioned it as a limitation on estimating the allometric coefficient by data that estimates may be dependent on the distribution of weight in the subjects in the dataset. Given these facts, we also considered the allometric scaling with the fixed power of 0.75 to demonstrate a potential difference in parameter estimates due to different methodologies. That is, the population analysis for the developmental change of CL in pediatric patients less than 4 years old was also conducted using size‐normalized CLs with the fixed power of 0.75. The resulting population model estimates for CLmatured, TM50, and Hill coefficient after this normalization were 20.6 L/h/70kg, 60.1 weeks, and 2.84 (detailed data not shown), respectively, and were comparable to the population estimates summarized in Table 2. For adults, sirolimus CL estimates were reported to be a range of 9.98 to 19.5 L/h/70kg in kidney transplant patients,26, 27, 28, 29, 30 advanced cancer patients,31 and healthy volunteers.32 Our CLmatured values, which were allometrically size‐normalized with a power of 0.67 and 0.75, were slightly higher than reported mean values in adult patients possible due to coadministration of cyclosporine in adults but were close to estimates reported in healthy volunteers.
Age‐dependent changes in physiological parameters including protein expression level of drug metabolic enzymes have been investigated to explain pharmacokinetic profiles in pediatric patients.33, 34 Physiologically based pharmacokinetic (PBPK) modeling allows us to integrate the effects of age‐dependent growth and developmental changes in anatomical and physiological parameters.35 The US FDA (Food and Drug Administration) recently recommended the use of PBPK modeling to predict the pharmacokinetics in children.36, 37 We previously described a sirolimus PBPK model developed with the Simcyp pediatric platform in which CYP3A ontogeny profiles for both intestine and liver were implemented.15 In this study, PK simulations using the pediatric sirolimus PBPK model were performed to compare PBPK model‐predicted sirolimus CLs with observed CLs (Supplemental Figure 3). The postmenstrual age at which CL is half of CLmatured (TM50) in the simulation analysis was estimated as 61.3 weeks (0.41 years if expressed as postnatal age). This in silico value is close to the 62.9 weeks of age (0.44 years) obtained from the population analysis using clinical data and supports intestinal CYP3A ontogeny as the underlying cause of observed age‐dependent changes in sirolimus oral clearance in neonates and infants. Interestingly, among CYP3A substrates, different TM50 values have been reported based on empirical estimates after i.v. administration; for example, for midazolam (73.6 weeks PMA)38 and sildenafil (∼0.5 weeks PNA, which can be converted to 40.5 weeks PMA if gestational age is assumed to be 40 weeks).39 The possible cause of the difference in observed age‐dependent changes can be explored using a mechanistic approach, e.g., PBPK modeling, with consideration of each elimination pathway (e.g., liver, intestine, or kidney) and relevant ontogeny profiles (e.g., CYP3A expression, plasma protein concentration or hepatic blood flow, etc.) as we demonstrated in previous studies.8, 15
A limitation to this study is that all data came from pediatric patients with vascular anomalies. The potential effect of this condition on sirolimus disposition was not separately analyzed. Therefore, parameters identified in this study may be restricted to apply solely to patients with vascular anomalies. Unfortunately, this is a more general limitation to pediatric studies, as most pharmacokinetic information in children is obtained from patients with various underlying disease states rather than from healthy subjects. In this respect, PBPK modeling can offer some guidance, as it can integrate physiological changes due to disease and disease progression.40
The findings in this study clearly showed the developmental trajectory of sirolimus clearance in neonates and infants, which represent the age‐dependent change in CYP3A metabolism capacity. The population estimates on developmental changes in sirolimus clearance will facilitate the age‐appropriate dosing guidelines for neonates and infants. In addition, this study provides a useful example to effectively leverage existing data on drug concentration measurements and stored blood samples for further understanding of the mechanism of developmental change in drug pharmacokinetics in neonates and infants. Further studies will be needed to evaluate the generalizability of the model to other pediatric disease populations.
Conflict of interest
Conflict of Interest. C.E. was employed at Otsuka Pharmaceuticals in Japan until August 2014, outside the submitted work.
Author contributions
Author Contributions. C.E., T.F., T.M., B.S., U.C., D.M.A., and A.A.V. wrote the manuscript; C.E., T.F., D.M.A., and A.A.V designed the research; C.E., T.F., T.M., B.S., U.C., D.M.A., and A.A.V. performed the research; C.E., T.F., T.M., and A.A.V. analyzed the data; C.E. and B.S. contributed new reagents/analytical tools. The first two authors contributed equally to this work.
Supporting information
SUPPLEMENTARY MATERIAL is linked to the online version of the article at http://www.wileyonlinelibrary.com.cpt
Supporting Information
Supporting Information
Supporting Information
Supporting Information
Supporting Information
Supporting Information
Supporting Information
Acknowledgments
This study was in part supported by the Office of Orphan Products RO1FD003712 to Denise M. Adams, MD, at CCHMC; Pfizer Inc. provided sirolimus for the study. We thank Paula Mobberley‐Schuman for facilitating access to the clinical information and Drs. Min Dong, Raja Venkatasubramanian, Kana Mizuno, and David Hahn for scientific discussion and technical support. Tomoyuki Mizuno was supported by the Japan Research Foundation for Clinical Pharmacology (April 2012 to March 2014) and the Uehara Memorial Foundation (April 2014 to March 2015).
References
- 1. MacDonald, A. , Scarola, J. , Burke, J.T. , E Zimmerman, J.J. Clinical pharmacokinetics and therapeutic drug monitoring of sirolimus. Clin. Ther. 22 (Suppl. B), B101–B121 (2000). [DOI] [PubMed] [Google Scholar]
- 2. Hammill, A.M. et al Sirolimus for the treatment of complicated vascular anomalies in children. Pediatr. Blood Cancer 57: 1018–1024 (2011). [DOI] [PubMed] [Google Scholar]
- 3.A Phase 2 Study of the mTOR Inhibitor Sirolimus in Neurofibromatosis Type 1 Related Plexiform Neurofibromas (NCT00634270). 2008 March 14, 2014 [cited] Available from: <http://clinicaltrials.gov/ct2/show/NCT00634270>
- 4.A Phase 2 Study — Clinical Trial Assessing Efficacy and Safety of the mTOR Inhibitor Sirolimus in the Treatment of Complicated Vascular Anomalies (NCT00975819). 2009 [cited] Available from: <http://clinicaltrials.gov/ct2/show/NCT00975819>
- 5. Anderson, B.J. & Holford, N.H. Tips and traps analyzing pediatric PK data. Paediatr. Anaesth. 21: 22–237 (2011). [DOI] [PubMed] [Google Scholar]
- 6. Kearns, G.L. et al Developmental pharmacology—drug disposition, action, and therapy in infants and children. N. Engl. J. Med. 349: 1157–1167 (2003). [DOI] [PubMed] [Google Scholar]
- 7. Jacobsen, W. et al Comparison of the in vitro metabolism of the macrolide immunosuppressants sirolimus and RAD. Transplant. Proc. 33: 514–515 (2001). [DOI] [PubMed] [Google Scholar]
- 8. Emoto, C. , Fukuda, T. , Cox, S. , Christians, U. & Vinks, A.A. Development of a physiologically‐based pharmacokinetic model for sirolimus: predicting bioavailability based on intestinal CYP3A content. CPT Pharmacometrics Syst. Pharmacol. 2: e59 (2013). [DOI] [PMC free article] [PubMed] [Google Scholar]
- 9. Paine, M.F. et al The human intestinal cytochrome P450 “pie.” Drug Metab. Dispos. 34: 880–886 (2006). [DOI] [PMC free article] [PubMed] [Google Scholar]
- 10. Zanger, U.M. & Schwab, M. Cytochrome P450 enzymes in drug metabolism: regulation of gene expression, enzyme activities, and impact of genetic variation. Pharmacol. Ther. 138: 103–141 (2013). [DOI] [PubMed] [Google Scholar]
- 11. Hines, R.N. & McCarver, D.G. The ontogeny of human drug‐metabolizing enzymes: phase I oxidative enzymes. J. Pharmacol. Exp. Ther. 300: 355–360 (2002). [DOI] [PubMed] [Google Scholar]
- 12. Stevens, J.C. et al Developmental expression of the major human hepatic CYP3A enzymes. J. Pharmacol. Exp. Ther. 307: 573–582 (2003). [DOI] [PubMed] [Google Scholar]
- 13. Johnson, T.N. , Tanner, M.S. , Taylor, C.J. & Tucker, GT. Enterocytic CYP3A4 in a paediatric population: developmental changes and the effect of coeliac disease and cystic fibrosis. Br. J. Clin. Pharmacol. 51: 451–460 (2001). [DOI] [PMC free article] [PubMed] [Google Scholar]
- 14. Adams, D.M. et al Efficacy and safety of sirolimus in the treatment of complicated vascular anomalies. Pediatrics 137: 1–10 (2016). [DOI] [PMC free article] [PubMed] [Google Scholar]
- 15. Emoto, C. , Fukuda, T. , Johnson, T.N. , Adams, D.M. & Vinks, A.A. Development of a pediatric physiologically based pharmacokinetic model for sirolimus: applying principles of growth and maturation in neonates and infants. CPT Pharmacometrics Syst. Pharmacol. 4: 127–134 (2015). [DOI] [PMC free article] [PubMed] [Google Scholar]
- 16. Filler, G. et al Characterization of sirolimus metabolites in pediatric solid organ transplant recipients. Pediatr. Transplant. 13: 44–53 (2009). [DOI] [PubMed] [Google Scholar]
- 17. Scott, J.R. et al Population pharmacokinetics of sirolimus in pediatric patients with neurofibromatosis type 1. Ther. Drug Monit. 35: 332–337 (2013). [DOI] [PMC free article] [PubMed] [Google Scholar]
- 18. Anderson, B.J. & Holford, N.H. Mechanism‐based concepts of size and maturity in pharmacokinetics. Annu. Rev. Pharmacol. Toxicol. 48: 303–332 (2008). [DOI] [PubMed] [Google Scholar]
- 19. Streit, F. et al Sensitive and specific quantification of sirolimus (rapamycin) and its metabolites in blood of kidney graft recipients by HPLC/electrospray‐mass spectrometry. Clin. Chem. 42: 1417–1425 (1996). [PubMed] [Google Scholar]
- 20.Available from: <http://www.fda.gov/ohrms/dockets/ac/02/briefing/3832b1_03_FDA-RapamuneLabel.htm>
- 21. Cummins, C.L. , Jacobsen, W. , Christians, U. & Benet, L.Z. CYP3A4‐transfected Caco‐2 cells as a tool for understanding biochemical absorption barriers: studies with sirolimus and midazolam. J. Pharmacol. Exp. Ther. 308: 143–155 (2004). [DOI] [PubMed] [Google Scholar]
- 22. Samant, T.S. , Mangal, N. , Lukacova, V. & Schmidt, S. Quantitative clinical pharmacology for size and age scaling in pediatric drug development: a systematic review. J. Clin. Pharmacol. 55: 1207–1217 (2015). [DOI] [PubMed] [Google Scholar]
- 23. Momper, J.D. et al Adolescent dosing and labeling since the Food and Drug Administration Amendments Act of 2007. JAMA Pediatr. 167: 926–932 (2013). [DOI] [PubMed] [Google Scholar]
- 24. Johnson, T.N. The problems in scaling adult drug doses to children. Arch. Dis. Child. 93: 207–211 (2008). [DOI] [PubMed] [Google Scholar]
- 25. Mahmood, I. Prediction of drug clearance in children: impact of allometric exponents, body weight, and age. Ther. Drug Monit. 29: 271–278 (2007). [DOI] [PubMed] [Google Scholar]
- 26. Zimmerman, J.J. & Kahan, B.D. Pharmacokinetics of sirolimus in stable renal transplant patients after multiple oral dose administration. J. Clin. Pharmacol. 37: 405–415 (1997). [DOI] [PubMed] [Google Scholar]
- 27. Djebli, N. et al Sirolimus population pharmacokinetic/pharmacogenetic analysis and Bayesian modelling in kidney transplant recipients. Clin. Pharmacokinet. 45: 1135–1148 (2006). [DOI] [PubMed] [Google Scholar]
- 28. Dansirikul, C. , Morris, R.G. , Tett, S.E. & Duffull. S/B . A Bayesian approach for population pharmacokinetic modelling of sirolimus. Br. J. Clin. Pharmacol. 62: 420–434 (2006). [DOI] [PMC free article] [PubMed] [Google Scholar]
- 29. Brattstrom, C. et al Kinetics and dynamics of single oral doses of sirolimus in sixteen renal transplant recipients. Ther. Drug Monit. 19: 397–406 (1997). [DOI] [PubMed] [Google Scholar]
- 30.Available from: <http://www.accessdata.fda.gov/drugsatfda_docs/nda/99/21083A_Rapamune_clinphrmr.pdf>
- 31. Wu, K. et al Nonlinear population pharmacokinetics of sirolimus in patients with advanced cancer. CPT Pharmacometrics Syst. Pharmacol. 1: e17 (2012). [DOI] [PMC free article] [PubMed] [Google Scholar]
- 32. Brattstrom, C. et al Pharmacokinetics and safety of single oral doses of sirolimus (rapamycin) in healthy male volunteers. Ther. Drug Monit. 22: 537–544 (2000). [DOI] [PubMed] [Google Scholar]
- 33. Johnson, T.N. , Rostami‐Hodjegan, A. & Tucker, G.T. Prediction of the clearance of eleven drugs and associated variability in neonates, infants and children. Clin. Pharmacokinet. 45: 931–956 (2006). [DOI] [PubMed] [Google Scholar]
- 34. Edginton, A.N. , Schmitt, W. , Voith, B. & Willmann S. A mechanistic approach for the scaling of clearance in children. Clin. Pharmacokinet. 45: 683–704 (2006). [DOI] [PubMed] [Google Scholar]
- 35. Jamei, M. , Dickinson, G.L. & Rostami‐Hodjegan, A. A framework for assessing inter‐individual variability in pharmacokinetics using virtual human populations and integrating general knowledge of physical chemistry, biology, anatomy, physiology and genetics: A tale of ‘bottom‐up’ vs ‘top‐down’ recognition of covariates. Drug Metab. Pharmacokinet. 24: 53–75 (2009). [DOI] [PubMed] [Google Scholar]
- 36. Zhao, P. et al Applications of physiologically based pharmacokinetic (PBPK) modeling and simulation during regulatory review. Clin. Pharmacol. Ther. 89: 259–267 (2011). [DOI] [PubMed] [Google Scholar]
- 37. Leong, R. et al Regulatory experience with physiologically based pharmacokinetic modeling for pediatric drug trials. Clin. Pharmacol. Ther. 91: 926–931 (2012). [DOI] [PubMed] [Google Scholar]
- 38. Anderson, B.J. & Larsson, P. A maturation model for midazolam clearance. Paediatr. Anaesth. 21: 302–308 (2011). [DOI] [PubMed] [Google Scholar]
- 39. Mukherjee, A. , Dombi, T. , Wittke, B. & Lalonde, R. Population pharmacokinetics of sildenafil in term neonates: evidence of rapid maturation of metabolic clearance in the early postnatal period. Clin. Pharmacol. Ther. 85: 56–63 (2009). [DOI] [PubMed] [Google Scholar]
- 40. Grillo, J.A. et al Utility of a physiologically‐based pharmacokinetic (PBPK) modeling approach to quantitatively predict a complex drug‐drug‐disease interaction scenario for rivaroxaban during the drug review process: implications for clinical practice. Biopharm. Drug Dispos. 33: 99–110 (2012). [DOI] [PubMed] [Google Scholar]
Associated Data
This section collects any data citations, data availability statements, or supplementary materials included in this article.
Supplementary Materials
SUPPLEMENTARY MATERIAL is linked to the online version of the article at http://www.wileyonlinelibrary.com.cpt
Supporting Information
Supporting Information
Supporting Information
Supporting Information
Supporting Information
Supporting Information
Supporting Information