Abstract
Chemoresistance is a major barrier to effective chemotherapy of solid tumors, including head and neck squamous cell carcinoma (HNSCC). Recently, autophagy, a highly conservative intracellular recycling system, has shown to be associated with chemoresistance in cancer cells. However, little is known about how autophagy plays a role in the development of chemoresistance in HNSCC and how autophagy is initiated when HNSCC cells undergo cytotoxic stress. Here, we report that autophagy was activated when HNSCC cells are treated with the proteasome inhibitor bortezomib, proposed as an alternative chemotherapeutic agent for both primary and cisplatin-resistant HNSCC cells. Ablation of histone deacetylase 6 (HDAC6) expression and its activity in HNSCC cells significantly inhibited autophagy induction by altering the phosphorylation status of mammalian target of rapamycin and enhanced the bortezomib cytotoxicity. Similarly, a combination regimen of bortezomib and the histone deacetylase inhibitor trichostatin A abolished HDAC6 activity and decreased autophagy induction while significantly enhancing bortezomib-induced apoptosis in HNSCC cells. These data uncover a novel molecular mechanism indicating that HDAC6 may serve as a critical causal link between autophagy, apoptosis, and the cell survival response in HNSCC. A combination regimen resulting in regression of autophagy improves chemotherapeutic efficacy, thereby providing a new strategy to overcome chemoresistance and to improve the treatment and survival of HNSCC patients.
Keywords: apoptosis, autophagy, head and neck squamous cell carcinoma (HNSCC), proteasome, protein aggregation, signal transduction, signaling
Introduction
Squamous cell carcinoma (SCC)2 is a common malignancy that occurs in the region of the oral cavity, head and neck, lung, cervix, skin, etc. (1, 2). HNSCC comprises 90% of head and neck cancer and has high recurrence rates associated with resistance to chemotherapy and the lowest 5-year survival rates in any major cancer (3, 4). Despite extensive efforts, few improvements in treatment have been made in the last 30 years, and the molecular basis of acquired chemoresistance in HNSCC remains largely unknown and continues to be a major complication for chemotherapy (5, 6). Clearly, there is an urgent need for understanding mechanisms of therapy resistance and developing more effective novel chemotherapeutic treatment options to improve the survival of HNSCC patients.
Previously, we found that the proteasome inhibitor bortezomib (Btz; also known as PS-341) can induce apoptosis in both primary and cisplatin-resistant HNSCC cells by promoting endoplasmic reticulum (ER) stress through accumulation of cytotoxic protein aggregates (CPA) in the cytoplasm (7, 8). However, clinical phase II studies on Btz-based regimens indicated that Btz alone exerted minimal cytotoxic effects in HNSCC patients (9, 10). Interestingly, our subsequent studies revealed that Btz treatment in HNSCC cells elicited both ER stress-induced apoptosis and a coordinated pro-survival cellular response known as unfolded protein response (UPR) (11). The UPR is an integral adaptive signaling pathway that has dual roles in cancer (12). UPR can play a cytoprotective role by restoring the ER homeostasis through chaperone activity, resulting in diminished ER stress induced by the presence of cytotoxic CPA (12, 13). On the contrary, UPR can play a catabolic role by inducing apoptosis when persistent ER stress exists (12–15).
Lately, autophagy has received greater attention due to its implications in pathological processes, including tumorigenesis, chemoresistance of malignancies, and neurodegeneration (16). Autophagy is a highly conserved cellular degradation process that eliminates aggregated or unfolded/misfolded proteins and damaged organelles in response to stress or nutrient deprivation (17–19). It was shown that autophagy provided protection for breast cancer cells against epirubicin, an anthracycline drug used for chemotherapy, and inhibition of autophagy resensitized the MCF-7 cells to epirubicin (20). Moreover, accumulative studies imply that the UPR may involve the induction of autophagy under cellular stress (21–24). However, the detailed mechanisms and interaction between apoptosis, autophagy, and UPR remain largely unknown.
HDACs are a class of enzymes involved in histone modification, which epigenetically regulates accessibility of transcription factors to the gene promoter by acetylation or de-acetylation of the histone depending on the nature and site of modifications (25). Previously, we found that the combination treatment of Btz and the HDAC inhibitor TSA overcomes Btz resistance and synergistically increases Btz-induced apoptosis in numerous HNSCC cells in vitro and in vivo (11). However, how TSA re-sensitizes the HNSCC cells, and the cross-talk between UPR, autophagy, and apoptosis to develop chemoresistance remains an important issue that needs to be addressed. Several studies have highlighted the role of HDAC6, an HDAC class IIB cytoplasmic tubulin deacetylase, in the clearance of CPAs through the formation of a single juxtanuclear inclusion body called the aggresome (26, 27). The subsequent autophagic degradation of the aggresome to diminish the population of CPAs in the cytoplasm to alleviate ER stress upon proteasome inhibition and ER stress has been well established in multiple myeloma cells and isolated mouse embryo fibroblasts (28, 29). HDAC6 has also been shown to deacetylate heat shock protein 90 (HSP90) and to modulate its chaperone activity to restore ER homeostasis (30). Moreover, the aberrant expression of HDAC6 has been reported in HNSCC patient tissues (31). Based on these findings, we hypothesized that HDAC6 might be a critical regulator of the cell protective response mediating the molecular network between ER stress, autophagy, and apoptosis to develop resistance to chemotherapy in HNSCC.
In this study, we show that treatment of HNSCC cells with Btz resulted in a potent induction of aggresome formation and autophagy, which was coupled with a diminished level of apoptosis. Simultaneous treatment of Btz and TSA inhibited aggresome formation, autophagy, and UPR induction, resulting in increased Btz-induced apoptosis. Consistently, knockdown of HDAC6 also drastically reduced aggresome formation, autophagy activation, and HSP expression and enhanced Btz-induced apoptosis in HNSCC cells. Mechanistically, we showed that inhibition of HDAC6 activity affected the kinase activity of autophagy initiator unc-51-like kinase 1 (ULK1) through mTOR in HNSCC cells.
Results
Btz Induces Both Autophagy and Apoptosis in HNSCC Cells and Inhibition of Autophagy Enhances the Apoptosis
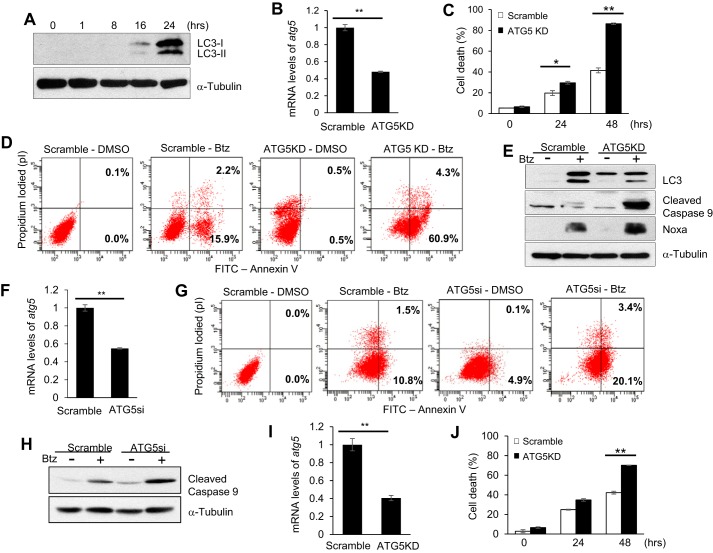
In our previous work, we showed that Btz induced apoptosis in HNSCC cell lines, including SCC1 and SCC23, which could be synergistically enhanced by TSA (7, 8, 11). In this study, we explored whether Btz induced autophagy in these cells. During autophagy activation, microtubule-associated protein 1A/1B-light chain 3 (LC3)-I is conjugated to LC3-II (also known as LC3B) by lipidation (32–34). Thus, LC3 has been widely used as an indicator of autophagy activation (35, 36). Western blot analysis revealed that both LC3-I and LC3-II expression increased in a time-dependent manner in SCC1 cells following Btz treatment, indicating activation of autophagy (Fig. 1A). To determine whether autophagy attenuated Btz-induced apoptosis, we stably knocked down autophagy protein 5 (ATG5) in SCC1 cells using shRNA (Fig. 1B). ATG5 is known to be an essential protein required in the formation of the autophagosome, a cytosolic double-membrane vacuole that fuses with lysosomes (33, 34, 37). Treatment with Btz showed a significant increase in apoptosis in ATG5-knockdown (ATG5KD) SCC1 cells compared with the control cells (Fig. 1, C and D). Western blotting showed that ATG5 knockdown down-regulated autophagy activation but enhanced caspase-9 activation induced by Btz (Fig. 1E). Additionally, knockdown of ATG5 using SMARTpool ATG5 siRNA (ATG5si) in SCC1 cells further confirmed that ATG5 knockdown enhanced Btz-induced apoptosis and caspase-9 activation (Fig. 1, F–H). Moreover, we found that ATG5 knockdown also enhanced apoptosis in SCC23 cells induced by Btz (Fig. 1, I and J). Collectively, these data indicate that autophagy might play an important role in decreased chemosensitivity in HNSCC cells.
FIGURE 1.
Induction of autophagy attenuates Btz cytotoxicity in HNSCC cells. A, LC3 induced Btz in a time-dependent manner by Western blotting. α-Tubulin was utilized as a loading control. B, real time RT-PCR showing the mRNA level of ATG5. Scramble, SCC1 cells infected with viruses expressing scramble shRNA; ATG5KD, SCC1 cells infected with viruses expressing ATG5 shRNA. Values are means ± S.D.; **, p < 0.01. C, knockdown of ATG5 enhanced Btz-induced cell death in SCC1 cells. The cell viability assay results are representative of three independent experiments. Values are means ± S.D.; *, p < 0.05; **, p < 0.01. D, apoptosis detection with FITC-annexin V and propidium iodide using flow cytometry for ATG5KD SCC1 cells treated with Btz for 24 h. E, Western blotting of LC3, cleaved caspase-9, Noxa, and α-tubulin in ATG5 knockdown SCC1 cells and control cells. F, real time RT-PCR showing the mRNA level of ATG5. Scramble, SCC1 cells transfected with scramble siRNA; ATG5si, SCC1 cells transfected with ATG5 siRNA. Values are means ± S.D.; **, p < 0.01. G, ATG5si enhanced Btz-induced apoptosis in SCC1 cells treated with Btz for 24 h. H, Western blotting of cleaved caspase-9 and α-tubulin in ATG5si SCC1 cells and control cells treated with Btz. I, knockdown of ATG5 in SCC23 cells by real time RT-PCR. J, knockdown of ATG5 enhanced Btz-induced cell death in SCC23 cells. Values are means ± S.D.; **, p < 0.01.
Btz Triggers Both Aggresome Formation and Autophagy Induction in HNSCC Cells
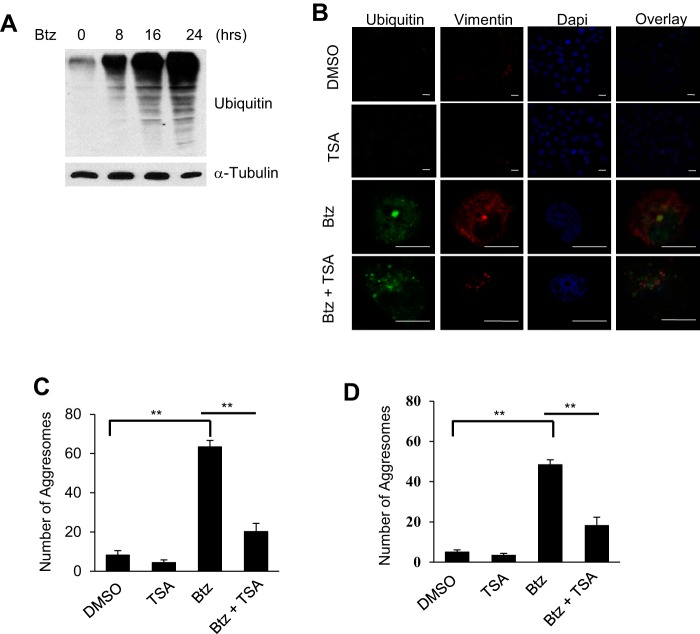
Accumulation of unfolded or misfolded proteins in the cytoplasm can form CPAs, which require efficient disposal to reduce ER stress level and promote cell survival (14). An increasing number of studies show that autophagy removes these protein aggregates in the form of the aggresome to promote tumor cell survival (18, 21, 38, 39). We found that Btz treatment induced the accumulation of ubiquitylated unfolded or misfolded proteins in SCC1 cells (Fig. 2A). Immunofluorescence staining with anti-ubiquitin and anti-vimentin antibodies revealed aggresome formation in SCC1 cells as visualized by confocal microscopy. TSA is a broad type potent HDAC inhibitor, which has been known to inhibit zinc-dependent deacetylases, including class I, II, and IV HDACs (40, 41). In contrast, the combined treatment of Btz and TSA failed to form the aggresome (Fig. 2B). Instead, ubiquitylated protein aggregates were deposited in the cytoplasm diffusely. The number of the aggresomes formed in TSA- and Btz-treated SCC1 cells was also significantly reduced compared with Btz-treated SCC1 cells (Fig. 2C). Similarly, TSA also significantly inhibited Btz-induced aggresome formation in SCC23 cells (Fig. 2D).
FIGURE 2.
TSA inhibits Btz-induced aggresome formation in HNSCC cells. A, Western blotting of ubiquitin in SCC1 cells following Btz treatment. B, microscopic images of aggresome using anti-ubiquitin and anti-vimentin antibodies and DAPI staining in SCC1 cells treated with DMSO, TSA, and/or Btz for 24 h. Scale bar, 15 μm. C, average number of aggresomes per 100 SCC1 cells treated with DMSO, TSA, and/or Btz for 24 h. Values are means ± S.D.; **, p < 0.01. Data were collected from three independent experiments, and at least 10 images per slide were analyzed. D, average number of aggresome per 100 SCC23 cells treated with DMSO, TSA, and/or Btz for 24 h. Values are means ± S.D.; **, p < 0.01.
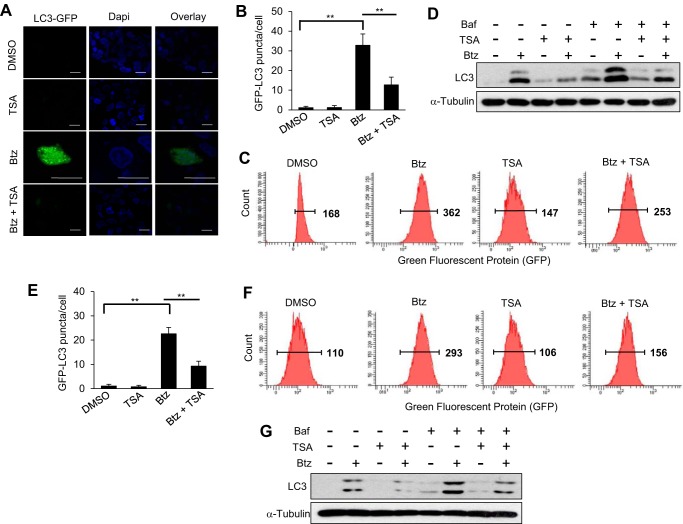
Autophagy activation is associated with aggresome formation. We performed GFP-LC3 puncta formation assays to monitor Btz-induced autophagy in SCC1 cells using mammalian expression reports containing the human LC3 gene fused with the green fluorescent protein (GFP). Whereas Btz treatment alone induced GFP-LC3 punctate formation, TSA addition significantly inhibited Btz-induced autophagy activation using immunofluorescent assay (Fig. 3, A and B). The flow cytometry analysis further confirmed the significant reduction of LC3 expression in SCC1 cells treated with Btz and TSA together compared with the Btz alone (Fig. 3C). Western blot analysis also confirmed that TSA inhibited the expression of LC3B induced by Btz, and the blockage of LC3 degradation and autophagosome turnover at the lysosome using Baf revealed that LC3 was inhibited at the prior stage to the lysosomal degradation (Fig. 3D). Consistently, we found that TSA also inhibited autophagy activation induced by Btz in SCC23 cells as determined by GFP puncta formation assays (Fig. 3E), flow cytometry (Fig. 3F), and Western blotting (Fig. 3G).
FIGURE 3.
TSA inhibits Btz-induced autophagy activation in HNSCC cells. A, microscopic images of GFP-LC3 puncta in SCC1 cells treated with DMSO, TSA, and/or Btz for 24 h. Scale bar, 15 μm. B, bar graph represents average number of GFP-LC3 puncta/cell in SCC1 cells treated with DMSO, TSA, and/or Btz for 24 h. Values are means ± S.D.; **, p < 0.01. C, flow cytometry analysis of SCC1 cells infected with lentivirus expressing GFP-LC3. D, Western blotting of LC3 proteins in SCC1 cells treated with DMSO, Baf, TSA, and/or Btz for 16 h. E, bar graph represents average number of GFP-LC3 puncta/cell in SCC23 cells treated with DMSO, TSA, and/or Btz for 24 h. Values are means ± S.D.; **, p <0.01. F, flow cytometry analysis of SCC23 cells infected with lentivirus expressing GFP-LC3. Cells were treated with DMSO, Btz, and/or TSA for 24 h. G, Western blotting of LC3 proteins in SCC23 cells treated with DMSO, Baf, TSA, and/or Btz for 24 h. Baf was added 3 h prior to the cell harvest.
HDAC6 Is Required for Aggresome Formation and Induction of Autophagy in HNSCC Cells
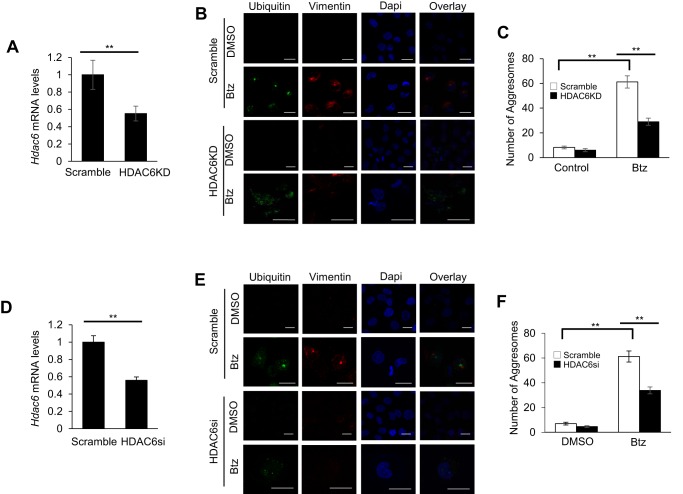
Recently, it has been shown that HDAC6 was involved in gathering scattered polyubiquitylated CPAs and transporting them to the microtubule organizing center to promote aggresome formation (26, 27). To determine whether HDAC6 played a role in Btz-induced aggresome formation and autophagy induction in SCC cells, we stably knocked down HDAC6 using shRNA (HDAC6KD) in SCC1 cells (Fig. 4A). In accordance with other studies, HDAC6 knockdown SCC1 cells treated with Btz showed disruption in aggresome formation compared with the control SCC1 cells treated with Btz (Fig. 4B), and the number of the aggresomes in HDAC6 knockdown SCC1 cells was also significantly reduced (Fig. 4C). We also used SMARTpool HDAC6 siRNA (HDAC6si) in SCC1 cells to provide a control for off-target knockdown effects, and we obtained similar results (Fig. 4, D–F).
FIGURE 4.
HDAC6 is required for Btz-induced aggresome formation in HNSCC cells. A, real time RT-PCR showing the mRNA level of HDAC6 in SCC1 cells infected with lentiviruses expressing HDAC6 shRNA vector or scramble. **, p < 0.01. B, microscopic images of aggresome using anti-ubiquitin and anti-vimentin antibodies and DAPI staining in HDAC6 knockdown SCC1 cells and control cells treated with Btz for 24 h. Scramble, SCC1 cells infected with lentiviruses expressing scramble shRNA; HDAC6KD, SCC1 cells infected with lentiviruses expressing HDAC6 shRNA. Scale bar, 15 μm. C, bar graph represents the average number of aggresome per 100 cells in HDAC6KD SCC1 cells and control cells treated with Btz for 24 h. Values are means ± S.D.; **, p < 0.01. Data were collected from three independent experiments. D, real time RT-PCR showing the mRNA level of HDAC6 in SCC23 cells infected with lentiviruses expressing HDAC6 shRNA vector or scramble. **, p < 0.01. E, microscopic images of aggresome using anti-ubiquitin and anti-vimentin antibodies and DAPI staining in HDAC6KD SCC23 cells and control cells treated with Btz for 24 h. Scale bar, 15 μm. F, bar graph represents the average number of aggresome per 100 cells in HDAC6KD SCC23 cells and control cells treated with Btz for 24 h. Values are means ± S.D.; ** p < 0.01, Data were collected from three independent experiments.
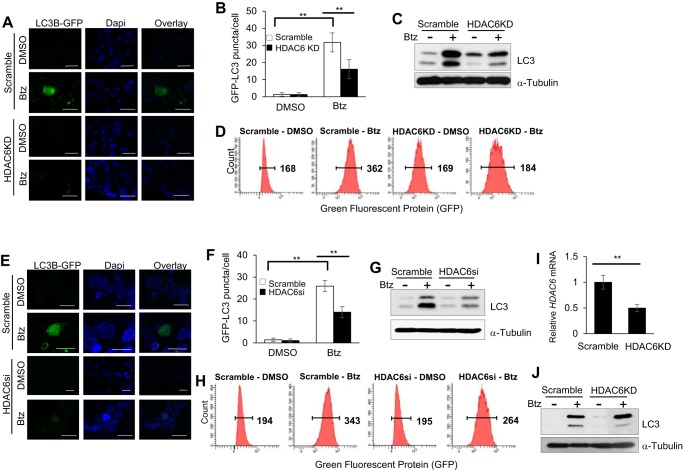
Moreover, GFP-LC3 punctate formation assays revealed that HDAC6 knockdown in SCC1 cells significantly inhibited autophagy induction (Fig. 5, A and B) in addition to disruption of Btz-promoted aggresome formation. Western blot analysis and flow cytometry analysis also confirmed that knockdown of HDAC6 inhibited Btz-induced autophagy activation (Fig. 5, C and D). Additionally, we showed consistent results in HDAC6si SCC1 cells treated with Btz compared with the control (Fig. 5, E–H). Furthermore, knockdown of HDAC6 in SCC23 cells also inhibited autophagy activation (Fig. 5, I and J).
FIGURE 5.
HDAC6 is required for Btz-induced autophagy activation in HNSCC cells. A, microscopic images of GFP-LC3 puncta in HDAC6KD SCC1 cells and control cells treated with Btz for 24 h. Scale bar, 15 μm. B, bar graph represents the average number of GFP-LC3 puncta per cell in HDAC6KD SCC1 cells and control cells treated with Btz for 24 h. Values are means ± S.D.; ** p < 0.01. C, Western blotting of LC3 proteins in HDAC6KD SCC1 cells and control cells treated with Btz for 24 h. D, flow cytometry analysis of scramble and HDAC6KD SCC1 cells infected with lentivirus expressing GFP-LC3. E, microscopic images of GFP-LC3 puncta in HDAC6si SCC1 cells and control cells treated with Btz for 24 h. Scramble, SCC1 cells transfected with scramble siRNA; HDAC6si, SCC1 cells transfected with HDAC6 siRNA. Scale bar, 15 μm. F, bar graph represents the average number of GFP-LC3 puncta per cell in HDAC6si cells and control cells treated with Btz for 24 h. Values are means ± S.D.; **, p < 0.01. G, Western blotting of LC3 proteins in HDAC6si cells and control cells treated with Btz for 24 h. H, flow cytometry analysis of scramble and HDAC6si cells infected with lentivirus expressing GFP-LC3. I, real time RT-PCR showing the mRNA level of HDAC6 in SCC23 cells infected with lentiviruses expressing HDAC6 shRNA or scramble. **, p < 0.01. J, Western blotting of LC3 proteins in HDAC6KD SCC23 cells and control cells treated with Btz for 24 h.
HDAC6 Knockdown Significantly Enhances Btz-induced Apoptosis in HNSCC Cells
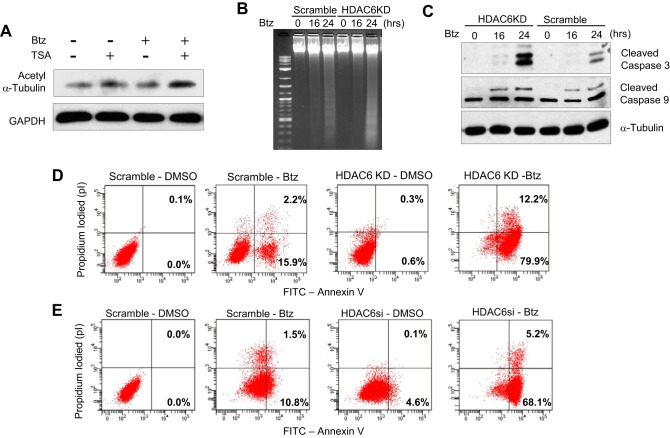
Previously, we found that TSA enhanced Btz-induced apoptosis in SCC cells. Interestingly, we found that TSA also attenuated HDAC6 activity that resulted in increased expression of acetyl tubulin in the presence of Btz, indicating TSA might inhibit autophagy through HDAC6 activity in SCC1 cells (Fig. 6A). Consistently, we found that HDAC6 knockdown in SCC1 cells potently enhanced DNA fragmentation induced by Btz (Fig. 6B). In addition, the knockdown of HDAC6 also promoted the activation of caspase-9 and -3 induced by Btz (Fig. 6C) and apoptosis (Fig. 6D). Apoptosis also increased in HDAC6si SCC1 cells treated with Btz (Fig. 6E). Taken together, our results implicate that HDAC6 mediates chemoresistance in HNSCC cells by promoting an aggresome formation and autophagy induction under ER stress.
FIGURE 6.
Knockdown of HDAC6 significantly increases Btz-induced apoptosis in HNSCC cells. A, Western blotting of acetyl α-tubulin and GAPDH in SCC1 cells treated with Btz or TSA for 24 h. B, HDAC6KD enhanced DNA fragmentation in SCC1 cells as determined by DNA ladder assays. 1st lane, 1-kb DNA ladder. C, Western blotting of cleaved caspase-3 and cleaved caspase-9 in control and HDAC6KD SCC1 cells following Btz treatment. D, apoptosis detection with FITC-annexin V and propidium iodide using flow cytometry for HDAC6KD SCC1 cells treated with Btz for 24 h. E, apoptosis detection with FITC-annexin V and propidium iodide using flow cytometry for HDAC6si SCC1 cells treated with Btz for 24 h.
HDAC6 Promotes Autophagy through Phosphorylation of ULK1 via Inhibition of mTOR Activity
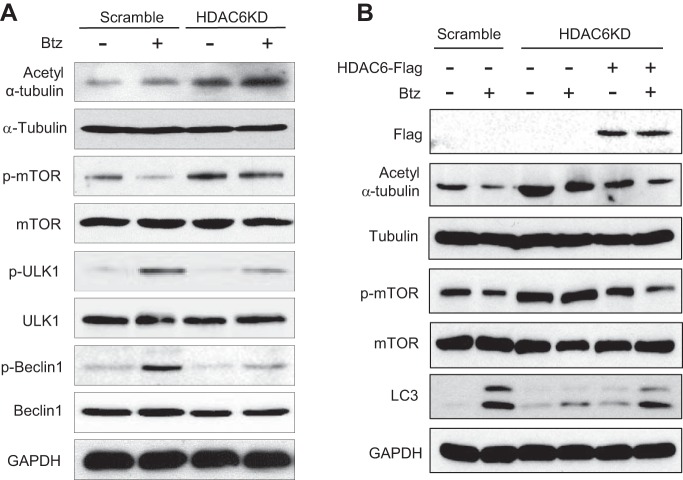
To further assess HDAC6 involvement in the regulation of autophagy initiation under Btz treatment, we first examined the phosphorylation status of a series of kinases involved in autophagy induction regulation using HDAC6 knockdown and control SCC1 cells. ULK1 is a kinase regulating autophagy initiation and progression by phosphorylating Beclin 1 and recruiting a pro-autophagic VPS34 lipid kinase and ATG14L to initiate autophagosome formation (42). Recent studies revealed that ULK1 activation was directly regulated by the different activation statuses of a pro-autophagic 5′ AMP-activated protein kinase α (AMPKα) and an anti-autophagic mTOR (43–47). Consistent with HDAC6 knockdown, Western blot analysis showed that the levels of acetyl tubulin (Lys-40) were increased in HDAC6 knockdown SCC1 cells. Interestingly, HDAC6 knockdown enhanced mTOR phosphorylation induced by Btz as determined by anti-phospho-mTOR (Ser-2448) antibodies (Fig. 7A). In contrast, HDAC6 knockdown negligibly affected AMPKα phosphorylation in SCC1 cells (data not shown). Because mTOR activation could disrupt interaction between ULK1 and AMPK, we examined whether HDAC6 knockdown affected ULK1 phosphorylation mediated by AMPK. Western blot analysis showed that Btz-induced ULK1 phosphorylation (Ser-317) mediated by AMPK was partially inhibited. Consistently, we found that HDAC6 knockdown also reduced Beclin1 phosphorylation (Ser-93/96) induced by Btz in SCC1 cells. In addition, Western blot analysis showed that the restoration of HDAC6 rescued the Btz-induced autophagy activation by attenuating mTOR phosphorylation, ruling out off-target effect of shRNA (Fig. 7B).
FIGURE 7.
Knockdown of HDAC6 attenuates Btz-induced autophagy initiation in HNSCC cells. A, Western blotting of acetyl α-tubulin (Lys-40), α-tubulin, p-mTOR (Ser-2448), mTOR, p-ULK1 (Ser-317), ULK1, p-Beclin1 (Ser-93/96), Beclin1, and GAPDH in SCC1 cells following Btz treatment. B, Western blotting of FLAG, acetyl α-tubulin (Lys-40), tubulin, p-mTOR (Ser-2448), mTOR, LC3, and GAPDH in HDAC6KD SCC1 cells following Btz treatment.
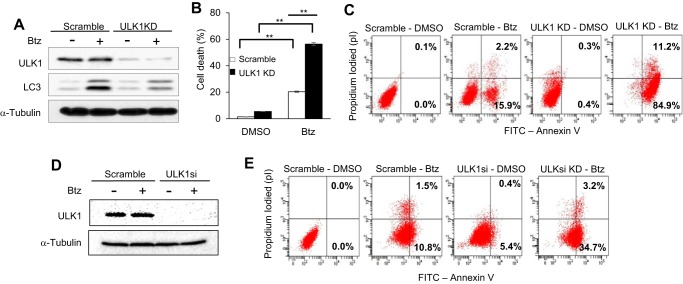
Furthermore, knockdown of ULK1 using shRNA in SCC1 cells inhibited autophagy activation and Btz-induced apoptosis (Fig. 8, A–C). Consistently, ULK1 knockdown using siRNA (ULK1si) also significantly enhanced Btz-induced apoptosis in SCC1 cells (Fig. 8, D and E). These data together indicate that TSA enhances the cytotoxicity of Btz by inhibiting HDAC6 activity, which promotes mTOR activation to inhibit pro-survival autophagy induction through regulation of ULK1 in HNSCC cells.
FIGURE 8.
Inhibition of ULK1 restores the cytotoxic effect of Btz in HNSCC cells. A, Western blotting of ULK1 and LC3 in scramble and ULK1 knockdown SCC1 cells following Btz treatment. Scramble, SCC1 cells infected with viruses expressing scramble shRNA; ULK1KD, SCC1 cells infected with lentiviruses expressing ULK1 shRNA. B, knockdown of ULK1 enhanced Btz-induced cell death in SCC1 cells. Values are means ± S.D.; **, p < 0.01. C, ULK1KD enhanced Btz-induced apoptosis in SCC1 cells. D, Western blotting of ULK1 in scramble and ULK1 knockdown SCC1 cells following Btz treatment. Scramble, SCC1 cells transfected with scramble siRNA; ULK1si, SCC1 cells transfected with ULK1 siRNA. E, ULK1si enhanced Btz-induced apoptosis in SCC1 cells.
Discussion
Although Btz was proposed as a potential alternative therapeutic regimen for HNSCC (7, 8, 11), clinical trials on Btz-based regimens demonstrated that Btz treatment alone exerts minimal antitumor effects in HNSCC patients (9, 10). In this study, we showed that HDAC6-dependent autophagy induced by Btz might be one of the potential mechanisms of chemoresistance. The inhibition of HDAC6 could enhance Btz-induced apoptosis. Mechanistically, we found that the inhibition of HDAC6 affected mTOR phosphorylation and ULK1 activation in the early stages of autophagy initiation. Previously, we have shown that TSA potentiated Btz-mediated apoptosis by inducing the expression of apoptotic genes. Our new results suggest that TSA might also sensitize HNSCC cells to Btz by inhibiting autophagy.
In normal mammalian cells, protein synthesis is tightly controlled and balanced by the capacity of the cellular ubiquitin-proteasome system to degrade and prevent accumulation of unfolded or misfolded proteins, which can form toxic aggregates in the cytoplasm and result in activation of stress-induced apoptosis (14, 15). However, in cancer cells, protein synthesis might be highly increased due to activated oncogenes promoting expression of mutant proteins and/or expression of excess proteins during tumorigenesis and tumor progression (15, 49). This imbalance between the unfolded or misfolded protein load and ubiquitin-proteasome system is managed by overexpressing components of the UPR in multiple cancers to prevent cell death (14, 15, 49). UPR is an ER-mediated pro-survival mechanism network associated with numerous intracellular signal transduction pathways to regulate and maintain ER homeostasis in response to accumulation of unfolded proteins in its lumen (14). UPR can modulate expression of molecular chaperones such as HSPs and/or activate autophagy machinery to remove large quantities of accumulated unfolded proteins before they can form toxic protein aggregates (14, 15). Thus, UPR and autophagy have become key components in cancer cell survival and a critical complication to overcome resistance against chemotherapeutic agents such as proteasome inhibitors in various cancers (22). Previously, we found that Btz treatment activated the cytoprotective ER transmembrane stress-sensing kinase-mediated UPR in HNSCC cells (7, 11), resulting in up-regulation of activating transcription factor 4 (ATF4). Along with our findings, a recent article (50) revealed that increased protein kinase R-like endoplasmic reticulum kinase (PERK) and ATF4 activation can subsequently up-regulate transcription of LC3 in HNSCC cells. In this study, we were able to show that Btz activated autophagy, and the disruption of autophagy resulted in increased levels of apoptosis.
Interestingly, our previous study found that a combination regimen of TSA and Btz synergistically induced ER stress apoptosis by increasing Noxa expression in HNSCC cells and reducing tumor growth in vivo (11). Our data demonstrate that concomitant treatment of TSA and Btz disrupts aggresome formation and inhibits autophagy, allowing CPAs to remain in the cytoplasm to apply persistent ER stress to induce apoptosis. Because of continued stress, UPR might switch from a cytoprotective role to a catabolic role, contributing to the enhanced apoptosis. Because HDAC6 plays a critical role in autophagy activation, we consistently found that knockdown of HDAC6 also enhanced Btz-induced apoptosis by inhibition of autophagy and UPR.
Involvement of HDAC6 in aggresome formation and UPR-mediated autophagy is well established in many neurodegenerative disease studies and has recently been implicated in chemoresistance (26). Concomitantly, our data also show a critical role for HDAC6 in aggresome formation upon accumulation of unfolded/misfolded proteins followed by the Btz treatment in HNSCC cells. In addition to these findings, our data also suggest that HDAC6 might be involved in the activation of mTOR, which regulated autophagy initiation under ER stress in HNSCC cells in addition to their known roles to control autophagosome maturation and the fusion of autophagosomes to lysosomes (26, 51). Recently, Zhu et al. (52) also reported that HDAC6 is involved in modulating the phosphoinositide 3-kinase (PI3K)-protein kinase B (Akt)-mTOR pathway in cerebral cortex neurons prepared from neonatal mice. mTOR and AMPK are known to directly regulate activation of ULK1, the initiating kinase for autophagosome formation and progression of autophagy (45, 47). mTOR inhibits autophagy by phosphorylating ULK1 serine 757, whereas AMPK promote autophagy by phosphorylating ULK1 at serine 317, 555, and 777 (45, 53). Our data demonstrate that ablation of HDAC6 activity enhances phosphorylation of mTOR, resulting in decreased phosphorylation of ULK1 induced by AMPK and autophagy induction. However, because HDAC6 activity is inseparable from aggresome formation, we cannot determine whether HDAC6 alone specifically regulates autophagy initiation or aggresome formation. Moreover, it will be interesting to examine how HDAC6 interacts with mTOR signaling. HDAC6 has been found to be highly expressed in HNSCC tissues (31). Based on our results, it is possible that HDAC6 might be a critical regulator of the cell protective response mediating the molecular network between ER stress, autophagy, and apoptosis to develop resistance to chemotherapy in HNSCC. Our results suggest that targeting HDAC6 might help to overcome HNSCC chemoresistance.
Experimental Procedures
Cell Culture and Reagents
HNSCC cell lines SCC1 and SCC23 were obtained from Dr. Thomas Carey at the University of Michigan. These cell lines were cultured in Dulbecco's modified Eagle's medium (DMEM) with 10% FBS with 1% penicillin/streptomycin (Invitrogen) at 37 °C with 5% carbon dioxide. Btz was dissolved in DMSO as a 10 mm stock solution and stored at −80 °C (LLC Laboratories). TSA and bafilomycin A1 (Baf) were dissolved in DMSO and stored at −20 °C (Sigma).
Transfection
HDAC6 siRNA and scramble siRNA were purchased from Santa Cruz Biotechnology. Each siRNA consisted of pools with three to five target-specific 19–25-nucleotide siRNAs designed to knock down target gene expression. Cells were transfected with siRNAs using Lipofectamine RNAiMax (Invitrogen). Lentiviral expression vector was constructed using pLKO.1 cloning vector (Addgene). The sequence with no known homology (scramble) is 5′-CCTAAGGTTAAGTCGCCCTCG-3′; the HDAC6 targeted sequence is 5′-GGATGGATCTGAACCTTGAGA-3′; and the ATG5 targeted sequence is 5′-CTTTGATAATGAACAGTGAGA-3′. The insert was subcloned into AgeI and EcoRI sites of the pLKO.1 vector. The pLKO human ULK1 shRNA 8 (plasmid 27633) was purchased from Addgene. The human pcDNA-HDAC6-FLAG plasmid (30482) was purchased from Addgene (48). Virus production was performed according to the protocol provided by Addgene using 293T viral packaging cells. 48 h after the transfection, the media containing viruses were collected and used for infection. Infected cells were incubated for 48 h and then selected with puromycin (2 μg/ml) for 2 weeks.
Cell Viability Assays and Annexin V Apoptosis Assays
Control and stable ATG5, HDAC6, or ULK1 knockdown cells were seeded on 12-well culture plates at 2 × 10⁵ cells per well. Cells were then treated with the chemotherapeutic agents. 24 h after treatment, viability of the cells was determined using trypan blue staining or annexin V apoptosis assay. FITC annexin V apoptosis detection kit II was purchased from Pharmingen, and the experiments were done according to the manufacturer's instruction.
Western Blotting
Cells were collected and lysed with whole cell lysate buffer from Sigma with 1/100 protease inhibitor mixture. 40 μg of lysates were separated by 8–15% SDS-PAGE and transferred to a PVDF membrane using semidry transfer apparatus from Bio-Rad. The membranes were incubated with blocking solution containing 5% dry milk in TBS/Tween 20 buffer at room temperature for 1 h and subsequently probed with primary antibodies at 4 °C overnight. Appropriate secondary antibodies were used and detected using ECL reagents (Pierce) on the Kodak BioMax MS film or the Bio-Rad ChemiDoc MP System using ImageLab 5.2.1 version. Primary antibodies to LC3, caspase-3, and cleaved caspase-3, caspase-9 and cleaved caspase-9, acetyl tubulin (Lys-40), phosphor-ULK1 (Ser-317), ULK1, phosphor-mTOR (Ser-2448), mTOR, GADPH, phosphor-Beclin1 (Ser-93/96), and Beclin1 were purchased from Cell Signaling Technology. Antibodies to ubiquitin were purchased from Santa Cruz Biotechnology. Antibodies to α-tubulin were purchased from Sigma.
Autophagy Assay, Immunofluorescence Staining, and GFP-LC3 Puncta Formation Assay
pBABE puro LC3-GFP plasmid (Plasmid 22405) was purchased from Addgene. Retroviruses expressing LC3-GFP were packaged in 293T cells. Cells were infected with retroviruses expressing LC3-GFP for 24 h and then treated with Btz and/or TSA. Cells were plated onto chamber slides and treated with Btz and/or TSA for 24 h. Cells were stained with an anti-ubiquitin antibody overnight and then incubated with appropriate secondary antibodies conjugated with fluorophore for 1 h to visualize ubiquitin localization. 4′,6-Diamidino-2-phenylindole (DAPI; Life Technologies, Inc.) staining was done for 5 min to detect nuclei. Slides were examined for ubiquitin-positive inclusion bodies using a Nikon Eclipse TE 2000E inverted microscope and captured images with a Leica SP2 MP-FLIM confocal microscopy. The presence of ubiquitin-positive inclusion bodies was considered indicative of intracellular aggregate formation, and the aggregates were quantified in five different fields. Analysis of LC3 staining was also done with flow cytometry by following the protocols described by Shvets and Elazar (32).
Quantitative Real Time PCR
Total RNA was isolated from cells using TRIzol reagent (Invitrogen), and cDNA was synthesized with oligo(dT) primers using Moloney murine leukemia virus reverse transcriptase (New England Biolabs). Quantitative reverse transcriptase-PCR was carried out with iQ SYBR Green supermix (Bio-Rad) on an iCycler iQ real time PCR detection system (Bio-Rad). The primers for PCR are as follows: GAPDH, 5′-ATCATCCCTGCCTCTACTGG-3′ and 5′-CTGCTTCACCACCTTCTTGA-3′; ATG5, 5′-GTTGATGTAAACCTAAAGTGC-3′ and 5′-TGTGAACAATCATATTCAGA-3′; and HDAC6, 5′-CAAGGAACACAGTTCACCTTCG-3′ and 5′-GTTCCAAGGCACATTGATGGTA-3′. All samples were run in triplicate in the same culture plate.
Statistical Analysis
Experiments presented in the figures are representative of at least three independent repetitions. Statistical analyses performed with SPSS 23.0 were used in data processing for the unpaired or paired t test and one-way analysis of variance. p values < 0.05 were considered significant.
Author Contributions
I. C. designed, performed, and analyzed the experiments and wrote the paper. C. Y. W. designed the experiment and wrote the paper.
Acknowledgments
Confocal laser scanning microscopy was performed at the California NanoSystems Institute's Advanced Light Microscopy/Spectroscopy Shared Resource Facility at UCLA, supported with funding by National Institutes of Health Shared Resources Grant CJX1-443835-WS-29646 from NCRR and National Science Foundation Major Research Instrumentation Grant CHE-0722519. Flow cytometry was performed at UCLA and Center for AIDS Research Flow Cytometry Core Facility, supported by National Institutes of Health Awards P30 CA016042 and 5P30AI028697, and by the Jonsson Comprehensive Cancer Center, the UCLA AIDS Institute, the David Geffen School of Medicine at UCLA, the UCLA Chancellor's Office, and the UCLA Vice Chancellor's Office of Research.
This work was supported by National Institutes of Health Grants R01DE15964, R01DE043110, R37DE13848, and F30DE025159. The authors declare that they have no conflicts of interest with the contents of this article. The content is solely the responsibility of the authors and does not necessarily represent the official views of the National Institutes of Health.
- SCC
- squamous cell carcinoma
- HNSCC
- head and neck squamous cell carcinoma
- HDAC
- histone deacetylase
- Btz
- bortezomib
- UPR
- unfolded protein response
- TSA
- trichostatin A
- ER
- endoplasmic reticulum
- mTOR
- mammalian target of rapamycin
- CPA
- cytotoxic protein aggregate
- AMPK
- 5′-AMP-activated protein kinase
- Baf
- bafilomycin A1.
References
- 1. Jemal A., Bray F., Center M. M., Ferlay J., Ward E., and Forman D. (2011) Global cancer statistics. CA Cancer J. Clin. 61, 69–90 [DOI] [PubMed] [Google Scholar]
- 2. Sankaranarayanan R., Masuyer E., Swaminathan R., Ferlay J., and Whelan S. (1998) Head and neck cancer: a global perspective on epidemiology and prognosis. Anticancer Res. 18, 4779–4786 [PubMed] [Google Scholar]
- 3. Pulte D., and Brenner H. (2010) Changes in survival in head and neck cancers in the late 20th and early 21st century: a period analysis. Oncologist 15, 994–1001 [DOI] [PMC free article] [PubMed] [Google Scholar]
- 4. Yamano Y., Uzawa K., Saito K., Nakashima D., Kasamatsu A., Koike H., Kouzu Y., Shinozuka K., Nakatani K., Negoro K., Fujita S., and Tanzawa H. (2010) Identification of cisplatin-resistance related genes in head and neck squamous cell carcinoma. Int. J. Cancer 126, 437–449 [DOI] [PubMed] [Google Scholar]
- 5. Yang X. H., Feng Z. E., Yan M., Hanada S., Zuo H., Yang C. Z., Han Z. G., Guo W., Chen W. T., and Zhang P. (2012) XIAP is a predictor of cisplatin-based chemotherapy response and prognosis for patients with advanced head and neck cancer. PLoS ONE 7, e31601. [DOI] [PMC free article] [PubMed] [Google Scholar]
- 6. Caravita T., de Fabritiis P., Palumbo A., Amadori S., and Boccadoro M. (2006) bortezomib: efficacy comparisons in solid tumors and hematologic malignancies. Nat. Clin. Pract. Oncol. 3, 374–387 [DOI] [PubMed] [Google Scholar]
- 7. Fribley A. M., Evenchik B., Zeng Q., Park B. K., Guan J. Y., Zhang H., Hale T. J., Soengas M. S., Kaufman R. J., and Wang C. Y. (2006) Proteasome inhibitor PS-341 induces apoptosis in cisplatin-resistant squamous cell carcinoma cells by induction of Noxa. J. Biol. Chem. 281, 31440–31447 [DOI] [PubMed] [Google Scholar]
- 8. Fribley A., Zeng Q., and Wang C. Y. (2004) Proteasome inhibitor PS-341 induces apoptosis through induction of endoplasmic reticulum stress-reactive oxygen species in head and neck squamous cell carcinoma cells. Mol. Cell. Biol. 24, 9695–9704 [DOI] [PMC free article] [PubMed] [Google Scholar]
- 9. Chung C. H., Aulino J., Muldowney N. J., Hatakeyama H., Baumann J., Burkey B., Netterville J., Sinard R., Yarbrough W. G., Cmelak A. J., Slebos R. J., Shyr Y., Parker J., Gilbert J., and Murphy B. A. (2010) Nuclear factor-κB pathway and response in a phase II trial of bortezomib and docetaxel in patients with recurrent and/or metastatic head and neck squamous cell carcinoma. Ann. Oncol. 21, 864–870 [DOI] [PMC free article] [PubMed] [Google Scholar]
- 10. Gilbert J., Lee J. W., Argiris A., Haigentz M. Jr., Feldman L. E., Jang M., Arun P., Van Waes C., and Forastiere A. (2013) Phase II 2-arm trial of the proteasome inhibitor PS-341 (bortezomib) in combination with irinotecan or PS-341 alone followed by the addition of irinotecan at time of progression in patients with locally recurrent or metastatic squamous cell carcinoma of the head and neck (E1304): a trial of the Eastern Cooperative Oncology Group. Head Neck 35, 942–948 [DOI] [PMC free article] [PubMed] [Google Scholar]
- 11. Kim J., Guan J., Chang I., Chen X., Han D., and Wang C. Y. (2010) PS-341 and histone deacetylase inhibitor synergistically induce apoptosis in head and neck squamous cell carcinoma cells. Mol. Cancer Ther. 9, 1977–1984 [DOI] [PMC free article] [PubMed] [Google Scholar]
- 12. Verfaillie T., Salazar M., Velasco G., and Agostinis P. (2010) Linking ER stress to autophagy: potential implications for cancer therapy. Int J. Cell Biol. 2010, 930509. [DOI] [PMC free article] [PubMed] [Google Scholar]
- 13. Hetz C. (2012) The unfolded protein response: controlling cell fate decisions under ER stress and beyond. Nat. Rev. Mol. Cell Biol. 13, 89–102 [DOI] [PubMed] [Google Scholar]
- 14. Tyedmers J., Mogk A., and Bukau B. (2010) Cellular strategies for controlling protein aggregation. Nat. Rev. Mol. Cell Biol. 11, 777–788 [DOI] [PubMed] [Google Scholar]
- 15. Taylor R. C., Berendzen K. M., and Dillin A. (2014) Systemic stress signaling: understanding the cell non-autonomous control of proteostasis. Nat. Rev. Mol. Cell Biol. 15, 211–217 [DOI] [PMC free article] [PubMed] [Google Scholar]
- 16. White E. (2012) Deconvoluting the context-dependent role for autophagy in cancer. Nat. Rev. Cancer 12, 401–410 [DOI] [PMC free article] [PubMed] [Google Scholar]
- 17. Ciechomska I. A., Gabrusiewicz K., Szczepankiewicz A. A., and Kaminska B. (2013) Endoplasmic reticulum stress triggers autophagy in malignant glioma cells undergoing cyclosporine A-induced cell death. Oncogene 32, 1518–1529 [DOI] [PubMed] [Google Scholar]
- 18. Zhu K., Dunner K. Jr., and McConkey D. J. (2010) Proteasome inhibitors activate autophagy as a cytoprotective response in human prostate cancer cells. Oncogene 29, 451–462 [DOI] [PMC free article] [PubMed] [Google Scholar]
- 19. Lamb C. A., Yoshimori T., and Tooze S. A. (2013) The autophagosome: origins unknown, biogenesis complex. Nat. Rev. Mol. Cell Biol. 14, 759–774 [DOI] [PubMed] [Google Scholar]
- 20. Sun W. L., Chen J., Wang Y. P., and Zheng H. (2011) Autophagy protects breast cancer cells from epirubicin-induced apoptosis and facilitates epirubicin-resistance development. Autophagy 7, 1035–1044 [DOI] [PubMed] [Google Scholar]
- 21. Milani M., Rzymski T., Mellor H. R., Pike L., Bottini A., Generali D., and Harris A. L. (2009) The role of ATF4 stabilization and autophagy in resistance of breast cancer cells treated with bortezomib. Cancer Res. 69, 4415–4423 [DOI] [PubMed] [Google Scholar]
- 22. Luo B., and Lee A. S. (2013) The critical roles of endoplasmic reticulum chaperones and unfolded protein response in tumorigenesis and anticancer therapies. Oncogene 32, 805–818 [DOI] [PMC free article] [PubMed] [Google Scholar]
- 23. Boya P., Reggiori F., and Codogno P. (2013) Emerging regulation and functions of autophagy. Nat. Cell Biol. 15, 713–720 [DOI] [PMC free article] [PubMed] [Google Scholar]
- 24. Yan M. M., Ni J. D., Song D., Ding M., and Huang J. (2015) Interplay between unfolded protein response and autophagy promotes tumor drug resistance (Review). Oncol. Lett. 10, 1959–1969 [DOI] [PMC free article] [PubMed] [Google Scholar]
- 25. de Ruijter A. J., van Gennip A. H., Caron H. N., Kemp S., and van Kuilenburg A. B. (2003) Histone deacetylases (HDACs): characterization of the classical HDAC family. Biochem. J. 370, 737–749 [DOI] [PMC free article] [PubMed] [Google Scholar]
- 26. Aldana-Masangkay G. I., and Sakamoto K. M. (2011) The role of HDAC6 in cancer. J Biomed. Biotechnol. 2011, 875824. [DOI] [PMC free article] [PubMed] [Google Scholar]
- 27. Ouyang H., Ali Y. O., Ravichandran M., Dong A., Qiu W., MacKenzie F., Dhe-Paganon S., Arrowsmith C. H., and Zhai R. (2012) Protein aggregates are recruited to aggresome by histone deacetylase 6 via unanchored ubiquitin C termini. J. Biol. Chem. 287, 2317–23127 [DOI] [PMC free article] [PubMed] [Google Scholar]
- 28. Moriya S., Komatsu S., Yamasaki K., Kawai Y., Kokuba H., Hirota A., Che X. F., Inazu M., Gotoh A., Hiramoto M., and Miyazawa K. (2015) Targeting the integrated networks of aggresome formation, proteasome, and autophagy potentiates ER stress-mediated cell death in multiple myeloma cells. Int. J. Oncol. 46, 474–486 [DOI] [PMC free article] [PubMed] [Google Scholar]
- 29. Vincenz L., Jager R., O'Dwyer M., and Samali A. (2013) Endoplasmic reticulum stress and the unfolded protein response: Targeting the achilles heel of multiple myeloma. Mol. Cancer Ther. 12, 831–843 [DOI] [PubMed] [Google Scholar]
- 30. Krämer O. H., Mahboobi S., and Sellmer A. (2014) Drugging the HDAC6-HSP90 interplay in malignant cells. Trends Pharmacol. Sci. 35, 501–509 [DOI] [PubMed] [Google Scholar]
- 31. Sakuma T., Uzawa K., Onda T., Shiiba M., Yokoe H., Shibahara T., and Tanzawa H. (2006) Aberrant expression of histone deacetylase 6 in oral squamous cell carcinoma. Int. J. Oncol. 29, 117–124 [PubMed] [Google Scholar]
- 32. Shvets E., and Elazar Z. (2009) Flow cytometric analysis of autophagy in living mammalian cells. Method Enzymol. 452, 131–141 [DOI] [PubMed] [Google Scholar]
- 33. Mizushima N., and Komatsu M. (2011) Autophagy: renovation of cells and tissues. Cell 147, 728–741 [DOI] [PubMed] [Google Scholar]
- 34. He C., and Klionsky D. (2009) Regulation mechanisms and signaling pathways of autophagy. Annu. Rev. Genet. 43, 67–93 [DOI] [PMC free article] [PubMed] [Google Scholar]
- 35. Hansen T. E., and Johansen T. (2011) Following autophagy step by step. BMC Biol. 9, 39–42 [DOI] [PMC free article] [PubMed] [Google Scholar]
- 36. Barth S., Glick D., and Macleod K. (2010) Autophagy: assays and artifacts. J. Pathol. 221, 117–124 [DOI] [PMC free article] [PubMed] [Google Scholar]
- 37. Rubinsztein D. C., Shpilka T., and Elazar Z. (2012) Mechanisms of autophagosome biogenesis. Curr. Biol. 22, R29–R34 [DOI] [PubMed] [Google Scholar]
- 38. Selimovic D., Porzig B. B., El-Khattouti A., Badura H. E., Ahmad M., Ghanjati F., Santourlidis S., Haikel Y., and Hassan M. (2013) bortezomib/proteasome inhibitor triggers both apoptosis and autophagy-dependent pathways in melanoma cells. Cell. Signal. 25, 308–318 [DOI] [PubMed] [Google Scholar]
- 39. Rikiishi H. (2010) Possible role of autophagy in the treatment of pancreatic cancer with histone deacetylase inhibitors. Cancers 2, 2026–2043 [DOI] [PMC free article] [PubMed] [Google Scholar]
- 40. Spiegel S., Milstien S., and Grant S. (2012) Endogenous modulators and pharmacological inhibitors of histone deacetylases in cancer therapy. Oncogene 31, 537–551 [DOI] [PMC free article] [PubMed] [Google Scholar]
- 41. Yao Y. L., and Yang W. M. (2011) Beyond histone and deacetylase: an overview of cytoplasmic histone deacetylases and their nonhistone substrates. J. Biomed. Biotechnol. 2011, 146493. [DOI] [PMC free article] [PubMed] [Google Scholar]
- 42. Russell R. C., Tian Y., Yuan H., Park H. W., Chang Y. Y., Kim J., Kim H., Neufeld T. P., Dillin A., and Guan K. L. (2013) ULK1 induces autophagy by phosphorylating Beclin-1 and activating VPS34 lipid kinase. Nat. Cell Biol. 15, 741–750 [DOI] [PMC free article] [PubMed] [Google Scholar]
- 43. Jung C. H., Ro S. H., Cao J., Otto N. M., and Kim D. H. (2010) mTOR regulation of autophagy. FEBS Lett. 584, 1287–1295 [DOI] [PMC free article] [PubMed] [Google Scholar]
- 44. Alers S., Löffler A. S., Wesselborg S., and Stork B. (2012) Role of AMPK-mTOR-Ulk1/2 in the regulation of autophagy: cross talk, shortcuts, and feedbacks. Mol. Cell. Biol. 32, 2–11 [DOI] [PMC free article] [PubMed] [Google Scholar]
- 45. Kim J., Kundu M., Viollet B., and Guan K. L. (2011) AMPK and mTOR regulate autophagy through direct phosphorylation of Ulk1. Nat. Cell Biol. 13, 132–141 [DOI] [PMC free article] [PubMed] [Google Scholar]
- 46. Heras-Sandoval D., Pérez-Rojas J. M., Hernández-Damián J., and Pedraza-Chaverri J. (2014) The role of PI3K/AKT/mTOR pathway in the modulation of autophagy and the clearance of protein aggregates in neurodegeneration. Cell. Signal. 26, 2694–2701 [DOI] [PubMed] [Google Scholar]
- 47. Nazio F., Strappazzon F., Antonioli M., Bielli P., Cianfanelli V., Bordi M., Gretzmeier C., Dengjel J., Piacentini M., Fimia G. M., and Cecconi F. (2013) mTOR inhibits autophagy by controlling ULK1 ubiquitylation, self-association and function through AMBRA1 and TRAF6. Nat. Cell Biol. 15, 406–416 [DOI] [PubMed] [Google Scholar]
- 48. Kawaguchi Y., Kovacs J. J., McLaurin A., Vance J. M., Ito A., and Yao T. P. (2003) The deacetylase HDAC6 regulates aggresome formation and cell viability in response to misfolded protein stress. Cell 115, 727–738 [DOI] [PubMed] [Google Scholar]
- 49. Hetz C., Chevet E., and Harding H. (2013) Targeting the unfolded protein response in disease. Nat. Rev. Drug Discov. 12, 703–719 [DOI] [PubMed] [Google Scholar]
- 50. Li C., and Johnson D. (2012) bortezomib induces autophagy in head and neck squamous cell carcinoma cells via JNK activation. Cancer Lett. 314, 102–107 [DOI] [PMC free article] [PubMed] [Google Scholar]
- 51. Lee J. Y., Koga H., Kawaguchi Y., Tang W., Wong E., Gao Y. S., Pandey U. B., Kaushik S., Tresse E., Lu J., Taylor J. P., Cuervo A. M., and Yao T. P. (2010) HDAC6 controls autophagosome maturation essential for ubiquitin-selective quality-control autophagy. EMBO J. 29, 969–980 [DOI] [PMC free article] [PubMed] [Google Scholar]
- 52. Zhu T., Zhao D., Song Z., Yuan Z., Li C., Wang Y., Zhou X., Yin X., Hassan M. F., Yang L. (2016) HDAC6 alleviates prion peptide-mediated neuronal death via modulating PI3K-Akt-mTOR pathway. Neurobiol. Aging 37, 91–102 [DOI] [PubMed] [Google Scholar]
- 53. Bach M., Larance M., James D. E., and Ramm G. (2011) The serine/threonine kinase ULK1 is a target of multiple phosphorylation events. Biochem. J. 440, 283–291 [DOI] [PubMed] [Google Scholar]


