

Abstract
The DDHD domain-containing proteins, which belong to the intracellular phospholipase A1 (iPLA1) family, have been predicted to be involved in phospholipid metabolism, lipid trafficking, membrane turnover, and signaling. Defective cardiolipin (CL), phosphatidylethanolamine, and phosphatidylglycerol remodeling cause Barth syndrome and mitochondrial dysfunction. Here, we report that Yor022c is a Ddl1 (DDHD domain-containing lipase 1) that hydrolyzes CL, phosphatidylethanolamine, and phosphatidylglycerol. Ddl1 has been implicated in the remodeling of mitochondrial phospholipids and CL degradation. Our data also suggested that the accumulation of monolysocardiolipin is deleterious to the cells. We show that Aft1 and Aft2 transcription factors antagonistically regulate the DDL1 gene. This study reveals that the misregulation of DDL1 by Aft1/2 transcription factors alters CL metabolism and causes mitochondrial dysfunction in the cells. In humans, mutations in the DDHD1 and DDHD2 genes cause specific types of hereditary spastic paraplegia (SPG28 and SPG54, respectively), and the yeast DDL1-defective strain produces similar phenotypes of hereditary spastic paraplegia (mitochondrial dysfunction and defects in lipid metabolism). Therefore, the DDL1-defective strain could be a good model system for understanding hereditary spastic paraplegia.
Keywords: cardiolipin, gene regulation, metabolism, mitochondria, phospholipid, AFT1/2 transcription factors, Barth syndrome, DDHD domain, YOR022C, hereditary spastic paraplegia
Introduction
The DDHD domain was first identified as a long stretch of 180 amino acids in the central part of the Nir/rdgB (N-terminal domain-interacting receptor/Drosophila retinal degeneration B) proteins. This domain possesses four conserved amino acid residues (DDHD), and the name DDHD domain is based on these four residues. This domain is also found in the C-terminal region of the phosphatidic acid (PA)3-preferring phospholipase A1 (PA-PLA1). The DDHD domain has been predicted to be involved in phospholipid metabolism, lipid trafficking, membrane turnover, and signaling (1). The iPLA1 proteins constitute a recently identified lipid-metabolizing enzyme family. PA-PLA1/DDHD1, KIAA0725p/DDHD2, and p125/Sec23ip are three mammalian iPLA1 family members. Yeasts, nematodes, and plants also have iPLA1 family proteins (2). Higgs and Glomset (3) identified the first iPLA1 member, PA-PLA1, in bovine brain and testis. The hydrolase activities of DDHD1 and DDHD2 (4, 5) have been studied, whereas that of p125 is yet to be demonstrated. In humans, mutations in DDHD1 cause a type of hereditary spastic paraplegia (HSP) termed SPG28 (6), whereas mutations in DDHD2 cause SPG54 (7). HSP is a genetically and clinically heterogeneous group of inherited neurological disorders. Defects in intracellular membrane trafficking, mitochondrial functions, and lipid metabolism have been associated with HSP pathogenesis (6, 8).
The mitochondria are crucial organelles that control the life and death of the cell. Important metabolic reactions, the synthesis of most of the cellular ATP, and the regulation of a number of signaling cascades, such as apoptosis, occur in the mitochondria (9). The major non-bilayer-forming phospholipids, phosphatidylethanolamine (PE) and CL, are synthesized in the mitochondria (10, 11). The presence of CL and PE is important for mitochondrial fusion (12). In the absence of CL, a reduction in the inner membrane potential Δψ and a defect in protein import into the mitochondria have been reported (13). It has been suggested that CL and mitochondrial PE have overlapping functions and that PE compensates for the loss of CL and vice versa (14). Barth syndrome patients have deficiencies in the molecular species of CL, phosphatidylglycerol (PG), phosphatidylcholine (PC), and PE (15, 16). Beranek et al. (17) and Ye et al. (18) have proposed models for CL remodeling in yeast. Like CL remodeling, PG remodeling has been reported in human mitochondria (19), but there is no report of it in yeast. Thus, the enzymes responsible for PG remodeling in yeast remain to be identified. Several studies have shown that CL is very important for mitochondrial function and growth on different carbon sources (17, 18). The growth defect is more pronounced at higher temperatures because CL is required to maintain the mitochondrial DNA and other important cellular functions (13). Defects in PE and CL metabolism cause mitochondrial dysfunction.
In this study, we report that Yor022c, a Saccharomyces cerevisiae mitochondrial protein (20) of the iPLA1 family, is a novel mitochondrial phospholipase that hydrolyzes important mitochondrial phospholipids. Yor022c is a DDHD domain-containing serine hydrolase named Ddl1 (DDHD domain-containing lipase 1) that plays roles in CL, PE, and PG remodeling. We also suggest that Ddl1 has roles in CL degradation. In addition, we show that the DDL1 gene is antagonistically regulated by Aft1 and Aft2 transcription factors.
Results
The DDL1 Gene and the Cellular Phospholipid Content
Ddl1 is a DDHD domain-containing protein that belongs to the iPLA1 family of proteins. A list of homologs of the iPLA1 family is available on the UniProtKB database. A sequence comparison was performed between selected members of the family that contained two conserved regions: the lipase motif (GXSXG) and the DDHD domain. An analysis of the sequences in the PROSITE database showed that the lipase motif is present inside the PROSITE domain PS00120 consensus sequence LIV-KG-LIVFY-LIVMST-G-HYWV-S-YAG-G-GSTAC, where the underlined amino acids are not accepted at a given position. In some family members, the lipase consensus sequence (GXSXG) was replaced by the SXSXG sequence. In Ddl1, the lipase motif spanned amino acids 499 to 503, whereas the DDHD domain spanned amino acids 519 to 700 (Fig. 1A).
FIGURE 1.

Effect of the DDL1 gene on the cellular phospholipid content. A, schematic diagram representing the two conserved regions: the lipase motif and DDHD domain in the Ddl1 (Yor022c) protein. B and C, effect of deletion of the DDL1 gene on phospholipids content. In B, an unidentified lipid species also migrated at the position of CL in the crd1Δ strain (indicated by an arrow). NL, nonpolar lipids. In C, a schematic diagram represents the key enzymes of CL metabolism (upper panel), and the extracted lipids were analyzed on a TLC plate (bottom panel). D and E, DDL1 overexpression and cellular CL and PE levels. V, pYES2/NT B vector; G, pYES2/NT B-DDL1. In each TLC analysis, the lipids that were extracted from the stationary-phase cells (A600 = 25) grown in the presence of [14C]acetate were analyzed on a TLC plate followed by phosphorimaging, and the label was counted with a liquid scintillation counter. To show each phospholipid, the optimum brightness and contrast were adjusted in the images. The values are presented as the mean ± S.E. (n = 3). Significance was determined at *, p < 0.05.
As reported previously (1), DDHD domain-containing proteins play an important role in phospholipid metabolism. Therefore, we analyzed the phospholipid profiles of the ddl1Δ strain. The cells were grown in their respective media with 0.2 μCi of [14C]acetate/ml. The lipids were extracted from stationary-phase cells and resolved on a silica-thin-layer chromatography (TLC) plate followed by phosphorimaging. The ddl1Δ strain did not show a significant change in the PA content compared with the wild-type strain (Fig. 1B). The deletion of the DDL1 gene resulted in an increase (∼21%) in the CL content in the cells, whereas the ddl1Δ strain did not show a substantial change in the content of other phospholipids (Fig. 1C). We also analyzed the phospholipid content of the important deletion strains in the CL metabolism (Fig. 1C). The CLD1 gene encodes the known cardiolipin-specific phospholipase, whereas the CRD1gene encodes cardiolipin synthase. Gep4 is a phosphatase required for PG synthesis, and Taz1 is a transacylase required for CL remodeling. The CL-deficient and PG-rich crd1Δ strain was used as a negative control for CL and as a positive control for PG. The gep4Δ strain was used as a negative control for both CL and PG. The crd1Δ cells grown on glucose showed an accumulation of PG (1.79 ± 0.07% of the total phospholipids), which was confirmed using three different TLC solvent systems (solvent systems 1, 2, and 3). The cellular PA content did not change significantly upon overexpression of the DDL1 gene (data not shown). Overexpression of the DDL1 gene caused a significant decrease (∼22%) in the cellular CL content on the ddl1Δ and (∼33%) wild-type backgrounds compared with the vector control (Fig. 1D), whereas the PE content was elevated by ∼16% on the ddl1Δ background and ∼23% on the wild-type background (Fig. 1E). We also checked the effect of DDL1 overexpression on the cellular content of the PG, an important intermediate of the CL biosynthesis. The cellular PG content did not change significantly upon overexpression of the DDL1 gene on the crd1Δ background (data not shown). The TLC analyses of the deletion and overexpression studies suggested that the DDL1 gene may have a potential role in the phospholipid metabolism.
Phospholipase Assay
To validate the role of the DDL1 gene in phospholipid metabolism, we conducted a phospholipase activity assay using recombinant Ddl1 protein. Prior to the assays, the recombinant Ddl1 protein was purified from the yeast using nickel-nitrilotriacetic acid (Ni2+-NTA) column chromatography and confirmed by immunoblotting with an anti-His6 monoclonal antibody (Fig. 2A). All of the assays were conducted in the presence of the purified recombinant Ddl1 protein. The phospholipase assays with different fluorescently tagged phospholipids and native phospholipids showed that Ddl1 hydrolyzes CL, PE, and PG as substrates. Phospholipase activity was measured under different assay conditions. The protein-dependent (Fig. 2B) and time-dependent (Fig. 2C) lipase activity of Ddl1 was measured using fluorescently tagged CL, PE, and PG. The assays showed a protein- and time-dependent increase in the phospholipase activity. Similarly, pH-dependent and temperature-dependent assays were also conducted. Greater activity was observed at pH 8.5 and at 25 °C (data not shown).
FIGURE 2.

Purification and biochemical function of the Ddl1 protein. A, purification of the recombinant protein. Upper panel, the purified recombinant yeast Ddl1 protein was resolved by 12% SDS-PAGE and stained with Coomassie Brilliant Blue. Lower panel, immunoblot analysis of the Ddl1 protein with an anti-His6 monoclonal antibody (M, protein marker). B, protein-dependent assay. Fluorescently tagged CL, PE, and PG were hydrolyzed with an increasing amount of the purified protein for 10 min at 30 °C (−E, without enzyme; B, boiled enzyme). C, time-dependent assay. The fluorescently tagged phospholipids were hydrolyzed in the presence of 1 μg of the purified protein at 30 °C at different time intervals. T0, zero time point (the enzyme was added to the reaction mixture, which was immediately stopped). The assay was conducted in the presence of 5 μm fluorescently labeled substrate. The reaction was stopped, and the lipids were resolved on a TLC plate and quantified with GeneTools software. A portion of the representative TLC plate is shown. The values are presented as the mean ± S.E. (n = 3).
The phospholipase activity of Ddl1 was measured using the native phospholipids (CL, PE, and PG) as substrates. The phospholipase activity of Ddl1 was higher for CL compared with PE and PG (Fig. 3A). PLA1 activity toward the C18:1-, C18:0-, and C16:0-containing substrates (PE and PG) was not significantly different (Fig. 3B). Site-directed mutagenesis was conducted to evaluate the role of the GXSXG motif in lipase activity. The predicted amino acid residues Gly-499, Ser-501, and Gly-503 were replaced with alanine. The recombinant mutant Ddl1 proteins were purified from the yeast, similar to the wild-type Ddl1 protein. Mutations in the GXSXG motif (Gly to Ala) caused a significant reduction in the lipase activity of the protein, whereas the Ser to Ala mutation completely abolished the activity (Fig. 3C). Inoue et al. (4) have suggested that the DDHD domain is crucial for the PLA1 activity. Therefore, to check the effect of the DDHD domain on the phospholipase activity of the Ddl1, we created a DDHD domain deletion protein (truncated Ddl1). Like wild-type Ddl1, the truncated Ddl1 protein was purified, and the phospholipase activity assays were performed. The data indicated that the DDHD domain deletion significantly reduced the phospholipase activity of the Ddl1 (Fig. 3D). Collectively, these experiments suggested that Ddl1 is a novel phospholipase that uses key mitochondrial membrane lipids as substrates.
FIGURE 3.

Characterization of the DDL1 gene. A, phospholipase assay and measurement of the released FFA. The assays were conducted using the purified recombinant Ddl1 protein. The released FFA, estimated using a fluorescent FFA estimation kit, are represented as μmol of FFA released/min/mg of protein. B, phospholipase assay using PE and PG with different fatty acid compositions. The assay was conducted for 30 min at 30 °C in the presence of 2 μg of the purified recombinant Ddl1 and 100 μm substrates. The released FFA were scraped from the TLC plates, and the samples were prepared and subjected to gas chromatography analysis: DOPE, 18:1–18:1 PE; SOPE, 18:0–18:1 PE; POPE, 16:0–18:1 PE; DOPG, 18:1–18:1 PG; SOPG, 18:0–18:1 PG; POPE, 16:0–18:1 PG. C, site-directed mutagenesis of the lipase motif and phospholipase activity. Upper insert, the recombinant Ddl1 mutant proteins were purified from yeast similar to the wild-type Ddl1 protein, and an immunoblot analysis was performed. Lower insert, 1 μg of the purified wild-type and mutant Ddl1 proteins was used for the phospholipase assay at 30 °C for 30 min. A portion of the representative TLC plate is shown. D, effect of the DDHD domain on the phospholipase activity of Ddl1. The purified recombinant truncated Ddl1(tDdl1) protein (left panel) and an immunoblot of the tDdl1 (middle panel) are shown. Right panel, 1 μg of the purified wild-type and tDdl1 proteins was used for the phospholipase assay at 30 °C for 30 min. The reaction was stopped, and the lipids were resolved on a TLC plate and quantified with GeneTools software. M, protein marker; −E, without enzyme; WT, pYES2/NT B-DDL1. The values are presented as the mean ± S.E. (n = 3), and significance was determined at **, p < 0.01.
DDL1 Alters the Molecular Species Profile of CL, PE, and PG
Phospholipase assays revealed that Ddl1 hydrolyzes CL, PE, and PG. Therefore we checked the effect of the Ddl1 on molecular species of its substrates using the MS/MSALL technique. An analysis of the molecular species of CL revealed that the C64 to C68 clusters harbored the majority of the CL species, as reported previously (21). The major CL molecular species clusters (CL C64 to C68) were grouped into two groups, the more unsaturated group (MUG) and the less unsaturated group (LUG). The deletion of the DDL1 gene significantly altered the profile of the CL species (Fig. 4A). In the ddl1Δ strain, the CL species with saturated fatty acids (LUG) were increased at the expense of the CL species with unsaturated fatty acids (MUG). We also analyzed the CL species of cld1Δ and taz1Δ strains because the CLD1 and TAZ1 genes play an important role in CL remodeling (Fig. 4A). DDL1 overexpression did not significantly affect the molecular species of CL in the cld1Δ strain, but it caused an increase in the CL species with unsaturated fatty acids (MUG) at the expense of the CL species with saturated fatty acids (LUG) on the ddl1Δ background (Fig. 4B). In contrast, DDL1 overexpression on the wild-type background increased the CL species with saturated fatty acids (LUG) at the expense of the CL species with unsaturated fatty acids (Fig. 4B). A comparison of the ddl1Δ, and wild-type strains showed that there was a relative increase in the C32:0 and a decrease in the C32:1 species of PE (Fig. 4C). An analysis of DDL1 overexpression on the ddl1Δ background showed that there was an increase in the C34:2 species of PE (Fig. 4D). DDL1 overexpression on the crd1Δ background caused a significant increase in the C34:2 and C34:1 species of PG at the expense of the C32:1 and C32:0 species (Fig. 4E).
FIGURE 4.

Effect of the DDL1 gene on the molecular species of CL, PE, and PG. A–E, effect of the DDL1 gene on the molecular species of CL (A and B), PE (C and D), and PG (E). In each case, the extracted lipids were analyzed by MS/MSALL. For the relative quantification of CL, a graph was generated for the MUG and the LUG of each strain, and for PE and PG, the amount of each molecular species was determined relative to the total species present in both clusters (C32 and C34). V, pYES2/NT B vector; G, pYES2/NT B-DDL1. The values are presented as the mean ± S.E. (n = 3). Significance was determined at *, p < 0.05.
We also analyzed the effect of the DDL1 gene on the molecular species of other phospholipids. The analysis showed that like with PE and PG, the C32 and C34 clusters harbored the majority of the PA, PC, phosphatidylinositol (PI), and phosphatidylserine (PS), species, as reported previously (22). The comparative analysis showed that the DDL1 deletion and overexpression altered the molecular species profile of PA and PS (Fig. 5, A–D). In the ddl1Δ strain, the molecular species of PC and PI were altered, but DDL1 overexpression did not change the molecular species of these phospholipids (Fig. 5, E–H). These changes could be due to the indirect effect of the DDL1 gene, as Ddl1 did not show lipase activity toward these phospholipids. Together, the phospholipase assays and the phospholipids analyses of the deletion and overexpression studies suggested that the DDL1 gene may have a potential role in the CL metabolism.
FIGURE 5.

Effect of the DDL1 gene on the molecular species of the different phospholipids. A–H, effect of the DDL1 gene on the molecular species of the different phospholipids: PA (A and B), PS (C and D), PC (E and F), and PI (G and H). In each case, the extracted lipids were analyzed by MS/MSALL. For the relative quantification of the phospholipids, the amount of each molecular species was determined relative to the total species present in both clusters (C32 and C34). V, pYES2/NT B vector; G, pYES2/NT B-DDL1. The values are presented as the mean ± S.E. (n = 3). Significance was determined at *, p < 0.05.
AFT1 and AFT2 Antagonistically Regulate the DDL1 Gene
To identify the transcription factor that putatively binds the upstream promoter region of the DDL1 gene, we searched the Yeastract promoter database of S. cerevisiae, which provided us with 23 different transcription factors. However, none of them are directly involved in the regulation of mitochondrial functions. Recently, Berthelet et al. (23) have shown that the AFT1 gene has iron-independent functions and affects mitochondrial function. Therefore, we selected Aft1 and its paralog, Aft2, both of which bind at the same sequence (Fig. 6A). First, we examined the expression of the DDL1 gene on the aft1Δ and aft2Δ backgrounds. The AFT1 deletion caused an increase in the expression of the DDL1 transcripts, whereas the AFT2 deletion caused a decrease in the level of the DDL1 transcripts. AFT2 was up-regulated (8.87-fold) in the aft1Δ strain, and AFT1 was up-regulated 7.46-fold in the aft2Δ strain (Fig. 6B). Compared with the vector control, AFT1 overexpression caused a slight down-regulation of the DDL1 transcripts, whereas AFT2 overexpression up-regulated (∼12-fold) the expression of the DDL1 gene (Fig. 6C). To assess the transcriptional regulation of the DDL1 gene by Aft1/2 in vivo, the β-galactosidase activity of DDL1-lacZ was measured in the WT, aft1Δ, and aft2Δ strains. The β-galactosidase activity of the aft1Δ strain was significantly higher (∼37%), and that of the aft2Δ strain was lower (∼52%) than the wild-type strain (Fig. 6D). These results suggested that Aft1 negatively regulates DDL1 expression, whereas Aft2 positively regulates its expression.
FIGURE 6.

Regulation of the DDL1 gene by the AFT1 and AFT2 transcription factors. A, schematic diagram of the DDL1 promoter representing the Aft1/2 binding site and sequence. B and C, effect of the AFT1 and AFT2 genes on the expression of the DDL1 gene. The horizontal dotted lines represent expression in the WT/vector control strain. The values are presented as the mean ± S.E. (n = 3) and are represented as fold changes. Significance was determined at *, p < 0.05; and **, p < 0.01. D, β-galactosidase activity of DDL1-lacZ in the aft1Δ and aft2Δ strains. The graph shows β-galactosidase activity under the control of the DDL1 promoter in the WT, aft1Δ, and aft2Δ strains, represented as a % of the WT. The values are presented as the mean ± S.E. (n = 3). E, association of Aft1 and Aft2 with the DDL1 promoter. Transformants (BG1805-AFT1/2) overexpressing the Aft1/2 proteins were subjected to ChIP assays with anti-HA and anti-RFP antibodies. PCR analyses of the input (IN), IP, and CIP DNA using the DDL1 promoter-specific primers show the occupancy of Aft1/2 on the DDL1 promoter. The relative fold enrichment was measured using the formula shown at the top. The values are presented as the mean ± S.E. (n = 3) and represent the fold enrichment (arbitrary unit). Significance was determined at *, p < 0.05.
It has been shown that Aft1 and Aft2 bind a conserved iron-responsive element (Fe-RE) site present in the promoters of their gene targets. Fe-RE binding sites consist of a CACCC core sequence (24). Chromatin immunoprecipitation (ChIP) assays were performed to assess the in vivo binding of Aft1/2 to the DDL1 promoter. The ChIP assays revealed that both Aft1 and Aft2 occupy the DDL1 promoter (Fig. 6E). To confirm the binding of Aft1/2 to the DDL1 promoter, gel shift assays were performed using the bacterially expressed and purified recombinant Aft1/2 proteins. The proteins were purified by Ni2+-NTA column chromatography. We were able to purify Aft2 protein, but the Aft1 protein was only partially purified (Fig. 7A). As the amount of protein increased, a decrease in the free DNA and an increase in the formation of the DNA-protein complex were observed (Fig. 7, B and C). Electrophoretic mobility shift assays (EMSAs) conducted in the presence of an anti-His6 monoclonal antibody (Ab) showed stronger DNA-protein complex formation. Fe2+ prevented Aft1/2 binding (Fig. 7D). Together, the data from the expression analysis, β-galactosidase activity assays, ChIP assays, and gel shift assays suggested that Aft1 and Aft2 antagonistically regulate DDL1 gene.
FIGURE 7.

EMSAs. A, Aft1 and Aft2 proteins were expressed in pRSET A in bacteria, purified, resolved by 12% SDS-PAGE, and stained with Coomassie Brilliant Blue. Left panel, lane 1, protein marker (M); lane 2, Aft1 protein. Right panel, lane 1, protein marker; lane 2, Aft2 protein. B and C, EMSAs of Aft1/2 on the DDL1 promoter. Lane 1, DDL1 promoter DNA alone (200 ng). The protein-dependent EMSA study is shown with increasing amounts of purified Aft1 and Aft2 proteins (200 ng to 1 μg, lanes 2–5) in the presence of 200 ng of the DDL1 promoter DNA (1 kb). In each assay, one reaction was performed in the presence of a monoclonal anti-His6 Ab (lane 6). D, EMSA with the purified Aft1/2 proteins (1 μg) in the presence of 200 ng of promoter DNA (1 kb) of DDL1 and Ab (lane 1 and 3) or Fe2+ (lane 2 and 4). Data are representative, and the experiment was repeated three times.
Knock-out and Overexpression of the DDL1 Gene Produce Mitochondrial Dysfunction
It was reported previously that the Ddl1 protein is localized in the mitochondria (20), and we showed that it acts as a phospholipase that hydrolyzes the major mitochondrial phospholipids species. Therefore, we investigated the effect of the DDL1 gene on the mitochondria in the cells. Cells grown in stationary phase in synthetic minimal (SM) medium were collected and stained with the mitochondrial dye MitoTracker Orange CMTMRos followed by confocal microscopy. Microscopic imaging showed that alterations in CL metabolism produce mitochondrial dysfunction. The ddl1Δ strain showed a significant increase (69.46%) in fragmented mitochondria compared with the wild-type cells (24.87%). A similarly significant pattern was also observed in the other deletion strains in CL metabolism (Fig. 8A). Ye et al. (18) have shown that the deletion of CLD1 (the only known CL-specific phospholipase A2 in S. cerevisiae) on the taz1Δ background rescues the respiration defect of the mutant. Therefore, we also investigated the effect of the DDL1 and CLD1 deletions on the mitochondria in the taz1Δ strain. CLD1 deletion in the taz1Δ strain showed a significant reduction in the mitochondrial fragmentation pattern (53.93%) in comparison with the taz1Δ strain (79.65%), whereas the DDL1 deletion in the taz1Δ strain caused an increase (93.36%) in the fragmentation pattern (Fig. 8A). To understand the effects of CL-hydrolyzing phospholipases on mitochondrial function, we generated a triple deletion strain (RRY25, cld1Δddl1Δtaz1Δ) on the taz1Δ background. Interestingly, compared with the taz1Δ strain (79.65%), the triple mutant showed reduced (40.44%) mitochondrial fragmentation (Fig. 8A).
FIGURE 8.

Physiological significance of the DDL1 gene. A and B, the role of the DDL1 gene in mitochondrial morphology. Stationary-phase cells were stained with the mitochondrial dye MitoTracker Orange CMTMRos. The images were captured with a confocal microscope. C, study of the mitochondrial membrane potential. The cells were collected from the stationary phase and stained with the JC-1 dye. The ratio of Fred/Fgreen was used to determine the relative mitochondrial membrane potential. D, DDL1 overexpression and the oxygen consumption rate. The cells were collected from the stationary phase, and the oxygen consumption rate was analyzed. Bar, 5 μm. V, pYES2/NT B vector; G, pYES2/NT B-DDL1. To quantify mitochondrial fragmentation, at least 200 cells were scored in each background. The values are presented as the mean ± S.E. (n = 3). Significance was determined at *, p < 0.05.
DDL1 overexpression caused an increase (∼14% on the ddl1Δ background and ∼30% on the wild-type background) in the number of cells with fragmented mitochondria (Fig. 8B). The effect of DDL1 overexpression on the mitochondrial inner membrane potential was investigated with potentiometric JC-1 dye (5,5′,6,6′-tetrachloro-1,1′,3,3′tetraethylbenzimidazolyl-carbocyanine iodide). DDL1 overexpression caused a reduction (∼21% on the ddl1Δ background and ∼23% on the wild-type background) in the mitochondrial inner membrane potential of the cells (Fig. 8C). DDL1 overexpression caused a substantial reduction in the rate of oxygen consumption in the cells (Fig. 8D).
We also examined the CL content in the double and triple mutants. Compared with the taz1Δ strain, the TLC analysis showed a substantial increase (∼51%) in the CL content of the triple mutant, whereas the CL contents of the ddl1Δtaz1Δ and cld1Δtaz1Δ strains were not significantly different (Fig. 9A). We also checked the molecular species profile of CL in the cld1Δddl1Δtaz1Δ strain, which showed no significant difference (Fig. 9B). The TLC data showed that compared with the taz1Δ strain, the cld1Δddl1Δtaz1Δ strain exhibited reduced monolysocardiolipin (MLCL) content (Fig. 9C). The ddl1Δ and cld1Δddl1Δ strains also showed a faintly detectable amount of MLCL, but MLCL was absent in the cld1Δ strain (data not shown). We also performed an expression analysis of the DDL1 and CLD1 genes on the taz1Δ background, which showed that the expression of these genes was increased (∼6-fold) (Fig. 9D). Briefly, these experiments suggested that both the deletion and overexpression of the DDL1 gene produce mitochondrial dysfunction and that the DDL1 gene plays an important role in the CL metabolism.
FIGURE 9.

The DDL1 gene and cellular MLCL content. A, effects of the TAZ1, DDL1, and CLD1 genes on the cellular CL content. The lipids that were extracted from the stationary-phase cells (A600 = 25) grown in the presence of [14C]acetate were analyzed on a TLC plate. B, TAZ1, DDL1, and CLD1 genes and molecular species of CL. The molecular species of CL in the cld1Δddl1Δtaz1Δ strain were compared with the taz1Δ control, and the data for the taz1Δ strain were duplicated from Fig. 4A. C, effects of the TAZ1, DDL1, and CLD1 genes on the cellular MLCL content. The lipids that were extracted from the stationary-phase lyophilized cells (50 mg) were resolved on a TLC plate, which was then charred with 10% cupric sulfate in 8% aqueous phosphoric acid for 10 min at 180 °C. The amounts of CL and MLCL were determined relative to the total CL (CL + MLCL). D, analysis of the expression of the DDL1 and CLD1 genes in the taz1Δ strain. The horizontal dotted line represents expression in the WT strain. The values are represented as fold changes. The values are presented as the mean ± S.E. (n = 3), and significance was determined at *, p < 0.05; and **, p < 0.01.
AFT1/2-defective Strains Exhibit Altered CL Metabolism and Mitochondrial Dysfunction
As reported previously, the AFT1 gene affects mitochondrial function; therefore, we investigated the effects of the AFT1/2 genes on the signature phospholipid species (CL) of the mitochondria. The cells were grown in their respective media with 0.2 μCi of [14C]acetate/ml. The lipids that were extracted from the stationary-phase cells were resolved on a TLC plate followed by phosphorimaging. The aft1Δ strain showed a decrease (∼16%) in CL content of the cells compared with the wild-type strain, whereas deletion of the AFT2 gene caused an increase (∼17%) in the CL content (Fig. 10A). Overexpression of the AFT1 gene on the aft1Δ background caused an increase (∼22%) in the CL content, but AFT1 overexpression on the wild-type background caused a decrease in the CL content. The cellular CL content was significantly decreased upon AFT2 overexpression (Fig. 10B).
FIGURE 10.
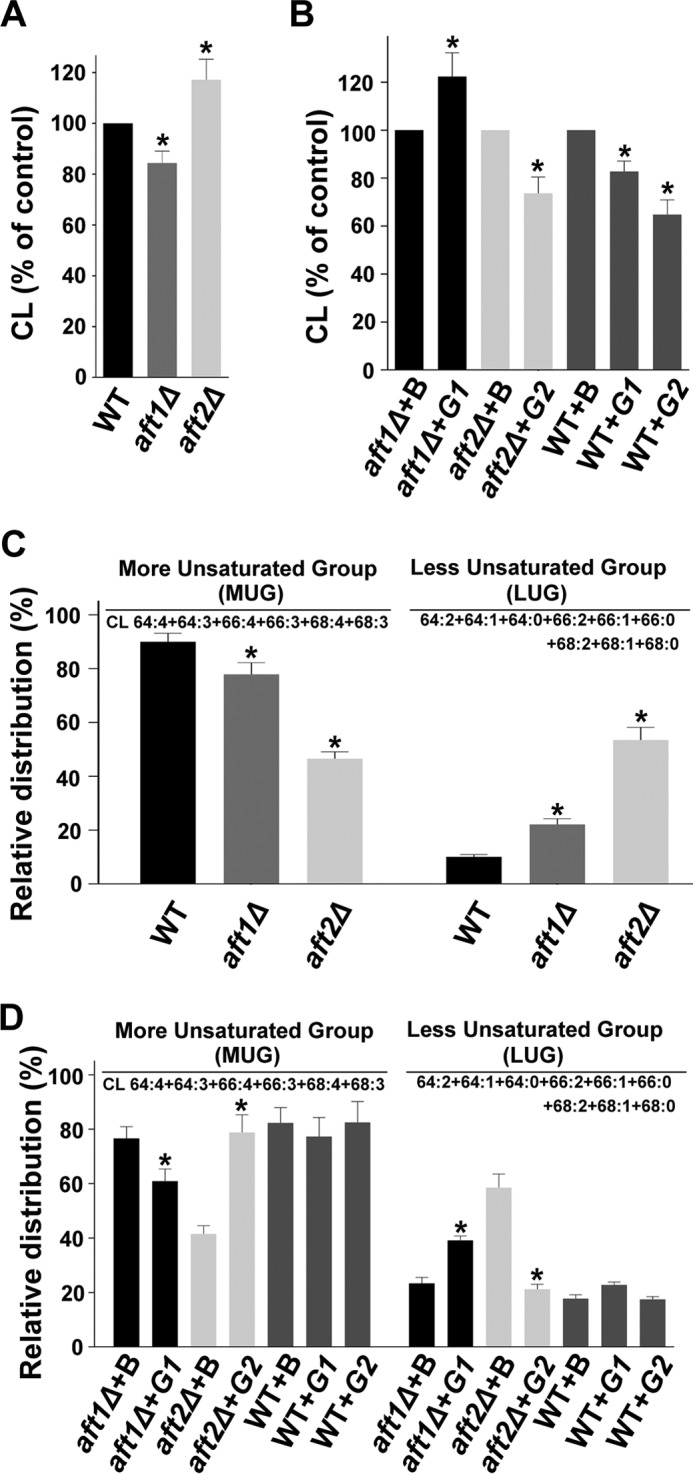
The AFT1 and AFT2 genes and cellular CL content. A and B, effects of the AFT1 and AFT2 genes on the cellular CL content. The lipids that were extracted from the stationary-phase cells (A600 = 25) grown in the presence of [14C]acetate were resolved on a TLC plate. C, effect of deletion of the AFT1 and AFT2 genes on molecular species of CL. The extracted lipids were analyzed by MS/MSALL. In C, the values in the WT panel were duplicated from Fig. 4A to generate the graph. D, effects of the AFT1 and AFT2 genes on molecular species of CL. The extracted lipids were analyzed by MS/MSALL (B, BG1805 vector; G1, BG1805-AFT1; and G2, BG1805-AFT2). The values are presented as the mean ± S.E. (n = 3). Significance was determined at *, p < 0.05.
Deletions of the AFT1/2 genes altered the CL species profile. In the aft1Δ strain, the CL species with saturated fatty acids (LUG) were increased, and this change was more profound in the aft2Δ strain (Fig. 10C). An analysis of AFT1 overexpression on the aft1Δ background did not complement the CL molecular profile; in addition, it exacerbated the condition by increasing the CL species with saturated fatty acids (LUG). AFT2 overexpression on the aft2Δ background increased the CL species with unsaturated fatty acids (MUG). AFT1/2 overexpression on the wild-type background did not affect the CL molecular profile (Fig. 10D).
To assess the role of the AFT1/2 genes on the mitochondria, we stained the stationary-phase cells grown in SM medium with the mitochondrial dye MitoTracker Orange CMTMRos followed by confocal microscopy. Microscopic imaging revealed that the deletion of AFT1 produced a significant increase (66.8%) in the number of cells with fragmented mitochondria compared with the wild-type strain (24.87%). AFT2 deletion also increased the mitochondrial fragmentation (Fig. 11A).
FIGURE 11.

Physiological significance of the AFT1 and AFT2 genes. A and B, effects of AFT1 and AFT2 deletion (A) and overexpression (B) on mitochondrial morphology. Stationary-phase cells were stained with mitochondrial dye. The images were captured with a confocal microscope B, BG1805 vector; G1, BG1805-AFT1; G2, BG1805-AFT2. In A, the values in the WT panel were duplicated from Fig. 8A. Bar, 5 μm. To quantify mitochondrial fragmentation, at least 200 cells were scored in each background. The values are presented as the mean ± S.E. (n = 3). Significance was determined at *, p < 0.05.
AFT1 overexpression on the aft1Δ background did not significantly improve the dysfunction in the mitochondria. AFT1 overexpression on the wild-type background caused an increase (∼38%) in the number of cells with fragmented mitochondria (Fig. 11B). AFT2 overexpression caused an increase in the number of cells with fragmented mitochondria (∼20% on the aft2Δ background and ∼50% on the wild-type background) (Fig. 11B). Together, the mass spectrometry, TLC analyses, and microscopic imaging of the deletion and overexpression strains suggested that AFT1/2 play a role in CL metabolism and that the AFT1/2-defective strains produce mitochondrial dysfunction.
Discussion
Ddl1 is the serine hydrolase of the iPLA1 family. Phospholipase assays and site-directed mutagenesis revealed that Ddl1 is a novel mitochondrial phospholipase that hydrolyzes key mitochondrial phospholipids. Although it is likely a PA-PLA1, Ddl1 did not show lipase activity toward PA. Deletion of the DDL1 gene caused an increase in the CL content. This could be due to the deletion of CL-preferring lipase leading to CL accumulation. Compared with the vector control, the overexpression of the DDL1 gene on any genetic background caused a significant decrease in the cellular CL content and an increase in the PE content. The increased PE content upon DDL1 overexpression could be due to CL deficiency; Gohil et al. (14) have suggested that CL and mitochondrial PE have overlapping functions and that each can compensate for the loss of the other. Interestingly, the crd1Δ cells grown on glucose accumulated PG (∼1.8% of the total phospholipids), likely because the expression of the CL biosynthetic genes is up-regulated in stationary-phase cells (18).
In mammals, it is well established that CL remodeling can be achieved via two pathways, similar to the remodeling of other phospholipids. The first occurs via the Lands cycle, a deacylation-reacylation cycle (CoA-dependent) and the second occurs via a deacylation-transacylation cycle (CoA-independent) between acceptor and donor phospholipids. Several models based on the deacylation-transacylation cycle have been proposed for CL remodeling in yeast. Barth syndrome patients have been shown to be defective in CL and PG remodeling (15). PG undergoes remodeling in human mitochondria to achieve appropriate fatty acyl chains and to prevent the harmful effects of LPG accumulation (19). Unlike in human, there is no report on PG remodeling in yeast. Recently, Pokorna et al. (25) have reported the presence of two diverse pools of PG with different fatty acid compositions in yeast mitochondria. Like lysophosphatidylglycerol (LPG), the accumulation of Lysophosphatidylethanolamine (LPE) may cause adverse effects to the cells. Therefore, considering these facts, it can be hypothesized that Ddl1 may play an important role in the remodeling of CL, PE, and PG (as Ddl1 hydrolyzes these substrates).
Deletion of the DDL1 gene caused an increase in the saturated species of CL and PE, whereas overexpression of the DDL1 gene increased the unsaturated species. Interestingly, DDL1 overexpression did not significantly affect the molecular species of CL in the cld1Δ strain, which indicates that Ddl1 acts independently. DDL1 overexpression on the crd1Δ background caused a significant increase in the unsaturated species of PG. Considering these results, we propose that CL is remodeled through a deacylation-transacylation cycle in which MLCL is generated from CL by phospholipases (Cld1 and Ddl1) followed by MLCL reacylation by transacylase (Taz1). Thus, the acyl specificity of CL is achieved by extensive remodeling through PLA1 (Ddl1), PLA2 (Cld1), and transacylase (Taz1) activities. In addition, we also propose a role for Ddl1 in CL degradation (Fig. 12). The dilysocardiolipin formed by Ddl1 activity initiates CL degradation (26). We propose that a deacylation (by Ddl1)-reacylation (by CoA-dependent acyltransferase) cycle is responsible for PE and PG remodeling in yeast. With its broad substrate specificity, the Ale1 (also known as Lpt1) protein may reacylate the LPE and LPG generated by Ddl1 activity to PE and PG, respectively (27, 28). It will be interesting to study the relationship between the DDL1 and ALE1 genes in phospholipid metabolism.
FIGURE 12.

Putative pathway of CL remodeling and degradation in yeast. We propose that the acyl specificity of CL is achieved by extensive remodeling through PLA1, PLA2, and transacylase activities. The dilysocardiolipin (DLCL) formed by Ddl1 activity initiates CL degradation. P, phosphate group; S, saturated fatty acyl chain; US, unsaturated fatty acyl chain; MLPL, monolysophospholipid.
It has been shown that CL is very important for the mitochondrial functions. The taz1Δ strain displayed a low CL content and no accumulation of PG, suggesting that the PG to CL biosynthesis is not affected in the taz1Δ strain. However, the reduced CL content indicated that CL hydrolysis/degradation may have increased. An analysis of the expression of the DDL1 and CLD1 genes on the taz1Δ background showed a significant increase in their expression levels, indicating that CL hydrolysis and degradation were increased in the taz1Δ strain. CLD1 deletion in the taz1Δ strain produced a significant reduction in the number of cells with fragmented mitochondria, and the cld1Δtaz1Δ double mutant rescued the mitochondrial defect of the taz1Δ strain. One possible explanation for this is that the level of MLCL was reduced in the double mutant compared with the single mutant. DDL1 deletion in the taz1Δ strain caused an increase in the number of cells with fragmented mitochondria. Therefore, the most likely explanation is that CL, PE, and PG remodeling and CL degradation were affected in the double mutant. Interestingly, compared with the taz1Δ strain, the cld1Δddl1Δtaz1Δ strain showed reduced mitochondrial fragmentation. The CL content was also increased in the triple mutant compared with the taz1Δ strain, which can be attributed to the deletion of both CL-preferring lipases. These data suggested that the accumulation of MLCL in the taz1Δ strain is deleterious. Like deletion strains in CL metabolism, the DDL1-defective strains also showed mitochondrial dysfunction. Therefore, the most likely explanation is that CL, PE, and PG remodeling and CL degradation were affected in the DDL1-defective strains. Based on our findings, it is clear that both CL remodeling and CL degradation are important for cell survival.
To identify the transcription factor that regulates the DDL1 gene, we performed an in silico analysis and determined that the Aft1/2 transcription factors have the same putative binding site in the upstream region of the DDL1 promoter. Aft1 negatively regulates DDL1 expression, whereas Aft2 positively regulates DDL1 expression. CL profiling in both the deletion and overexpression strains suggested that AFT1/2 may play a role in CL metabolism. Studies related to mitochondrial function suggested that AFT1 deletion and AFT2 overexpression cause similar phenotype, such as fragmented mitochondria. Both deletion/down-regulation and overexpression/up-regulation of DDL1 are deleterious to the cells. Thus, our entire study can be summarized thus: “the misregulation of DDL1 by Aft1/2 alters CL metabolism and causes mitochondrial dysfunction in the cells.”
Nakajima et al. (29) have reported that human DDHD2 hydrolyzes PA and PE, and it prefers PA as a substrate. Inoue et al. (4) have shown that both DDHD1 and DDHD2 have PA-PLA1 activity. Mutations in the DDHD1 and DDHD2 genes cause HSP (SPG28 and SPG54, respectively), and the deletion of yeast DDL1 produced similar phenotypes (mitochondrial dysfunction and defects in lipid metabolism). It has been also reported that DDHD1 is partially localized to the mitochondria (6, 30). Therefore, it will be interesting to investigate the role of DDHD1/2 in CL metabolism. In addition, the DDL1-defective strain could be a good model system for understanding hereditary spastic paraplegia.
Experimental Procedures
Materials
The phospholipids used in this study (MLCL; DOPE, 1,2-dioleoyl-sn-glycero-3-phosphoethanolamine; SOPE, 1-stearoyl-2-oleoyl-sn-glycero-3-phosphoethanolamine; POPE, 1-palmitoyl-2-oleoyl-sn-glycero-3-phosphoethanolamine; DOPG, 1,2-dioleoyl-sn-glycero-3-phospho-(1′-rac-glycerol); SOPG, 1-stearoyl-2-oleoyl-sn-glycero-3-phospho-(1′-rac-glycerol); POPG, 1-palmitoyl-2-oleoyl-sn-glycero-3-phospho-(1′-rac-glycerol); TopFluor-CL, 1,1′,2,2′-tetraoleoyl cardiolipin[4-(dipyrrometheneboron difluoride)butanoyl]; NBD-PA, 1-oleoyl-2-{12-[(7-nitro-2–1,3-benzoxadiazol-4 yl)amino]dodecanoyl}-sn-glycero-3-phosphate; NBD-PC, 1-oleoyl-2-[12-[(7-nitro-2–1,3-benzoxadiazol-4-yl)amino]dodecanoyl]-sn-glycero-3-phosphocholine; NBD-PG, 1-oleoyl-2-{12-[(7-nitro-2–1,3-benzoxadiazol-4-yl)amino]dodecanoyl}-sn-glycero-3-[phosphorac-(1-glycerol)]; and NBD-PS, 1-oleoyl-2-{12-[(7-nitro-2–1,3-benzoxadiazol-4-yl)amino]dodecanoyl}-sn-glycero-3-phosphoserine) were purchased from Avanti Polar Lipids Inc. Cardiolipin and NBD-PE (N-(NBD-aminohexanoyl)-1,2-dioleoyl-sn-glycero-3-phosphoethanolamine)) were obtained from Sigma-Aldrich. [14C]Acetate was obtained from American Radiolabeled Chemicals, Inc. The enzymes used for cloning were procured from New England Biolabs. The protein molecular mass markers were obtained from New England Biolabs and Genetix Biotech Asia Pvt. Ltd., the Ni2+-NTA-agarose columns were purchased from Bio-Rad, and TLC plates were obtained from Merck. The fluorescence-based probes for the yeast mitochondria were purchased from Life Technologies. The materials required for real-time quantitative PCR analysis were purchased from Applied Biosystems. The materials required for yeast extract-peptone-dextrose (YPD) and Luria-Bertani (LB) media were purchased from HiMedia. Yeast nitrogen base was purchased from Difco. The yeast transformation kit was obtained from Clontech. The glass beads, ammonium acetate, yeast synthetic drop-out medium, antibiotic, oligonucleotides, antibodies (H1029 and A3562), and all other reagents were obtained from Sigma-Aldrich unless specified otherwise.
Strains, Plasmids, and Culture Conditions
The strains used in this study are listed in Table 1. The yeast deletion strains were purchased from Euroscarf. The double and triple deletion strains were created using a PCR-based gene deletion protocol (31). The deletion cassette (spanning the whole marker cassette plus the homologous upstream and downstream regions of the targeted gene) was amplified from the YEp351 (LEU2) or pUG34 (HIS3) vector. The cells were transformed with the PCR product (deletion cassette) to produce homologous recombination, and the positive colonies were confirmed by PCR using the different screening primers listed in Table 2. The plasmids used in this study are listed in Table 3. To create the constructs, the genomic DNA was isolated from yeast cells. Gene-specific primers were used to amplify the DDL1 (YOR022C) gene from the genomic DNA. The gene was cloned into the pYES2/NT B yeast expression vector using the KpnI (forward primer) and XhoI (reverse primer) restriction sites and named as pRP1. The pRP2, pRP3, and pRP4 plasmids were constructed by PCR-mediated site-directed mutagenesis using the pRP1 construct as a template. The truncated DDL1 (DDL1 gene devoid of the C-terminal DDHD domain) gene was cloned into the pYES2/NT B vector, and the construct was named pRP5. To analyze the β-galactosidase activity, the pRP6 plasmid was constructed by cloning 1000 base pairs of the upstream promoter sequence plus 9 base pairs downstream of the start site of the DDL1 gene into the YEp357 vector. KpnI (forward primer) and XbaI (reverse primer) restriction sites were used for cloning. The pRP7 and pRP8 plasmids were constructed by cloning the AFT1 and AFT2 genes, respectively, into the pRSET A bacterial expression vector. Gene-specific primers with XhoI (forward primer) and KpnI (reverse primer) restriction sites were used for the PCR amplification of the AFT1 and AFT2 genes from the yeast genomic DNA. The BG1805-AFT1 and BG1805-AFT2 plasmids were purchased from Thermo Scientific Open Biosystems. All of the constructs were confirmed by DNA sequencing. The primers used in this study are listed in Table 2.
TABLE 1.
Strains used in this study
| Strains | Genotypic description | Source |
|---|---|---|
| E. coli | ||
| DH5α | F− φ80dlacZΔM15Δ (lacZYA-argF)U169 deoR recA1 endA1 hsdR17 (rk−mk+) phoA supE44 λ−thi-1 gyrA96 relA1 | Invitrogen |
| BL21(DE3)pLysS | F− ompT hsdSB (rB−mB−) gal dcm (DE3) pLysS (CamR) | Invitrogen |
| S. cerevisiae | ||
| BY4741 | MATa; his3Δ1; leu2Δ0; met15Δ0; ura3Δ0 | Euroscarf |
| ddl1Δ | BY4741; Mat a; his3Δ1; leu2Δ0; met15Δ0; ura3Δ0; YOR022c::kanMX4 | Euroscarf |
| cld1Δ | BY4741; Mat a; his3Δ1; leu2Δ0; met15Δ0; ura3Δ0; YGR110w::kanMX4 | Euroscarf |
| gep4Δ | BY4741; Mat a; his3Δ1; leu2Δ0; met15Δ0; ura3Δ0; YHR100c::kanMX4 | Euroscarf |
| crd1Δ | BY4741; Mat a; his3Δ1; leu2Δ0; met15Δ0; ura3Δ0; YDL142c::kanMX4 | Euroscarf |
| taz1Δ | BY4741; Mat a; his3Δ1; leu2Δ0; met15Δ0; ura3Δ0; YPR140w::kanMX4 | Euroscarf |
| aft1Δ | BY4741; Mat a; his3Δ1; leu2Δ0; met15Δ0; ura3Δ0; YGL071w::kanMX4 | Euroscarf |
| aft2Δ | BY4741; Mat a; his3Δ1; leu2Δ0; met15Δ0; ura3Δ0; YPL202c::kanMX4 | Euroscarf |
| ddl1Δtaz1Δ | BY4741; Mat a; his3Δ1; leu2Δ0; met15Δ0; ura3Δ0; YPR140w::kanMX4; ddl1Δ::LEU2 | This study |
| cld1Δtaz1Δ | BY4741; Mat a; his3Δ1; leu2Δ0; met15Δ0; ura3Δ0; YPR140w::kanMX4; cld1Δ::LEU2 | This study |
| cld1Δddl1Δ | BY4741; Mat a; his3Δ1; leu2Δ0; met15Δ0; ura3Δ0; YGR110w::kanMX4; ddl1Δ::LEU2 | This study |
| RRY25 (cld1Δddl1Δtaz1Δ) | BY4741; Mat a; his3Δ1; leu2Δ0; met15Δ0; ura3Δ0; YPR140w::kanMX4; ddl1Δ::LEU2; cld1Δ::HIS3 | This study |
TABLE 2.
Primers used in this study
qRT, quantitative real-time PCR; p, promoter; d, deletion; F, forward; Sp, screening primer; M, middle; R, reverse; G1, Gly-499; G2, Gly-503.
| No. | Gene | Forward primer | Reverse primer |
|---|---|---|---|
| 1 | ACT1 (qRT) | ACTTTCAACGTTCCAGCCTTCT | ACACCATCACCGGAATCCAA |
| 2 | AFT1 (qRT) | ATAAGCCCAAAGGACAGGACC | AGGCCCATTGGTTACTGTGG |
| 3 | AFT2 (qRT) | CAACCAAGGCCTGATGGAACT | TGCTTTGTGACAAGGGCCTC |
| 4 | DDL1 (qRT) | GTGTGGTTCGACTCTTCAAATCAA | GGATCATCATTACTGTCGTCGAAT |
| 5 | CLD1 (qRT) | TGCATACGCCCTCGAAAAA | CAATCCGGCGCCATACC |
| 6 | AFT1 (pRSET) | CGGCTCGAGATGGAAGGCTTCAATCCGGCTGACATAG | GAGGTACCCTAATCTTCTGGCTTCACATACT |
| 7 | AFT2 (pRSET) | CGGCTCGAGATGAAAGCAAAGTCGATGA | GAGGTACCTTAATATTTTGATATTAAGGCTGG |
| 8 | DDL1 (pYES2) | AAGGTACCAATGCTACGGTTTACTCATCGAG | TGGCTCGAGTCAACCAGTCTTTCTTTTTACA |
| 9 | tDDL1 (pYES2) | CGGCTCGAGTCATTCATATTTTTTTTGTTT | |
| 10 | DDL1 (G1 to Ala) | GTCCATTTAGTGGCTCATTCGTTGGGTAGT | ACTACCCAACGAATGAGCCACTAAATGGAC |
| 11 | DDL1 (Ser to Ala) | CATTTAGTGGGCCATGCTTTGGGTAGTATGA | TCATACTACCCAAAGCATGGCCCACTAAATG |
| 12 | DDL1 (G2 to Ala) | GGGCCATTCGTTGGCTAGTATGATATTATTTG | CAAATAATATCATACTAGCCAACGAATGGCCC |
| 13 | DDL1p (ChIP) | GATTTGAATGAATATTTGAAGCAACGTGA | GGCCGCTTTTCTTGGTTTCTTGTC |
| 14 | DDL1p (EMSA) | TTGACGAGCAATAGCGGTATCATCGG | TTCAAGTAATTGTTCACTGTGAGTATATTCAG |
| 15 | DDL1p (YEp) | AAGGTACC TTGACGAGCAATAGCGGTATC | GCTCTAGACCGTAGCATTTCAAGTAATTGTTC |
| 16 | DDL1d (LEU2) | TTCCCTAATATTGAAGATCACTGAATATACTCACAGTGAACAATTACTTGAAATGAACTGTGGGAATACT | AATAGACAGTAAAGAAAAAAGTTAAAAAAAACTTGTGCCTTGCGTTTACTGATCACAAATTAGGGATTCG |
| 17 | LEU2 cassette | ATATTCTAGAAACTGTGGGAATACTCAGGTATCG | ATATGTCGACCAAATTAGGGATTCGTAGTTTCATGATTTTCTG |
| 18 | DDL1 5′ FSp | ||
| 19 | LEU2 M RSp | CCAAATGCGGTGTTCTTGTCTGGCAAAGAG | |
| 20 | LEU2 M FSp | CTCTTTGCCAGACAAGAACACCGCATTT | |
| 21 | DDL1 3′ RSp | CAACATCTAATAAGCAAAGGGCATTGCTC | |
| 22 | DDL1 M Sp | GGGAAAGTCCATTTAGTGGGC | ACGCTGCAATATCCGGTTCT |
| 23 | CLD1d (LEU2) | GTACACTAATACTTATACTGATTAATAAGGGTTAGCCTTTTAATGAACTGTGGGAATACTCAGG | GGCGAAAATGTATGTAAAAATTTCGTTATATAATGTAGATGCACAAGATTTCTTCATTACAAATTAGGGATTCGTAG |
| 24 | CLD1 5′ FSp | TGTCAGTGTTTAGCCTCTTTCACCTTTGC | |
| 25 | CLD1 3′ RSp | AGCCCAACTACTCCATAAAGACAGTGGTTC | |
| 26 | CLD1 M Sp | CAAGAACGAGGATGCATTCCA | GACATACCACCAAGGAGGCG |
| 27 | CLD1d (HIS3) | GTACACTAATACTTATACTGATTAATAAGGGTTAGCCTTTTAATGAATTCTCGTTTTAAGAGCTTGG | TAAAAATTTCGTTATATAATGTAGATGCACAAGATTTCTTCATTATGACACGTATAGAATGATGC |
| 28 | HIS3 cassette | AATGAATTCAATTCTCGTTTTAAGAGCTTG | GCTAAAGCTTTGACACGTATAGAATGATGC |
| 29 | HIS3 M RSp | CGCAGTCTTCAGTGGTGTGATGGTCGT | |
| 30 | HIS3 M FSp | ACGACCATCACACCACTGAAGACTGCG |
TABLE 3.
Plasmids used in this study
| Plasmids | Construct description | Source |
|---|---|---|
| pYES2/NT B | Yeast expression vector with N-terminal His6 tag fusion | Invitrogen |
| pRSET A | E. coli expression vector with N-terminal His6 tag fusion | Invitrogen |
| YEp 351 | Yeast expression vector with leucine selection | ATCC |
| YEp 357 | Yeast episomal plasmids with lacZ reporter gene | ATCC |
| pUG34 | Yeast expression vector with histidine selection | Cathal Wilson |
| pRP1 | DDL1 gene is cloned into pYES2/NT B: pYES2/NT B-DDL1 (wild-type) | This study |
| pRP2 | Derived from pRP1 in which 1495GGC1497 is mutated to 1495GCT1497: pYES2/NT B-DDL1 (G1 to A) | This study |
| pRP3 | Derived from pRP1 in which 1501TCG1503is mutated to 1501GCT1503: pYES2/NT B-DDL1(S to A) | This study |
| pRP4 | Derived from pRP1 in which 1507GGT1509 is mutated to 1507GCT1509: pYES2/NT B-DDL1 (G2 to A) | This study |
| pRP5 | Truncated DDL1 gene is cloned into pYES2/NT B: pYES2/NT B-DDL1-DDHD (DDL1 gene devoid of C-terminal DDHD domain) | This study |
| pRP6 | PDDL1-lacZ reporter gene containing the DDL1 promoter into YEp357 | This study |
| pRP7 | AFT1 gene is cloned into pRSETA (pRSET A-AFT1) | This study |
| pRP8 | AFT2 gene is cloned into pRSETA (pRSET A-AFT2) | This study |
| BG1805 | Yeast expression vector with uracil selection | Open Biosystems |
| BG1805-AFT1 | AFT1 gene is cloned into BG1805 | Open Biosystems |
| BG1805-AFT2 | AFT2 gene is cloned into BG1805 | Open Biosystems |
The strains used in this study were maintained as glycerol stocks at −80 °C. The yeast strains are routinely maintained on YPD-agar (1% yeast extract, 2% peptone, 2% glucose, and 2% agar, pH 6.5) plates stored at 4 °C. The working plates were revived periodically. A single colony of the wild-type strain or other strains was precultured from the working YPD plates in 5 ml of YPD liquid medium in a 50-ml culture tube and allowed to grow overnight at 30 °C with constant shaking at 200 rpm in a shaking incubator. An equal amount of cells was taken from the preculture and subcultured in the required volume of SM medium (yeast nitrogen base, 6.7 g; amino acids drop-out, 1.92 g; uracil, 76 mg/liter; and 2% glucose, pH 6.5) at 30 °C. To select the double and triple deletion strains, the appropriate amino acid was removed from the SM medium. Similarly, to maintain the plasmid in the transformants, uracil (U) was omitted from the medium. In this study, cells harboring the pYES2/NT B-DDL1, BG1805-AFT1, and BG1805-AFT2 plasmids were precultured in SM − U + 2% glucose medium and subcultured in an induction medium (SM − U + 2% galactose) unless specified otherwise. For the cells that grew slowly, a 3-fold increased amount of the inoculum was subcultured. The bacterial cells were routinely maintained on LB-agar plates (1% tryptone, 0.5% yeast extract, 1% NaCl, and 2% agar) stored at 4 °C. The bacterial cells were cultured in LB medium at 37 °C. Ampicillin (100 μg/ml) was added to the medium to maintain the construct in the cells.
Radiolabeled Precursor Feeding and Lipid Profile Analysis
The yeast cells were grown in SM + U + 2% glucose or SM − U + 2% galactose medium with 0.2 μCi of [14C]acetate/ml. An equal amount of cells (A600 = 25) from the stationary phase was taken from each sample for lipid extraction. The lipids were extracted according to the method of Bligh and Dyer (32) with slight modifications. The cells were vigorously vortexed in the presence of a chloroform:methanol:2% orthophosphoric acid (1:2:1, v/v) solution and acid-washed glass beads. The total lipids were extracted using the chloroform:methanol:2% orthophosphoric acid (1:1:1, v/v) solution and re-extracted again in the same mixture. The extracted lipids were dried in a SpeedVac concentrator. To separate PA, PC, PE, PI, PS, CL, and PG, the extracted lipids were analyzed on a TLC plate using solvent system 1 (chloroform:methanol:acetic acid:water, 85:15:10:3.5, v/v). The plate was placed in a phosphorimaging screen cassette and scanned in a Typhoon FLA 9500 laser scanner (GE Healthcare). To separate CL and PG from the other phospholipids, the extracted lipids were analyzed on a TLC plate using solvent system 2 (chloroform:methanol:glacial acetic acid, 65:25:8, v/v), followed by phosphorimaging. To separate CL and PG, solvent system 3, which is a two-dimensional system (a basic solvent system followed by an acidic system), was also used. The first dimension was chloroform:methanol:25% ammonia (65:35:4, v/v), and the second dimension was chloroform:methanol:acetic acid:water (85:25:5:4, v/v). Each phospholipid species was scraped off of the plate, and the label was counted with a liquid scintillation counter (PerkinElmer Micro Beta2 2450 microplate counter) using a toluene-based scintillation fluid. As reported earlier (33), the amount of each phospholipid species was determined relative to the total phospholipid content, and each phospholipid species in a strain was compared with WT/control values that were set at 100%. To separate MLCL from the other phospholipids, the cells were grown to the stationary phase, and the lipids were extracted from 50 mg of lyophilized cells. The extracted lipids were resolved using solvent system 4 (chloroform:methanol:acetic acid:water, 85:25:5:4, v/v), and the plate was then charred with 10% cupric sulfate in 8% aqueous phosphoric acid solution for 10 min at 180 °C. CL and MLCL were quantified using GeneTools software (SynGene, a division of Synoptics Ltd.). The amounts of CL and MLCL were determined relative to the total CL (CL + MLCL) content and represented as a percentage for comparison.
Expression and Purification of the Recombinant Proteins
The proteins were expressed according to the protocol given for the respective cloning vector, with slight modifications. Yeast cells harboring the pYES2/NT B-DDL1 construct were grown overnight in 10 ml of SM − U + 2% glucose medium at 30 °C with shaking. On the next day, the cells were pelleted, washed with autoclaved water, and grown in 50 ml of SM − U + 2% raffinose medium overnight at a starting A600 of 0.4. Again, the cells were pelleted, washed with the autoclaved water, and transferred to 400 ml of SM − U + 2% raffinose medium for growth. At A600 = 0.8–1.2, 200 ml of 3× YPG (3% yeast extract, 6% peptone, and 6% galactose, pH 6.5) induction medium was added to the culture and grown for 6 h. The rich induction medium (3× YPG) was used to produce a higher yield of the protein (34). The cells were pelleted by centrifugation at 4 °C and suspended in 20 ml of yeast lysis buffer containing 50 mm Tris-HCl, pH 8.0, 300 mm NaCl, 5 mm MgCl2, 1 mm PMSF, and 10% glycerol (v/v). The cells were lysed at 4 °C using glass beads. The His-tagged protein was affinity-purified according to the manufacturer's recommendation (Bio-Rad). The lysed sample was subjected to high speed centrifugation (10000 × g) for 30 min at 4 °C. The supernatant containing the recombinant protein was allowed to bind to the Ni2+-NTA matrix. The column was washed with wash buffer 1 containing 50 mm Tris-HCl, pH 8.0, 300 mm NaCl, and 20 mm imidazole followed by a second wash with wash buffer 2 containing 50 mm Tris-HCl, pH 8.0, 300 mm NaCl, and 40 mm imidazole. The bound protein was eluted with buffer containing 50 mm Tris-HCl, pH 8.0, 300 mm NaCl, and 150 mm imidazole. The fractions (1 ml each) were collected and analyzed by 12% SDS-PAGE followed by Coomassie Brilliant Blue staining, and the proteins were confirmed by immunoblot analysis using an anti-His6 monoclonal antibody. The purified protein was subjected to dialysis, and the protein concentration was measured using Lowry's method.
Escherichia coli BL21(DE3)pLysS cells harboring the pRSET A-AFT1 and pRSET A-AFT2 plasmids were precultured in 5 ml of LB medium with 100 μg/ml ampicillin and 34 μg/ml chloramphenicol overnight at 37 °C. The cells from the preculture were then inoculated in 1000 ml of LB medium containing 100 μg/ml ampicillin, 34 μg/ml chloramphenicol, 1 mm betaine, and 0.5 m sorbitol (35). The bacterial cells were grown at 37 °C to an A600 of 0.6–0.9 and induced with 0.5 mm isopropyl β-d-thiogalactopyranoside for 12 h at 16 °C. To enable proper folding of the recombinant protein, 200 μm ZnCl2 was also added to the induction medium (36). The cells were pelleted, and the pellet was suspended in bacterial lysis buffer containing 50 mm Tris-HCl, pH 8.0, 300 mm NaCl, 10 mm imidazole, 1 mm PMSF, and 10% glycerol (v/v). The cells were lysed by sonication, and the lysed sample was subjected to high speed centrifugation (10000 × g) for 20 min at 4 °C. The supernatant containing the recombinant protein was allowed to bind to the Ni2+-NTA matrix, and the protein was purified similar to the recombinant yeast protein. The protein samples were analyzed by 12% SDS-PAGE followed by Coomassie Brilliant Blue staining. The purified protein was subjected to dialysis and then used for further studies.
Site-directed Mutagenesis
Site-directed mutagenesis was conducted to evaluate the role of the GXSXG motif in the lipase activity. The predicted amino acid residues Gly-499, Ser-501, and Gly-503 were replaced with alanine (Ala). The mutations in the lipase motif were produced by PCR-based amplification of the entire pRP1 construct. The primers used in this experiment are listed in Table 2. The mutated codon is underlined in the primer sequence. A QuikChange Lightning site-directed mutagenesis kit (Agilent Technologies) was used to construct the mutants, which were confirmed by the DNA sequencing.
Phospholipase Assay
Phospholipase activity was measured under different assay conditions using 5 μm fluorescently tagged CL, PE, and PG substrates. A protein-dependent assay was conducted with increasing amounts of the purified Ddl1 protein for 10 min at 30 °C, and a time-dependent assay was performed in the presence of 1 μg of the purified Ddl1 protein. For the pH-dependent assay, the activity was conducted at different pH values in the Bistris propane buffer system in the presence of 1 μg of the purified protein for 10 min at 30 °C. For the temperature-dependent assay, the activity was analyzed for 10 min at different temperatures in the presence of 1 μg of the purified Ddl1 protein. The assay mixture consisted of 50 mm Tris, pH 8.0, 3 mm MgCl2, 1 mm EDTA, 5 mm CaCl2, 250 μm CHAPS, 40% glycerol, 5 μm fluorescently labeled substrate, and 1 μg of the purified Ddl1 protein in a total volume of 100 μl. Under each assay condition, the reaction was stopped, and lipids were resolved on a TLC plate using chloroform:methanol:25% ammonia (65:25:5, v/v) as solvent system 5, which was used to separate the phospholipids and free fatty acids (FFA) on a single TLC plate. The TLC plates were visualized in a Typhoon FLA 9500 laser scanner, and the lipid molecules were quantified using GeneTools software.
The phospholipase activity of Ddl1 was measured by estimating the FFA release using a fluorescent FFA estimation kit (Cayman Chemical) as reported by Vijayakumar et al. (37). Non-fluorescent (native) PE and PG with different fatty acid compositions were also used for the assays. The released FFA was scraped from the TLC plates, and the samples were prepared and subjected to gas chromatographic (GC) analysis. The protocols used to prepare the fatty acid methyl esters and separate them on the GC system were performed as reported by Yadav et al. (38). Briefly, the scraped FFA band containing silica was derivatized with 1 ml of boron trifluoride-methanol for the GC analysis. The fatty acid methyl esters were separated with a DB-Wax-23 column as follows: 50 °C for 2 min, and then the temperature was raised to 180 °C at a rate of 5 °C/min, and thereafter it was raised to 240 °C at a rate of 5 °C/min. The samples were maintained at 240 °C for 5 min, and then the temperature was raised to 300 °C at a rate of 30 °C/min and maintained at 300 °C for 5 min. The total run time was 34 min. The recombinant mutant and truncated Ddl1 proteins were also used to measure the phospholipase activity.
Lipidomic Analysis by Mass Spectrometry
The yeast cells were grown in 100 ml of their respective SM medium in a 500-ml conical flask. For the lipidome analysis, the cells were harvested from the stationary phase and lyophilized. To identify the molecular species of PA, PC, PE, PG, PI, PS, and CL, an equal amount of lyophilized cells (10 mg) was taken from each sample for lipid extraction. The dried lipids were dissolved in 250 μl of chloroform:methanol (1:2) plus 7.5 mm ammonium acetate and diluted 10-fold. The samples were analyzed using MS/MSALL on an AB Sciex TripleTOFTM 5600 system. The samples were directly infused at a flow rate of 7 μl/min. The molecular species of PC and PE were identified in the positive mode, whereas the species of PA, PG, PI, PS, and CL were analyzed in the negative mode. The major CL molecular species clusters (CL C64 to C68) were grouped into two groups, the MUGs and the LUGs.
In each case, the molecular species were annotated by their sum:composition (total fatty acyl carbons:total fatty acyl double bonds). The molecular species identifications and relative quantifications were performed using the LipidView and PeakView software packages (AB Sciex). The molecular species identified by the LipidView software were verified with PeakView software using a manual fragmentation analysis. The precursor ions and neutral loss scan parameters listed in Table 4 were used in the PeakView software analyses.
TABLE 4.
Parameters for identification of molecular species of phospholipids by PeakView software
| Parameters | Fragment ion | Polarity |
|---|---|---|
| Precursor ion (m/z) | ||
| PC head | 184.1 | Positive |
| PE head | 196.1 | Positive |
| PA head | 153.1 | Negative |
| PG head | 153.1 | Negative |
| PS head | 153.1 | Negative |
| CL building block head | 153.1 | Negative |
| PI head | 241.1 | Negative |
| PI head | 259.2 | Negative |
| FA 12:0 | 199.2 | Negative |
| FA 14:0 | 227.2 | Negative |
| FA 16:0 | 255.2 | Negative |
| FA 16:1 | 253.2 | Negative |
| FA 18:0 | 283.3 | Negative |
| FA 18:1 | 281.3 | Negative |
| Neutral loss (m/z) | ||
| PE | 141.1 | Positive |
| PI | 227.2 | Negative |
| PG | 189.1 | Negative |
| PS | 185.1 | Negative |
| Serine-H2O | 87.1 | Negative |
In the MS/MSALL technique, a TOF-MS experiment (to scan from m/z 200–1200) was followed by product ion analyses (1,000 individual MS/MS experiments), as reported by Simons et al. (39) and Huang et al. (40). The parameters for the TOF-MS experiment include ion source gas 1 (GS1) at 15 psi, ion source gas 2 (GS2) at 20 psi, curtain gas (CUR) at 25 psi, an ESI source temperature of 200 °C, ion spray voltage at +5100 (positive) or −4500 (negative) V, and an accumulation time of 3000 ms. A declustering potential of ±80 V and a collision energy of ±10 eV were used for the positive and negative ion mode experiments, respectively. The parameters for the product ion experiments include similar source/gas values as for the TOF-MS experiment and an accumulation time of 300 ms. A declustering potential of ±80 V and a collision energy of ±50 eV were used for the positive and negative ion mode experiments, respectively. The other parameters include a collision energy spread of 30, an ion release delay of 30, and an ion release width of 15. The TripleTOFTM 5600 system was calibrated using mode-specific calibration solutions (AB Sciex). A wash step was included between each sample to remove any carryover.
RNA Preparation and Real-time Quantitative PCR Analysis
An equal amount of yeast cells (A600 = 25) from the stationary phase was collected and stored in RNAlater at −20 °C. An RNA isolation kit (NucleoSpin® RNA II kit, Macherey-Nagel) was used to isolate the total RNA, and the quality and the quantity of the RNA were checked by a NanoDrop spectrophotometer. A high capacity cDNA reverse transcription kit (Applied Biosystems) was used to prepare the complementary DNAs (cDNAs). The cDNAs were synthesized from 1 μg of RNA according to the manufacturer's protocol. The primers used in this experiment (listed in Table 2) were designed with the help of the Primer Express® software 3.0 (Applied Biosystems). The cDNAs were diluted at 1:25, and 1 μl of the diluted cDNA was used for the real-time quantitative PCR analysis. The real-time PCR assays were conducted in triplicate on an ABI PRISM 7700 sequence detection system (Applied Biosystems) using the cDNAs, gene-specific primers, and 1× Power SYBR® Green PCR master mix (Applied Biosystems). Gene expression was normalized using actin (ACT1) as an endogenous control. The real-time quantitative PCR data are represented as the fold change of the control value, which was set to 1.
β-Galactosidase Assay
The YEp357 vector and pRP6 (YEp357-DDL1) construct were transformed into the WT, aft1Δ, and aft2Δ strains. To assess the β-galactosidase activity of DDL1-lacZ on the WT, aft1Δ and aft2Δ backgrounds, the transformants were grown in SM medium designed to maintain selection of the plasmid. Cells from the different transformants were collected and washed with water. The cell-free extracts were prepared, and the β-galactosidase activity was measured using a standard protocol (41). The β-galactosidase activity under the control of the DDL1 promoter in the aft1Δ and aft2Δ strains was represented as a percentage of the activity in the WT strain, which was set at 100%.
ChIP Assay
ChIP assays were performed using a Dynabeads co-immunoprecipitation kit (Invitrogen) with some adaptations taken from van Attikum et al. (42). Briefly, the transformants (BG1805-AFT1/2) overexpressing Aft1/2 proteins were collected from the late log phase in 50-ml culture tubes, and cells were fixed with formaldehyde at a 1% final concentration for 15 min. An excess amount of formaldehyde was quenched with 2.5 m glycine. Cells were washed with 1× PBS, pH 7.4, and pellets were stored at −80 °C until use. ChIP-grade monoclonal anti-HA (H3663, lot 025M4772V) and anti-RFP (SAB2702214, lot 41232) antibodies from Sigma-Aldrich were used in the assays. The anti-HA antibody coating on the Dynabeads was done according to the manufacturer's recommendation. Similarly, for the control assay, Dynabeads with the anti-RFP antibody were also processed and antibody-coated beads were kept at 4 °C until use. The following steps were performed at 4 °C. Cell extracts were prepared in the extraction buffer by vortexing in the presence of glass beads, protease inhibitor mixture (P8215), and PMSF from Sigma-Aldrich, and cell extracts were collected. A Sonics Vibra-Cell sonicator was used to obtain chromatin fragments of 300 to 700 bp. For the sonication, we used 15 cycles of 3 s “on” and 30 s “off” at 30% amplitude followed by 5 cycles of 10 s on and 60 s off at 20% amplitude. To prevent reverse cross-linking, the cell extracts were kept in ice during the sonication. For the recovery of the sonicated chromatin, a hole was made with a needle in the tube containing the sonicated samples. The sonicated samples were recovered by centrifugation at 2000 rpm for 5 min at 4 °C. The samples were transferred to the new tubes and centrifuged at 13,000 rpm for 15 min at 4 °C. In each case, the supernatant was transferred to the new tube and centrifuged again at 13,000 rpm for 15 min at 4 °C. In each case, the supernatant was collected, and about one-tenth of the total chromatin was kept at −20 °C for input; the rest of the chromatin was divided into two parts, one as immunoprecipitated (IP) and other as control immunoprecipitated (CIP). The IP and CIP samples were incubated for 45 min at 4 °C with the Dynabeads coated with anti-HA and anti-RFP antibodies, respectively. After incubation, the Dynabeads were washed with extraction and wash buffers. DNA recovery from input, IP, and CIP was done using a PCR cleanup kit (Sigma-Aldrich). PCR-based data analysis was performed, and the PCR product band intensities were quantified by densitometric analysis using the GeneTools software. The obtained results were represented as reported earlier (43). Final concentrations of 1% (input) and 4% (IP and CIP) were used as a template for the PCR reaction. Primers used in the ChIP assays are listed in Table 2.
Electrophoretic Mobility Shift Assay
To identify the regulatory relationship between Aft1/2 transcription factors and the DDL1 gene, EMSAs were performed for the DDL1 promoter using an EMSA kit (Molecular Probes) with slight modifications. The EMSA binding buffer consisted of 4 mm Tris, pH 7.5, 12 mm HEPES, pH 7.5, 75 mm KCl, 5 mm MgCl2, 1 mm DTT, 100 μm ZnCl2, 0.1 mg/ml poly(dI-dC), 0.1 mg/ml BSA, and 7.5% glycerol. The DDL1 promoter (1 kb) was amplified using the primers listed in Table 2. Bacterially expressed and purified Aft1/2 proteins were used for this study. A protein-dependent EMSA was performed with an increasing amount of the purified Aft1/2 proteins (200 ng to 1 μg) in the presence of 200 ng of the DDL1 promoter DNA at 30 °C for 1 h. In each assay, one reaction was performed in the presence of an anti-His6 monoclonal Ab. The EMSA was also performed with the purified Aft1/2 proteins (1 μg) in the presence of 200 ng of the DDL1 promoter DNA (1 kb) and Ab or Fe2+. Fe2+ was used to inhibit the Aft1/2 binding (36). After the DNA-protein complex formed at 30 °C, the samples were resolved on a 6% nondenaturing polyacrylamide gel in 0.5× TBE buffer (Tris borate-EDTA) at 4 °C in a cold room. The gel was stained with SYBR® Green EMSA nucleic acid stain, and the images were documented with a UV transilluminator at 300 nm.
Confocal Microscopic Study
The stationary-phase cells grown in SM medium were collected to assess the mitochondrial morphology. The cells from different genetic backgrounds were collected, washed, and stained with the mitochondrial dye MitoTracker Orange CMTMRos at 100 nm in 10 mm HEPES buffer containing 5% glucose, pH 7.4. The images were captured with a confocal microscope. In each case, the microscope slides were coated with a very thin film of agarose. A Zeiss LSM 700 confocal laser-scanning microscope was used to image the cells.
Measurement of Mitochondrial Membrane Potential
To measure the mitochondrial membrane potential, the potentiometric dye JC-1 (Sigma-Aldrich) was used as described previously (44). The JC-1 dye is accumulated as red fluorescent J-aggregates in the functional mitochondria in a potential-dependent manner. To assess the mitochondrial membrane potential, cells of different genetic backgrounds were collected from the stationary phase and washed with SM medium. Equal amounts of the washed cells were resuspended in SM medium with JC-1 stain (5 μg/ml) and incubated for 30 min at 30 °C in the dark. After incubation, the cells were pelleted, washed with SM medium, and resuspended in this medium. Finally, an equal volume of cells suspended in the medium was transferred to a 96-well plate to measure their fluorescence. A Thermo Scientific Varioskan Flash multimode fluorescence plate reader was used to measure red (550/600) and green (485/535) fluorescence. The ratio of Fred to Fgreen was used to determine the relative mitochondrial membrane potential. Cells with healthy and functional mitochondria showed a higher red to green fluorescence ratio, whereas a decrease in the red/green fluorescence ratio indicated the presence of dysfunctional mitochondria. The mitochondrial membrane potential was represented as a percentage of the control value, which was set to 100%.
Measurement of Oxygen Consumption
Cells of different genetic backgrounds were collected from the stationary phase and washed with the SM medium. A closed chamber equipped with a Clark-type oxygen electrode (Strathkelvin Instruments, model 782) was used to measure the oxygen consumption rate of the whole yeast cells at 30 °C for 5 min with constant agitation. An equal amount of cells was used to measure the rate of oxygen consumption, represented as a percentage of the control value, which was set at 100%.
Statistical Analysis
The experimental data are shown as the mean ± S.E., and data were analyzed using Student's t test. Each experiment was repeated at least three times, and at least 200 cells were scored in each strain per experiment to quantify the microscopic data. Significance was determined at *, p < 0.05; and **, p < 0.01.
Author Contributions
R. R. conceived and initiated the project. R. R. and P. K. Y. designed the experiments. P. K. Y. executed the experiments and analyzed the data. P. K. Y. and R. R. discussed the data and wrote the paper.
Acknowledgments
We are grateful to Prof. Vasanthi Nachiappan, Department of Biochemistry, Bharathidasan University, India for providing pUG34 vector. We also are grateful to the Department of Biochemistry, Indian Institute of Science, Bangalore, for help with the radioactive study.
This study was supported by the Council of Scientific and Industrial Research (CSIR), New Delhi, India under the 12th 5-year plan project (LIPIC). The authors declare that they have no conflicts of interest with the contents of this article.
- PA
- phosphatidic acid
- iPLA1
- intracellular phospholipase A1
- HSP
- hereditary spastic paraplegia
- PE
- phosphatidylethanolamine
- CL
- cardiolipin
- PG
- phosphatidylglycerol
- PC
- phosphatidylcholine
- NTA
- nitrilotriacetic acid
- MUG
- more unsaturated group
- LUG
- less unsaturated group
- PI
- phosphatidylinositol
- PS
- phosphatidylserine
- SM medium
- synthetic minimal medium
- MLCL
- monolysocardiolipin
- YPD
- yeast extract-peptone-dextrose
- Bistris propane
- 1,3-bis[tris(hydroxymethyl)methylamino]propane
- IP
- immunoprecipitated
- CIP
- control immunoprecipitated.
References
- 1. Lev S. (2004) The role of the Nir/rdgB protein family in membrane trafficking and cytoskeleton remodeling. Exp. Cell Res. 297, 1–10 [DOI] [PubMed] [Google Scholar]
- 2. Tani K., Kogure T., and Inoue H. (2012) The intracellular phospholipase A1 protein family. Biomol. Concepts 3, 471–478 [DOI] [PubMed] [Google Scholar]
- 3. Higgs H. N., and Glomset J. A. (1994) Identification of a phosphatidic acid-preferring phospholipase A1 from bovine brain and testis. Proc. Natl. Acad. Sci. U.S.A. 91, 9574–9578 [DOI] [PMC free article] [PubMed] [Google Scholar]
- 4. Inoue H., Baba T., Sato S., Ohtsuki R., Takemori A., Watanabe T., Tagaya M., and Tani K. (2012) Roles of SAM and DDHD domains in mammalian intracellular phospholipase A1 KIAA0725p. Biochim. Biophys. Acta 1823, 930–939 [DOI] [PubMed] [Google Scholar]
- 5. Inloes J. M., Hsu K. L., Dix M. M., Viader A., Masuda K., Takei T., Wood M. R., and Cravatt B. F. (2014) The hereditary spastic paraplegia-related enzyme DDHD2 is a principal brain triglyceride lipase. Proc. Natl. Acad. Sci. U.S.A. 111, 14924–14929 [DOI] [PMC free article] [PubMed] [Google Scholar]
- 6. Tesson C., Nawara M., Salih M. A., Rossignol R., Zaki M. S., Al Balwi M., Schule R., Mignot C., Obre E., Bouhouche A., Santorelli F. M., Durand C. M., Oteyza A. C., El-Hachimi K. H., Al Drees A., et al. (2012) Alteration of fatty-acid-metabolizing enzymes affects mitochondrial form and function in hereditary spastic paraplegia. Am. J. Hum. Genet. 91, 1051–1064 [DOI] [PMC free article] [PubMed] [Google Scholar]
- 7. Gonzalez M., Nampoothiri S., Kornblum C., Oteyza A. C., Walter J., Konidari I., Hulme W., Speziani F., Schöls L., Züchner S., and Schüle R. (2013) Mutations in phospholipase DDHD2 cause autosomal recessive hereditary spastic paraplegia (SPG54). Eur. J. Hum. Genet. 21, 1214–1218 [DOI] [PMC free article] [PubMed] [Google Scholar]
- 8. Blackstone C. (2012) Cellular pathways of hereditary spastic paraplegia. Annu. Rev. Neurosci. 35, 25–47 [DOI] [PMC free article] [PubMed] [Google Scholar]
- 9. Dimmer K. S., and Scorrano L. (2006) (De)constructing mitochondria: what for? Physiology 21, 233–241 [DOI] [PubMed] [Google Scholar]
- 10. Schuiki I., and Daum G. (2009) Phosphatidylserine decarboxylases, key enzymes of lipid metabolism. IUBMB Life 61, 151–162 [DOI] [PubMed] [Google Scholar]
- 11. Claypool S. M., and Koehler C. M. (2012) The complexity of cardiolipin in health and disease. Trends Biochem. Sci. 37, 32–41 [DOI] [PMC free article] [PubMed] [Google Scholar]
- 12. Joshi A. S., Thompson M. N., Fei N., Hüttemann M., and Greenberg M. L. (2012) Cardiolipin and mitochondrial phosphatidylethanolamine have overlapping functions in mitochondrial fusion in Saccharomyces cerevisiae. J. Biol. Chem. 287, 17589–17597 [DOI] [PMC free article] [PubMed] [Google Scholar]
- 13. Jiang F., Ryan M. T., Schlame M., Zhao M., Gu Z., Klingenberg M., Pfanner N., and Greenberg M. L. (2000) Absence of cardiolipin in the crd1 null mutant results in decreased mitochondrial membrane potential and reduced mitochondrial function. J. Biol. Chem. 275, 22387–22394 [DOI] [PubMed] [Google Scholar]
- 14. Gohil V. M., Thompson M. N., and Greenberg M. L. (2005) Synthetic lethal interaction of the mitochondrial phosphatidylethanolamine and cardiolipin biosynthetic pathways in Saccharomyces cerevisiae. J. Biol. Chem. 280, 35410–35416 [DOI] [PubMed] [Google Scholar]
- 15. Vreken P., Valianpour F., Nijtmans L. G., Grivell L. A., Plecko B., Wanders R. J., and Barth P. G. (2000) Defective remodeling of cardiolipin and phosphatidylglycerol in Barth syndrome. Biochem. Biophys. Res. Commun. 279, 378–382 [DOI] [PubMed] [Google Scholar]
- 16. Schlame M., Kelley R. I., Feigenbaum A., Towbin J. A., Heerdt P. M., Schieble T., Wanders R. J., DiMauro S., and Blanck T. J. (2003) Phospholipid abnormalities in children with Barth syndrome. J. Am. Coll. Cardiol. 42, 1994–1999 [DOI] [PubMed] [Google Scholar]
- 17. Beranek A., Rechberger G., Knauer H., Wolinski H., Kohlwein S. D., and Leber R. (2009) Identification of a cardiolipin-specific phospholipase encoded by the gene CLD1 (YGR110W) in yeast. J. Biol. Chem. 284, 11572–11578 [DOI] [PMC free article] [PubMed] [Google Scholar]
- 18. Ye C., Lou W., Li Y., Chatzispyrou I. A., Hüttemann M., Lee I., Houtkooper R. H., Vaz F. M., Chen S., and Greenberg M. L. (2014) Deletion of the cardiolipin-specific phospholipase Cld1 rescues growth and life span defects in the tafazzin mutant: implications for Barth syndrome. J. Biol. Chem. 289, 3114–3125 [DOI] [PMC free article] [PubMed] [Google Scholar]
- 19. Nie J., Hao X., Chen D., Han X., Chang Z., and Shi Y. (2010) A novel function of the human CLS1 in phosphatidylglycerol synthesis and remodeling. Biochim. Biophys. Acta 1801, 438–445 [DOI] [PMC free article] [PubMed] [Google Scholar]
- 20. Reinders J., Zahedi R. P., Pfanner N., Meisinger C., and Sickmann A. (2006) Toward the complete yeast mitochondrial proteome: multidimensional separation techniques for mitochondrial proteomics. J. Proteome Res. 5, 1543–1554 [DOI] [PubMed] [Google Scholar]
- 21. Gu Z., Valianpour F., Chen S., Vaz F. M., Hakkaart G. A., Wanders R. J., and Greenberg M. L. (2004) Aberrant cardiolipin metabolism in the yeast taz1 mutant: a model for Barth syndrome. Mol. Microbiol. 51, 149–158 [DOI] [PubMed] [Google Scholar]
- 22. Schneiter R., Brügger B., Sandhoff R., Zellnig G., Leber A., Lampl M., Athenstaedt K., Hrastnik C., Eder S., Daum G., Paltauf F., Wieland F. T., and Kohlwein S. D. (1999) Electrospray ionization tandem mass spectrometry (ESI-MS/MS) analysis of the lipid molecular species composition of yeast subcellular membranes reveals acyl chain-based sorting/remodeling of distinct molecular species en route to the plasma membrane. J. Cell Biol. 146, 741–754 [DOI] [PMC free article] [PubMed] [Google Scholar]
- 23. Berthelet S., Usher J., Shulist K., Hamza A., Maltez N., Johnston A., Fong Y., Harris L. J., and Baetz K. (2010) Functional genomics analysis of the Saccharomyces cerevisiae iron-responsive transcription factor Aft1 reveals iron-independent functions. Genetics 185, 1111–1128 [DOI] [PMC free article] [PubMed] [Google Scholar]
- 24. Rutherford J. C., Jaron S., and Winge D. R. (2003) Aft1p and Aft2p mediate iron-responsive gene expression in yeast through related promoter elements. J. Biol. Chem. 278, 27636–27643 [DOI] [PubMed] [Google Scholar]
- 25. Pokorná L., C̆ermáková P., Horváth A., Baile M. G., Claypool S. M., Griač P., Malínský J., and Balážová M. (2016) Specific degradation of phosphatidylglycerol is necessary for proper mitochondrial morphology and function. Biochim. Biophys. Acta 1857, 34–45 [DOI] [PMC free article] [PubMed] [Google Scholar]
- 26. Chicco A. J., and Sparagna G. C. (2007) Role of cardiolipin alterations in mitochondrial dysfunction and disease. Am. J. Physiol. Cell Physiol. 292, C33–C44 [DOI] [PubMed] [Google Scholar]
- 27. Riekhof W. R., Wu J., Jones J. L., and Voelker D. R. (2007) Identification and characterization of the major lysophosphatidylethanolamine acyltransferase in Saccharomyces cerevisiae. J. Biol. Chem. 282, 28344–28352 [DOI] [PubMed] [Google Scholar]
- 28. Tamaki H., Shimada A., Ito Y., Ohya M., Takase J., Miyashita M., Miyagawa H., Nozaki H., Nakayama R., and Kumagai H. (2007) LPT1 encodes a membrane-bound O-acyltransferase involved in the acylation of lysophospholipids in the yeast Saccharomyces cerevisiae. J. Biol. Chem. 282, 34288–34298 [DOI] [PubMed] [Google Scholar]
- 29. Nakajima K., Sonoda H., Mizoguchi T., Aoki J., Arai H., Nagahama M., Tagaya M., and Tani K. (2002) A novel phospholipase A1 with sequence homology to a mammalian Sec23p-interacting protein, p125. J. Biol. Chem. 277, 11329–11335 [DOI] [PubMed] [Google Scholar]
- 30. Yamashita A., Kumazawa T., Koga H., Suzuki N., Oka S., and Sugiura T. (2010) Generation of lysophosphatidylinositol by DDHD domain containing 1 (DDHD1): possible involvement of phospholipase D/phosphatidic acid in the activation of DDHD1. Biochim. Biophys. Acta 1801, 711–720 [DOI] [PubMed] [Google Scholar]
- 31. Rothstein R. (1991) Targeting, disruption, replacement, and allele rescue: integrative DNA transformation in yeast. Methods Enzymol. 194, 281–301 [DOI] [PubMed] [Google Scholar]
- 32. Bligh E. G., and Dyer W. J. (1959) A rapid method of total lipid extraction and purification. Can. J. Biochem. Physiol. 37, 911–917 [DOI] [PubMed] [Google Scholar]
- 33. Tamura Y., Onguka O., Hobbs A. E., Jensen R. E., Iijima M., Claypool S. M., and Sesaki H. (2012) Role for two conserved intermembrane space proteins, Ups1p and Ups2p, in intra-mitochondrial phospholipid trafficking. J. Biol. Chem. 287, 15205–15218 [DOI] [PMC free article] [PubMed] [Google Scholar]
- 34. Gelperin D. M., White M. A., Wilkinson M. L., Kon Y., Kung L. A., Wise K. J., Lopez-Hoyo N., Jiang L., Piccirillo S., Yu H., Gerstein M., Dumont M. E., Phizicky E. M., Snyder M., and Grayhack E. J. (2005) Biochemical and genetic analysis of the yeast proteome with a movable ORF collection. Genes Dev. 19, 2816–2826 [DOI] [PMC free article] [PubMed] [Google Scholar]
- 35. Oganesyan N., Ankoudinova I., Kim S. H., and Kim R. (2007) Effect of osmotic stress and heat shock in recombinant protein overexpression and crystallization. Protein Expr. Purif. 52, 280–285 [DOI] [PMC free article] [PubMed] [Google Scholar]
- 36. Poor C. B., Wegner S. V., Li H., Dlouhy A. C., Schuermann J. P., Sanishvili R., Hinshaw J. R., Riggs-Gelasco P. J., Outten C. E., and He C. (2014) Molecular mechanism and structure of the Saccharomyces cerevisiae iron regulator Aft2. Proc. Natl. Acad. Sci. U.S.A. 111, 4043–4048 [DOI] [PMC free article] [PubMed] [Google Scholar]
- 37. Vijayakumar A., Vijayaraj P., Vijayakumar A. K., and Rajasekharan R. (2016) The Arabidopsis ABHD11 mutant accumulates polar lipids in leaves as a consequence of absent acylhydrolase activity. Plant Physiol. 170, 180–193 [DOI] [PMC free article] [PubMed] [Google Scholar]
- 38. Yadav K. K., Singh N., and Rajasekharan R. (2015) PHO4 transcription factor regulates triacylglycerol metabolism under low-phosphate conditions in Saccharomyces cerevisiae. Mol. Microbiol. 98, 456–472 [DOI] [PubMed] [Google Scholar]
- 39. Simons B., Kauhanen D., Sylvänne T., Tarasov K., Duchoslav E., and Ekroos K. (2012) Shotgun lipidomics by sequential precursor ion fragmentation on a hybrid quadrupole time-of-flight mass spectrometer. Metabolites 2, 195–213 [DOI] [PMC free article] [PubMed] [Google Scholar]
- 40. Huang H., Taraboletti A., and Shriver L. P. (2015) Dimethyl fumarate modulates antioxidant and lipid metabolism in oligodendrocytes. Redox Biol. 5, 169–175 [DOI] [PMC free article] [PubMed] [Google Scholar]
- 41. Rose M., and Botstein D. (1983) Construction and use of gene fusions to lacZ (β-galactosidase) that are expressed in yeast. Methods Enzymol. 101, 167–180 [DOI] [PubMed] [Google Scholar]
- 42. van Attikum H., Fritsch O., Hohn B., and Gasser S. M. (2004) Recruitment of the INO80 complex by H2A phosphorylation links ATP-dependent chromatin remodeling with DNA double-strand break repair. Cell 119, 777–788 [DOI] [PubMed] [Google Scholar]
- 43. Laha S., Das S. P., Hajra S., Sanyal K., and Sinha P. (2011) Functional characterization of the Saccharomyces cerevisiae protein Chl1 reveals the role of sister chromatid cohesion in the maintenance of spindle length during S-phase arrest. BMC Genet. 12, 83. [DOI] [PMC free article] [PubMed] [Google Scholar]
- 44. Lewandowska A., Gierszewska M., Marszalek J., and Liberek K. (2006) Hsp78 chaperone functions in restoration of mitochondrial network following heat stress. Biochim. Biophys. Acta 1763, 141–151 [DOI] [PubMed] [Google Scholar]