

Abstract
Background
Sleep deprivation has been associated with obesity among adults, and accumulating data suggests that stearoyl-CoA desaturase 1 (SCD1) expression has a relevant impact on fatty acid (FA) composition of lipid pools and obesity. The aim of this study was to investigate the effect of one-night total sleep deprivation (TSD) on DNA methylation in the 5’-prime region of SCD1, and whether detected changes in DNA methylation are associated with SCD activity indices (product to precursor FA ratios; 16:1n-7/16:0 and 18:1n-9/18:0) derived from serum phospholipids (PL).
Methods
Sixteen young, normal-weight, healthy men completed two study sessions, one with one-night TSD and one with one-night normal sleep (NS). Sleep quality and length was assessed by polysomnography, and consisted of electroencephalography, electrooculography, and electromyography. Fasting whole blood samples were collected on the subsequent morning for analysis of DNA methylation and FAs in serum PL. Linear regression analyses were performed to assess the association between changes in DNA methylation and SCD activity indices.
Results
Three CpG sites close to the transcription start site (TSS) of SCD1 (cg00954566, cg24503796, cg14089512) were significantly differentially methylated in dependency of sleep duration (−log10P-value > 1.3). Both SCD-16 and SCD-18 activity indices were significantly elevated (P < 0.05) following one-night TSD, and significantly associated with DNA methylation changes of the three mentioned probes in the 5’ region of SCD1.
Conclusion
Our results suggest a relevant link between TSD, hepatic SCD1 expression and de-novo fatty acid synthesis via epigenetically driven regulatory mechanisms.
Keywords: DNA methylation, Fatty acid composition, Monounsaturated fatty acids, Sleep condition, Stearoyl-CoA desaturase
Background
Sleep deprivation has been associated with higher risk of weight gain and development of obesity among children and adults [1–3], which may provoke a higher susceptibility to chronic illnesses, such as diabetes [4, 5], and cardiovascular diseases [6, 7]. Human studies have demonstrated that sleep deprivation alters the central nervous system driven control of both hunger and appetite, provoking excessive food intake [8–10]. However, the knowledge of the complex and multifactorial mechanisms between sleep duration and increased risk of weight gain and obesity is still limited.
A recently published study has demonstrated that rhythmic expression patterns of clock and selected clock-controlled genes in human blood cells are in part determined by exogenous factors, such as sleep and fasting state, and in part by the endogenous circadian timing system [11]. Furthermore, new results indicate that acute sleep loss alters the epigenetic and transcriptional profile of core circadian clock genes in key metabolic tissues [12], and that longer habitual sleep duration could ameliorate genetic predisposition to obesity via a favorable dietary profile [13].
The enzyme stearoyl-CoA desaturase (SCD), which is predominantly expressed in the liver, plays a central role in the desaturation of saturated fatty acids (FAs), thus having important implications in the metabolism of FAs and development of obesity. SCD catalyzes the biosynthesis of the monounsaturated FAs palmitoleate (16:1n-7) and oleate (18:1n-9) from the saturated FAs palmitate (16:0) and stearate (18:0), respectively [14]. In sated state the FAs of phospholipids (PL) and triglycerides (TG) in healthy liver originate from nonesterified FAs, dietary FAs incorporated in chylomicrons and FAs synthesized by hepatic de novo lipogenesis from dietary carbohydrates [15–17]. The de-novo FA synthesis in liver is well reflected by SCD activity indices estimated as ratios of 16:1n-7/16:0 and 18:1n-9/18:0 in blood TG as well as in PL [18–21]. Over the last decade there has been much interest in estimating the SCD activity as a putative biomarker for body fat regulation and development of obesity.
Studies have shown that there is a very tight and complex regulation of SCD1 gene expression in response to various parameters including hormonal and nutrient factors [22, 23]. Furthermore, elevated expression levels of the human SCD1 gene are found to correlate both with the SCD enzyme activity [24], and obesity [25].
Recently, it has been demonstrated in healthy subjects, who have been also included in the current study that one-night of total sleep deprivation (TSD) alters clock gene regulation, concomitant with deleterious metabolic effects, which are differential across key peripheral metabolic tissues in healthy humans [12]. Hitherto, no study has addressed the effect of sleep deprivation on cytosine DNA methylation of SCD1 that might have implications for SCD activity, endogenous lipid biosynthesis and development of obesity. Therefore, we assessed DNA methylation of selected CpG sites within the SCD1 promoter and studied the associations with SCD activity indices derived from serum PL following both one-night normal sleep (NS) and one-night TSD in young healthy men.
Methods
Study cohort and design
This study was based on prospectively collected data from a randomized crossover within-subject trial designed to examine the effects of one-night TSD on gene expression and DNA methylation of core circadian clock genes in peripheral tissues. The study was registered with ClinicalTrials.gov, number NCT01730742. Details of the study design have been published previously [12]. Sixteen young (age: 23.3 ± 3.4 (mean ± S.D.) years), normal-weight (BMI: 23.64 ± 2.35 kg/m2), and healthy men participated in two sessions of this study. In brief, on day 1 the participants were provided standardized meals including breakfast, lunch, snack, and dinner. The next night nocturnal sleep was either permitted from 22:30 h (lights off) to 06:30 h (lights on; one-night NS) or the participants remained exposed to light under constant supervision from 22:30 h to 06:30 h, remaining bed-restricted and fasted, i.e. one-night TSD. All participants were engaged in both conditions using a within-subject, randomized crossover design, where each condition was separated by 4 weeks. Written, informed consent was obtained from all participants and the regional ethical committee in Uppsala, Sweden approved the study. Sleep quality and length was assessed by polysomnography (Embla A10, Flaga hf, Reykjavik, Iceland), and consisted of electroencephalography, electrooculography, and electromyography. Blood samples were collected in EDTA tubes in the evening (19:30 h) of day 1, and in the morning after the intervention and before a standardized breakfast (07:30 h) of day 2. Fasting whole blood samples for DNA methylation analysis were immediately frozen in a 50/50 mixture of ethanol and dry ice before deposited in −80 °C. Serum samples were separated from fasting whole blood and stored in −80 °C before FA analysis.
Sample preparation and methylation analyses
Genomic DNA was extracted by robot assisted phenol/chloroform extraction at the Latvian Biomedical Research and Study Centre in Riga, Latvia. Bisulfite conversion of DNA and hybridization to the Illumina 450 K methylation Bead Chip (Illumina, San Diego, USA) was performed at the Science for Life Laboratory (SciLifeLab Uppsala, Sweden). Beta values representing the methylation status (0–100 %) of SCD1, localized on chromosome 10, were generated by GenomeStudio (Illumina, San Diego, USA).
Determination of SCD-16 and SCD-18 activity
The total serum lipid fraction was extracted with chloroform-methanol (2:1, v ⁄v), using a well-established method [26]. PL were separated on a TLC plate using the solvent system petroleum ether⁄diethyl ether ⁄acetic acid (80:20:1, v⁄v⁄v). The PL FAs were methylated with 14 % boron trifluoride in methanol, and the FA methyl esters analyzed by a HP Series II 5890, series A Gas Chromatograph (Hewlett Packard Co⁄Agilent, Palo Alto, CA, USA). The FA methyl esters were identified and calibrated against commercial standards (Sigma Chemical Co.; Nu-Check-Prep, Elysian, MN, USA). The results were expressed as percentage (%) of total FAs in serum PL. Activity indices of SCD-16 and SCD-18 were determined calculating the ratios of 16:1n-7/16:0 and 18:1n-9/18:0, respectively, derived from serum PL.
Statistical analysis
Statistical analyses of methylation data were performed with the software package R (version 3.1). Probes having the transcription start site (TSS) of SCD1 as closest TSS were extracted from the chip. Both upstream and downstream probes were included. Information about the exact distance to the TSS was extracted according to Price et al. [27]. A total of 19 SCD probes associated to SCD1 were identified and used in the analysis. Pairwise t-tests were performed to detect differences in DNA methylation between one-night NS and one-night TSD. Subsequently, we performed linear regression analyses regressing TSD induced changes in probe methylation against changes in the activity indices of SCD-16 (16:1n-7/16:0) and SCD-18 (18:ln-9/18:0) derived from serum PL. In all analyses the ratio of neutrophils to leukocytes was taken into account in order to prevent shifting monocyte subpopulations affecting the data (i.e. the regulation of immune and inflammatory responses). Wilcoxon signed-rank test (SPSS software, version 21.0; IBM Corporation, Somers, N.Y., USA) was used to compare intraindividual differences in 16:1n-7/16:0 and 18:ln-9/18:0 ratios before and after the two different sleep conditions. A P-value < 0.05 was considered statistically significant.
Results
Effect of one-night TSD on cytosine DNA methylation
Methylation of three SCD1 probes (cg00954566, cg24503796, cg14089512) close to the TSS was significantly different between one-night NS and one-night TSD in unadjusted analyses (−log10P-value > 1.3; Fig. 1: Left). Other probes, although not significant, displayed a similar trend towards hypermethylation after one-night TSD as in one-night NS. This was especially observed for CpG sites within 2000 bp up- or downstream of the TSS. Here, 11 of 14 probes showed a hypermethylation between 0.1 and 1.8 % after one-night TSD as in one-night NS (Fig. 1: Right).
Fig. 1.
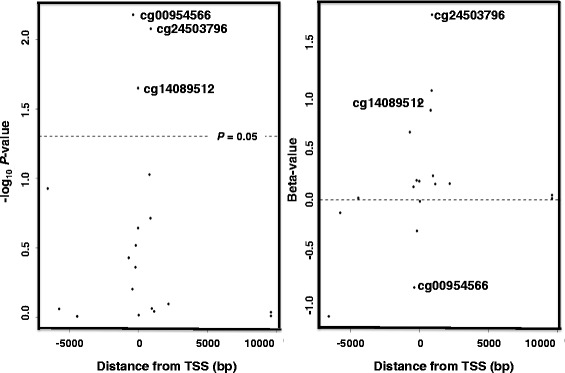
DNA methylation in relation to SCD1 position. Three of 19 SCD1 probes differ significantly in DNA methylation in dependency of sleep duration (one-night normal-sleep (NS) versus one-night total sleep deprivation (TSD); Left panel −log10 P-value). A similar trend towards hypermethylation was observed for probes close to the transcription start site (TSS) (Right panel Methylated beta-value)
Association between cytosine DNA methylation and SCD activity indices
CpG sites found to be significantly changed in their methylation pattern after TSD were subsequently investigated in linear regression analyses regressing change of methylation to SCD activity indices. The methylation of three CpG sites was associated with the activity indices of SCD-16, namely cg19191454 (positively associated, (P < 0.001), cg23508052 and cg11311579 (negatively associated, P = 0.01 and P = 0.05, respectively) (Table 1). Furthermore, the probe cg15022173 was negatively associated (P = 0.02), and cg07649988 positively associated (P = 0.05) with the activity indices of SCD-18.
Table 1.
Association between cytosine DNA methylation and SCD activity indices following one-night total sleep deprivation
| Probe ID | Position | Relative TSS (bp) | Mean sleep % (sd) | Mean wake % (sd) | Slope | P-value | Slope | P-value |
|---|---|---|---|---|---|---|---|---|
| Chr 10 | NM_005063 | SCD-16 | SCD-18 | |||||
| (16:1n-7/16:0) | (18:1n-9/18:0) | |||||||
| cg19191454 | 102106597 | −175 | 4.4 (0.9) | 4.2 (0.4) | 0.016 | <0.001 | 1.434 | 0.63 |
| cg23508052 | 102106812 | 40 | 2.9 (0.5) | 2.8 (0.5) | −0.003 | 0.01 | −0.892 | 0.80 |
| cg11311579 | 102106755 | −17 | 0.8 (0.2) | 1.0 (0.2) | −0.004 | 0.05 | −6.887 | 0.38 |
| cg01270221 | 102116383 | 9611 | 81.9 (1.3) | 81.8 (1.2) | −0.092 | 0.07 | −0.175 | 0.93 |
| cg06400428 | 102107667 | 895 | 11.1 (3.5) | 10.6 (3.6) | 0.015 | 0.10 | 0.590 | 0.48 |
| cg16744911 | 102108975 | 2203 | 82.0 (2.2) | 82.4 (1.8) | 0.025 | 0.19 | 0.213 | 0.87 |
| cg03440556 | 102107758 | 986 | 27.6 (6.2) | 26.6 (6.3) | 0.039 | 0.25 | −0.298 | 0.69 |
| cg12714759 | 102102352 | −4420 | 21.5 (3.9) | 21.4 (3.8) | 0.011 | 0.27 | 0.270 | 0.73 |
| cg02237755 | 102107926 | 1154 | 83.1 (3.3) | 83.1 (3.7) | 0.048 | 0.55 | −0.591 | 0.48 |
| cg15022173 | 102101047 | −5725 | 76.3 (2.2) | 76.9 (2.4) | −0.420 | 0.56 | −2.326 | 0.02 |
| cg00653847 | 102100213 | −6559 | 70.9 (4.1) | 71.6 (3.5) | −0.025 | 0.61 | −0.515 | 0.63 |
| cg24503796 | 102107677 | 905 | 13.8 (3.2) | 14.5 (2.9) | −0.018 | 0.65 | 0.766 | 0.53 |
| cg07649988 | 102106577 | −195 | 3.7 (0.7) | 3.6 (0.8) | −0.019 | 0.72 | 8.026 | 0.05 |
| cg14089512 | 102106758 | −14 | 9.6 (1.1) | 10.3 (1.2) | 0.048 | 0.75 | 0.180 | 0.92 |
| cg07230380 | 102106359 | −413 | 0.7 (0.6) | 0.9 (0.5) | 0.004 | 0.92 | 1.160 | 0.75 |
| cg18328965 | 102107585 | 813 | 11.0 (1.7) | 10.8 (1.8) | 0.221 | 0.93 | 1.902 | 0.14 |
| cg00699831 | 102116399 | 9627 | 87.1 (1.1) | 87.2 (1.3) | 0.236 | 0.95 | 2.899 | 0.08 |
| cg26351966 | 102106081 | −691 | 18.2 (2.9) | 18.7 (3.2) | 0.017 | 0.96 | 0.050 | 0.97 |
| cg00954566 | 102106406 | −366 | 4.4 (0.9) | 4.3 (0.9) | −0.002 | 0.97 | 0.474 | 0.90 |
The table shows selected SCD1 probes and SCD activity indices derived from serum phospholipids of young healthy men. Bold represents a statistically significant association at P < 0.05; software package R (version 3.1)
Fatty acid composition and SCD activity indices
There were no significant changes of the levels of the SCD precursor and product, 16:0 and 16:1n-7, and 18:0 and 18:1n-9, respectively, in fasting serum PL following one-night NS. However, there were significant changes of individual FA levels, that resulted in elevated (P < 0.05) SCD-16 and SCD-18 activity indices derived from fasting serum PL following one-night TSD (Table 2).
Table 2.
SCD activity indices before (day 1) and after (day 2) one-night normal-sleep (NS) or total sleep deprivation (TSD)
| NS (n = 12) | TSD (n = 14) | |||
|---|---|---|---|---|
| Day 1 | Day 2 | Day 1 | Day 2 | |
| Fatty acids (% of total FAs) | ||||
| 16:0 | 26.78 ± 0.44 | 26.80 ± 0.35 | 26.58 ± 0.37 | 27.00 ± 0.24a |
| 16:1n-7 | 0.41 ± 0.04 | 0.43 ± 0.04 | 0.37 ± 0.03 | 0.40 ± 0.02a |
| 18:0 | 12.78 ± 0.34 | 12.00 ± 0.51 | 12.55 ± 0.22 | 12.35 ± 0.16a |
| 18:1n-9 | 9.40 ± 0.33 | 9.54 ± 0.33 | 9.51 ± 0.25 | 9.74 ± 018a |
| Activity indices | ||||
| SCD16 | 0.0150 ± 0.0014 | 0.0159 ± 0.0014 | 0.0140 ± 0.0009 | 0.0147 ± 0.0009a |
| (16:1n-7/16:0) | ||||
| SCD18 | 0.7641 ± 0.0351 | 0.8088 ± 0.0367 | 0.7591 ± 0.0198 | 0.7904 ± 0.0170a |
| (18:1n-9/18:0) | ||||
The table shows the SCD activity indices derived from serum phospholipids of young healthy men
Data are expressed as mean ± SEM
a P < 0.05 compared with day 1, Wilcoxon signed-rank test
Discussion
We demonstrate, for the first time to our knowledge that one-night TSD is significantly associated with increased methylation in the 5’ prime region of the SCD1 gene. Importantly, we show that one-night TSD related methylation changes of SCD1 are significantly associated with changes in SCD-16 and SCD-18 activity indices derived from fasting serum PL followed by one-night TSD in young normal-weight healthy men, thus, describing a novel regulatory pathway by which TSD may influence homeostasis of body fat.
Recently it was demonstrated in the subjects of the present study, that a one-night TSD alters the epigenetic and transcriptional profile of core circadian clock genes in key metabolic tissues [12], thus demonstrating TSD systematic changes in methylation of functionally important gene networks. Increased DNA methylation has been, in many cases, associated with a suppressed gene expression [28]. We show that one night TSD is associated with increased methylation in the 5’ prime region of the SCD1, which is in line with a recent study showing that methylation shifts are able to suppress or enhance gene expression, suggesting two different mechanisms of DNA methylation-dependent gene regulation [29]. Our findings that SCD1 methylation differs between one-night NS and one-night TSD strongly support the hypothesis that TSD is connected to epigenetic shifts that might have impact on lipid metabolism [30].
It is known from several experimental studies that changes in the activity of SCD indices estimated from plasma or tissues are accompanied by simultaneous changes in the transcriptional level of the SCD1 [31, 32]. The regulation of SCD1 gene is of considerable physiological importance, as a high SCD activity has been implicated in a wide range of disorders including diabetes, atherosclerosis, cancer, and obesity [14, 33, 34]. Thus, our observation, that one-night TSD is associated with increased methylation of the SCD1, may allow the speculation that TSD has the ability to contribute to the mentioned metabolic diseases via changes in the methylation pattern of genes, such as SCD1.
Short sleep duration may increase obesity risk by causing small changes in eating patterns that cumulatively alter energy balance [35, 36]. Several studies have indicated associations between insufficient sleep and alterations in circulating hormones involved in feeding behavior, glucose metabolism, hunger, and appetite, which are probably involved in the development of metabolic disorders, such as obesity and diabetes [9, 10]. Recent study has shown that higher habitual sleep variability, but not habitual sleep duration, is significantly associated with abdominal obesity in adolescents, which can be partially explained by increased caloric intake, especially from carbohydrates [37]. The precise mechanism through which the brain regulates changes in hormone release with sleep deprivation is unknown, but one possibility is increased sympathetic nervous system activity [38].
Several studies have reported that diet affects the FA composition of serum PL [39–41]. Our observation indicates similar dietary habits and lifestyle factors such as cigarette smoking and alcohol consumption among the participants, since there was no significant difference found in FA levels of non-fasting serum PL between the two sleep conditions separated by 4 weeks (day 1). On the other hand, there is no general agreement which blood lipid fraction to use regarding the assessment of hepatic SCD activity indices. The majority of PL synthesis occurs in the endoplasmic reticulum of the liver, where PL associates with other lipids and proteins resulting in lipoproteins that are released into the bloodstream. Thus, we assume that in fasting blood the SCD-16 and SCD-18 activity indices derived from serum PL may mainly reflect hepatic SCD-1 activity. We observed significantly elevated SCD-16 and SCD-18 activity indices derived from fasting serum PL following one-night TSD and before a standardized breakfast. This strengthens the hypothesis that shortened sleep is an additional link to the dysregulation in energy metabolism that might impact on lipid metabolism and weight gain [30, 42].
This study is limited by its relatively small sample size of healthy individuals, which may preclude enough power to assess the interaction between SCD1 methylation and sleep deprivation. Another limitation of our study is that the methylation of SCD1 was measured only at a single time point, i.e., under fasting condition in the morning following each sleep intervention. Thus, conclusions about the causality have to be made carefully. However, our observations allow to suggesting a role of sleep duration and quality in regulating SCD1 expression and development of obesity.
Conclusions
Our study results indicate that one-night TSD modifies SCD1 methylation, FA levels of serum PL, and, thereby, changes in SCD-16 and SCD-18 activity indices. The exact mechanism how sleep restriction is implicated in SCD1 expression and development of obesity warrants further investigation.
Acknowledgements
This study was supported by the Swedish Research Council. We would like to thank Lara Bjorgvinsdottir for her assistance with fatty acid analysis.
Authors’ contributions
HBS and GVS designed the study. EKN was responsible for the DNA methylation analysis. GVS was responsible for the fatty acid analysis. EKN and GVS were responsible for the statistical analyses and interpretation of the data. GVS wrote the initial draft of the manuscript in cooperation with EKN. JM critically reviewed the manuscript. All authors contributed to the final version of the manuscript.
Competing interests
The authors declare that they have no competing interests.
Contributor Information
Gudrun Valgerdur Skuladottir, Phone: +354 525 4825, Email: gudrunvs@hi.is.
Emil Karl Nilsson, Email: emil.nilsson@neuro.uu.se.
Jessica Mwinyi, Email: jessica.mwinyi@neuro.uu.se.
Helgi Birgir Schiöth, Email: Helgi.Schioth@neuro.uu.se.
References
- 1.Taheri S. The link between short sleep duration and obesity: we should recommend more sleep to prevent obesity. Arch Dis Child. 2006;91:881–4. doi: 10.1136/adc.2005.093013. [DOI] [PMC free article] [PubMed] [Google Scholar]
- 2.Carter PJ, Taylor BJ, Williams SM, Taylor RW. Longitudinal analysis of sleep in relation to BMI and body fat in children: the FLAME study. Br Med J. 2011;342:d2712. doi: 10.1136/bmj.d2712. [DOI] [PMC free article] [PubMed] [Google Scholar]
- 3.Krueger PM, Reither EN, Peppard PE, Burger AE, Hale L. Cumulative exposure to short sleep and body mass outcomes: a prospective study. J Sleep Res. 2015;24:629–38. doi: 10.1111/jsr.12327. [DOI] [PMC free article] [PubMed] [Google Scholar]
- 4.Marshall NS, Glozier N, Grunstein RR. Is sleep duration related to obesity? A critical review of the epidemiological evidence. Sleep Med Rev. 2008;12:289–98. doi: 10.1016/j.smrv.2008.03.001. [DOI] [PubMed] [Google Scholar]
- 5.Guidolin M, Gradisar M. Is shortened sleep duration a risk factor for overweight and obesity during adolescence? A review of the empirical literature. Sleep Med. 2012;13:779–86. doi: 10.1016/j.sleep.2012.03.016. [DOI] [PubMed] [Google Scholar]
- 6.Mullington JM, Haack M, Toth M, Serrador J, Meier-Ewert H. Cardiovascular, inflammatory and metabolic consequences of sleep deprivation. Prog Cardiovasc Dis. 2009;51:294–302. doi: 10.1016/j.pcad.2008.10.003. [DOI] [PMC free article] [PubMed] [Google Scholar]
- 7.Moraes W, Poyares D, Zalcman I, de Mello MT, Bittencourt LR, Santos-Silva R, Tufik S. Association between body mass index and sleep duration assessed by objective methods in a representative sample of the adult population. Sleep Med. 2013;14:312–18. doi: 10.1016/j.sleep.2012.11.010. [DOI] [PubMed] [Google Scholar]
- 8.Hanlon EC, Cauter EV. Quantification of sleep behavior and of its impact on the cross-talk between the brain and peripheral metabolism. Proc Natl Acad Sci U S A. 2011;108(suppl 3):15609–16. doi: 10.1073/pnas.1101338108. [DOI] [PMC free article] [PubMed] [Google Scholar]
- 9.Cedernaes J, Schiöth HB, Benedict C. Determinants of shortened, disrupted, and mistimed sleep and associated metabolic health consequences in healthy humans. Diabetes. 2015;64:1073–80. doi: 10.2337/db14-1475. [DOI] [PubMed] [Google Scholar]
- 10.Schmid SM, Hallschmid M, Schultes B. The metabolic burden of sleep loss. Lancet Diabetes Endocrinol. 2015;3:52–62. doi: 10.1016/S2213-8587(14)70012-9. [DOI] [PubMed] [Google Scholar]
- 11.Möller-Levet CS, Archer SN, Bucca G, Laing EE, Slak A, Kabiljo R, Lo JCY, Santhi N, von Schantz M, Smith CP, Dijk D-J. Effects of insufficient sleep on circadian rhythmicity and expression amplitude of the human blood transcriptome. Proc Natl Acad Sci U S A. 2013;110:E1132–41. doi: 10.1073/pnas.1217154110. [DOI] [PMC free article] [PubMed] [Google Scholar]
- 12.Cedernaes J, Osler ME, Voisin S, Broman J-E, Vogel H, Dickson SL, Zierath JR, Schiöth HB, Benedict C. Acute sleep loss induces tissue-specific epigenetic and transcriptional alterations to circadian clock genes in men. J Clin Endocrinol Metab. 2015;100:E1255–61. doi: 10.1210/JC.2015-2284. [DOI] [PubMed] [Google Scholar]
- 13.Dashti HS, Follis JL, Smith CE, Tanaka T, Cade BE, Gottlieb DJ, Hruby A, Jacques PF, Lamon-Fava S, Richardson K, Saxena R, Scheer FA, Kovanen L, Bartz TM, Perälä MM, Jonsson A, Frazier-Wood AC, Kalafati IP, Mikkilä V, Partonen T, Lemaitre RN, Lahti J, Hernandez DG, Toft U, Johnson WC, Kanoni S, Raitakari OT, Perola M, Psaty BM, Ferrucci L, Grarup N, Highland HM, Rallidis L, Kähönen M, Havulinna AS, Siscovick DS, Räikkönen K, Jørgensen T, Rotter JI, Deloukas P, Viikari JS, Mozaffarian D, Linneberg A, Seppälä I, Hansen T, Salomaa V, Gharib SA, Eriksson JG, Bandinelli S, Pedersen O, Rich SS, Dedoussis G, Lehtimäki T, Ordovás JM. Habitual sleep duration is associated with BMI and macronutrient intake and may be modified by CLOCK genetic variants. Am J Clin Nutr. 2015;101:135–43. doi: 10.3945/ajcn.114.095026. [DOI] [PMC free article] [PubMed] [Google Scholar]
- 14.Ntambi JM. The regulation of stearoyl-CoA desaturase (SCD) Prog Lipid Res. 1995;34:139–50. doi: 10.1016/0163-7827(94)00010-J. [DOI] [PubMed] [Google Scholar]
- 15.Hudgins LC, Hellerstein M, Seidman C, Neese R, Diakun J, Hirsch J. Human fatty acid synthesis is stimulated by a eucaloric low fat, high carbohydrate diet. J Clin Invest. 1996;97:2081–91. doi: 10.1172/JCI118645. [DOI] [PMC free article] [PubMed] [Google Scholar]
- 16.Barrows BR, Parks EJ. Contributions of different fatty acid sources to very low-density lipoprotein-triacylglycerol in the fasted and fed states. J Clin Endocrinol Metab. 2006;91:1446–52. doi: 10.1210/jc.2005-1709. [DOI] [PubMed] [Google Scholar]
- 17.Vedala A, Wang W, Neese RA, Christiansen MP, Hellerstein MK. Delayed secretory pathway contributions to VLDL-triglycerides from plasma NEFA, diet, and de novo lipogenesis in humans. J Lipid Res. 2006;47:2562–74. doi: 10.1194/jlr.M600200-JLR200. [DOI] [PubMed] [Google Scholar]
- 18.Attie AD, Krauss RM, Gray-Keller MP, Brownlie A, Miyazaki M, Kastelein JJ, Lusis AJ, Stalenhoef AF, Stoehr JP, Hayden MR, Ntambi JM. Relationship between stearoyl-CoA desaturase activity and plasma triglycerides in human and mouse hypertriglyceridemia. J Lipid Res. 2002;43:1899–1907. doi: 10.1194/jlr.M200189-JLR200. [DOI] [PubMed] [Google Scholar]
- 19.Carpentier YA, Portois L, Sener A, Malaisse WJ. Correlation between liver and plasma fatty acid profile of phospholipids and triglycerides in rats. Int J Mol Med. 2008;22:255–62. [PubMed] [Google Scholar]
- 20.Kotronen A, Seppänen-Laakso T, Westerbacka J, Kiviluoto T, Arola J, Ruskeepää AL, Yki-Järvinen H, Orešič M. Comparison of lipid and fatty acid composition of the liver, subcutaneous and intra-abdominal adipose tissue, and serum. Obesity (Silver Spring, Md) 2010;18:937–44. doi: 10.1038/oby.2009.326. [DOI] [PubMed] [Google Scholar]
- 21.Landry F, Chan C-C, Huang Z, Leclair G, Li CS, Oballa R, Zhang L, Bateman K. Plasma-based approach to measure target engagement for liver-targeting stearoyl-CoA desaturase 1 inhibitors. J Lipid Res. 2011;52:1494–9. doi: 10.1194/jlr.M013177. [DOI] [PMC free article] [PubMed] [Google Scholar]
- 22.Mauvoisin D, Mounier C. Hormonal and nutritional regulation of SCD1 gene expression. Biochimie. 2011;93:78–86. doi: 10.1016/j.biochi.2010.08.001. [DOI] [PubMed] [Google Scholar]
- 23.Schwenk RW, Jonas W, Ernst SB, Kammel A, Jähnert M, Schürmann A. Diet-dependent alterations of hepatic Scd1 expression are accompanied by differences in promoter methylation. Horm Metab Res. 2013;45:786–94. doi: 10.1055/s-0033-1348263. [DOI] [PubMed] [Google Scholar]
- 24.Ntambi JM, Miyazaki M. Regulation of stearoyl-CoA desaturases and role in metabolism. Prog Lipid Res. 2004;43:91–104. doi: 10.1016/S0163-7827(03)00039-0. [DOI] [PubMed] [Google Scholar]
- 25.Hulver MW, Berggren JR, Carper MJ, Miyazaki M, Ntambi JM, Hoffman EP, Thyfault JP, Stevens R, Dohm GL, Houmard JA, Muoio DM. Elevated stearoyl-CoA desaturase-1 expression in skeletal muscle contributes to abnormal fatty acid partitioning in obese humans. Cell Metab. 2005;2:251–61. doi: 10.1016/j.cmet.2005.09.002. [DOI] [PMC free article] [PubMed] [Google Scholar]
- 26.Folch J, Lees M, Stanley GHS. A simple method for the isolation and purification of total lipids from animal tissues. J Biol Chem. 1957;226:497–509. [PubMed] [Google Scholar]
- 27.Price ME, Cotton AM, Lam LL, Farré P, Emberly E, Brown CJ, Robinson WP, Kobor MS. Additional annotation enhances potential for biologically-relevant analysis of the Illumina Infinium HumanMethylation450 BeadChip array. Epigenetics Chromatin. 2013;6:4. doi: 10.1186/1756-8935-6-4. [DOI] [PMC free article] [PubMed] [Google Scholar]
- 28.Bird A. DNA methylation patterns and epigenetic memory. Genes Dev. 2002;16:6–21. doi: 10.1101/gad.947102. [DOI] [PubMed] [Google Scholar]
- 29.Wan J, Oliver VF, Wang G, Zhu H, Zack DJ, Merbs SL, Qian J. Characterization of tissue-specific differential DNA methylation suggests distinct modes of positive and negative gene expression regulation. BMC Genomics. 2015;16:49. doi: 10.1186/s12864-015-1271-4. [DOI] [PMC free article] [PubMed] [Google Scholar]
- 30.Killick R, Banks S, Liu PY. Implications of sleep restriction and recovery on metabolic outcomes. J Clin Endocrinol Metab. 2012;97:3876–90. doi: 10.1210/jc.2012-1845. [DOI] [PMC free article] [PubMed] [Google Scholar]
- 31.Sampath H, Ntambi JM. Stearoyl-coenzyme A desaturase 1, sterol regulatory element binding protein-1c and peroxisome proliferator-activated receptor-α: independent and interactive roles in the regulation of lipid metabolism. Curr Opin Clin Nutr Metab Care. 2006;9:84–8. doi: 10.1097/01.mco.0000214564.59815.af. [DOI] [PubMed] [Google Scholar]
- 32.Sjögren P, Sierra-Johnson J, Gertow K, Rosell M, Vessby B, de Faire U, Hamsten A, Hellenius M-L, Fisher RM. Fatty acid desaturases in human adipose tissue: relationships between gene expression, desaturation indexes and insulin resistance. Diabetologia. 2008;51:328–35. doi: 10.1007/s00125-007-0876-9. [DOI] [PubMed] [Google Scholar]
- 33.Mayneris-Perxachs J, Guerendiain M, Castellote AI, Estruch R, Covas MI, Fitó M, Salas-Salvadó J, Martínez-González MA, Aros F, Lamuela-Raventós RM, López-Sabater MC. Plasma fatty acid composition, estimated desaturase activities, and their relation with the metabolic syndrome in a population at high risk of cardiovascular disease. Clin Nutr. 2014;33:90–7. doi: 10.1016/j.clnu.2013.03.001. [DOI] [PubMed] [Google Scholar]
- 34.Venäläinen T, Ågren J, Schwab U, De Mello VD, Eloranta A-M, Laaksonen DE, Lindi V, Lakka TA. Cross-sectional associations of plasma fatty acid composition and estimated desaturase and elongase activities with cardiometabolic risk in Finnish children—The PANIC study. J Clinical Lipidol. 2016;10:82–91. doi: 10.1016/j.jacl.2015.09.004. [DOI] [PubMed] [Google Scholar]
- 35.Knutson KL, Spiegel K, Penev P, Cauter EV. The metabolic consequences of sleep deprivation. Sleep Med Rev. 2007;11:163–78. doi: 10.1016/j.smrv.2007.01.002. [DOI] [PMC free article] [PubMed] [Google Scholar]
- 36.Weiss A, Xu F, Storfer-Isser A, Thomas A, Ievers-Landis CE, Redline S. The association of sleep duration with adolescent’s fat and carbohydrate consumption. Sleep. 2010;33:1201–9. doi: 10.1093/sleep/33.9.1201. [DOI] [PMC free article] [PubMed] [Google Scholar]
- 37.He F, Bixler EO, Liao J, Berg A, Imamura KY, Fernandez-Mendoza J, Vgontzas AN, Liao D. Habitual sleep variability, mediated by nutrition intake, is associated with abdominal obesity in adolescents. Sleep Med. 2015;16:1489–94. doi: 10.1016/j.sleep.2015.07.028. [DOI] [PMC free article] [PubMed] [Google Scholar]
- 38.Thorp AA, Schlaich MP. Relevance of sympathetic nervous system activation in obesity and metabolic syndrome. J Diabetes Res. 2015;2015:341583. doi: 10.1155/2015/341583. [DOI] [PMC free article] [PubMed] [Google Scholar]
- 39.Holman RT, Smythe L, Johnson S. Effect of sex and age on fatty acid composition of human serum lipids. Am J Clin Nutr. 1979;32:2390–9. doi: 10.1093/ajcn/32.12.2390. [DOI] [PubMed] [Google Scholar]
- 40.Warensjö E, Sundström J, Lind L, Vessby B. Factor analysis of fatty acids in serum lipids as a measure of dietary fat quality in relation to the metabolic syndrome in men. Am J Clin Nutr. 2006;84:442–8. doi: 10.1093/ajcn/84.1.442. [DOI] [PubMed] [Google Scholar]
- 41.Saadatian-Elahi M, Slimani N, Chajès V, Jenab M, Goudable J, Biessy C, Ferrari P, Byrnes G, Autier P, Peeters PH, Ocké M, Bueno de Mesquita B, Johansson I, Hallmans G, Manjer J, Wirfält E, González CA, Navarro C, Martinez C, Amiano P, Suárez LR, Ardanaz E, Tjønneland A, Halkjaer J, Overvad K, Jakobsen MU, Berrino F, Pala V, Palli D, Tumino R, Vineis P, Santucci de Magistris M, Spencer EA, Crowe FL, Bingham S, Khaw KT, Linseisen J, Rohrmann S, Boeing H, Noethlings U, Olsen KS, Skeie G, Lund E, Trichopoulou A, Oustoglou E, Clavel-Chapelon F, Riboli E. Plasma phospholipid fatty acid profiles and their association with food intakes: results from a cross-sectional study within the European Prospective Investigation into Cancer and Nutrition. Am J Clin Nutr. 2009;89:331–46. doi: 10.3945/ajcn.2008.26834. [DOI] [PubMed] [Google Scholar]
- 42.Spaeth AM, Dinges DF, Goel N. Effects of experimental sleep restriction on weight gain, caloric intake, and meal timing in healthy adults. Sleep. 2013;36:981–90. doi: 10.5665/sleep.2792. [DOI] [PMC free article] [PubMed] [Google Scholar]