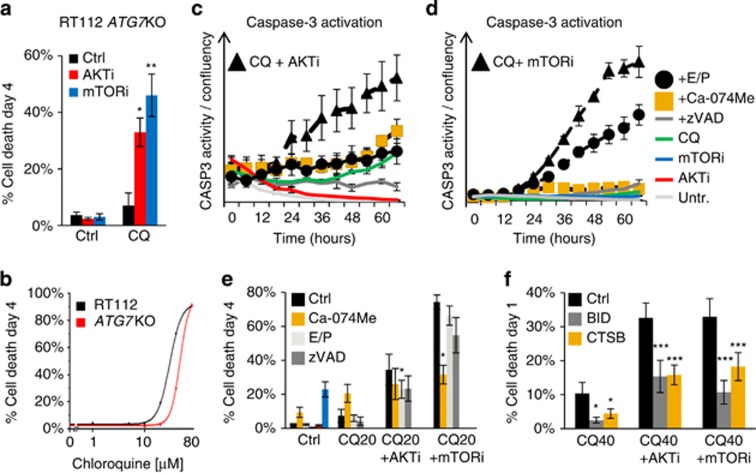
Figure 3.
Synergy between CQ and AKTi or mTORi is autophagy-independent and driven by cathepsins. RT112 ATG7 KO cells were incubated with AKT/mTORi (1 μm) before the addition of CQ (20 μm). (a) Histogram shows quantification of cell death at day 4, revealing synergy in autophagy-disabled cells (n=4; mean±s.e.). (b) RT112 WT and ATG7 KO cells were incubated with CQ (1–80 μm) for 4 days and quantified for cell death. Line graph shows OriginLab curve fitting from nine independent experiments, from which cdEC50 and statistics (see text) were calculated. (c and d) RT112 cells were treated with the AKTi (c) or mTORi (d) and CQ (20 μm) in combination with Ca-074Me (10 μm), E64D and pepstatinA (E/P; 30 μm/30 μm) and zVAD (20 μm) for 3 days. Cultures were incubated with the caspase-3 fluorogenic substrate NucView-488 and imaged every 6 h for fluorescence (λ475(40)/535(45)) and cellular confluency. Data are plotted as the number of fluorescent nuclei divided by cellular confluence (data from one experiment is shown, representative of three independent experiments; mean±range). (e) RT112 cells were treated as in (c and d) for 4 days and assayed for cell death (n=3; mean±s.d.). (f) RT112 cells were reverse transfected with Ctrl, BID or CTSB siRNA for 48 h before treatment with CQ (40 μm). Histogram shows cell death quantification at 24 h (n=3; mean±s.e.). *P<0.05, **P<0.01, ***P<0.001.

