

Abstract
Background
Clostridium difficile infection (CDI) is the leading cause of infectious nosocomial diarrhoea but the economic costs of CDI on healthcare systems in the US remain uncertain.
Methods
We conducted a systematic search for published studies investigating the direct medical cost associated with CDI hospital management in the past 10 years (2005–2015) and included 42 studies to the final data analysis to estimate the financial impact of CDI in the US. We also conducted a meta-analysis of all costs using Monte Carlo simulation.
Results
The average cost for CDI case management and average CDI-attributable costs per case were $42,316 (90 % CI: $39,886, $44,765) and $21,448 (90 % CI: $21,152, $21,744) in 2015 US dollars. Hospital-onset CDI-attributable cost per case was $34,157 (90 % CI: $33,134, $35,180), which was 1.5 times the cost of community-onset CDI ($20,095 [90 % CI: $4991, $35,204]). The average and incremental length of stay (LOS) for CDI inpatient treatment were 11.1 (90 % CI: 8.7–13.6) and 9.7 (90 % CI: 9.6–9.8) days respectively. Total annual CDI-attributable cost in the US is estimated US$6.3 (Range: $1.9–$7.0) billion. Total annual CDI hospital management required nearly 2.4 million days of inpatient stay.
Conclusions
This review indicates that CDI places a significant financial burden on the US healthcare system. This review adds strong evidence to aid policy-making on adequate resource allocation to CDI prevention and treatment in the US. Future studies should focus on recurrent CDI, CDI in long-term care facilities and persons with comorbidities and indirect cost from a societal perspective. Health-economic studies for CDI preventive intervention are needed.
Electronic supplementary material
The online version of this article (doi:10.1186/s12879-016-1786-6) contains supplementary material, which is available to authorized users.
Keywords: Clostridium Difficile, Economic analysis, Systematic review, Meta-analysis
Background
Clostridium difficile is the leading cause of infectious nosocomial diarrhoea in the United States (US) [1] and the incidence and severity of C. difficile infection (CDI) are increasing [2]. CDI is associated with significant morbidity and mortality; it represents a large clinical burden due to the resultant diarrhoea and potentially life-threatening complications, including pseudomembranous colitis, toxic megacolon, perforations of the colon and sepsis [3–5]. Up to 25 % of patients suffer from a recurrence of CDI within 30 days of the initial infection. Patients at increased risk of CDI are those who are immuno-compromised, such as those with human immunodeficiency virus (HIV) or who are receiving chemotherapy [6–8], patients receiving broad-spectrum antibiotic therapy [9, 10] or gastric acid suppression therapy [9, 11], patients aged over 65 years [10], patients with serious underlying disease [12], patients in intensive care units (ICUs) [10], or patients who have recently undergone non-surgical gastrointestinal procedures or those being tube-fed [10].
CDI represents a significant economic burden on US healthcare systems. Infected patients have an increased length of hospital stay compared to uninfected patients, besides there are significant costs associated with treating recurrent infections. A few systematic reviews of cost-of-illness studies on CDI cost are available [13–21]. These reviews mainly listed the range of reported cost of their respective observation period or were limited by the small number of included studies or inadequate control for confounding factors. No meta-analysis of large number of cost data in the US has been conducted to date. The cost for patients discharged to long-term care facility (LTCF) and recurrent CDI management are understudied. The cost of case management and total financial burden of CDI treatment in the US is therefore underestimated and remains controversial.
The aim of the current study is to conduct a systematic review and meta-analysis of currently available data to identify and quantify the financial burden attributable to CDI, and to further estimate the total economic burden of CDI hospital management in the US.
Methods
Search strategy
English-language databases with online search tools were searched for to offer maximum coverage of the relevant literature: Medline (via the Ovid interface 1946 to July 2015); EMBASE (via the Ovid interface 1980 to July 2015); The Centre for Review and Dissemination Library (incorporating the DARE, NHS EED, and NHS HTA databases); The Cochrane Library (via the Wiley Online Library) and Health Technology Assessment Database (1989 to July 2015).
We supplemented our data by searching relevant published reports from: National epidemiological agencies, Google search for grey literature and hand searched the reference lists of the included studies. The general search headings identified were: Clostridium difficile, economic, costs, cost analysis, health care costs, length of stay, hospitalization. Examples of the strategy for Medline and EMBASE are listed in Additional file 1.
Study selection
All studies that reported novel direct medical cost and/or indirect costs related to CDI management were included. Review articles, comments, editorials, letters, studies of outbreaks, case reports, posters and articles reporting results from economic modelling of a single treatment measure (i.e. cost effectiveness of faecal transplantation) were excluded in the final analysis. All relevant publications from January 2005 to July 2015 were included in the search. We included the following healthcare settings: hospitals, long-term care facilities and community. Geographical scope covered the US. We did not apply any language restriction. Our predefined inclusion and exclusion criteria are shown in Additional file 1.
Data extraction
Two reviewers (SP, SZ) independently selected the included articles and extracted data. After combining their results, any discrepancies were solved by discussion with HN and MK.
The primary outcomes were CDI-related costs (total costs of those with CDI and other comorbidities) and CDI-attributable costs (total costs of CDI management only, after controlling for the confounders). For studies with control groups (e.g. matched patients without CDI), the CDI-attributable cost extracted was either the cost provided by the articles or calculated by reviewers using the CDI-related cost minus the treatment cost of control groups. The secondary outcome was resource utilization associated with CDI, i.e. CDI-related length of stay (LOS) in hospital and CDI-attributable LOS. The study characteristics of each article were extracted. These included basic publication information, study design, statistical methods, economic data reporting characteristics and population information.
When multiple cost data were presented in a study, we included only one cost estimate for each population subgroup as per the priority below:
Matched data > Unmatched data.
Adjusted model results > Unadjusted model results.
Regression model results > Calculated difference.
Total cost/charges > Subgroup cost/charge (i.e. survivors, died).
Median (Interquantile Range: IQR) > Mean (Standard Deviation, SD).
All costs/charges data were inflated to 2015 US$ equivalent prices adjusted for the Consumer Price Index. If the price year was not reported, it was assumed to be the last year of the data collection period. In cases where charges were reported without cost-to-charge given, costs were estimated using a cost-to-charge ratio of 0.60, which is commonly used value in US health economic studies [22].
Meta-analysis and estimation of national impact
We carried out meta-analysis for cost studies following a Monte Carlo simulation approach, as reported by Jha et al [23] and Zimlichman et al [17], bearing in mind the heterogeneity of the included studies. For each subgroup of CDI, we synthesized the data and reported a point estimate and 90 % confidence intervals (CIs) for the CDI-related cost, CDI-attributable cost and their respective LOS. For each included study, we simulated distribution with pooled results weighted by sample size. We fitted a triangular distribution for each of the included studies based on their reported measures of central tendency and dispersion, i.e. mean and 95 % CI, median and IQR, or median and range. Then we simulated 100,000 sample draws from the modeled distribution of each study. At each iteration, we calculated the weighted average of all included studies. Finally, we reported the mean and 90 % CI from the resulting distribution of the 100,000 weighted average of CDI. This approach facilitated the combination of cost data and eliminated the limitation of combining non-normally distributed data. Monte Carlo simulations were conducted using the Monte Carlo simulation software @RISK, version 7.0 (Palisade Corp).
We estimated the national financial impact of CDI on the US healthcare system, by determining the potential boundaries. The higher boundary was the total number of CDI cases in the US in 2011 extracted from Lessa et al [24], while the lower boundary was the result from a meta-analysis to estimate the total burden of CDI cases in the US [25] (For detailed results see Additional file 1). The total annual cost of CDI management was calculated multiplying the average cost of management per case of CDI, with the total number of CDI cases per year in the US (Fig. 1). We assumed that all CDI cases received treatment in hospital. A point estimate of the final cost (with range) was reported based on a Monte Carlo simulation of 100,000 sample draws.
Fig. 1.
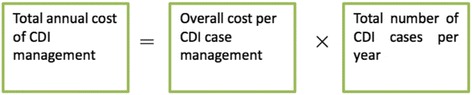
Formula for total annual cost calculation
Sensitivity analysis
We extracted the total number of CDI patients and CDI-attributable costs from previous studies [25] and reviews [17, 26] to carry out a sensitivity analysis of our total cost estimates.
Quality assessment
The quality of the studies included was assessed mainly based on the complexity of the statistical method (Fig. 2). All studies were included in the final analyses.
Fig. 2.
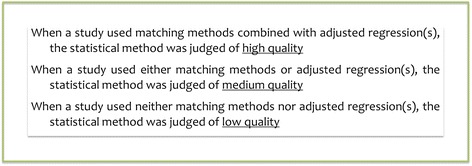
Quality Assessment Method
Results
Search results
The search strategy identified 2671 references from databases. Seven additional references were identified through other sources. After screening the titles, abstracts and relevant full texts (Fig. 3), a total of 42 studies were included in this review.
Fig. 3.
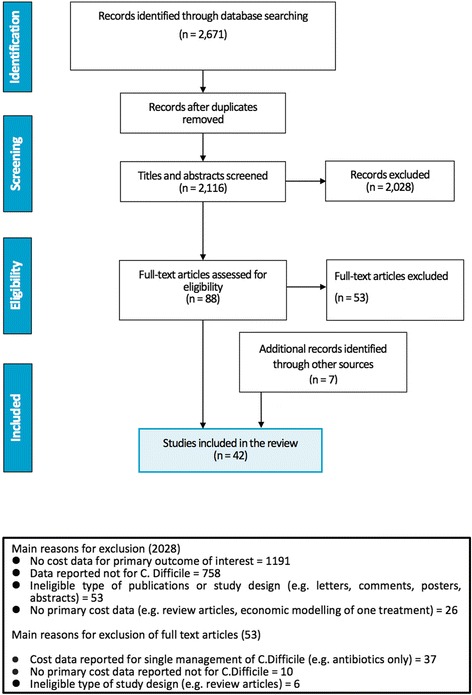
PRISMA diagram of economic burden search of C. difficile
Study characteristics
The characteristics of the 42 included studies [27–68] are summarized in Table 1. Cost data collection periods ranged from 1997 to 2012. Most studies (n = 27) used national level databases, with 17 used National Independent Sample (NIS) database and the remaining 10 studies extracted data from various national databases. Fifteen studies were conducted at state level, of which 6 studies only collected data in single hospital. All studies reported cost in hospital level of care, no articles identified in LTCF and community. Nearly all identified references were retrospective hospital database studies (n = 40) and only 1 study was a prospective observational study [29] and another study was a decision tree model [48].
Table 1.
Overview of selected references that assessed economic burden attributable to CDI by type of CDI considered in the US
| ID | Reference | State, city | Data collection period | Type of CDI | Population | Sample size (Total) | Sample size (CDI cases) | Age of CDI patients Mean ± SD or (Range), years |
CDI definition (short) | Quality assessment | Statistical methodology | Data source |
|---|---|---|---|---|---|---|---|---|---|---|---|---|
| 1 | Ali 2012 [27] | National | 2004–2008 | Comp. | Liver transplant | 193,714 | 5159 | >18 | ICD-9; 008.45 (Primary Diagnosis-PD, Secondary Diagnosis-SD) | Low | No matching; no regression | Nationwide Inpatient Sample (NIS) |
| 2 | Ananthakrishnan 2008 [28] | National | 2003 | Comp. | IBD | 124,570 | 2804 | >18 CDI: 73a; CDI-IBD: 54a |
ICD-9; 008.45 (PD) | Medium | No matching; regression | NIS |
| 3 | Arora 2011 [29] | Houston | 2007–2008 | Req. | General | 85 | 85 | Horn’s Index Score 1&2: 64 ± 19; Horn’s Index Score 3&4: 65 ± 15 | Toxin assay | Low | No matching; no regression | St Luke’s Episcopal Hospital |
| 4 | Bajaj 2010 [30] | National | National: 2005 Tertiary: 2002–2006 |
Both | Cirrhosis | 83,230 | 1165 | CDI: 69 ± 20; Cirrhosis-CDI: 61 ± 15 | ICD-9; 008.45 (PD, SD) | Medium | No matching; regression | NIS |
| 5 | Campbell 2013 [31] | National | 2005–2011 | Comp. | General | NR | 4521 | Renal impairment 72.9 ± 13.4; Advanced Age: 78.7 ± 7.4; Cancer/BMT 69.2 ± 14.0; IBD 61.2 ± 18.3; Cabx exposure 61.2 ± 14.8 | Toxin assay | High | Matching; regression | Health Facts electronic health record (HER) database |
| 6 | Damle 2014 [14] | National | 2008–2012 | Comp. | Colorectal surgery | 84,648 | 1266 | >18 63 ± 17 |
ICD-9; 008.45 (PD, SD) | Medium | No matching; regression | University Health System Consortium database |
| 7 | Dubberke 2008 [33] | Missouri | 2003–2003 | Both | Non- Surgical |
24,691 | 439 | 67(18–101) a | Toxin assay | High | Matching; regression | Barnes-Jewish Hospital Electronic record |
| 8 | Dubberke 2014 [2, 34, 71] | Missouri | 2003–2009 | Both | Recurrent CDI | 3958 | 421 | >18 | Toxin assay or clinical diagnosis for recurrent CDI | High | Matching; regression | Barnes-Jewish Hospital Electronic record |
| 9 | Egorova 2015 [35] | National | 2000–2011 | Comp. | Vascular surgery | NR | 2808 | 68.4 | ICD-9; 008.45 (PD, SD) | High | Matching: regression | NIS |
| 10 | Flagg 2014 [36] | National | 2004–2008 | Comp. | Cardiac surgery | 349,112 | 2581 | All age band | ICD-9; 008.45 (SD) | High | Matching: regression | NIS |
| 11 | Fuller 2009 [37] | Maryland and California | 2007–2008 for Maryland 2005–2006 for California | Comp. | General | 3760 | 3760 | – | Clinical diagnosis | Medium | No matching; regression | Health Services and Cost Review Commission, Maryland; The Office of State-wide Planning and Development, California |
| 12 | Glance 2011 [38] | National | 2005–2006 | Comp. | Trauma | 149,648 | 768 | 69(45–82) a | Clinical diagnosis | Medium | No matching; regression | NIS |
| 13 | Jiang 2013 [39] | Rhode Islands | 2010–2011 | Comp. | General | 225,999 | 6053 | >18 71.4 ± 15.8 |
ICD-9; 008.45 (SD) | Medium | Matching; no regression | Rhode Island’s 11 acute-care hospitals |
| 14 | Kim 2012 [40] | National | 2001–2008 | Comp. | Cystectomy | 10,856 | 153 | >18 68.49 ± 10.52 |
ICD-9 ; 008.45 (SD) | Medium | No matching; regression | NIS |
| 15 | Kuntz 2012 [41] | Colorado | 2005–2008 | Comp. | General | 3067 | 3067 | All age band, Outpatient 62.8 ± 19.4; Inpatient 69.9 ± 16.3 |
ICD-9 + toxin assay | Medium | No matching; regression | Kaiser Permanente Colorado and Kaiser Permanente Northwest members |
| 16 | Lagu 2014 [42] | Massachusetts, Boston one hospital | 2004–2010 | Comp. | Sepsis | 218,915 | 2348 | 70.9 ± 15.1 | ICD-9; 008.45 (PD, SD) + toxin assay | Medium | Matching; no regression | Baystate Medical Center (Premier Healthcare Informatics database, a voluntary, fee-supported database) |
| 17 | Lameire 2015 | National | 2002–2009 | Comp. | Cardiac surgery | 512,217 | 421,294 | >40 CABG 65.4 ± 10.5 VS 66.1 ± 12.3 |
ICD-9; 008.45 (PD, SD) | Medium | No matching; regression | NIS |
| 18 | Lawrence 2007 [44] | Missouri | 1997–1999 | Both | ICU | 1872 | 76 | Primary 68.9 (34–93) Secondary 58.7 (16–91) |
Toxin assay | Medium | No matching; regression | A 19-bed medical ICU in a Midwestern tertiary care referral center. |
| 19 | Lesperance 2011 [45] | National | 2004–2006 | Comp. | Elective colonic resections | 695,010 | 10,077 | >18 All 69.8; Surgery-CDI 68.7 |
ICD-9; 008.45 (SD) | Medium | No matching; regression | NIS |
| 20 | Lipp 2012 [46] | New York | 2007–2008 | Comp. | General | 4,853,800 | 3883 | >17 | ICD-9; 008.45 (SD) | Medium | No matching; regression | - The SPARCS database- acute care non-federal hospitals in New York State |
| 21 | Maltenfort 2013 [47] | National | 2002–2010 | Both | Arthroplasty | NR | NR | All age band | ICD-9; 008.45 (PD, SD) | Low | No matching; no regression | NIS |
| 22 | McGlone 2012 [48] | National | 2008 | Comp. | General | NR | NR | >65 | ICD-9; 008.45 (SD) | Low | No matching; no regression | Decision tree model |
| 23 | Nguyen 2008 [49] | National | 1998–2004 | Comp. | IBD | 527,187 | 2372 | 47.4 ± 0.2 | ICD-9; 008.45 (secondary diagnosis) | Medium | No matching; regression | NIS |
| 24 | Nylund 2011 [50] | National | 1997,2000, 2003,2006 | Both | Children | 10,495,728 | 21,274 | CDI 9.5 ± 0.07(SEM) | ICD-9; 008.45 (PD, SD) | High | Matching: regression | Healthcare Cost and Utilization Project Kids’Inpatient Database |
| 25 | O’Brien 2007 [51] | Massachusetts | 1999–2003 | Req. | General | 3692 | 1036 | Primary 70 ± 17.6; Secondary 70 ± 17.2 | ICD-9; 008.45 (PD, SD) | Low | No matching; no regression | Massachusetts hospital discharge data |
| 26 | Pakyz 2011 [52] | National | 2002–2007 | Comp. | General | 30,071 | 10,857 | CDI 61 ± 17 | ICD-9; 008.45 (SD) | High | Matching; regression | University Health System Consorsoum (UHC) |
| 27 | Pant 2012 [53] | National | 2009 | Both | Organ transplant (OT) | 244,955 | 6451 | >18, OT-CDI 58 ± 16 a; CDI-only 73 ± 22 a |
ICD-9; 008.45 (PD, SD) | Medium | No matching; regression | NIS |
| 28 | Pant 2012 (2) [54] | National | 2009 | Both | Renal disease | 184,139 | 5151 | >18, ESRD + CDI 66 ± 14 CDI ONLY 70 ± 17 |
ICD-9; 008.45 (PD, SD) | Medium | No matching; regression | NIS |
| 29 | Pant 2013 [55] | National | 2009 | Both | Children with IBD | 12,610 | 447 | <20, 15.1 ± 4.1 |
ICD-9; 008.45 (PD, SD) | Medium | No matching; regression | The Healthcare Cost and Utilization Project Kids’ Inpatient Database (HCUP-KID) |
| 30 | Peery 2012 [56] | National | From 2009 | Req. | General | 110,533 | 110,533 | All age band | ICD-9; 008.45 (PD) | Low | No matching; no regression | National Ambulatory Medical Care Survey (NAMCS) and NIS |
| 31 | Quimbo 2013 [57] | National | 2005–2010 | Comp. | High Risk subgroups | 21,177 | 26,620 | >18 67.5 ± 17.6 |
ICD-9; 008.45 (PD, SD) | High | Matching: regression | HealthCare Integrated Research Database |
| 32 | Reed 2008 | Pennsylvania | 2002–2006 | Comp. | High Risk subgroups | 9164 | 524 | >17 | Hospital acquired CDAD | Low | No matching; no regression | A large academic community hospital |
| 33 | Sammons 2013 [59] | National | 2006–2011 | Both | Children | 13,295 | 4447 | 1–18 6 (2–13) a |
ICD-9; 008.45 (PD, SD) + toxin assay | High | Matching; regression | Free-standing children’s hospitals via the Paediatric Health Information System (PHIS) |
| 34 | Singal 2014 [60] | National | 2007 | Comp. | Cirrhosis | 89,673 | 1444 | All age band | ICD-9; 008.45 (PD, SD) | Medium | No matching; regression | NIS |
| 35 | Song 2008 [61] | Maryland | 2000–2005 | Both | General | 9025 | 630 | >18 unmatched 57.6 matched 60.3 |
Toxin assay | High | Matching; regression | The Johns Hopkins hospital |
| 36 | Stewart 2011 [62] | National | 2007 | Both | General | 82,214 | 41,207 | All age band, 70 |
ICD-9; 008.45 (PD, SD) | Medium | Matching; no regression | NIS |
| 37 | Tabak 2013 [63] | Pennsylvania | 2007–2008 | Comp. | General | 77,257 | 255 | All 64.8 ± 17.6 CDI 71.1 ± 14.8 |
Toxin assay | High | Matching; regression | Six Pennsylvania hospitals via a clinical research database |
| 38 | VerLee 2012 | Michigan | 2002–2008 | Req. | General | 517,413 | 517,413 | All age band | ICD-9; 008.45 (PD) | Low | No matching; no regression | All Michigan acute care hospitals |
| 39 | Wang 2011 [65] | Pennsylvania | 2005–2008 | Both | General | 7,227,788 | 78,273 | All age band | ICD-9; 008.45 (PD, SD) | High | Matching; regression | The Pennsylvania Health Care Cost Containment Council (PHC4) database |
| 40 | Wilson 2013 [66] | National | 2004–2008 | Comp. | Ileostomy | 13,245 | 217 | All age band | ICD-9; 008.45 (SD) | High | Matching; regression | NIS |
| 41 | Zerey 2007 [67] | National | 1999–2003 | Both | Surgical | 1,553,597 | 8113 | All age band 70 am |
ICD-9; 008.45 (PD, SD) | Medium | No matching; regression | NIS |
| 42 | Zilberberg 2009 [68] | National | 2005 | Both | Prolonged acute mechanical ventilation | 64,910 | 3468 | >18 66.7 ± 15.9 |
ICD-9; 008.45 (PD, SD) | Medium | Matching; no regression | NIS |
Abbreviations: NR not reported, IBD inflammatory bowel disease, LOS length of stay, ICU intensive care unit, retrosp. retrospective, Comp. complicating, Req. requiring, both requiring and complicating, PD primary diagnosis, SD secondary diagnosis
a Median (Range)
Most studies (n = 15) investigated economic outcomes in all age inpatients. Three studies reported cost data in children less than 20 years old. The mean/median age of the CDI patient groups ranged from 47.4 to 73.0 years. Other studies investigated complicated CDI in high-risk patient groups, such as those with major surgery (n = 16), inflammatory bowel diseases (n = 2), liver or renal disease (n = 4), elderly (n = 2) and ICU patients (n = 1). There was 1 study each in non-surgical inpatients, sepsis inpatients and patients with prolonged acute mechanical ventilation. There was 1 study focusing only on recurrent CDI in the general population.
The sample sizes of included studies ranged from 85 to 7,227,788, with a median sample size of 83,939. A total of 28.8 million inpatient hospital-days were analysed, of which 1.31 million inpatient hospital-days were CDI patients. The median sample size of CDI population was 2938.
The methods to identify CDI varied according to the type of CDI that was assessed in the study. CDI cases were identified either with laboratory test, i.e. positive C. diffcile toxin assay, or hospital discharge diagnosis of C. difficile (primary and/secondary) from administrative datasets using the International Classifications of diseases, Ninth, Clinical Modification, ICD-9-CM 008.45. Clinical diagnosis was also used in two studies.
CDI was classified in three types: Community-onset CDI (CO-CDI) requiring hospitalization, Hospital-onset CDI (HO-CDI) complicating other diseases, or both CDI (Table 2). Most of included studies considered HO-CDI (n = 23) or both CDI types (n = 17). Only four studies investigated CO-CDI only. However, subgroup data of CO-CDI is also available in studies that reported both CDI types.
Table 2.
Classification of CDI Cases by Setting of Acquisition
| Case definition | Criteria for classification |
|---|---|
| CO-CDI | - Discharge code ICD-9-CM 008.45 as Primary diagnosis |
| HO-CDI | - Discharge code ICD-9-CM 008.45 as secondary diagnosis, without a primary diagnosis of a CDI-related symptom (e.g. diarrhea) - Study population ≥ 48 h of hospitalization - Symptom onset and/or positive laboratory assay at least ≥ 48 h hospitalization |
| Both CDI | - No distinction of settings of acquisition - Discharge code ICD-9-CM 008.45 in any position |
Abbreviations: CO-CDI community-onset CDI, HO-CDI hospital-onset CDI, ICD-9-CM The International Classification of Diseases, Ninth Revision, Clinical Modification
CDI costs and LOS
The mean CDI-attributable costs per case of CO-CDI were $20,085 (Range: $7513–$29,662), lower than HO-CDI $34,149 (Range:$1522–$122,318). HO-CDI showed a wider range within which the additional cost for CDI in the general population ranged from $6893 to $90,202 and in high risk groups ranged from $7332 in congestive heart failure patients to $122,318 in renal impairment patients. The mean CDI-attributable LOS was 5.7 days (Range: 2.1–33.4) for CO-CDI, 7.8 (Range:2.3–21.6) days for HO-CDI, and 13.6 (Range: 2.2–16) days for both groups. Cost data and LOS for individual studies are presented in Tables 3 and 4.
Table 3.
CDI-attributable costs/charges and CDI-related management costs/charges
| Author, Year | Population | Outcome | Statistic | Incremental CDI-attributable cost/charges | CDI-related cost/charges | Note | ||||||
|---|---|---|---|---|---|---|---|---|---|---|---|---|
| Sample size | Attributable cost 2015$ | SD or 95 % CI | Sample size | CDI only cost 2015$ | SD, 95 % CI or IQR | |||||||
| CO-CDI Inpatient Cost | ||||||||||||
| Arora 2011 [29] | General | Cost | Median | 85 | 25,436 | 85 | 25,436 | |||||
| O’Brien 2007 [51] | General | Cost | Mean | 4015 | 14,736 | 4015 | 14,736 | |||||
| Peery 2012 [56] | General | Cost | Median | 110,553 | 7513 | 110,553 | 7513 | |||||
| VeerLee 2012 [64] | General | Charges | Mean | 68,686 | 74,211 | 120,156 | 68,686 | 74,211 | 120,156 | |||
| Kuntz 2012 [41] | General | Cost | Mean | 1650 | 929 | 4800 | 1650 | 929 | 4800 | Outpatient | ||
| Kuntz 2012 [41] | General | Cost | Mean | 1316 | 11,877 | 35,923 | 1316 | 11,877 | 35,923 | Inpatient | ||
| O’Brien 2007 [51] | General | Cost | Median | 1036 | 7263 | 1036 | 7263 | PD | ||||
| VeerLee 2012 [64] | General | Charges | Mean | 17,413 | 27,463 | 40,484 | 17,413 | 27,463 | 40,484 | PD | ||
| O’Brien 2007 [51] | General | Cost | Mean | 3327 | 16,946 | 34,655 | 3327 | 16,946 | Rehospitalisation | |||
| Sammons 2013 [59] | Children | Cost | Mean | 2060 | 19,993 | 15,973 | 24,013 | 2060 | 19,993 | 15,973 | 24,013 | Community onset |
| Ananthakrishnan 2008 [28] | IBD | Charges | Median | 44,400 | 16,864 | CDI only | ||||||
| Pant 2013 [55] | IBD | Charges | Mean | 12,610 | 12,761 | 6868 | 18,655 | 447 | 50,050 | CDI only | ||
| Bajaj 2010 [30] | Cirrhosis | Charges | Mean | 58,220 | 70,309 | CDI only | ||||||
| Quimbo 2013 [57] | CDI History | Cost | Mean | 1866 | 29,662 | 20,798 | 42,300 | 933 | 51,863 | 36,641 | 73,411 | CDI only |
| Total numbers/Weighted Mean | 224,617 | 20,085 | 314,141 | 23,322 | ||||||||
| HO-CDI Inpatient Cost | ||||||||||||
| Fuller 2009 [37] | General | Cost | Coefficient | 1282 | 18,466 | 288 | 1282 | 18,466 | 288 | Maryland, SD | ||
| Fuller 2009 [37] | General | Cost | Coefficient | 2478 | 29,980 | 271 | 2478 | 29,980 | 271 | California, SD | ||
| Lipp 2012 [46] | General | Cost | Mean | 3826 | 32,050 | 3826 | 32,050 | SD | ||||
| McGlone 2012 [48] | General | Cost | Median | 54,046 | 10,016 | 8547 | 12,055 | 54,046 | 10,016 | 8547 | 12,055 | SD Cost-hospital perspective-6 days LOS |
| McGlone 2012 [48] | General | Cost | Median | 54,046 | 11,116 | 9476 | 13,366 | 54,046 | 11,116 | 9476 | 13,366 | 10 days LOS |
| McGlone 2012 [48] | General | Cost | Median | 54,046 | 12,194 | 10,146 | 14,896 | 54,046 | 12,194 | 10,146 | 14,896 | 14 days LOS |
| O’Brien 2007 [51] | General | Cost | Median | 2656 | 6630 | 2656 | 6630 | SD | ||||
| VeerLee 2012 [64] | General | Charges | Mean | 51,273 | 90,202 | 146,767 | 51,273 | 90,202 | 146,767 | SD | ||
| Jiang 2013 [39] | General | Cost | Median | 7264 | 11,689 | 1211 | 21,751 | |||||
| Pakyz 2011 [52] | General | Cost | Mean | 30,071 | 31,180 | 10,857 | 64,732 | Unadjusted | ||||
| Pakyz 2011 [52] | General | Cost | Median | 30,071 | 24,456 | 10,857 | 39,598 | 22,400 | 88,537 | Unadjusted | ||
| Pakyz 2011 [52] | General | Cost | Mean | 30,071 | 31,169 | 10,857 | 64,000 | 63,541 | 64,458 | Adjusted | ||
| Tabak 2013 [63] | General | Cost | Mean | 1020 | 6893 | 1365 | 13,617 | 255 | 22,992 | 12,222 | 42,470 | |
| Campbell 2013 [31] | Age > = 65 | Cost | Mean | 3064 | 7536 | 4302 | 10,771 | 3064 | 48,932 | 67,727 | ||
| Quimbo 2013 [57] | Elderly | Cost | Mean | 34,732 | 45,749 | 43,279 | 48,359 | 10,933 | 83,004 | 78,548 | 87,713 | |
| Sammons 2013 [59] | Children | Cost | Mean | 2414 | 99,012 | 84,626 | 113,398 | 2414 | 99,012 | 84,626 | 113,398 | |
| Ananthakrishnan 2008 [28] | IBD | Charges | Median | 80,170 | 7655 | 2804 | 24,623 | |||||
| Ananthakrishnan 2008 [28] | IBD | Charges | Mean | 80,170 | 14,368 | 9467 | 19,270 | – | ||||
| Campbell 2013 [31] | IBD | Cost | Mean | 84 | 1522 | −14,932 | 11,888 | 84 | 40,194 | 44,845 | ||
| Quimbo 2013 [57] | IBD | cost | Mean | 3618 | 11,825 | 9851 | 14,181 | 1206 | 42,035 | 35,918 | 49,191 | |
| Ananthakrishnan 2008 [28] | Ulcerative colitis (UC) | Charges | Median | 1843 | 26,750 | |||||||
| Nguyen 2008 [49] | UC | Charges | Mean | 43,645 | 14,749 | 196 | 43,381 | Regression | ||||
| Ananthakrishnan 2008 [28] | Crohn's disease (CD) | Charges | Median | 961 | 22,738 | |||||||
| Nguyen 2008 [49] | CD | Charges | Mean | 73,197 | 14,316 | 329 | 41,453 | Regression | ||||
| Reed 2008 | Digestive disorders | Charges | Mean | 2394 | 3670 | 320 | 9076 | 8068 | ||||
| Damle 2014 [14] | Colorectal surgery | Cost | Median | 84,648 | 14,644 | 13,700 | 15,589 | 1266 | 21,309 | 38,218 | – | |
| Kim 2012 [40] | Cystectomy | Cost | Mean | 10,856 | 25,014 | 153 | 57,379 | 50,204 | 64,554 | |||
| Lesperance 2011 [45] | Elective colonic resection | Charges | Mean | 695,010 | 84,899 | 10,077 | 158,401 | |||||
| Reed 2008 | Major bowel procedures | Charges | Mean | 1035 | 25,476 | 45 | 47,064 | 31,302 | ||||
| Wilson 2013 [66] | Ileostomy | Cost | Mean | 13,462 | 20,272 | 217 | 35,076 | |||||
| Wilson 2013 [66] | Ileostomy | Cost | Coefficient | 13,462 | 17,513 | 14,106 | 20,921 | |||||
| Egorova 2015 [35] | Vascular surgery | Cost | Median | 450,251 | 14,250 | 4708 | 36,847 | 22,912 | 62,903 | |||
| Flagg 2014 [36] | Cardiac surgery | Cost | Median | 5160 | 19,524 | 2580 | 213,661 | Adjusted | ||||
| Flagg 2014 [36] | Cardiac surgery | Cost | Median | 349,122 | 38,320 | 2580 | 72,730 | Unadjusted | ||||
| Lemaire 2015 [43] | Cardiac surgery | Cost | Median | 421,294 | 35,968 | – | 72,685 | CABG | ||||
| Lemaire 2015 [43] | Cardiac surgery | Cost | Median | 90,923 | 59,696 | – | 106,141 | VS | ||||
| Reed 2008 | OR procedure for infectious /parasitic diseases | Charges | Mean | 449 | 7462 | 32 | 35,524 | 25,498 | ||||
| Glance 2011 [38] | Trauma | Cost | Median | 149,656 | 24,131 | 768 | 39,296 | |||||
| Campbell 2013 [31] | Cabx | Cost | Mean | 1641 | 18,567 | 10,448 | 26,687 | 1641 | 78,948 | 99,739 | ||
| Quimbo 2013 [57] | Cabx | Cost | Mean | 17,716 | 38,413 | 35,195 | 41,922 | 4429 | 64,242 | 59,145 | 69,780 | |
| Lagu 2014 [42] | Sepsis | Cost | Median | 4736 | 5792 | 4933 | 6665 | 2368 | 28,576 | 16,496 | 50,494 | |
| Reed 2008 | Septicaemia | Charges | Mean | 1211 | 9141 | 92 | 22,378 | 20,591 | ||||
| Campbell 2013 [31] | Renal impairment | Cost | Mean | 3236 | 5024 | 1118 | 8928 | 3236 | 50,586 | 72,180 | ||
| Quimbo 2013 [57] | RI | Cost | Mean | 22,132 | 122,318 | 111,315 | 134,405 | 5533 | 201,212 | 183,706 | 220,386 | |
| Ali 2012 [27] | Liver transplant | Charges | Mean | 193,714 | 77,361 | 5159 | 158,038 | |||||
| Singal 2014 [60] | Cirrhosis | Charges | Mean | 89,673 | 23,310 | 1444 | 47,401 | |||||
| Reed 2008 | Congestive Heart Failure | Charges | Mean | 2542 | 7332 | 35 | 14,738 | 13,841 | ||||
| Quimbo 2013 [57] | Immunocompromised | Cost | Mean | 14,344 | 33,632 | 30,151 | 37,516 | 3586 | 73,612 | 66,048 | 82,041 | |
| Campbell 2013 [31] | Cancer/BMT | Cost | Mean | 782 | 687 | −6480 | 7855 | 782 | 48,280 | 72,605 | ||
| Total numbers/Weighted mean | 3,020,827 | 34,149 | 207,801 | 49,712 | ||||||||
| Dubberke 2014 [2, 34, 71] | Recurrent CDI | Cost | Mean | 3958 | 12,163 | 3958 | 11,523 | 4728 | 26,167 | Total cost difference | ||
| Dubberke 2014 [2, 34, 71] | Recurrent CDI | Cost | Mean | 3958 | 12,692 | 9752 | 15,919 | Adjusted | ||||
| Song 2008 [61] | General | Cost | Median | 1260 | 373 | 630 | 30,305 | |||||
| Stewart 2011 [62] | General | Cost | Mean | 82,414 | 9670 | 41,207 | 26,790 | |||||
| Wang 2011 [65] | General | Cost | Median | 7,227,788 | 4914 | 78,273 | 12,081 | |||||
| Nylund 2011 [50] | Children | Charges | Median | 3565 | 15,937 | 3565 | 25,549 | 1997 | ||||
| Nylund 2011 [50] | Children | Charges | Median | 4356 | 20,750 | 4356 | 31,858 | 2000 | ||||
| Nylund 2011 [50] | Children | Charges | Median | 5574 | 23,627 | 5574 | 33,625 | 11,348 | 97,822 | 2003 | ||
| Nylund 2011 [50] | Children | Charges | Median | 7779 | 23,362 | 7779 | 35,444 | 13,601 | 110,343 | 2006 | ||
| Sammons 2013 [59] | Children | Cost | Mean | 698,616 | 51,304 | 44,746 | 57,969 | 698,616 | 51,304 | 44,746 | 57,969 | |
| Dubberke 2008 [33] | Non-surgical | Cost | Median | 24,691 | 11,749 | 439 | 20,569 | Raw data | ||||
| Dubberke 2008 [33] | Non-surgical | Charges | Median | 24,691 | 23,961 | 439 | 42,154 | Raw data | ||||
| Dubberke 2008 [33] | Non-surgical | Cost | Mean | 24,691 | 3173 | 3078 | 3815 | Linear regression | ||||
| Dubberke 2008 [33] | Non-surgical | Cost | Median | 24,691 | 4190 | 342 | 18,842 | Matched cases | ||||
| Dubberke 2008 [33] | Non-surgical | Cost | Mean | 24,691 | 6520 | 4910 | 8381 | Linear regression, 180 days | ||||
| Dubberke 2008 [33] | Non-surgical | Cost | Median | 24,691 | 9284 | 342 | 35,414 | Matched cases, 180 days | ||||
| Zerey 2007 [67] | Surgical | Charges | Median | 1,553,597 | 59,424 | 8113 | 81,708 | |||||
| Zerey 2007 [67] | Surgical | Charges | Coefficient | 1,553,597 | 94,402 | 91,589 | 97,216 | Multivariate regression analysis | ||||
| Zilberberg 2009 [68] | Prolonged acute mechanical ventilation (PAMV) | Cost | Median | 64,910 | 48,065 | 3468 | 190,188 | 107,689 | 333,290 | Unadjusted | ||
| Zilberberg 2009 [68] | PAMV | Cost | Mean | 3370 | 12,616 | 9186 | 16,046 | 3468 | 91,039 | 71,306 | Adjusted | |
| Lawrence 2007 [44] | ICU | Cost | Median | 1872 | 7043 | 76 | 15,016 | ICU stay | ||||
| Lawrence 2007 [44] | ICU | Cost | Median | 1872 | 36,095 | 76 | 60,723 | Entire hospital stay | ||||
| Bajaj 2010 [30] | Cirrhosis | Charges | Mean | 83,230 | 49,460 | 1165 | 96,678 | |||||
| Maltenfort 2013 [47] | Arthroplasty | Charges | Median | – | 43,648 | – | 84,877 | 52,498 | 142,827 | |||
| Pant 2012 [53] | Organ transplant | Charges | Mean | 49,198 | 77,246 | 73,412 | 81,080 | 63,651 | 42,054 | 69,033 | ||
| Pant 2012 (2) [54] | Renal disease | Charges | Coefficient | 184,139 | 69,679 | 68,338 | 71,020 | 59,793 | 87,982 | |||
| Pant 2013 [55] | IBD | Charges | Mean | 12,610 | 39,453 | 32,470 | 46,436 | |||||
| Total numbers/Weighted Mean | 10,012,927 | 14,403 | 981,005 | 45,421 | ||||||||
Abbreviations: CO-CDI community-onset CDI, HO-CDI hospital-onset, PAMV prolonged acute mechanical ventilation, Cabx concomitant antibiotic use, UC ulcerative colitis, CD Crohn’s disease, IBD inflammatory bowel disease, ICU intensive care unit, CABG coronary artery bypass grafting, VS valvular surgery, BMT, PD primary diagnosis, SD secondary diagnosis, Calculated numbers were marked in Italic, attributable cost = cost of CDI group- cost of control non-CDI group
Table 4.
CDI-attributable LOS and CDI-related LOS
| Reference | Population | Statistic | CDI VS NO CDI LOS (Days) | CDI LOS (Days) | ||||||
|---|---|---|---|---|---|---|---|---|---|---|
| Sample size | Value | SD or 95 % CI | Sample size | Value | SD or 95 % CI | |||||
| CO-CDI Inpatient days | ||||||||||
| Arora 2011 [29] | Horn’s index 1&2 | Mean | 33 | 15.1 | 16.2 | 33 | 15.1 | 16.2 | ||
| Arora 2011 [29] | Horn’s index 3&4 | Mean | 52 | 33.4 | 33.3 | 52 | 33.4 | 33.3 | ||
| Kuntz 2012 [41] | General outpatient | Mean | 1650 | 10.0 | 17.0 | 1650 | 10.0 | 17.0 | ||
| Kuntz 2012 [41] | General inpatient | Mean | 1316 | 14.9 | 20.9 | 1316 | 14.9 | 20.9 | ||
| O’Brien 2007 [51] | General | Mean | 4015 | 6.4 | 4015 | 6.4 | ||||
| Pant 2013 [55] | IBD | Coefficient | 12,610 | 2.1 | 1.4 | 2.8 | 2.1 | 1.4 | 2.8 | |
| Peery 2012 [56] | General | Median | 110,553 | 5.0 | 110,553 | 5.0 | ||||
| Quimbo 2013 [57] | CDAD History | Mean | 1866 | 2.9 | 2.4 | 3.6 | 933 | 8.9 | 7.2 | 11.0 |
| Sammons 2013 [59] | Children | Median | 2060 | 5.6 | 4.5 | 6.6 | 2060 | 6.0 | 4.0a | 13.0a |
| VeerLee 2012 [64] | General | Mean | 68,686 | 7.1 | 7.0 | 68,686 | 7.1 | 7.0 | ||
| Weighted Mean | 202,841 | 5.7 | 189,298 | 5.9 | ||||||
| HO-CDI inpatient days | ||||||||||
| Jiang 2013 [39] | General | Median | 7264 | 8.0 | 1211 | 13.0 | ||||
| Lipp 2012 [46] | General | Mean | 3826 | 12.0 | 3826 | 12.0 | ||||
| Pakyz 2011 [52] | General | Mean | 30,071 | 11.1 | 10,857 | 21.1 | 21.0 | 21.2 | ||
| Tabak 2013 [63] | General | Median | 1020 | 2.3 | 0.9 | 3.8 | 255 | 12.0 | 9.0a | 21.0a |
| Wang 2013 | General | Median | 7,227,788 | 7.0 | 78,273 | 6.0 | 4.0a | 11.0a | ||
| Campbell 2013 [31] | Age > = 65 | Mean | 3064 | 3.0 | 1.4 | 4.6 | 3064 | 21.3 | 25.3 | |
| Quimbo 2013 [57] | Elderly | Mean | 34,732 | 7.8 | 7.5 | 8.1 | 10,933 | 18.8 | 18.2 | 19.5 |
| Sammons 2013 [59] | Children | Median | 2414 | 21.6 | 19.3 | 23.9 | 2414 | 23.0 | 12.0a | 44.0a |
| Ananthakrishnan 2008 [28] | IBD | Median | 80,170 | 3.0 | 2804 | 7.0 | ||||
| Campbell 2013 [31] | IBD | Mean | 84 | 3.0 | −2.3 | 8.3 | 84 | 21.0 | 19.1 | |
| Quimbo 2013 [57] | IBD | Mean | 3618 | 3.3 | 2.9 | 3.7 | 1206 | 12.8 | 11.6 | 14.2 |
| Nguyen 2008 [49] | Crohn’s disease | Mean | 73,197 | 3.8 | 329 | 9.5 | ||||
| Nguyen 2008 [49] | Ulcerative colitis | Mean | 43,645 | 3.2 | 196 | 9.9 | ||||
| Reed 2008 | Digestive disorders | Mean | 2394 | 3.0 | 320 | 6.9 | 5.2 | |||
| Damle 2014 [14] | Colorectal surgery | Median | 84,648 | 8.4 | 8.0 | 8.9 | 1266 | 13.0 | 18.0 | |
| Lesperance 2011 [45] | Elective colonic resection | Mean | 695,010 | 11.7 | 10,077 | 22.6 | ||||
| Reed 2008 | Major bowel procedures | Mean | 1035 | 10.0 | 45 | 20.9 | 11.3 | |||
| Wilson 2013 [66] | Ileostomy | Mean | 13,462 | 11.6 | 217 | 18.7 | ||||
| Campbell 2013 [31] | Cabx exposure | Mean | 1641 | 7.8 | 5.7 | 9.9 | 1641 | 29.3 | 34.7 | |
| Quimbo 2013 [57] | Concomitant Antibiotic Use | Mean | 17,716 | 7.8 | 7.4 | 8.3 | 4429 | 17.9 | 17.0 | 18.9 |
| Lagu 2014 [42] | Sepsis | Mean | 4736 | 5.1 | 4.4 | 5.7 | 2368 | 19.2 | ||
| Reed 2008 | Septicemia | Mean | 1211 | 5.0 | 92 | 10.7 | 7.6 | |||
| Egorova 2015 [35] | Vascular surgery | Median | 450,251 | 6.7 | 4708 | 15.0 | 9.0a | 25.0a | ||
| Flagg 2014 [36] | Cardiac surgery | Median | 349,122 | 10.0 | 2580 | 21.0 | ||||
| Glance 2011 [38] | Trauma | Median | 149,656 | 10.0 | 768 | 16.0 | ||||
| Lemaire 2015 [43] | Cardiac surgery (CABG) | Median | 421,294 | 12.0 | 19.0 | |||||
| Lemaire 2015 [43] | Cardiac surgery (VS) | Median | 90,923 | 16.0 | 24.0 | |||||
| Reed 2008 | Congestive Heart Failure | Mean | 2542 | 5.0 | 35 | 9.7 | 7.0 | |||
| Reed 2008 | OR procedure for infectious /parasitic diseases | Mean | 449 | 2.0 | 32 | 14.7 | 8.6 | |||
| Lawrence 2007 [44] | ICU | Median | 76 | 14.9 | 1.0b | 86.0b | ||||
| Lawrence 2007 [44] | ICU | Median | 76 | 38.3 | 4.0b | 184.0b | ||||
| Ali 2012 [27] | Liver transplant | Mean | 193,714 | 10.1 | 5159 | 17.8 | ||||
| Singal 2014 [60] | Cirrhosis | Mean | 89,673 | 7.5 | 1444 | 13.9 | ||||
| Quimbo 2013 [57] | Immunocompromised | Mean | 14,344 | 8.4 | 7.9 | 9.0 | 3586 | 22.1 | 20.6 | 23.7 |
| Campbell 2013 [31] | Renal impairment | Mean | 3236 | 4.0 | 2.9 | 5.1 | 3236 | 22.7 | 28.2 | |
| Quimbo 2013 [57] | Renal impairment | Mean | 22,132 | 17.3 | 16.4 | 18.3 | 5533 | 37.5 | 35.5 | 39.6 |
| Campbell 2013 [31] | Cancer/BMT | Mean | 782 | 4.0 | 2.3 | 5.7 | 782 | 21.3 | 18.5 | |
| Weighted Mean | 10,120,864 | 7.8 | 168,892 | 13.5 | ||||||
| Both CO-CDI and HO-CDI inpatient cost | ||||||||||
| Song 2008 [61] | General | Median | 1260 | 4.0 | 630 | 22.0 | ||||
| Stewart 2011 [62] | General | Mean | 82,414 | 5.1 | 41,207 | 13.0 | 14.0 | |||
| Nylund 2011 [50] | Children, 1997 | Median | 3565 | 3.0 | 3565 | 5.0 | 3.0a | 14.0a | ||
| Nylund 2011 [50] | Children, 2000 | Median | 4356 | 4.0 | 4356 | 6.0 | 3.0a | 15.0a | ||
| Nylund 2011 [50] | Children, 2003 | Median | 5574 | 4.0 | 5574 | 6.0 | 3.0a | 14.0a | ||
| Nylund 2011 [50] | Children, 2006 | Median | 7779 | 4.0 | 7779 | 6.0 | 3.0a | 15.0a | ||
| Sammons 2013 [59] | Children | Median | 698,616 | 12.2 | 10.6 | 13.8 | 698,616 | 10.0 | 5.0a | 23.0a |
| Bajaj 2010 [30] | Cirrhosis | Mean | 83,230 | 7.1 | 1165 | 14.4 | ||||
| Bajaj 2010 [30] | CDI only | Mean | 58,220 | 12.7 | ||||||
| Pant 2013 [55] | IBD | Mean | 12,610 | 2.2 | 1.5 | 2.8 | 447 | 8.2 | ||
| Dubberke 2008 [33] | Non-surgical | Median | 24,691 | 6.0 | 439 | 10.0 | 2. 0b | 87.0b | ||
| Lawrence 2007 [44] | ICU stay | Median | 1872 | 3.1 | 76 | 6.1 | 1.0b | 86.0b | ||
| Lawrence 2007 [44] | Hospital stay | Median | 1872 | 14.4 | 76 | 24.5 | 2.0b | 184.0b | ||
| Maltenfort 2013 [47] | Arthroplasty | Median | – | 7.0 | – | 10.0 | 7.0a | 17.0a | ||
| Zerey 2007 [67] | Surgical | Median | 1,553,597 | 16.0 | 15.6 | 16.4 | 8113 | 18.0 | ||
| Pant 2012 [53] | Organ transplant | Median | 49,198 | 9.6 | 9.3 | 9.9 | 63,651 | |||
| Pant 2012 (2) [54] | Renal disease | Coefficient | 184,139 | 9.4 | 9.2 | 9.5 | 59,793 | |||
| Zilberberg 2009 [68] | Prolonged acute mechanical ventilation | Median | 3370 | 6.1 | 4.9 | 7.4 | 3468 | 25.0 | 15.0a | 40.0a |
| Weighted Mean | 2,718,143 | 13.6 | 957,175 | 9.0 | ||||||
Abbreviations: CO-CDI community-onset CDI, HO-CDI Hospital-onset CDI, PAMV prolonged acute mechanical ventilation, Cabx concomitant antibiotic use, UC ulcerative colitis, CD Crohn’s disease, IBD inflammatory bowel disease, ICU intensive care unit, CABG coronary artery bypass grafting, VS valvular surgery, BMT, PD primary diagnosis, SD secondary diagnosis, Calculated numbers were marked in Italic, attributable cost = cost of CDI group- cost of control non-CDI group
aQ1-Q3
bMin-Max
Using a Monte Carlo simulation, we generated point estimates and 90 % CI for both cost and LOS; the meta-analysis results are shown in Table 5. The total cost of inpatient management of CDI-related disease was $42,316 (90 % CI: $39,886–$44,765) per case, of which the total CDI-attributable cost was $21,448 (90 % CI: 21,152–21,744) per case. For the inpatient management, the attributable cost for those HO-CDI was $34,157 (90 % CI: $33,134–$35,180), which was 1.5 times as much as CO-CDI management $20,095 (90 % CI: $4991–$35,204).
Table 5.
Meta analysis results of cost and LOS of CDI management
| CDI category | CDI-attributable cost per case (2015 US$) |
CDI-related cost per case (2015 US$) |
CDI-attributable LOS per case (Days) | CDI-related LOS per case (Days) | ||||||||
|---|---|---|---|---|---|---|---|---|---|---|---|---|
| Weighted mean | 90 % CI | Weighted mean | 90 %CI | Weighted mean | 90 % CI | Weighted mean | 90 % CI | |||||
| CO-CDI | 20,095 | 4991 | 35,204 | 23,329 | 12,520 | 34,141 | 5.7 | 4.1 | 7.3 | 5.7 | 4.1 | 7.3 |
| HO-CDI | 34,157 | 33,134 | 35,180 | 53,487 | 42,054 | 66,326 | 9.7 | 9.7 | 9.7 | 14.1 | 13.0 | 15.4 |
| Both CO-CDI and HO-CDI | 17,650 | 17,292 | 18,009 | 46,000 | 42,502 | 49,533 | 10.4 | 9.7 | 11.0 | 11.8 | 7.1 | 17.6 |
| Overall inpatient | 21,448 | 21,152 | 21,744 | 42,316 | 39,886 | 44,765 | 9.7 | 9.6 | 9.8 | 11.1 | 8.7 | 13.6 |
Abbreviations: CO-CDI community-onset CDI, HO-CDI Hospital-onset CDI
Similar patterns were observed in LOS data. The total CDI-related LOS was 11.1 days (90 % CI: 8.7–13.6) and CDI-attributable LOS was 9.7 (90 % CI: 9.6–9.8). The HO-CDI patients had longer CDI-attributable LOS 9.7 days (90 % CI: 9.7–9.7) than CO-CDI patients 5.7 days (90 % CI: 4.1–7.3).
CDI annual national impact estimate
The total burden of healthcare facility CDI in US was estimated 293,300 (Range: 264,200–453,000) cases per year [25]. The total financial burden of CDI inpatient management was estimated to be US$6.3 (Range: $1.9–$7.0) billion in 2015, which required 2.4 million days of hospital stay. The total CDI related disease management cost was nearly doubled at US$12.4 (Range: $3.7–$14.4) billion in 2015 (Table 6). A sensitivity analysis showed that the total CDI-attributable cost ranged from $1.31 to $13.61, which covers our estimates (Additional file 1).
Table 6.
Total cost of CDI management in US
| Total number of HCF CDI cases per year (2011) [25] | Mean | 95 % CI | |
|---|---|---|---|
| All population ≥2 years Median | 293,300 | 264,200 | 322,500 |
| Adults ≥18 Upper boundary | 288,900 | 261,100 | 316,700 |
| Adults ≥18 Lower boundary | 133,887 | 91,780 | 195,402 |
| Cost per CDI case management (2015 US$) | Weighted Mean | 90 % CI | |
| Overall CDI-attributable cost | 21,448 | 21,152 | 21,744 |
| Overall CDI-related cost | 42,316 | 39,886 | 44,765 |
| Total cost per year (in Billions, 2015 US$) | Weighted Mean | Range | |
| Total CDI-attributable cost per year | 6.29 | 1.94 | 7.01 |
| Mean | 6.29 | 5.59 | 7.01 |
| Upper boundary | 6.19 | 5.52 | 6.88 |
| Lower boundary | 2.87 | 1.94 | 4.25 |
| Total CDI-related cost per year | 12.41 | 3.66 | 14.44 |
| Mean | 12.41 | 5.59 | 14.44 |
| Upper boundary | 12.25 | 10.41 | 14.18 |
| Lower boundary | 5.67 | 3.66 | 8.75 |
Abbreviations: HCF healthcare facility, CDI clostridium difficile infection, CI confidence intervals
Quality assessment
A summary of the quality assessment for statistical methods in included studies is shown in Additional file 1. There were 13 studies of high quality, 21 studies with medium quality and 8 low quality studies.
Discussion
We systematically reviewed 42 published cost studies of CDI case management in the past 10 years (2005–2015) and found a significant financial burden associated with CDI in the US. The total CDI-attributable cost was US$6.3 billion, which is higher than previously reported (range US$1.1–4.8 billion) [14, 16, 17]. The mean cost for CDI-attributable hospitalized patients per case was US$21,448, nearly half of the mean CDI-related inpatient cost.
This review facilitated a meta-analysis of a large number of cost studies for costs related to CDI management and provided an uncertainty range. Zimlichman et al [17] applied this method to calculate CDI cost based on cost data from two cost-of-illness studies (O’Brian 2007 [51] & Kyne 2002 [69]) and obtained a lower cost [2012US $11,285 ($9118–$13,574)] than ours. Our review combined 100-point estimates and ranges from 42 individual studies, which provided more accurate and comprehensive data of the cost result. Despite the methodological heterogeneity in perspectives, treatment procedure and statistical analysis, each included study met our inclusion criteria, which were defined to identify studies that provided real world estimates of costs, therefore the combination of these data with uncertainty range represented a valuable and reliable summary of CDI-related cost.
Furthermore, we evaluated hospital onset CDI and community onset CDI separately. We found that CDI complicating hospitalization cost more than CDI requiring hospitalization and the former had longer attributable hospital stay. Therefore, other factors, such as comorbidity, may contribute to infections and increase the difficulty of CDI treatment.
We estimated that the total cost attributable to CDI management in the US was nearly US$6.3 (Range: $1.9–$7.0) billion, which is similar to Dubberke and Olsen’s estimates at $4.8 billion [14], but significantly higher than other studies (US$ 1.5 billion in Zimlichman et al [17] and $1.1 billion in Ghantoji et al [16]). The later studies reported lower attributable cost per case based on a limited number of studies before 2005, which arguably is out-of-date. To compare with the latest review on global CDI cost (Nanwa et al [26]), this review identified 8 additional studies with recent data. Nanwa et al [26] found that the mean attributable CDI costs ranged from US$8911 to US$30,049, which is similar to our results.
In this study, we only assessed the quality of study emphasizing statistical methods and did not use the modified economic evaluation guideline as other COI systematic reviews. Cost and LOS estimation of healthcare-associated infections has the potential to be misleading if the confounders such as patients’ comorbidities or daily severity of illness were not properly controlled for. Using either the matching design or multivariable regression analysis allows to control known confounders and may, in part, address selection bias [70]. We found that whether advanced statistical methods were used and described was crucial for the assessment of data quality, which has not be fully captured by the existing quality assessment tool. Therefore in this study we assessed quality of included studies using this new method. Moreover, Nanwa et al [26] has evaluated the methodological completeness of most included studies (34 out of 42); we agree with their recommendations regarding possible improvement of future cost-of-illness study. However, we need to bear in mind that cost effects or excess LOS are still likely to be overestimated if the interval to onset of HAI is not properly accounted for in the study design or analysis [70].
Our systematic review has some limitations. First, all included studies reported direct medical costs from hospital perspective, therefore indirect cost to patients and society and costs of additional care after hospital discharge, have not been captured. No studies reported indirect cost (productivity loss due to work day losses) of patients or care-givers, and we failed to identify studies assessing cost of CDI in long-term care facilities, where about 9 % of CDI patients were discharged to for an average of 24 days of after-care. This would result in an additional US$141 million burden on the healthcare system and society due to LTCF transfers [14]. Second, we did not separate primary CDI from recurrent CDI cost in our review because only two studies reported cost specifically to recurrent CDI $12,592 (Range: $9752, $15,919) [2]. Moreover, we found it difficult to exactly match the CDI case definition in cost study (e.g. ICD10 Code primary diagnosis and secondary diagnosis) with the case definition in epidemiology studies (e.g. community onset, hospital onset), therefore we did not estimate CDI patients managed at outpatient and community settings due to lack of both epidemiology and economic data. The total costs of CDI management may be higher than our current estimate. Fourth, unlike other published reviews, we did not include cost studies from countries other than the US nor facilitate any international comparison. This study initially aimed to identify cost-of-illness studies in North America, but we did not find any studies reporting cost data from Canada. This is likely because we restricted our search to English language databases. Therefore the cost of CDI management in Canada remains unknown. However, we did not apply any language restrictions to the current review.
Effective prevention can reduce the burden of diseases. Strategies have been promoted such as appropriate use of antimicrobials, use of contact precautions and protective personal equipment to care for infected patients, effective cleaning and disinfection of equipment and the environment, and early recognition of disease as primary prophylaxis [71]. As CDI is an infectious disease, the population at risk would benefit from an effective vaccine, which is currently under development [72, 73].
More cost of illness studies for recurrent CDI, or in LTCF, and indirect cost from a societal perspective are needed in the future. We would also recommend that published studies report their methods and include point estimates with uncertainty range. Further economic studies for CDI preventive interventions are needed.
Conclusion
This review indicates that CDI places a significant financial burden on the US healthcare system. In addition, our findings suggest that the economic burden of CDI is greater than previously reported in the US. This review provides strong evidence to aid policy-making on adequate resource allocation to CDI prevention and treatment in US.
Acknowledgements
We gratefully acknowledge the comments and suggestions from Guy De Bruyn, Clarisse Demont, Kinga Borsos (Sanofi Pasteur) during manuscript preparation. We thank Sanofi Pasteur for financial support for this work. The findings and conclusions in this report are those of the authors and do not necessarily represent the official views or policies of Sanofi Pasteur.
Funding
Sanofi Pasteur funded this study.
Availability of data and materials
The datasets supporting the conclusions of this article are included within the article and its Additional file 2.
Authors’ contributions
Study design (MK, HN, AC); data collection (SZ, SP, EB); data analysis (SZ, EB); data interpretation (SZ, EB, HN, AC, MK); development of initial draft manuscript (SZ, EB, HN), critical revisions for intellectual content of manuscript (SZ, SP, EB, HN, AC, MK); study supervision (HN, MK). All authors reviewed and approved the final draft of manuscript.
Competing interests
SP, AC, MK are employees of Sanofi Pasteur.
Consent for publication
Not applicable.
Ethics approval and consent to participate
Not applicable.
Abbreviations
- CDI
clostridium difficile infection
- CIs
confidence intervals
- CO CDI
community-onset CDI
- HCF
healthcare facility
- HIV
human immunodeficiency virus
- HO-CDI
hospital-onset cdi
- ICD-9-CM
the international classification of diseases, ninth revision, clinical modification
- ICUs
intensive care units
- IQR
interquantile range
- LTCF
long-term care facility
- NIS
national independent sample
- SD
standard deviation
- US
United States
Additional files
Appendices-cdiff cost review.docx; Addpendix 1–5; Appendix 1. Embase and Medline searches for each topic of interest (13th July 2015) , Appendix 2. Inclusion and exclusion criteria, Appendix 3. Statistical methods used in selected studies and quality assessment Appendix, 4. Total number of CDI cases in United States 2011, Appendix 5. Sensitivity analysis results (DOCX 101 kb)
CDI Cost Review.xlsx; CDI cost review; CDI cost review data extraction primary results (XLSX 529 kb)
Contributor Information
Shanshan Zhang, Email: Shanshan.zhang@ed.ac.uk.
Sarah Palazuelos-Munoz, Email: Sarah.Palazuelos2@sanofipasteur.com.
Evelyn M. Balsells, Email: e.balsells@ed.ac.uk
Harish Nair, Email: Harish.Nair@ed.ac.uk.
Ayman Chit, Email: Ayman.Chit@sanofipasteur.com.
Moe H. Kyaw, Email: Moe.Kyaw@sanofipasteur.com
References
- 1.Crobach M, Dekkers O, Wilcox M, Kuijper E. European Society of Clinical Microbiology and Infectious Diseases (ESCMID): data review and recommendations for diagnosing Clostridium difficile-infection (CDI) Clin Microbiol Infect. 2009;15(12):1053–1066. doi: 10.1111/j.1469-0691.2009.03098.x. [DOI] [PubMed] [Google Scholar]
- 2.Dubberke ER, Carling P, Carrico R, et al. Strategies to prevent clostridium difficile infections in acute care hospitals: 2014 update. Infect Control Hosp Epidemiol. 2014;35(SUPPL2):628–645. doi: 10.1086/522262. [DOI] [PubMed] [Google Scholar]
- 3.Mylonakis E, Ryan E, Calderwood S. Clostridium difficile—Associated diarrhea: A review. Arch Intern Med. 2001;161(4):525–533. doi: 10.1001/archinte.161.4.525. [DOI] [PubMed] [Google Scholar]
- 4.Rubin M, Bodenstein L, Kent K. Severe Clostridium difficile colitis. Dis Colon Rectum. 1995;38(4):350–354. doi: 10.1007/BF02054220. [DOI] [PubMed] [Google Scholar]
- 5.Triadafilopoulos G, Hallstone AE. Acute abdomen as the first presentation of pseudomembranous colitis. Gastroenterology. 1991;101(3):685–691. doi: 10.1016/0016-5085(91)90526-Q. [DOI] [PubMed] [Google Scholar]
- 6.Sanchez T, Brooks J, Sullivan P, et al. Bacterial diarrhea in persons with HIV infection, United States, 1992–2002. Clin Infect Dis. 2005;41(11):1621–1627. doi: 10.1086/498027. [DOI] [PubMed] [Google Scholar]
- 7.Bilgrami S, Feingold J, Dorsky D, et al. Incidence and outcome of Clostridium difficile infection following autologous peripheral blood stem cell transplantation. Bone Marrow Transplant. 1999;23(10):1039–1042. doi: 10.1038/sj.bmt.1701773. [DOI] [PubMed] [Google Scholar]
- 8.Barbut F, Corthier G, Charpak Y, et al. Prevalence and pathogenicity of Clostridium difficile in hospitalized patients. A French multicenter study. Arch Intern Med. 1996;156(13):1449–1454. doi: 10.1001/archinte.1996.00440120107012. [DOI] [PubMed] [Google Scholar]
- 9.Cohen S, Gerding D, Johnson S, et al. Clinical practice guidelines for Clostridium difficile infection in adults: 2010 update by the society for healthcare epidemiology of America (SHEA) and the infectious diseases society of America (IDSA) Infect Control Hosp Epidemiol. 2010;31(5):431–455. doi: 10.1086/651706. [DOI] [PubMed] [Google Scholar]
- 10.Bignardi G. Risk factors for Clostridium difficile infection. J Hosp Infect. 1998;40(1):1–15. doi: 10.1016/S0195-6701(98)90019-6. [DOI] [PubMed] [Google Scholar]
- 11.Aseeri M, Schroeder T, Kramer J, Zackula R. Gastric acid suppression by proton pump inhibitors as a risk factor for clostridium difficile-associated diarrhea in hospitalized patients. Am J Gastroenterol. 2008;103(9):2308–2313. doi: 10.1111/j.1572-0241.2008.01975.x. [DOI] [PubMed] [Google Scholar]
- 12.Bauer M, Notermans D, van Benthem B, et al. Clostridium difficile infection in Europe: a hospital-based survey. Lancet. 2011;377(9759):63–73. doi: 10.1016/S0140-6736(10)61266-4. [DOI] [PubMed] [Google Scholar]
- 13.Dubberke ER, Wertheimer AI. Review of current literature on the economic burden of Clostridium difficile infection. Infect Control Hosp Epidemiol. 2009;30(1):57–66. doi: 10.1086/592981. [DOI] [PubMed] [Google Scholar]
- 14.Dubberke ER, Olsen MA. Burden of Clostridium difficile on the healthcare system. Clin Infect Dis. 2012;55(Suppl 2):S88–S92. doi: 10.1093/cid/cis335. [DOI] [PMC free article] [PubMed] [Google Scholar]
- 15.Gabriel L, Beriot-Mathiot A. Hospitalization stay and costs attributable to Clostridium difficile infection: a critical review. J Hosp Infect. 2014;88(1):12–21. doi: 10.1016/j.jhin.2014.04.011. [DOI] [PubMed] [Google Scholar]
- 16.Ghantoji SS, Sail K, Lairson DR, Dupont HL, Garey KW. Economic healthcare costs of Clostridium difficile infection: a systematic review. J Hosp Infect. 2010;74(4):309–318. doi: 10.1016/j.jhin.2009.10.016. [DOI] [PubMed] [Google Scholar]
- 17.Zimlichman E, Henderson D, Tamir O, et al. Health care-associated infections: a meta-analysis of costs and financial impact on the US health care system. JAMA Intern Med. 2013;173(22):2039–2046. doi: 10.1001/jamainternmed.2013.9763. [DOI] [PubMed] [Google Scholar]
- 18.Johnson S. Recurrent Clostridium difficile infection: A review of risk factors, treatments, and outcomes. J Infect. 2009;58(6):403–410. doi: 10.1016/j.jinf.2009.03.010. [DOI] [PubMed] [Google Scholar]
- 19.Mergenhagen KA, Wojciechowski AL, Paladino JA. A review of the economics of treating Clostridium difficile infection. Pharmacoeconomics. 2014;32(7):639–650. doi: 10.1007/s40273-014-0161-y. [DOI] [PubMed] [Google Scholar]
- 20.Wiegand PN, Nathwani D, Wilcox MH, Stephens J, Shelbaya A, Haider S. Clinical and economic burden of Clostridium difficile infection in Europe: a systematic review of healthcare-facility-acquired infection. J Hosp Infect. 2012;81(1):1–14. doi: 10.1016/j.jhin.2012.02.004. [DOI] [PubMed] [Google Scholar]
- 21.Bouza E. Consequences of Clostridium difficile infection: understanding the healthcare burden. Clin Microbiol Infect. 2012;18(Suppl 6):5–12. doi: 10.1111/1469-0691.12064. [DOI] [PubMed] [Google Scholar]
- 22.[Accessed November 9, 2015] Cost-to-charge ratio files. Healthcare Cost and Utilization Project Web site. http://www.hcup-us.ahrq.gov/db/state/costtocharge.jsp.
- 23.Jha A, Chan D, Ridgway A, Franz C, Bates DW. Improving Safety And Eliminating Redundant Tests: Cutting Costs In U.S. Hospitals. Health Aff. 2009;28(5):1475–1484. doi: 10.1377/hlthaff.28.5.1475. [DOI] [PubMed] [Google Scholar]
- 24.Lessa FC, Winston LG, McDonald LC, Emerging Infections Program C. difficile Surveillance Team Burden of Clostridium difficile infection in the United States. N Engl J Med. 2015;372(24):2369–2370. doi: 10.1056/NEJMc1505190. [DOI] [PMC free article] [PubMed] [Google Scholar]
- 25.Hernández EB, Nair H, Campbell H, Kyaw M. Global burden of healthcare- and community- C. difficile-associated disease-systematic review and meta-analysis (unpublisehd report). University of Edinburgh; 2015.
- 26.Nanwa N, Kendzerska T, Krahn M, et al. The economic impact of Clostridium difficile infection: a systematic review. Am J Gastroenterol. 2015;110(4):511–519. doi: 10.1038/ajg.2015.48. [DOI] [PubMed] [Google Scholar]
- 27.Ali M, Ananthakrishnan AN, Ahmad S, Kumar N, Kumar G, Saeian K. Clostridium difficile infection in hospitalized liver transplant patients: a nationwide analysis. Liver Transpl. 2012;18(8):972–978. doi: 10.1002/lt.23449. [DOI] [PMC free article] [PubMed] [Google Scholar]
- 28.Ananthakrishnan AN, Mcginley EL, Binion DG. Excess hospitalisation burden associated with Clostridium difficile in patients with inflammatory bowel disease. Gut. 2008;57(2):205–210. doi: 10.1136/gut.2007.128231. [DOI] [PubMed] [Google Scholar]
- 29.Arora V, Kachroo S, Ghantoji SS, Dupont HL, Garey KW. High Horn’s index score predicts poor outcomes in patients with Clostridium difficile infection. J Hosp Infect. 2011;79(1):23–26. doi: 10.1016/j.jhin.2011.04.027. [DOI] [PubMed] [Google Scholar]
- 30.Bajaj JS, Ananthakrishnan AN, Hafeezullah M, et al. Clostridium difficile is associated with poor outcomes in patients with cirrhosis: A national and tertiary center perspective. Am J Gastroenterol. 2010;105(1):106–113. doi: 10.1038/ajg.2009.615. [DOI] [PubMed] [Google Scholar]
- 31.Campbell R, Dean B, Nathanson B, Haidar T, Strauss M, Thomas S. Length of stay and hospital costs among high-risk patients with hospital-origin Clostridium difficile-associated diarrhea. J Med Econ. 2013;16(3):440–448. doi: 10.3111/13696998.2013.770749. [DOI] [PubMed] [Google Scholar]
- 32.Damle RN, Cherng NB, Flahive JM, et al. Clostridium difficile infection after colorectal surgery: a rare but costly complication. J Gastrointest Surg. 2014;18(10):1804–1811. doi: 10.1007/s11605-014-2600-7. [DOI] [PubMed] [Google Scholar]
- 33.Dubberke ER, Reske KA, Olsen MA, McDonald LC, Fraser VJ. Short- and long-term attributable costs of Clostridium difficile-associated disease in nonsurgical inpatients. Clin Infect Dis. 2008;46(4):497–504. doi: 10.1086/526530. [DOI] [PubMed] [Google Scholar]
- 34.Dubberke ER, Schaefer E, Reske KA, Zilberberg M, Hollenbeak CS, Olsen MA. Attributable inpatient costs of recurrent Clostridium difficile infections. Infect Control Hosp Epidemiol. 2014;35(11):1400–1407. doi: 10.1086/678428. [DOI] [PubMed] [Google Scholar]
- 35.Egorova NN, Siracuse JJ, Mckinsey JF, Nowygrod R. Trend, risk factors, and costs of clostridium difficile infections in vascular surgery. Ann Vasc Surg. 2015;29(4):792–800. doi: 10.1016/j.avsg.2014.10.031. [DOI] [PubMed] [Google Scholar]
- 36.Flagg A, Koch CG, Schiltz N, et al. Analysis of Clostridium difficile infections after cardiac surgery: epidemiologic and economic implications from national data. J Thorac Cardiovasc Surg. 2014;148(5):2404–2409. doi: 10.1016/j.jtcvs.2014.04.017. [DOI] [PubMed] [Google Scholar]
- 37.Fuller RL, McCullough EC, Bao MZ, Averill RF. Estimating the Costs of Potentially Preventable Hospital Acquired Complications. Health Care Financ Rev. 2009;30(4):17–32. [PMC free article] [PubMed] [Google Scholar]
- 38.Glance LG, Stone PW, Mukamel DB, Dick AW. Increases in mortality, length of stay, and cost associated with hospital-acquired infections in trauma patients. Arch Surg. 2011;146(7):794–801. doi: 10.1001/archsurg.2011.41. [DOI] [PMC free article] [PubMed] [Google Scholar]
- 39.Jiang Y, Viner-Brown S, Baier R. Burden of hospital-onset Clostridium difficile infection in patients discharged from Rhode Island hospitals, 2010–2011: application of present on admission indicators. Infect Control Hosp Epidemiol. 2013;34(7):700–708. doi: 10.1086/670993. [DOI] [PubMed] [Google Scholar]
- 40.Kim SP, Shah ND, Karnes RJ, et al. The implications of hospital acquired adverse events on mortality, length of stay and costs for patients undergoing radical cystectomy for bladder cancer. J Urol. 2012;187(6):2011–2017. doi: 10.1016/j.juro.2012.01.077. [DOI] [PubMed] [Google Scholar]
- 41.Kuntz JL, Johnson ES, Raebel MA, et al. Epidemiology and healthcare costs of incident Clostridium difficile infections identified in the outpatient healthcare setting. Infect Control Hosp Epidemiol. 2012;33(10):1031–1038. doi: 10.1086/667733. [DOI] [PubMed] [Google Scholar]
- 42.Lagu T, Stefan MS, Haessler S, et al. The impact of hospital-onset Clostridium difficile infection on outcomes of hospitalized patients with sepsis. J Hosp Med (Online) 2014;9(7):411–417. doi: 10.1002/jhm.2199. [DOI] [PMC free article] [PubMed] [Google Scholar]
- 43.Lemaire A, Dombrovskiy V, Batsides G, et al. The Effect of Clostridium difficile Infection on Cardiac Surgery Outcomes. Surg Infect (Larchmt) 2015;16(1):24–28. doi: 10.1089/sur.2013.097. [DOI] [PubMed] [Google Scholar]
- 44.Lawrence SJ, Puzniak LA, Shadel BN, Gillespie KN, Kollef MH, Mundy LM. Clostridium difficile in the intensive care unit: epidemiology, costs, and colonization pressure. Infect Control Hosp Epidemiol. 2007;28(2):123–130. doi: 10.1086/511793. [DOI] [PubMed] [Google Scholar]
- 45.Lesperance K, Causey MW, Spencer M, Steele SR. The morbidity of Clostridium difficile infection after elective colonic resection-results from a national population database. Am J Surg. 2011;201(2):141–148. doi: 10.1016/j.amjsurg.2010.09.017. [DOI] [PubMed] [Google Scholar]
- 46.Lipp MJ, Nero DC, Callahan MA. Impact of hospital-acquired Clostridium difficile. J Gastroenterol Hepatol. 2012;27(11):1733–1737. doi: 10.1111/j.1440-1746.2012.07242.x. [DOI] [PubMed] [Google Scholar]
- 47.Maltenfort MG, Rasouli MR, Morrison TA, Parvizi J. Clostridium difficile colitis in patients undergoing lower-extremity arthroplasty: rare infection with major impact. Clin Orthop Relat Res. 2013;471(10):3178–3185. doi: 10.1007/s11999-013-2906-x. [DOI] [PMC free article] [PubMed] [Google Scholar]
- 48.Mcglone SM, Bailey RR, Zimmer SM, et al. The economic burden of Clostridium difficile. Clin Microbiol Infect. 2012;18(3):282–289. doi: 10.1111/j.1469-0691.2011.03571.x. [DOI] [PMC free article] [PubMed] [Google Scholar]
- 49.Nguyen GC, Kaplan GG, Harris ML, Brant SR. A national survey of the prevalence and impact of Clostridium difficile infection among hospitalized inflammatory bowel disease patients. Am J Gastroenterol. 2008;103(6):1443–1450. doi: 10.1111/j.1572-0241.2007.01780.x. [DOI] [PubMed] [Google Scholar]
- 50.Nylund CM, Goudie A, Garza JM, Fairbrother G, Cohen MB. Clostridium difficile infection in hospitalized children in the United States. Arch Pediatr Adolesc Med. 2011;165(5):451–457. doi: 10.1001/archpediatrics.2010.282. [DOI] [PMC free article] [PubMed] [Google Scholar]
- 51.O’Brien JA, Lahue BJ, Caro JJ, Davidson DM. The emerging infectious challenge of clostridium difficile-associated disease in Massachusetts hospitals: clinical and economic consequences. Infect Control Hosp Epidemiol. 2007;28(11):1219–1227. doi: 10.1086/522676. [DOI] [PubMed] [Google Scholar]
- 52.Pakyz A, Carroll NV, Harpe SE, Oinonen M, Polk RE. Economic impact of Clostridium difficile infection in a multihospital cohort of academic health centers. Pharmacotherapy: J Hum Pharmacol Drug Ther. 2011;31(6):546–551. doi: 10.1592/phco.31.6.546. [DOI] [PubMed] [Google Scholar]
- 53.Pant C, Anderson MP, O’Connor JA, Marshall CM, Deshpande A, Sferra TJ. Association of Clostridium difficile infection with outcomes of hospitalized solid organ transplant recipients: results from the 2009 Nationwide Inpatient Sample database. Transpl Infect Dis. 2012;14(5):540–547. doi: 10.1111/j.1399-3062.2012.00761.x. [DOI] [PubMed] [Google Scholar]
- 54.Pant C, Deshpande A, Anderson MP, Sferra TJ. Clostridium difficile infection is associated with poor outcomes in end-stage renal disease. J Investig Med. 2012;60(2):529–532. doi: 10.2310/JIM.0b013e318242b313. [DOI] [PubMed] [Google Scholar]
- 55.Pant C, Anderson MP, Deshpande A, et al. Health care burden of Clostridium difficile infection in hospitalized children with inflammatory bowel disease. Inflamm Bowel Dis. 2013;19(5):1080–1085. doi: 10.1097/MIB.0b013e3182807563. [DOI] [PubMed] [Google Scholar]
- 56.Peery AF, Dellon ES, Lund J, et al. Burden of gastrointestinal disease in the United States: 2012 update. Gastroenterol. 2012;143(5):1179–1187. doi: 10.1053/j.gastro.2012.08.002. [DOI] [PMC free article] [PubMed] [Google Scholar]
- 57.Quimbo RA, Palli SR, Singer J, Strauss ME, Thomas SM. Burden of Clostridium difficile-associated diarrhea among hospitalized patients at high risk of recurrent infection. J Clin Outcomes Manag. 2013;20(12):544–554. [Google Scholar]
- 58.Reed IJF, Edris BA, Eid S, Molitoris A. Clostridium difficile: the new epidemic. Int J Infect Dis. 2009;7(1):1–5. [Google Scholar]
- 59.Sammons JS, Localio R, Xiao R, Coffin SE, Zaoutis T. Clostridium difficile infection is associated with increased risk of death and prolonged hospitalization in children. Clin Infect Dis. 2013;57(1):1–8. doi: 10.1093/cid/cit155. [DOI] [PMC free article] [PubMed] [Google Scholar]
- 60.Singal AK, Salameh H, Kamath PS. Prevalence and in-hospital mortality trends of infections among patients with cirrhosis: a nationwide study of hospitalised patients in the United States. Aliment Pharmacol Ther. 2014;40(1):105–112. doi: 10.1111/apt.12797. [DOI] [PubMed] [Google Scholar]
- 61.Song X, Bartlett JG, Speck K, Naegeli A, Carroll K, Perl TM. Rising economic impact of clostridium difficile-associated disease in adult hospitalized patient population. Infect Control Hosp Epidemiol. 2008;29(9):823–828. doi: 10.1086/588756. [DOI] [PubMed] [Google Scholar]
- 62.Stewart DB, Hollenbeak CS. Clostridium difficile colitis: factors associated with outcome and assessment of mortality at a national level. J Gastrointest Surg. 2011;15(9):1548–1555. doi: 10.1007/s11605-011-1615-6. [DOI] [PubMed] [Google Scholar]
- 63.Tabak YP, Zilberberg MD, Johannes RS, Sun X, McDonald LC. Attributable burden of hospital-onset Clostridium difficile infection: a propensity score matching study. Infect Control Hosp Epidemiol. 2013;34(6):588–596. doi: 10.1086/670621. [DOI] [PubMed] [Google Scholar]
- 64.Verlee KE, Finks JL, Wilkins MJ, Wells EV. Michigan Clostridium difficile hospital discharges: frequency, mortality, and charges, 2002–2008. Public Health Rep. 2012;127(1):62–71. doi: 10.1177/003335491212700107. [DOI] [PMC free article] [PubMed] [Google Scholar]
- 65.Wang L, Stewart DB. Increasing hospital costs for Clostridium difficile colitis: type of hospital matters. Surgery. 2011;150(4):727–735. doi: 10.1016/j.surg.2011.08.019. [DOI] [PubMed] [Google Scholar]
- 66.Wilson MZ, Hollenbeak CS, Stewart DB. Impact of Clostridium difficile colitis following closure of a diverting loop ileostomy: results of a matched cohort study. Colorectal Dis. 2013;15(8):974–981. doi: 10.1111/codi.12128. [DOI] [PubMed] [Google Scholar]
- 67.Zerey M, Paton BL, Lincourt AE, Gersin KS, Kercher KW, Heniford BT. The burden of Clostridium difficile in surgical patients in the United States. Surg Infect (Larchmt) 2007;8(6):557–566. doi: 10.1089/sur.2006.062. [DOI] [PubMed] [Google Scholar]
- 68.Zilberberg MD, Nathanson BH, Sadigov S, Higgins TL, Kollef MH, Shorr AF. Epidemiology and outcomes of clostridium difficile-associated disease among patients on prolonged acute mechanical ventilation. Chest. 2009;136(3):752–758. doi: 10.1378/chest.09-0596. [DOI] [PubMed] [Google Scholar]
- 69.Kyne L, Hamel M, Polavaram R, Kelly C. Health care costs and mortality associated with nosocomial diarrhea due to Clostridium difficile. Clin Infect Dis. 2002;34(3):346–353. doi: 10.1086/338260. [DOI] [PubMed] [Google Scholar]
- 70.de Angelis G, Murthy AR, Beyersmann J, Harbarth S. Estimating the impact of healthcare-associated infections on length of stay and costs. Clin Microbiol Infect. 2010;16(12):1729–1735. doi: 10.1111/j.1469-0691.2010.03332.x. [DOI] [PubMed] [Google Scholar]
- 71.Dubberke E, Carling P, Carrico R, et al. Strategies to Prevent Clostridium difficile Infections in Acute Care Hospitals: 2014 Update. Infect Control Hosp Epidemiol. 2014;35(6):628–645. doi: 10.1086/522262. [DOI] [PubMed] [Google Scholar]
- 72.Bruyn Gd, Foglia G, Saleh J, Workman D, Pollak R, Gesser R. A phase II study of the safety and immunogenicity of different vaccination schedules of a candidate clostridium difficile toxoid vaccine: vaccination schedule selection for phase III 24th Annual Meeting of the European Congress of Clinical Microbiology and Infectious Diseases (ECCMID); 2014; Barcelona, Spain; 2014.
- 73.Foglia G, Shah S, Luxemburger C, Pietrobon PJF. Clostridium difficile: Development of a novel candidate vaccine. Vaccine. 2012;30(29):4307–4309. doi: 10.1016/j.vaccine.2012.01.056. [DOI] [PubMed] [Google Scholar]
Associated Data
This section collects any data citations, data availability statements, or supplementary materials included in this article.
Data Availability Statement
The datasets supporting the conclusions of this article are included within the article and its Additional file 2.