Figure 1.
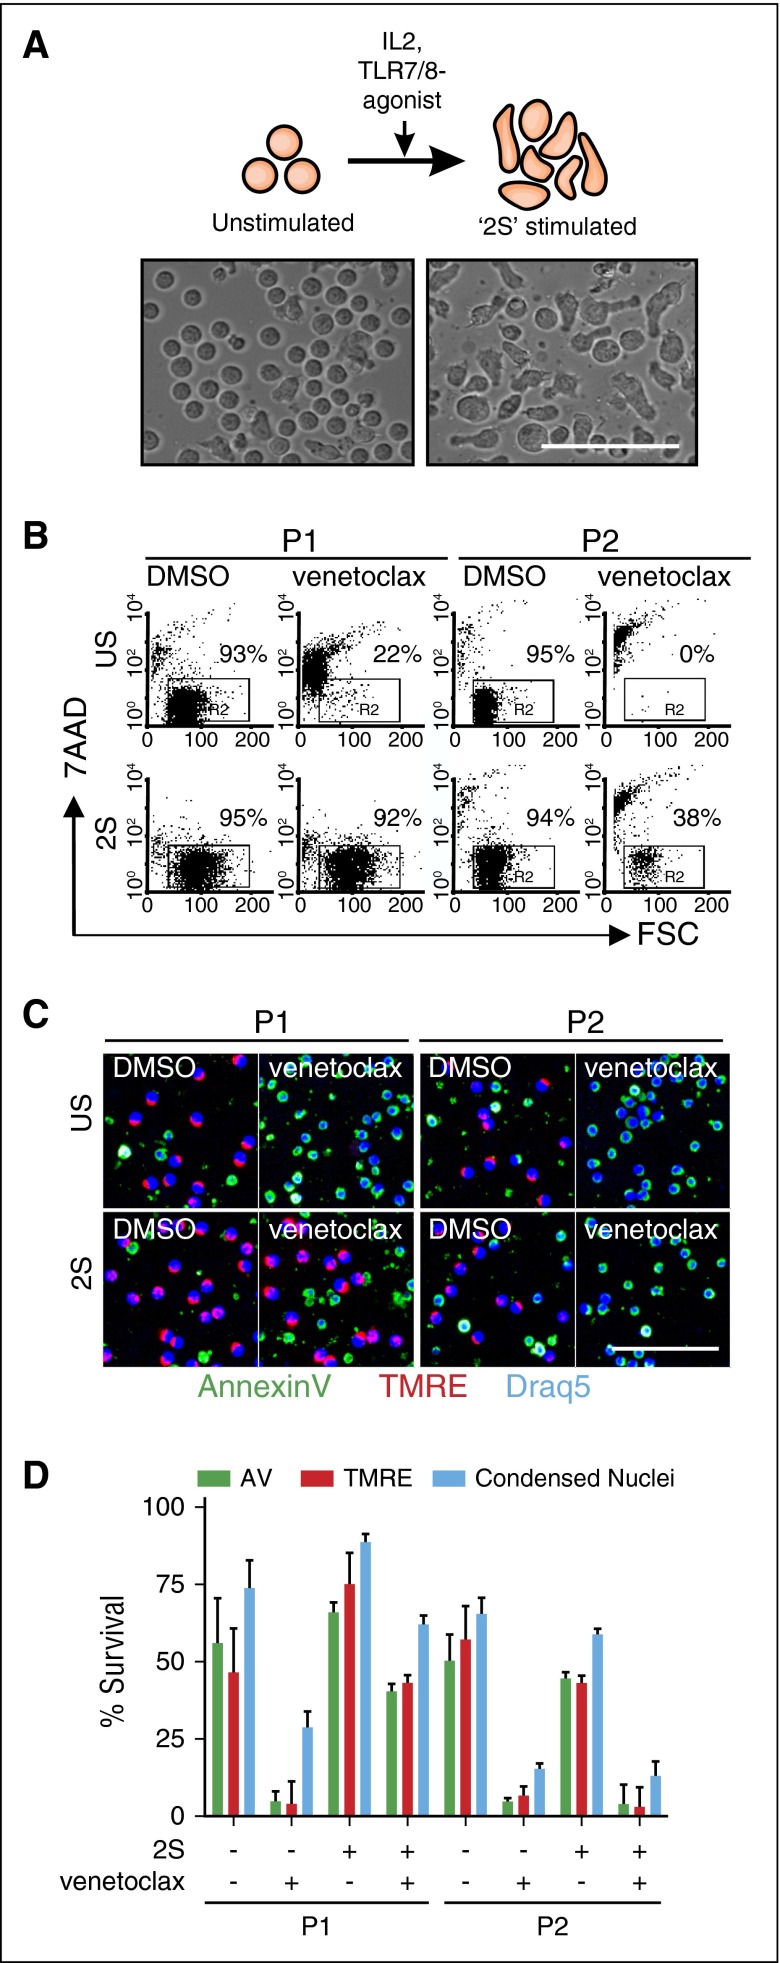
Resistance to venetoclax induced by microenvironmental signals. (A) Schematic model of CLL cell activation by the tumor microenvironment and corresponding bright-field images. CLL cells derived from peripheral blood (unstimulated [US]) change morphology and proliferate in vitro in response to IL2 (500 U/mL) and the Toll-like receptor-7/8 agonist Resiquimod (1 µg/mL) (“2S” stimulated). Phase-contrast micrographs of cells incubated and imaged (EVOS FL automicroscope [Life Technologies] with a 40× LPlan FLPH objective [AMG EP4683]) in serum-free AIM-V culture media (scale bar, 50 μm). (B) Flow cytometric analysis of cell 7-aminoactinomycin D (7AAD) staining (viability) for US (top panel) and 2S cells (2S; bottom panel) from 2 representative patients (P1, P2) cultured with or without venetoclax (10 nM) for 48 hours after addition of drug. The percentages of viable cells that exclude 7AAD (7AAD−, enclosed box R2) are shown in the dot plots as numbers. (C) Image-based detection of cell death and survival. US (top panels) and 2S-stimulated (2S; bottom panels) CLL cells from the patients in panel B were cultured with DMSO as a negative control or with venetoclax (10 nM) as indicated. After 72-hour incubation, cells were stained with standard fluorescence dyes for detection of apoptotic cell death (Annexin V conjugated to Alexa Fluor 488, green), mitochondrial membrane potential (TMRE, red), and nuclear size and morphology (Draq5, blue). Automated confocal fluorescence microscopy (Opera QEHS high-content screening system; PerkinElmer) was used to acquire 3 images from each well for 4 replicate wells of a 384-well imaging plate using a 20× 0.45 numerical aperture (NA) air lens at 37°C and 5% CO2. Representative images are shown (scale bar, 50 μm). (D) Cell survival determined by automated analysis of micrographs such as those in (C) for each of unstimulated (–2S) and stimulated cells (+2S) with or without venetoclax (10 nM) as indicated. Viability was defined by either the absence of Annexin V staining intensity (green bars), the presence of TMRE staining intensity (red bars), or the absence of condensed nuclei stained by Draq5 (blue bars). Error bars ± standard deviation (std dev), n = 12 fields of view (FOV). AV, Annexin V; FSC, forward scatter.

