Abstract
MyD88 is an essential adaptor protein, which mediates the signaling of the toll-like and interleukin-1 receptors’ superfamily. The MyD88 L252P (L265P) mutation has been identified in diffuse large B-cell lymphoma. The identification of this mutation has been a major advance in the diagnosis of patients with aldenstrom macroglobulinemia and related lymphoid neoplasms. Here we used computational methods to characterize the conformational effects of the mutation. Our molecular dynamics simulations revealed that the mutation allosterically quenched the global conformational dynamics of the toll/IL-1R (TIR) domain, and readjusted its salt bridges and dynamic community network. Specifically, the mutation changed the orientation and reduced the fluctuation of α-helix 3, possibly through eliminating/weakening ~8 salt bridges and enhancing the salt bridge D225-K258. Using the energy landscape of the TIR domains of MyD88, we identified two dynamic conformational basins, which correspond to the binding sites used in homo- and hetero-oligomerization, respectively. Our results indicate that the mutation stabilizes the core of the homo-dimer interface of the MyD88-TIR domain, and increases the population of homo-dimer-compatible conformational states in MyD88 family proteins. However, the dampened motion restricts its ability to heterodimerize with other TIR domains, thereby curtailing physiological signaling. In conclusion, the L252P both shifts the landscape toward homo-dimerization and restrains the dynamics of the MyD88-TIR domain, which disfavors its hetero-dimerization with other TIR domains. We further put these observations within the framework of MyD88-mediated cell signaling.
Keywords: MyD88, TIR domain, TLR, inflammation, protein dynamics
Introduction
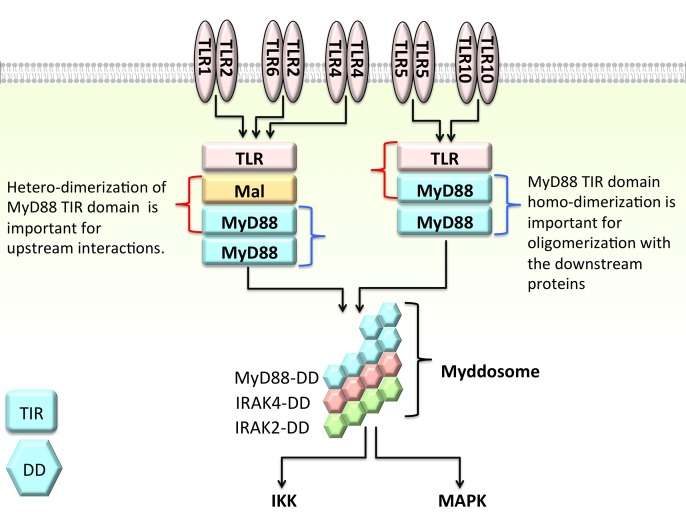
MyD88 is the canonical adaptor for inflammatory signaling pathways downstream of members of the toll-like receptor (TLR) and interleukin-1 (IL-1) receptor families (Deguine and Barton, 2014). It is composed of three main domains: a death domain (DD) (54–109), intermediate domain (INT) (110–155) and toll-interleukin-1 receptor (TIR) domain (159–296). When TLRs are activated, they form homo- or hetero-dimers through their extracellular leucine rich repeats and cytoplasmic TIR domains (Botos et al., 2011). Activated TLRs recruit other TIR domain-containing adaptor proteins: either Mal and MyD88 or TRAM and TRIF to form a large multimolecular ‘TIR domain signalosome’ structure. Some TLRs use Mal as a bridge between themselves and MyD88 (Ohnishi et al., 2009; Valkov et al., 2011). Similarly, some TLRs employ TRAM as an intermediate to bind to TRIF (Gay et al., 2014). Both Mal (Valkov et al., 2011; Bovijn et al., 2013) and MyD88 (Burns et al., 1998; Loiarro et al., 2013) are suggested to be in the dimeric form in the signalosome in order to facilitate the binding of the downstream proteins. In a recent study, Guven-Maiorov et al. (2015) proposed signalosome models for both MyD88- and TRIF-dependent pathways. In their model, the MyD88-dependent signalosome is composed of a TLR4 dimer, two Mal dimers and four MyD88 dimers. All of the proteins in the signalosome are in homo- and hetero-dimer forms: TLR4 dimerizes with itself and with Mal; Mal dimerizes with itself, with TLR4 and with MyD88; and MyD88 forms the dimer with itself and with Mal. While its TIR domain assembles into the signalosome complex, its DD organizes into the myddosome complex, which is composed of six MyD88, four IRAK4 and four IRAK2 DDs (Lin et al., 2010). MyD88 homo-dimerization through its TIR domain is key to myddosome assembly since the myddosome cannot be formed when TIR domain dimerization is blocked by peptidomimetic compounds (Loiarro et al., 2013). Although the TIR domain is not involved directly in the myddosome, its oligomerization mode influences the myddosome. MyD88 hetero-dimerization is important for interactions with the upstream proteins such as Mal and TLRs; however, its homo-dimerization is important for the oligomerization of the downstream proteins (Fig. 1). MyD88 binds IRAK1 primarily through DD–DD interactions.
Fig. 1.
MyD88 is a key adaptor in TLR signaling. It has a TIR, a DD and an intermediate domain. Through its TIR domain, it forms homo- and hetero-dimers. Hetero-dimerization (shown with red curly bracket) of its TIR domain is important for interacting with upstream proteins, such as Mal and TLR. However, its homo-dimerization (blue curly bracket) is crucial for oligomerization with downstream proteins, such as IRAK4 and IRAK2. Although MyD88 interacts with IRAKs through its DD, the oligomerization mode of its TIR domain influences its interactions through the DD. Blocking the TIR domain dimerization by peptidomimetic compounds inhibits the myddosome formation through its DD (Loiarro et al., 2013).
Disruption of MyD88 results in suppression of the inflammatory microenvironment in gastric tumors, and TLR2/MyD88 signaling plays a role in maintenance of stemness in normal stem cells as well as in gastric tumor cells (Echizen et al., 2016). MyD88 is a frequently altered gene in many studies (Xia et al., 2015; Cani et al., 2016), with potentially clinically relevant hot spot gain-of-function mutations identified in 71% of diffuse large B-cell lymphomas and 25% of marginal zone lymphomas (Cani et al., 2016). During an HIV-1 infection, the HIV-1 tat protein leads to the engagement of both MyD88 and TRIF pathways and to the activation of the cytokines which is strongly implicated in the chronic activation and dysregulation of the immune system (Planes et al., 2016).
The MyD88 L252P (L265P) mutation has been identified in activated B-cell-like subtype of diffuse large B-cell lymphoma (ABC DLBCL). While many studies used L265P to denote the mutation (Ngo et al., 2011), recently the sequence has been renumbered to L252P to specify its position in amino acid sequence (Vyncke et al., 2016). Below we refer to this new numbering. It is a somatic mutation that has been identified in ~90% of Waldenström macroglobulinemia/lymphoplasmacytic lymphomas (Martinez-Lopez et al., 2015). Its identification has been a major advance in the diagnosis of these patients (Ngo et al., 2011; Landgren and Staudt, 2012; Treon et al., 2012; Treon and Hunter, 2013; Varettoni et al., 2013; Xu et al., 2013). The mutation triggers signaling by recruiting downstream proteins and forming the myddosome complex. In ABC DLBCL, L252P affects the association between MyD88 and phosphorylated IRAK1-containing signaling complex (Ngo et al., 2011). In cells bearing MyD88 L252P (L265P), a prominent, slow-migrating IRAK1 species co-immunoprecipitates with MyD88. In contrast to the mutant, wild-type (WT) MyD88 does not associate strongly with these IRAK1 isoforms. The mutant can coordinate the formation of a stable signaling complex containing phosphorylated IRAK1.
Mutated MyD88-TIR domains display an intrinsic propensity for augmented oligomerization and spontaneous formation of cytosolic myddosome aggregates in lymphoma cell lines, mimicking the effect of dimerized TIR domains. It can also recruit endogenous WT MyD88. The constitutive activity may be caused by allosteric oligomerization, and molecular dynamics (MD) simulations found that lymphoma-associated mutations decreased the flexibility of the region from Residues 267 to 287 (Avbelj et al., 2014). A recent mammalian two-hybrid system MAPPIT and saturation mutagenesis revealed the interaction sites on the MyD88-TIR domain for homo-oligomerization and for interaction with Mal and TLR4 (Vyncke et al., 2016). Three binding sites on the MyD88-TIR domain were suggested to be involved: Residues 195–203 for binding site 1 (BS1), 233–267 for binding site 2 (BS2) and 283–291 for binding site 3 (BS3). MyD88-TIR interacts via either asymmetrical BS1–BS3 interfaces or symmetrical BS2–BS2 interfaces (Vyncke et al., 2016). Earlier work found that Glu183, Ser244 and Arg288 are required for MyD88 dimerization and IL-1 signaling (Loiarro et al., 2013).
Despite these experimental and computational studies of the MyD88-TIR domain (Avbelj et al., 2014; Vyncke et al., 2016), how MyD88 L252P affects MyD88 dimerization and IL-1 signaling is still elusive. Here, we examine the L252P mutation on the energy landscape of MyD88-TIR domains. We conducted two independent 500-ns MD simulations with explicit solvent for WT MyD88-TIR domain and its L252P mutant. For the mutant (MT) MyD88-TIR domain, the global structural flexibilities decreased, which led to a departure from its original motion. The principal component analysis (PCA), community network analysis and salt bridge analysis revealed that α-helix 3 plays a critical role in the MyD88-TIR domain conformation and these structural changes—caused by the mutation—may shift the equilibrium away from hetero-dimerization thereby affecting physiological signaling of MyD88.
Materials and methods
MD simulations
Two independent 500-ns MD simulations were performed for WT and MT (L252P mutant) monomer, respectively. We adopted the first model of the nuclear magnetic resonance (NMR) spectroscopy structure of the TIR domain of the human MyD88 (Ohnishi et al., 2009) (PDB id: 2Z5V) as the initial state of the WT system. For the mutant system, we substituted the 265 leucine with proline by employing PyMOL 1.2r2 (an open-source user-sponsored molecular visualization system). The TIP3P explicit solvent water model was used, and the MD simulations were carried out using Gromacs-4.5.3 (Hess et al., 2008) software package and the CHARMM27 force field (MacKerell et al., 2000). NaCl was added to the systems to a concentration of 0.15 M. According to the protein size, the simulation boxes were 5.67 × 6.34 × 5.88 and 5.67 × 6.33 × 5.88 nm3 for the WT and MT systems, respectively. Bond lengths within protein and water molecules were, respectively, constrained by the LINCS (Hess et al., 1997) and SETTLE algorithms (Miyamoto and Kollman, 1992), allowing an integration time step of 2 fs. The particle mesh Ewald method was used to calculate the electrostatic interaction with a real-space cutoff of 1.0 nm, and the van der Waals interactions were calculated using a cutoff of 1.4 nm. The simulations were performed in isothermal–isobaric (NPT) ensemble using periodic boundary conditions. The solute and solvent were separately coupled to external temperature bath using a velocity rescaling method (Bussi et al., 2007) and pressure bath using the Parrinello–Rahman method (Parrinello and Rahman, 1981). The temperature and pressure were maintained at 310 K and 1 bar using coupling constants of 0.1 and 1.0 ps, respectively.
Analysis methods
The trajectory analysis was performed with our in-house-developed codes and those from the Gromacs-4.5.3 software package (Hess et al., 2008). The data in the first 200 ns of the MD trajectories were discarded to remove the bias of the initial states for MT and WT systems. Because the TIR domains have different sequence lengths, we adopted the longest homologous segment for the PCA. The backbone root mean square deviations (RMSD) of the WT and MT were calculated following structural alignment. The α-carbon root mean square fluctuation (RMSF) was calculated with respect to the MD generated average structure in the last 300 ns. The covariance matrices that were generated by using Gromacs-4.5.3 package were the first step in the PCA for WT and MT. PCA methods help determine motions that contribute the most to the overall dynamics of the protein. In a system of N atoms, there exist 3N-6 modes of possible internal fluctuations (six degrees of freedom are required to describe the external rotation and translation of the system). In this work, we focus on the α-carbon atoms. By performing PCA, we projected the RMSFs of the WT and MT on the first four PCs (PC1, PC2, PC3 and PC4) after 200 ns. The two-dimensional potential mean force (or free energy landscape) was constructed using the relation –RT × ln[H(x, y)], where H(x, y) was the probability of a conformation having a certain value of two selected reaction coordinates, x and y (PC1 and PC2). We utilized the SWISS-MODEL (Arnold et al., 2006; Guex et al., 2009; Kiefer et al., 2009; Biasini et al., 2014) website to select the functional conformations that contain the TIR domain and build conformational space for MyD88-TIR domain. A salt bridge between a pair of oppositely charged residues was considered to be formed if the centroids of the side-chain charged groups in two oppositely charged residues lie within 0.4 nm of each other (Ma et al., 1999). The visual molecular dynamics (VMD) program (William Humphrey and Schulten 1996) was used for trajectory visualization and graphical structure analysis. In addition, the interaction networks of WT and MT were analyzed and displayed by Network View implemented in VMD.
Results and discussion
The L265P mutation stabilizes the core of the potential homo-dimer interface of the MyD88-TIR domain
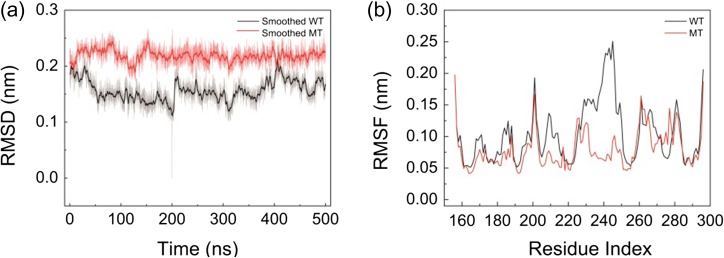
We calculated the backbone RMSDs as shown in Fig. 2a to examine the conformational dynamics of the WT and MT. Taking the WT structure at t = 200 ns as a reference, each frame of the trajectories was compared with this structure. After 200 ns, the two systems reached equilibrium and the different RMSD values of the WT and MT revealed that the conformation of the mutant MyD88-TIR domain monomer changed. To investigate the conformational flexibility, we calculated the Cα−RMSFs of each residue of the WT and MT using the last 300-ns simulation data as shown in Fig. 2b. With respect to the average structures of the WT or MT in the last 300 ns, respectively, the fluctuations are distinctively different. Residues from 227 to 256 (α-helix 3) in MT have a significantly reduced flexibility. Three minor peaks ranging from 163 to 170, 179 to 187 and 207 to 216 decreased. However, the motion of the V198-S212 loop (BB loop) increased substantially. The RMSD and RMSF results suggest that the mutation not only changes the conformational dynamics of the WT, but also influences the global motion of the protein. In order to clarify the different motions of the WT and MT, we compared the covariance matrices and PCs of the two systems.
Fig. 2.
(a) Time evolution of the backbone RMSDs of WT and MT and (b) Cα−RMSFs of each residue of WT and MT calculated using the last 300-ns simulation data.
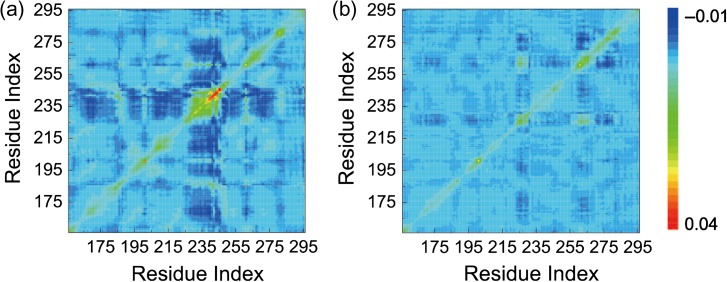
The covariance matrices provide a dynamic correlation between each pair of amino acids. Each value in the matrices corresponds to a covariance of the Cαposition. A negative value indicates that the motion of this pair of Cαatoms has opposite directions; if the Cα pairs move along the same direction, the covariance would be positive. As shown in Fig. 3, for the WT, the residue index from 225 to 245 shows a strong correlation with almost the entire protein (except for Residues 275–295), moving along opposite directions. However, this strong negative correlation is reduced in the L252P mutant. There is also a global decrease in the entire protein motion. It is interesting to note that there is a strong correlation near the diagonal for Residue ~240 in WT. As can be seen from Table I, in this region of WT, the contact probabilities of Residue 252 with nearby Residues T237, A240 and L241 are, respectively, 0.50, 0.66 and 0.70. These intermediate contacts allow flexibility for motion and strong correlations among these residues. In the L252P mutant, the corresponding contact probabilities changed to 0.01, 1.0 and 0.75, respectively. This region is strongly stabilized as well (Fig. 2b).
Fig. 3.
Covariance matrices of WT (a) and MT (b). In WT, residues from 225 to 245 show a strong negative correlation with almost the entire protein (except for Residues 275–295), while in MT, the correlation is suppressed. There is a global decrease in the entire protein motion in MT (b).
Table I.
Change of residue contact due to L252P mutation
| Main chain | Side chain | ||||
|---|---|---|---|---|---|
| Residue | Contact probability | Residue | Contact probability | ||
| WT, L252 | MT, P252 | WT, L252 | MT, P252 | ||
| M219 | 1.00 | 1.00 | M219 | 1.00 | 0.98 |
| H248 | 1.00 | 0.34 | V221 | 0.97 | 0.99 |
| Q249 | 1.00 | 0.72 | T237 | 0.50 | 0.01 |
| A240 | 0.66 | 1.0 | |||
| L241 | 0.70 | 0.75 | |||
| S244 | 0.05 | 0.97 | |||
| H248 | 0.90 | 0.01 | |||
| L268 | 0.95 | 0.41 | |||
| I271 | 0.99 | 0.98 | |||
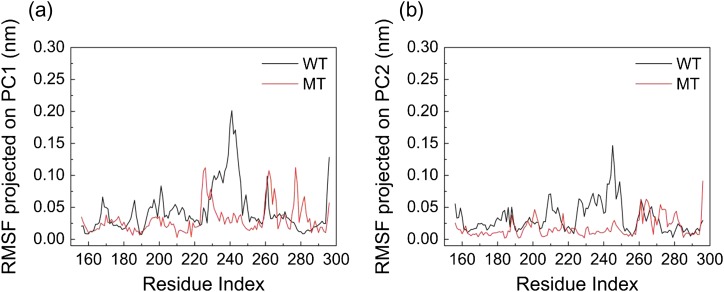
PC analysis shows that the first two PCs capture >30% of the accumulated variance and the top four PCs covered almost 40% (Figure S1). Figure 4 illustrates the CαRMSF of the WT and MT as structural displacements along each of the top two PCs. The fact that the top four PCs captured ~40% variance reflects the highly correlated motion of the MyD88 protein. The WT α-C and α-C' helix (Residues 227–256) have the highest flexibility for both top two PCs. However, for the mutant, the motions in the top two PCs are subdued, while there are correlated motions among Residues 225–235, 259–267 and 260–287 in the PC1. Interestingly, the increased motion of the BB loop (Residues 198–212) is mostly reflected on the fourth PC (Figure S2).
Fig. 4.
Structural displacements along each of the top two PCs (a) PC1 and (b) PC2. Residues 227–256 have the highest flexibility in WT for both top two PCs. For L252P mutant, the motion in the top two PCs is completely subdued, while there are correlated motions among Residues 225–235, 259–267 and 260–287 along the PC1.
Overall, the analysis of the dynamics shows that the mutation suppresses the motion of the MyD88-TIR domain, especially for the α-C and α-C' helix (Residues 227–256), which constitute the BS2 (Residues 233–267) that was recently identified for the dimerization of MyD88-TIR domain (Vyncke et al., 2016). Note that Residue 252 is located in one end of a β-strand, but not in an α-helix (see Fig. 5). L252P reduces the flexibility of nearby helix due to reduced motion of proline. The reduced motion of the BS2 explains the observation that the mutation triggers the activation of lymphoma via allostery-induced TIR-domain oligomerization (Avbelj et al., 2014).
Fig. 5.
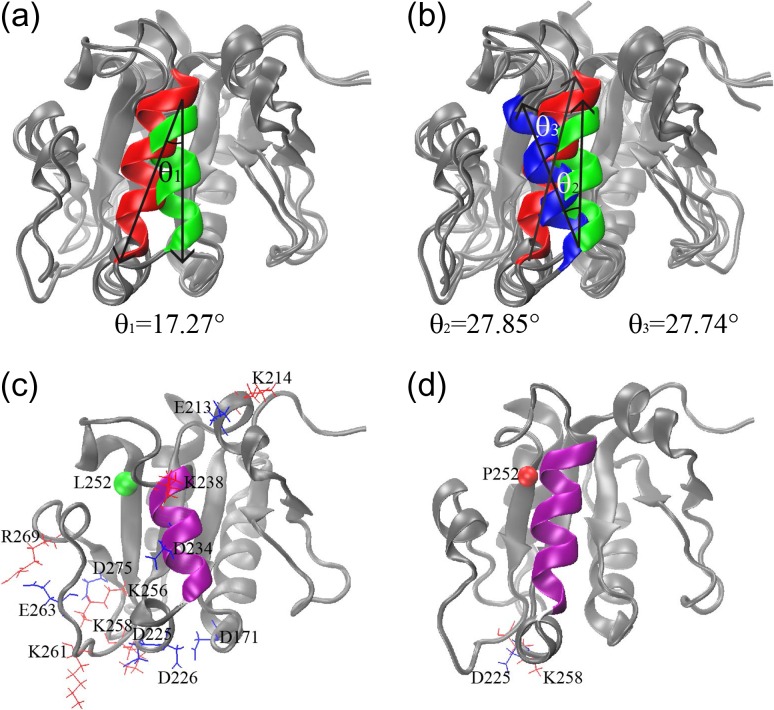
Structural comparison of WT and MT: (a) and (b) superimposed structure of WT at t = 0 ns (helix 3 in blue), WT at t = 500 ns (helix 3 in green) and MT at t = 500 ns (helix 3 in red). Decreased salt bridges in (c) WT and increased salt bridge in (d) MT. The position of Residue 252 in the β-strand is indicated a bead in WT (green) and MT (red) in (c) and (d), respectively.
The L252P mutation allosterically influences the dynamics of the MyD88-TIR domain
L252P not only reduces the flexibility of α-helix 3 (Residues 227–256), but also causes distortion of the orientation of the helix, which may trigger further dynamic allosteric changes. As indicated in Fig. 5a, superimposed structures of WT at t = 0 ns (blue), WT at t = 500 ns (green) and MT at t = 500 ns (red) revealed that compared with the WT structures, the α-helix 3 in the MT has a large clockwise rotation. Even if we take α-helix 3 in the WT at 500 ns as reference, the rotation angle is still ~17.27° (θ1 in Fig. 5a). Compared with the WT at 0 ns, the rotation angle is ~27.74° (θ3 in Fig. 5b).
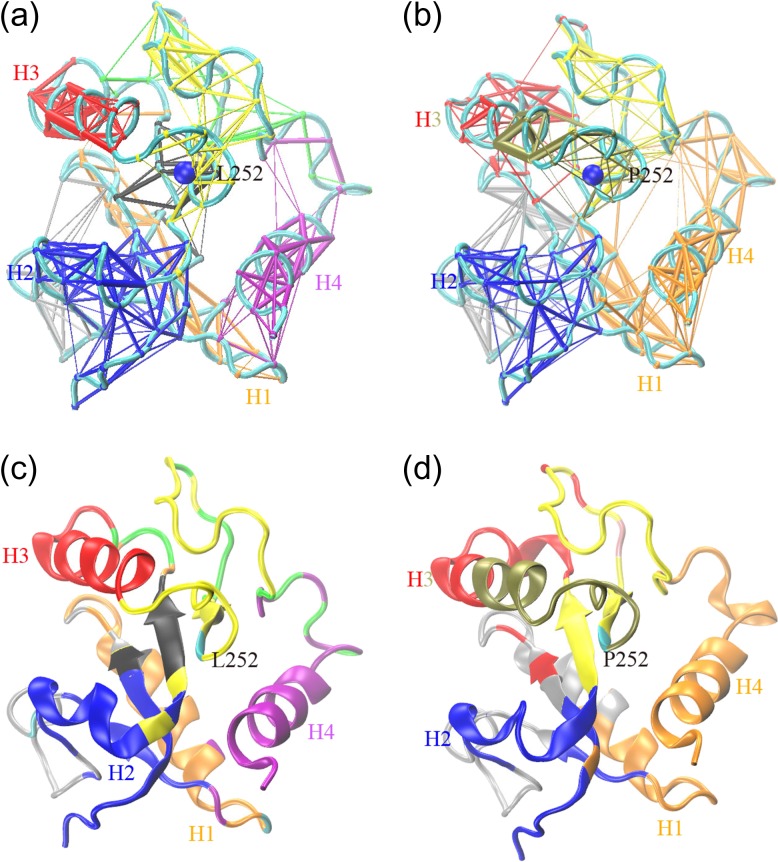
To further understand the allosteric mechanism of the mutation on the dynamics of MyD88-TIR domain, we used dynamic network analysis to explore long-range correlation based on the MD simulations (Sethi et al., 2009). Using each amino acid as a node, we constructed the community networks of amino acid interactions. Edges are placed to connect nodes that remain within a distance of 4.5 Å for at least 75% of the simulation time. Communities are subnetworks that partition the original network based on the shortest distances among all residues (Girvan and Newman, 2002). Nodes have more and stronger connections to nodes within the community than to nodes in other communities. As shown in Fig. 6, there are eight communities in the WT and six in the MT. Each community has its own color, superimposed on the respective initial MD simulation structure. For the WT, helix 1 and helix 4 are in two separated communities. However, in the mutant, α-helix 1 and α-helix 4 are combined into a community, indicating that rigidified motion leads to a change of the communications within the protein. In the WT, α-helix 3 is an independent region with no correlation with other residues. But in the MT, α-helix 3 cracks at Residue 236 into two parts and forms two communities with several nearby residues, possibly due to the change of contact between Leu252 and Leu241 (Table I). Note that the community with tan color that contains part of α-helix 3 also contains the mutant position, suggesting that the mutation restrains the fluctuations of α-helix 3. These results agree with what we have observed in the PCA analysis.
Fig. 6.
Community networks formed in the (a) WT and (b) MT with edge widths corresponding to their weights based on MD simulation. The corresponding 3D cartoon representations at t = 0 ns are shown in (c) and (d). Each community has its own color, superimposed on the respective initial MD simulation structure. The position of Residue 252 in both WT (c) and MT (d) is colored in cyan.
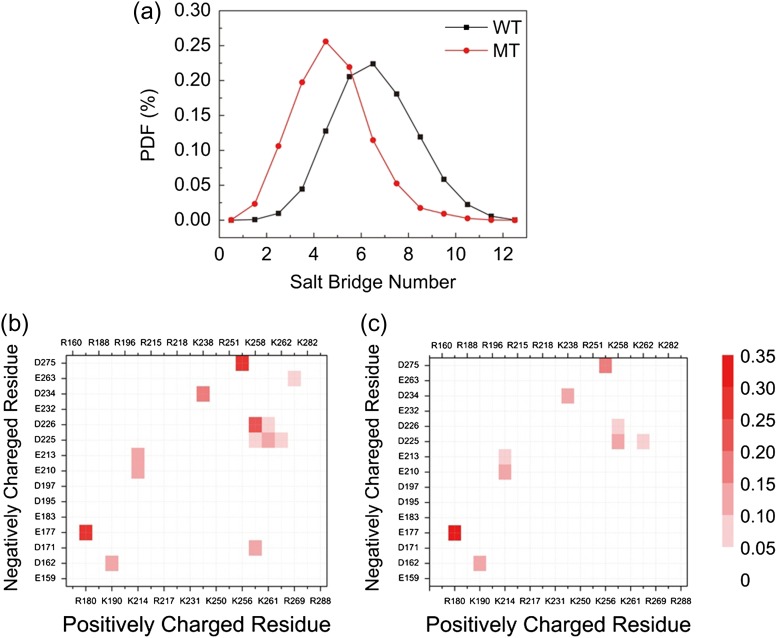
Salt bridges are important in allosteric communications in protein networks, especially when considering the effects of mutations that quench protein motions (Zhu et al., 2014). We examined the salt bridge changes in the WT and MT systems. There are 21 positively charged residues and 15 negatively charged residues out of a total of 141 residues in the WT and MT MyD88-TIR domain. We count the salt bridges observed in our MD simulations. As shown in Fig. 7a, the mutant has fewer salt bridges than the WT. The details and probabilities of salt bridge pairs are reported in Fig. 7b and c. Compared with the WT, the mutation allosterically eliminated four salt bridges (D171-K258, D225-K261, D226-K261 and E263-R269) and weakened other four (E213-K214, D234-K238, D275-K256 and D226-K258). The only slightly strengthened salt bridge in the MT is D225-K258. Figure 5c shows the positions of the charged residues, and the salt bridges broken/decreased in strength. The position of the strengthened salt bridge D238-K271 is shown in Fig. 5d. Putting the salt bridge analysis together with what we get by PCA (there exist correlated motions among Residues 225–235, 259–267 and 274–287), we deduce that the disappearing and decreasing salt bridges release the residue constraints and increase the fluctuation of the Residues 259–267 and 274–287. However, the enhanced salt bridge in the MT D225-K258 confines and decreases the motion of α-helix 3.
Fig. 7.
Salt bridge analysis: (a) probability density function for the total salt bridge of WT (black) and MT (red). Salt bridge network of (b) WT and (c) MT.
The mutation narrows the dynamic overlap with other TIR domains
Previously, we showed that a PC-based energy landscape can be effectively used to characterize mutational effects in the RAS protein (Clausen et al., 2015). Here we examine the MyD88 mutation on the energy landscape of the TIR domains. We utilized the SWISS-MODEL (Arnold et al., 2006; Guex et al., 2009; Kiefer et al., 2009; Biasini et al., 2014) website to select functional conformations of TIR domains and build the conformational space of the MyD88-TIR domain. We selected nine TIR domains from different TLRs (mostly human species) and other structures of MyD88-TIR domain (Table II). All sequences are converted to the MyD88 sequence. The modeled structures are compiled with the MD trajectories to investigate the MyD88-TIR domain dynamics within the energy landscape of these TIR domains.
Table II.
Selected proteins with TIR domain
| Number | PDB ID | Protein description | Method |
|---|---|---|---|
| 1 | 2Z5V | Solution structure of the TIR domain of human MyD88 | NMR |
| 2 | 2JS7 | Solution structure of the TIR domain of human MyD88 | NMR |
| 3 | 4DOM | Crystal structure of the TIR domain of human MyD88 | X-ray |
| 4 | 4EO7 | Solution structure of the TIR domain of human MyD88 | X-ray |
| 5 | 4LQD | Crystal structure of the TIR domain from human Mal (TIRAP) | X-ray |
| 6 | 1FYV | Crystal structure of the TIR domain of human TLR1 | X-ray |
| 7 | 1FYW | Crystal structure of the TIR domain of human TLR2 | X-ray |
| 8 | 1FYX | Crystal structure of P681H mutant the TIR domain of human TLR2 | X-ray |
| 9 | 1O77 | Crystal structure of C713S mutant the TIR domain of human TLR2 | X-ray |
| 10 | 1T3G | Crystal structure of the TIR domain of human IL-1RAPL | X-ray |
| 11 | 2J67 | Crystal structure of the TIR domain of human TLR10 | X-ray |
| 12 | 3J0A | Homology model of the TIR domain of human TLR5 | Electron microscopy |
| 13 | 4OM7 | Crystal structure of the TIR domain of human TLR6 | X-ray |
All of the proteins below are found in homo sapiens and related to the TLR signaling pathway (except IL-1RAPL).
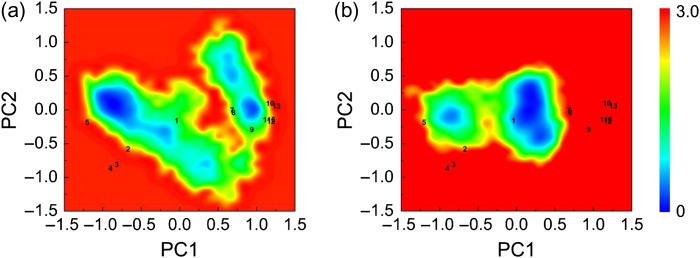
Taking the PC1 and PC2 as reaction coordinates, we plotted the energy landscape of the WT and MT of these selected conformations as shown in Fig. 8. The position of structure number 1 (PDB ID: 2Z5V) used in the MD simulations is at the center of the plots as shown in Figure S3. For the WT, the landscape is dispersed and there are two dominant potential wells at the left and right sides of structure number 1 with center positions at (−0.75, 0) and (0.85, 0). Essentially, two large basins are found, one corresponds to MyD88 (1–4) and the human Mal protein (TIRAP) (5), and the second for other TIR domains (6–13). The distribution of the energy surface in the WT plot suggests that there exist some motion modes of the WT MyD88-TIR domain which correspond to those in the TLR signaling pathways, most likely hetero-oligomer formations. The flexibility of the WT MyD88-TIR domain points to favorable communication in TLR signaling. By contrast, the two potential wells in the MT landscape are more narrowly distributed around the center position (0.25, 0), which suggests diminished flexibility of the mutant MyD88-TIR domain. Rigid motion modes of MT MyD88-TIR domain point to preferred homo-oligomerization states. The dynamic mutant landscape does not capture other TLR signaling pathways-related structures, implying suppressed MyD88 hetero-oligomer formations.
Fig. 8.
Free energy surface (in kcal/mol) of WT (a) and MT (b) as a function of PC1 and PC2 with PDB-obtained crystallographic structures mapped on.
Conclusions
Protein dynamics are essential for function; and conformational flexibility enables a protein to adapt to more complex functions (Ma et al., 2000, 2002; Wei et al., 2016). As an essential adaptor protein that mediates inflammatory signaling pathways, MyD88-TIR domain needs to form homo- and hetero-oligomers. Consistently, our study has found that MyD88-TIR domain has two conformational states, one for homo-oligomerization, which is important for oligomerization of the downstream proteins and the other for hetero-oligomerization, which is important for interactions with the upstream proteins (Fig. 1). The L252P (or L265P) mutation in the TIR domain is prevalent in ABC DLBCL and other MyD88-related diseases. This gain-of-function mutation triggers signaling by recruiting downstream signaling proteins and forming the myddosome complex. We computationally characterized the allosteric effects of the mutation. Our results indicate that the mutation stabilizes the core of the homo-dimer interface of the MyD88-TIR domain, increasing conformational states corresponding to MyD88 family proteins, possibly leading to enhanced homo-oligomerization. At the same time, the dampened motions restrict those shared with other TIR domains, suppressing normal MyD88 functions. Taken together, the conformational dynamics of cancer-associated MyD88-TIR domain mutant L252P allosterically tilts the landscape toward homo-dimerization thereby quenching physiological signaling. If the mutation stabilizes the MyD88 homo-oligomerization, the myddosome structure can be formed with the signal propagating independent of the TLR ligands. Under these conditions, TLR activation is no longer required.
Conflict of interest
The authors declare no competing financial interest.
Supplementary data
Supplementary data are available at PEDS online.
Funding
G.W. acknowledges the financial support from the National Science Foundation of China (Grant No.: 11274075) and the MOST of China (Grant No.: 2016YFA0501702). R.N., E.G.-M. and B.M. thank the financial support from National Cancer Institute, National Institutes of Health, under contract number HHSN261200800001E. This research was supported (in part) by the Intramural Research Program of the National Institutes of Health, National Cancer Institute, Center for Cancer Research. Simulations were performed at the NIH Biowulf supercomputer cluster.
References
- Arnold K., Bordoli L., Kopp J., Schwede T. (2006) Bioinformatics, 22, 195–201. 10.1093/bioinformatics/bti770. [DOI] [PubMed] [Google Scholar]
- Avbelj M., Wolz O.O., Fekonja O., et al. (2014) Blood, 124, 3896–3904. 10.1182/blood-2014-05-573188. [DOI] [PMC free article] [PubMed] [Google Scholar]
- Biasini M., Bienert S., Waterhouse A., et al. (2014) Nucl. Acids Res., 42, W252–258. 10.1093/nar/gku340. [DOI] [PMC free article] [PubMed] [Google Scholar]
- Botos I., Segal D.M., Davies D.R. (2011) Structure, 19, 447–459. 10.1016/j.str.2011.02.004. [DOI] [PMC free article] [PubMed] [Google Scholar]
- Bovijn C., Desmet A.S., Uyttendaele I., Van Acker T., Tavernier J., Peelman F. (2013) J. Biol. Chem., 288, 12054–12066. 10.1074/jbc.M112.415810. [DOI] [PMC free article] [PubMed] [Google Scholar]
- Burns K., Martinon F., Esslinger C., Pahl H., Schneider P., Bodmer J.L., Di Marco F., French L., Tschopp J. (1998) J. Biol. Chem., 273, 12203–12209. [DOI] [PubMed] [Google Scholar]
- Bussi G., Donadio D., Parrinello M. (2007) J. Chem. Phys., 126, 014101 10.1063/1.2408420. [DOI] [PubMed] [Google Scholar]
- Cani A.K., Soliman M., Hovelson D.H., et al. (2016) Mod. Pathol.. 10.1038/modpathol.2016.79. [DOI] [PMC free article] [PubMed] [Google Scholar]
- Clausen R., Ma B., Nussinov R., Shehu A. (2015) PLoS Comput. Biol., 11, e1004470 10.1371/journal.pcbi.1004470. [DOI] [PMC free article] [PubMed] [Google Scholar]
- Deguine J., Barton G.M. (2014) F1000 Prime Rep., 6, 97 10.12703/P6-97. [DOI] [PMC free article] [PubMed] [Google Scholar]
- Echizen K., Hirose O., Maeda Y., Oshima M. (2016) Cancer Sci., 107, 391–397. 10.1111/cas.12901. [DOI] [PMC free article] [PubMed] [Google Scholar]
- Gay N.J., Symmons M.F., Gangloff M., Bryant C.E. (2014) Nat. Rev. Immunol., 14, 546–558. 10.1038/nri3713. [DOI] [PubMed] [Google Scholar]
- Girvan M., Newman M.E. (2002) Proc. Natl. Acad. Sci. U.S.A., 99, 7821–7826. 10.1073/pnas.122653799. [DOI] [PMC free article] [PubMed] [Google Scholar]
- Guex N., Peitsch M.C., Schwede T. (2009) Electrophoresis, 30, S162–173. 10.1002/elps.200900140. [DOI] [PubMed] [Google Scholar]
- Guven-Maiorov E., Keskin O., Gursoy A., VanWaes C., Chen Z., Tsai C.J., Nussinov R. (2015) Sci. Rep. 10.1038/srep13128. [DOI] [PMC free article] [PubMed] [Google Scholar]
- Hess B., Bekker H., Berendsen H.J.C., Fraaije J.G.E.M. (1997) J. Comput. Chem., 18, 1463–1472. 10.1002/(SICI)1096-987X(199709)18:12<1463::AID-JCC4>3.0.CO;2-H.. [Google Scholar]
- Hess B., Kutzner C., van der Spoel D., Lindahl E. (2008) J. Chem. Theory Comput., 4, 435–447. 10.1021/ct700301q. [DOI] [PubMed] [Google Scholar]
- Kiefer F., Arnold K., Kunzli M., Bordoli L., Schwede T. (2009) Nucl. Acids Res., 37, D387–392. 10.1093/nar/gkn750. [DOI] [PMC free article] [PubMed] [Google Scholar]
- Landgren O., Staudt L. (2012) N. Engl. J. Med., 367, 2255–2256. 10.1056/NEJMc1211959#SA1. [DOI] [PubMed] [Google Scholar]
- Lin S.C., Lo Y.C., Wu H. (2010) Nature, 465, 885–890. 10.1038/nature09121. [DOI] [PMC free article] [PubMed] [Google Scholar]
- Loiarro M., Volpe E., Ruggiero V., Gallo G., Furlan R., Maiorino C., Battistini L., Sette C. (2013) J. Biol. Chem., 288, 30210–30222. 10.1074/jbc.M113.490946. [DOI] [PMC free article] [PubMed] [Google Scholar]
- Ma B., Kumar S., Tsai C.J., Nussinov R. (1999) Protein Eng., 12, 713–720. [DOI] [PubMed] [Google Scholar]
- Ma B., Shatsky M., Wolfson H.J., Nussinov R. (2002) Protein Sci., 11, 184–197. [DOI] [PMC free article] [PubMed] [Google Scholar]
- Ma B., Tsai C.J., Nussinov R. (2000) Biophys. J., 79, 2739–2753. [DOI] [PMC free article] [PubMed] [Google Scholar]
- MacKerell A.D. Jr., Banavali N., Foloppe N. (2000) Biopolymers, 56, 257–265. 10.1002/1097-0282(2000)56:4<257::aid-bip10029>3.0.co;2-w. [DOI] [PubMed] [Google Scholar]
- Martinez-Lopez A., Curiel-Olmo S., Mollejo M., Cereceda L., Martinez N., Montes-Moreno S., Almaraz C., Revert J.B., Piris M.A. (2015) Am. J. Surg. Pathol., 39, 644–651. 10.1097/PAS.0000000000000411. [DOI] [PubMed] [Google Scholar]
- Miyamoto S., Kollman P.A. (1992) J. Comput. Chem., 13, 952–962. 10.1002/jcc.540130805. [Google Scholar]
- Ngo V.N., Young R.M., Schmitz R., et al. (2011) Nature, 470, 115–119. 10.1038/nature09671. [DOI] [PMC free article] [PubMed] [Google Scholar]
- Ohnishi H., Tochio H., Kato Z., Orii K.E., Li A., Kimura T., Hiroaki H., Kondo N., Shirakawa M. (2009) Proc. Natl. Acad. Sci. U.S.A., 106, 10260–10265. 10.1073/pnas.0812956106. [DOI] [PMC free article] [PubMed] [Google Scholar]
- Parrinello M., Rahman A. (1981) J. Appl. Phys., 52, 7182–7190. http://dx.doi.org/10.1063/1.328693. [Google Scholar]
- Planes R., Ben Haij N., Leghmari K., Serrero M., BenMohamed L., Bahraoui E. (2016) J. Virol.. 10.1128/JVI.00262-16. [DOI] [PMC free article] [PubMed] [Google Scholar]
- Sethi A., Eargle J., Black A.A., Luthey-Schulten Z. (2009) Proc. Natl. Acad. Sci. U.S.A., 106, 6620–6625. 10.1073/pnas.0810961106. [DOI] [PMC free article] [PubMed] [Google Scholar]
- Treon S.P., Hunter Z.R. (2013) Blood, 121, 4434–4436. 10.1182/blood-2013-04-494849. [DOI] [PubMed] [Google Scholar]
- Treon S.P., Xu L., Yang G., et al. (2012) N. Engl. J. Med., 367, 826–833. 10.1056/NEJMoa1200710. [DOI] [PubMed] [Google Scholar]
- Valkov E., Stamp A., Dimaio F., et al. (2011) Proc. Natl. Acad. Sci. U.S.A., 108, 14879–14884. 10.1073/pnas.1104780108. [DOI] [PMC free article] [PubMed] [Google Scholar]
- Varettoni M., Arcaini L., Zibellini S., et al. (2013) Blood, 121, 2522–2528. 10.1182/blood-2012-09-457101. [DOI] [PubMed] [Google Scholar]
- Vyncke L., Bovijn C., Pauwels E., Van Acker T., Ruyssinck E., Burg E., Tavernier J., Peelman F. (2016) Structure, 24, 437–447. 10.1016/j.str.2015.12.018. [DOI] [PubMed] [Google Scholar]
- Wei G., Xi W., Nussinov R., Ma B. (2016) Chem. Rev. 10.1021/acs.chemrev.5b00562. [DOI] [PMC free article] [PubMed] [Google Scholar]
- William Humphrey A.D., Schulten Klaus (1996) J. Mol. Graph., 14, 33–38. [DOI] [PubMed] [Google Scholar]
- Xia Y., Fan L., Wang L., et al. (2015) Oncotarget, 6, 5426–5434. 10.18632/oncotarget.3101. [DOI] [PMC free article] [PubMed] [Google Scholar]
- Xu L., Hunter Z.R., Yang G., et al. (2013) Blood, 121, 2051–2058. 10.1182/blood-2012-09-454355. [DOI] [PMC free article] [PubMed] [Google Scholar]
- Zhu Y., Wu Y., Luo Y., Zou Y., Ma B., Zhang Q. (2014) J. Phys. Chem. B, 118, 13112–13122. 10.1021/jp507936a. [DOI] [PubMed] [Google Scholar]
Associated Data
This section collects any data citations, data availability statements, or supplementary materials included in this article.


