Abstract
Many intrinsically disordered proteins (IDPs) participate in coupled folding and binding reactions and form alpha helical structures in their bound complexes. Alanine, glycine, or proline scanning mutagenesis approaches are often used to dissect the contributions of intrinsic helicities to coupled folding and binding. These experiments can yield confounding results because the mutagenesis strategy changes the amino acid compositions of IDPs. Therefore, an important next step in mutagenesis-based approaches to mechanistic studies of coupled folding and binding is the design of sequences that satisfy three major constraints. These are (i) achieving a target intrinsic alpha helicity profile; (ii) fixing the positions of residues corresponding to the binding interface; and (iii) maintaining the native amino acid composition. Here, we report the development of a Genetic Algorithm for Design of Intrinsic secondary Structure (GADIS) for designing sequences that satisfy the specified constraints. We describe the algorithm and present results to demonstrate the applicability of GADIS by designing sequence variants of the intrinsically disordered PUMA system that undergoes coupled folding and binding to Mcl-1. Our sequence designs span a range of intrinsic helicity profiles. The predicted variations in sequence-encoded mean helicities are tested against experimental measurements.
Keywords: design, GADIS, intrinsically disordered proteins, intrinsically helicity
Introduction
Many macromolecular complexes involve proteins or regions that are intrinsically disordered in their unbound forms (Wright and Dyson, 1999, 2009, Babu et al., 2012, van der Lee et al., 2014, Wright and Dyson, 2015). Intrinsically disordered proteins/regions (IDPs/IDRs) are distinct from autonomously folded domains. The amino acid sequences of IDPs encode an intrinsic preference for conformational heterogeneity, which means that they do not fold into specific three-dimensional structures as autonomous units (Dunker et al., 2002). Many IDPs are involved in molecular recognition (Mohan et al., 2006) and one mode of recognition involves coupled folding and binding (Dyson and Wright, 2002, 2009, Gianni et al., 2016). Here we focus on a specific archetype, namely binary complexes where IDPs fold when they are bound to pre-folded protein partners.
A majority of IDPs that undergo coupled folding and binding tend to adopt α-helical structures in their bound complexes. Interestingly, many of these IDPs have quantifiable intrinsic helicities in their unbound forms (Dyson and Wright, 2005, Mohan et al., 2006, Vacic et al., 2007, Das et al., 2012, Peng et al., 2014). Recently, Borcherds et al. (2014) showed that point mutations could be engineered into the intrinsically disordered N-terminal domain of the tumor suppressor p53 to enhance its intrinsic helicity. This proline-to-alanine substitution leads to an increase in the affinity of p53 for Mdm2. Of course, a particular value for the dissociation constant (KD) can accommodate a range of mechanisms for coupled folding and binding (Kiefhaber et al., 2012). This feature is highlighted in kinetics experiments that have measured the rates of association of the intrinsically disordered BH3-PUMA (referred to hereafter as PUMA) peptide to the pre-folded Mcl-1 (Rogers et al., 2013, 2014a,b) and other systems (Dogan et al., 2015). Systematic proline and alanine scanning of PUMA was used to assess the contributions of helicity in unbound PUMA on the mechanisms of coupled folding and binding (Rogers et al., 2014a,b). Proline and alanine scanning do not significantly alter the association rates. However, the rates of dissociation (koff) of PUMA from Mcl-1 show significant changes upon proline- or alanine-scanning mutations to the PUMA sequence.
An intriguing hypothesis is that the amino acid composition of an IDP is the main determinant of kon whereas the degree of intrinsic helicity regulates koff thus leading to kinetic control of cellular programs such as apoptosis. To test this hypothesis, one needs a systematic titration of the effects of intrinsic helicity on the mechanisms of coupled folding and binding. There is no easy way to modulate intrinsic helicities for an IDP that adopts helical conformations in its bound state. Mutagenesis experiments inevitably convolve changes to amino acid composition and intrinsic helicities, as is the case with standard, proline-, glycine- or alanine-scanning approaches. This makes it difficult it to separate the contributions of intrinsic helicities from the overall effects of changes to the amino acid composition. In this regard, it is noteworthy that the amino acid compositions and residues that define macromolecular interfaces are highly conserved in IDPs even though their amino acid sequences vary considerably (Brown et al., 2011, Moesa et al., 2012). Our goal is to develop an approach that allows us to parse contributions from amino acid composition and sequence-encoded intrinsic helicities to uncover their distinct and synergistic contributions to thermodynamic and kinetic stabilities of complexes that form via coupled folding and binding. Here, we present a method that we refer to as GADIS for Genetic Algorithm for the Design of Intrinsic secondary Structures. This approach combines a genetic algorithm and efficient molecular simulations to design IDP sequences that have specified helicity profiles in their unbound forms.
In the implementation of the GADIS algorithm that is presented here, we take a position-specific helicity profile and two additional sets of constraints as inputs. The constraints are as follows: we fix the amino acid composition thus eliminating the need for traditional proline or alanine scanning methods that change the amino acid composition. We also fix the positions of residues that define the interface of the IDP with its binding partner. The goal is to design a set of sequences that reproduces the target helicity profile for the given amino acid composition. We have prototyped GADIS by using it to generate sequence variants of the 34-residue IDR within PUMA that binds to Mcl-1. We show that GADIS is successful and efficient at generating distinct sequence variants that satisfy specific design criteria for helicity profiles. We report results from far ultraviolet circular dichroism (UV-CD) measurements for 10 of the designed sequence variants, with different target helicity profiles and mean helicities. Quantitative comparisons show that computationally derived mean helicities are in agreement with those derived from experiment.
Results
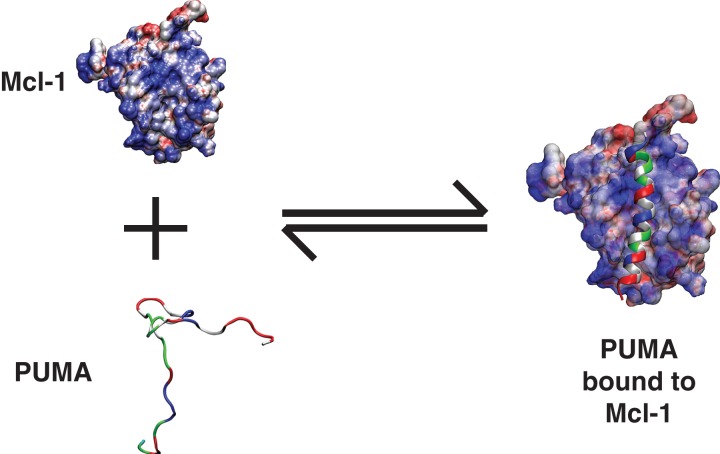
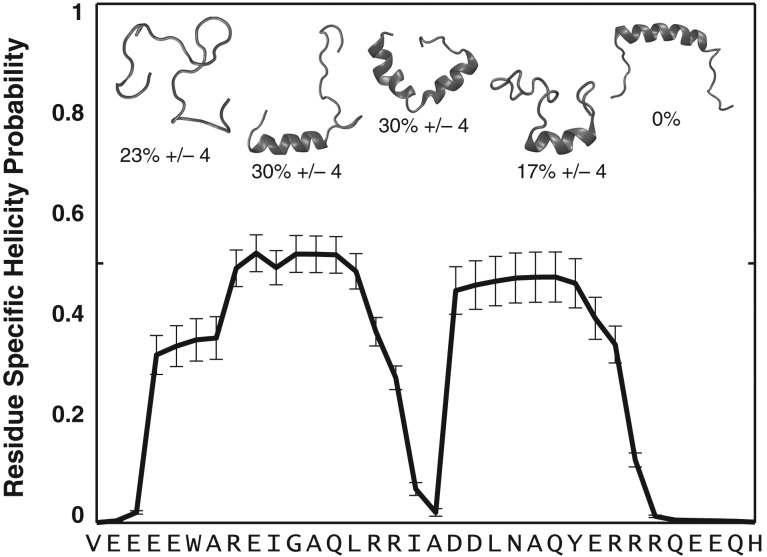
We illustrate the design objectives and the functionality of GADIS using PUMA. The wild type version of PUMA adopts a continuous alpha helix in the context of its complex with Mcl-1 (Fig. 1). In its unbound state, PUMA adopts a heterogeneous ensemble of partially helical conformations (Fig. 2). This translates to a residue-specific helicity profile (Fig. 2) that quantifies the ensemble-averaged percent probability of finding each residue as part of a regular alpha helical segment of at least six consecutive residues.
Fig. 1.
Illustration of coupled folding and binding. In this illustration, an intrinsically disordered—partially helical—PUMA sequence is shown to bind to Mcl-1 and form a continuous helix in the context of the bound complex. PUMA is shown as a ribbon diagram to emphasize its helicity in the bound complex. The residues are colored as follows: Hydrophobic residues are in gray, polar residues are in green, negatively charged residues are in red, and positively charged residues are in blue. Mcl-1 is shown in a surface representation to emphasize the electrostatic potential. Regions of high positive potential are in blue, regions of high negative potential are in red, and regions with near zero electrostatic potential are in white. The electrostatic surface was computed using the Adaptive Poisson Boltzmann solver (Baker et al., 2001).
Fig. 2.
The unbound PUMA adopts a heterogeneous conformational ensemble. The figure summarizes results from all atom ABSINTH-based simulations of PUMA. The sequence prefers a heterogeneous ensemble of conformations. These include conformations with independent N- and C-terminal helical halves, coil-like N- or C-terminal halves that are populated with helical C- or N-terminal halves, and fully coil-like conformations. The heterogeneity is quantified in terms of the percent probabilities associated with distinct conformational types. These populations are used to quantify a residue-specific helicity profile that quantifies the percent probability of finding a residue as part of a regular alpha helical segment that is at least six residues long. Note that in the simulations the central helix conformation is not accessed by the wild type sequence of PUMA.
The GADIS algorithm
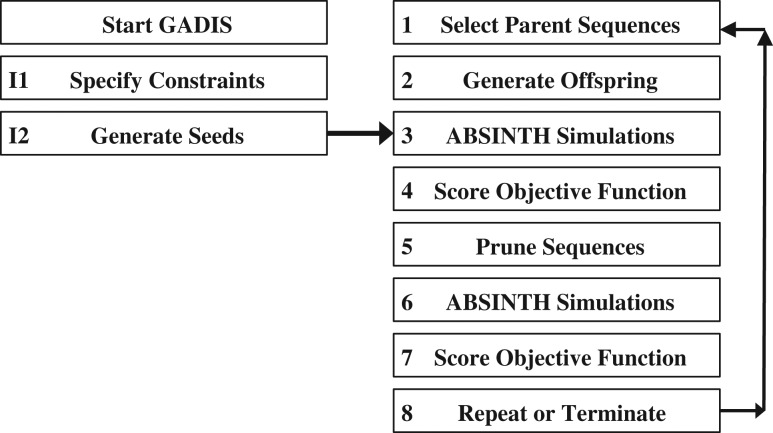
The flowchart in Fig. 3 illustrates the steps involved in GADIS. The algorithm involves two initialization steps I1 and I2. In step I1 we specify the inputs, which include the amino acid composition, the positions and identities of immutable residues, and the target helicity profile. In step I2, we start with the wild type sequence and generate 100 distinct seed sequences. For the first iteration, the algorithm segues directly into step 3 of the production run. Here, for each seed sequence, we perform preliminary atomistic Metropolis Monte Carlo simulations based on the ABSINTH implicit solvation model and forcefield paradigm (see Methods section). Each simulation involves 3 × 10⁷ steps that follow 107 initial steps of equilibration. The simulations yield conformational ensembles for each seed sequence. In step 4, the simulated ensembles are used to calculate sequence-specific values of the objective function shown in equation (1). This quantifies the distance between the profile achieved by the conformational ensemble of each sequence and the target helicity profile. The objective function is defined as follows:
| (1) |
Here, Ωk is the objective function for the kth sequence, N is the number of residues in each sequence, is the percent probability of finding residue i in a helical segment of at least six residues within the simulated ensemble, and is the target value for this percent probability. The parameters wi define the contribution of each position to the target helicity profile. These can either be uniform or non-uniform. The latter choice is useful if a specific target helicity profile has degeneracy. This refers to a similar Ωk value being achieved by a range of distinct helicity profiles, including those that deviate from the intended target. The choices for wi are made following initial testing, which allows us to assess the ease of generating sequences, that match the target helicity profile. The assessments in step 4 are used in step 5 to prune the number of seed/parent sequences. This pruning is achieved by selecting 10 of the 100 original sequences with the lowest values of Ωk. For the subset of selected sequences, we perform, in step 6, an additional round of ABSINTH-based Monte Carlo simulations, whereby 10 independent simulations, each of length 4 × 10⁷ steps are performed for each sequence. These simulations provide robust statistics that are used for evaluating the probability that a seed sequence can be used as a parent for generating offspring sequences in the next generation. Specifically, the conformational statistics are used to calculate a new round of objective function values, and the seed sequences are evaluated for their potential to become parents for the next generation of sequences in step 7. If at least 10 distinct sequences have been generated that match the target helicity profile and the best set of sequences have not improved over the last two generations, then the design process is terminated. If these criteria have not been met, then new offspring sequences are to be generated and the design continues whereby we return to step 1 and iterate steps 1–7 until the termination criterion has been satisfied. In our tests with PUMA, the GADIS procedure typically yields the desired number of sequence variants within eight generations and this is true irrespective of the target helicity profile.
Fig. 3.
Flowchart of the GADIS algorithm. The text provides a detailed description of each of the steps in the algorithm.
The details of selecting parent sequences, step 1, and generating offspring sequences, step 2, are as follows: In step 1, the probability Pk that an offspring sequence will be derived from parent sequence k is given by the following equation:
| (2) |
Here, np represents the current number of parent sequences including any that seeded the previous generations. The choice for c that is currently used for designing variants of PUMA is shown in equation (3):
| (3) |
This value of c works well in terms of affording an efficient balance between sequence diversity and achievement of the target profile in the choice of parent sequences. The new set of parent sequences and parents from the preceding generations are used to generate 100 new offspring sequences in step 2. From a parent sequence, offspring sequences are generated by swaps between pairs of residues at mutable positions (Fig. 4). Additional sliding moves alter the current positions of residues (Fig. 4). The swaps and slides are guided by positive and negative selection heuristics. The negative selection heuristics refer to biases against the accumulation of acidic/basic residues at C-terminal/N-terminal ends of helical segments. Additional criteria refer to biases against the inclusion of glycine or proline residues within internal helical segments of a sequence unless this is required by the input constraints. The positive selection heuristics are based on rules regarding helix initiation and capping. Residues that are known to be preferred at N- or C-termini of helices are preferentially chosen to be at these positions providing these choices are permitted by the fixed amino acid composition (Aurora and Rose, 1998).
Fig. 4.
Illustration of the shuffles and sliding moves along sequences that are used to generate new offspring sequences from a parent. The top row illustrates swaps between two positions and the bottom row illustrates a combination of swaps and sliding. The latter to refers to changes to the positions of residues by sliding them over either to N- or C-terminal positions. Note that in the swap and slide move that the longer arrows signifies a residue being moved over an immutable residue.
Deployment and analysis of the performance of GADIS
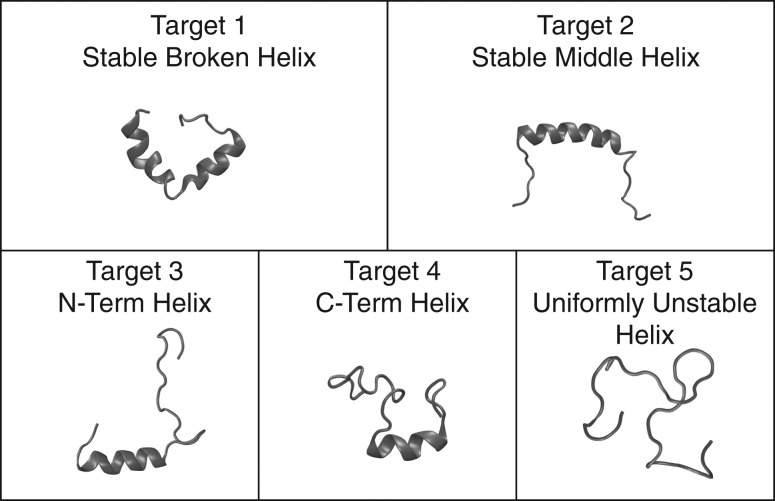
We prototyped GADIS by generating sequence variants of PUMA. The helicity profile for the wild type sequence is shown in Fig. 2. We proposed five distinct target profiles for new variants of PUMA. These targets are shown in Fig. 5. In Target 1 the goal was to design sequences whose N- and C-terminal halves fluctuate independently into and out of helical conformations, with a clear break in the middle of the sequence. This target was referred to as the stable broken helix (SBH) profile. In Target 2 the goal was to design sequences where a stable central helix spans the central portion of the peptide from positions 10–23. This target was referred to as the stable central helix (SCH) profile. In Targets 3 and 4, the goal was to design sequences that have helical N- or C-terminal halves and coil-like C- or N-terminal halves, respectively. These targets were referred to as NTH and CTH profiles, respectively. Finally, for Target 5, the goal was to achieve sequences with uniformly low probabilities of being part of regular helical segments. This target was referred to as the uniformly unstable helix (UUH).
Fig. 5.
Five target helicity profiles for the design of PUMA variants. The acronyms and the details regarding each target profile are discussed in the text.
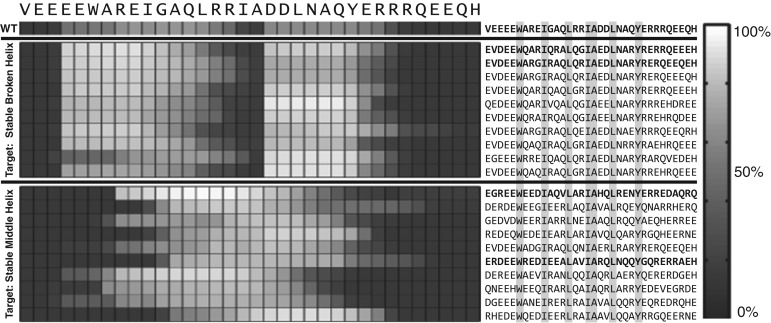
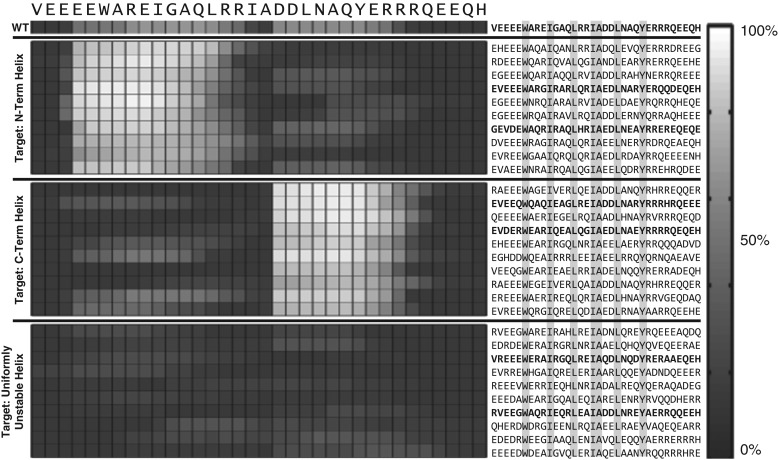
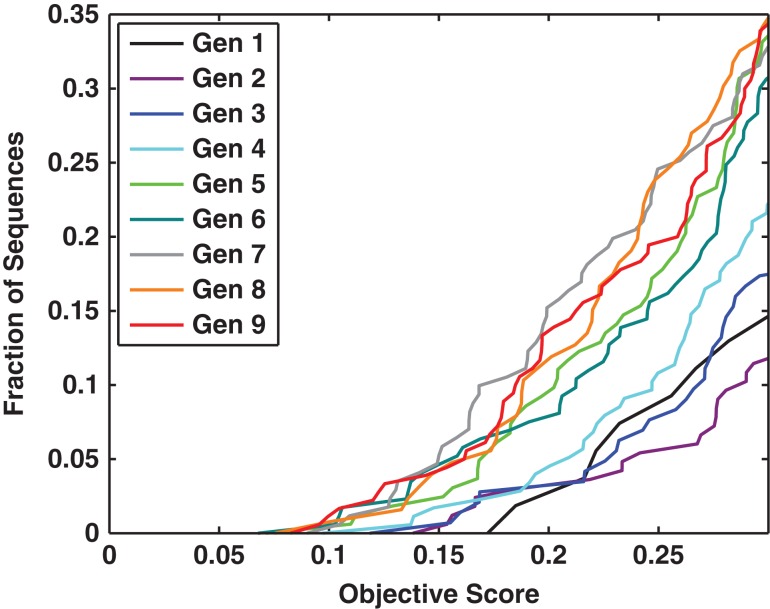
Figures 6 and 7 summarize the results of applying GADIS to generate at least 10 distinct sequence variants for each of the five target helicity profiles. In these figures, the results are summarized as checkerboard plots that quantify the percent probabilities that each residue in a designed sequence is part of a regular alpha helical segment that is at least six residues long. The sequences that match a specific target profile are also shown adjacent to the checkerboard plots. Targets such as the SCH profile will be more challenging because this profile calls for persistent helicity across the central portion of the sequence with coil-like dangling ends. From a computational standpoint, the constraints of fixed amino acid composition and seven immutable positions present one set of challenges for the efficient generation of parent/offspring sequences that match the target helicity profile. An additional challenge comes from the degeneracy of incorrect helicity profiles that reproduce low Ωk values for the SCH profile. This latter challenge is remedied by using non-uniform weights wi to prevent sequences encoding the SBH profile from generating low Ωk values when the SCH profile is the intended target. In contrast, the UUH target is easily achieved by almost any sequence that is chosen at random. Fig. 8 shows how the GADIS algorithm improves from one generation to the next by increasing the probability of finding sequence variants of PUMA that lower the value of Ωk for the SBH profile. Similar results are obtained for each of the other four profiles.
Fig. 6.
Sequence variants of PUMA that were generated using GADIS for the SBH and SCH target profiles. The checkerboard plots quantify the residue-specific helical propensities. These are quantified in terms of the percent probability that a specific residue is part of a regular helical segment that is at least six residues long. On the left, the first 10 rows pertain to sequence variants that correspond to the SBH profile and the bottom ten rows correspond to the SCH profile. The sequences corresponding to each row of residue-specific helical propensities are shown on the right. The positions of the immutable residues are highlighted to emphasize the constraints. The wild type PUMA sequence is also shown as reference. Additionally, sequences shown in bold face were used in UV-CD measurements.
Fig. 7.
Sequence variants of PUMA that were generated using GADIS for the NTH, CTH and UUH target profiles. The checkerboard plots quantify the residue-specific helical propensities. These are quantified in terms of the percent probability that a specific residue is part of a regular helical segment that is at least six residues long. On the left, the first ten rows pertain to sequence variants that correspond to the NTH profile, the middle ten rows correspond to the CTH profile, and the last ten rows correspond to the UUH profile. The sequences corresponding to each row of residue-specific helical propensities are shown on the right. The positions of the immutable residues are highlighted to emphasize the constraints. Additionally, sequences shown in bold face were used in UV-CD measurements. The wild type PUMA sequence is also shown as reference.
Fig. 8.
Quantifying the convergence of the GADIS algorithm. This plot shows the probability of realizing sequences with lower objective function values as the generation number increases. For a given curve, the ordinate quantifies the fraction of sequences generated by GADIS that have achieved a sequence with a score that is less than or equal to a particular value along the abscissa. As the generation number increases (see legend), the curves are shifted to the left indicating a systematic improvement in realizing sequences that lower the objective function value.
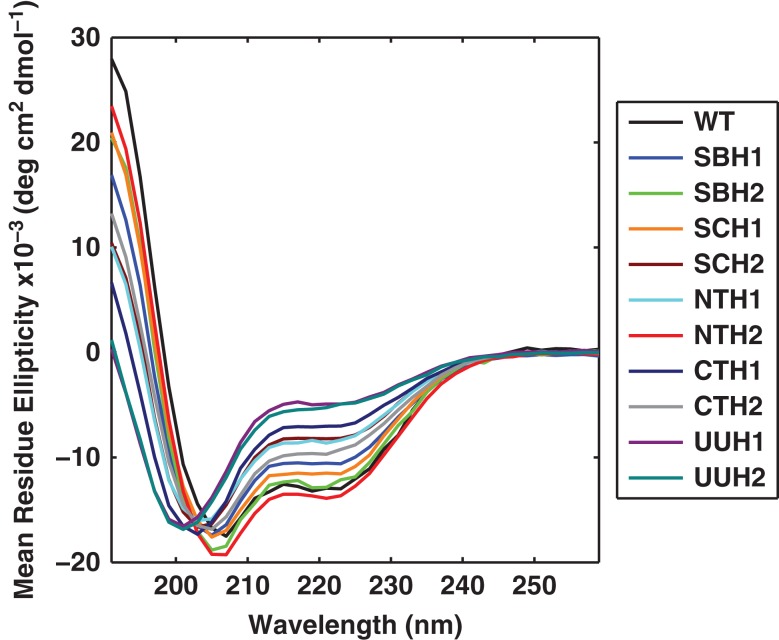
We performed UV-CD measurements on 10 different sequence variants, two from each of the five target classes. We also measured the CD spectrum of wild type PUMA. Fig. 9 shows the CD spectra for all eleven sequences. We compared the calculated mean helical contents for wild type PUMA and each of the 10 designed variants to the measured helical contents. For sequence k the mean helical content is calculated using the residue-specific probabilities that are extracted from the simulated ensembles:
| (4) |
The values obtained using equation (4) were compared with mean helical contents inferred from analysis of the measured CD spectra, which was calculated using the empirical equation developed by Chen et al. (1974):
| (5) |
Fig. 9.
UV-CD spectra obtained for the wild type PUMA and 10 sequence variants derived from the GADIS designs. The spectra show that GADIS helps achieve a systematic titration of intrinsic helicities through sequence design using a fixed amino acid composition and a specified set of immutable residues.
Here, θ222 is the mean residue ellipticity at 222 nm and N = 34 is the number of amino acids in the sequence. The denominator is the expected mean residue ellipticity at 222 nm, calculated for an infinitely long helix and corrected to account for the finite size of the peptide. Other empirical expressions have also been developed that use either θ222 (Chen and Yang, 1971) or θ208 (Greenfield and Fasman, 1969), which is the mean residue ellipticity at 208 nm. These expressions yield similar estimates for the inferred values, and identical trends, for mean helicities given our CD data.
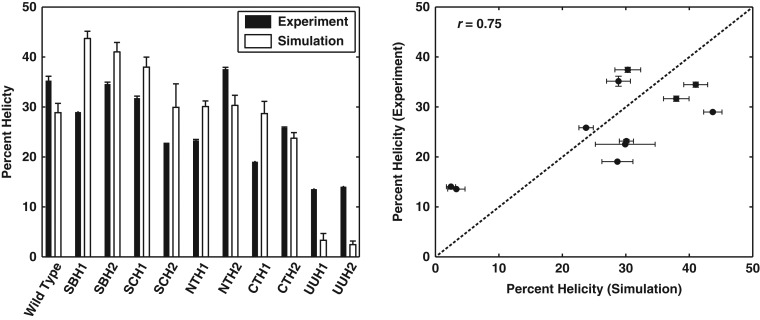
Fig. 10 shows a comparison between the values of and for wild type PUMA and all 10 designed variants derived from the application of GADIS. The two sets of values are positively correlated, although ≠ . This could derive from the discrepant approaches for estimating helicities, the parameterization of in equation (5), or true deviations in the ensembles sampled computationally versus in solution. Overall, we conclude that the GADIS designs do indeed enable a systematic titration of helicity profiles and mean helicities while maintaining the overall amino acid composition and fixing the positions of several immutable residues.
Fig. 10.
Comparisons between measured and calculated mean helical contents. The plot on the left shows the comparisons as a bar plot, where the black bars denote mean helical contents derived from CD spectra and the white bars denote the corresponding values derived from simulated ensembles for each sequence. The panel on the right plots the experimentally derived values on the ordinate versus the computationally derived values on the abscissa. The Pearson product moment correlation coefficient is r = 0.75 and this quantifies the linear correlation between the mean helical contents derived from measurements versus simulations. The P-value is 0.007 and this quantifies the probability of realizing the obtained r-value purely by chance. In the plot on the right, if the computed helicities were identical to the measured helicities, then the points would have fallen on the dashed line. The vertical error bars are the differences between the helicity values inferred from the two sets of experiments. The horizontal error bars represent the standard error about the mean helicity that is calculated across at least 10 independent simulations for each sequence variant.
Why use ABSINTH-based simulations? In step 3 and step 6 of the GADIS algorithm we use ABSINTH-based simulations to generate atomistic descriptions of conformational ensembles to calculate sequence-specific helicity profiles. This is the most computationally expensive step of the GADIS algorithm. For a typical sequence variant of PUMA, it takes roughly 48 h to complete a simulation on a quad core Nehalem processor. This can become a major bottleneck given the need to return to steps 3 and 6 multiple times for hundreds of sequences. We overcome this problem through our access to a high performance computational cluster. This still requires at least 720 h of continuous computations, and can become prohibitive without access to requisite resources.
The computational bottleneck raises the issue of finding inexpensive ways to estimate of sequence-encoded helicities. We used the ABSINTH-based approach based on previous work that uncovered limitations of web-based predictors of helicity such as AGADIR (Lacroix et al., 1998). Although AGADIR is routinely used to estimate helicities of various peptides and proteins, it does not appear to capture the sequence-encoded intrinsic helicities of IDPs / IDRs (Das et al., 2012). This point is reinforced in Fig. 11, which shows the poor correlation between helicities predicted using AGADIR and the values from simulations or the values of from UV-CD measurements for PUMA and the 10 different sequence variants. Therefore, pending the availability of a suitable machine learning approach that can be deployed across a large dataset of sequences, we are constrained to using ABSINTH-based simulations at steps 3 and 6 of the GADIS algorithm. The efficiency of ABSINTH-based simulations enables the throughput in terms of the number of simulations and the realization of the design objectives. This would not have been feasible with the use of explicit representations of solvent molecules or an inefficient implicit solvation model.
Fig. 11.
Comparisons between mean helical contents obtained using AGADIR and those derived from CD measurements (a) and simulations (b), (c). In all three panels, if the AGADIR values were identical to the values along the abscissae, then the points would fall on the dashed lines shown in each of the three panels. AGADIR predictions were performed using default settings for the ionic strength and a temperature of 25˚C. This yields uniformly low helicity values for all eleven sequences. It also fails to capture the variation of intrinsic helicities with sequence. Similar trends, albeit lower helicity values are obtained by setting a salt concentration of 108 mM and temperature of 298.15 K. For the plot in panel (a), r = –0.07 and P = 0.85 and for the plot in panel (b), r = 0.23 and P = 0.49. In panel (a), the horizontal error bars are the differences between the helicity values inferred from the two sets of experiments. In panel (b), the horizontal error bars represent the standard error about the mean helicity that is calculated across at least 10 independent simulations for each sequence variant. Panel (c) shows a comparison of mean helicities derived from AGADIR versus those derived from the simulated ensembles for all 51 sequences shown in Figs 6 and 7. With five times more data than in panels (a) and (c), the data in panel (c) establish a consistent lack of correlation (r = 0.1 and P = 0.48) between AGADIR and ABSINTH-based mean helicities. These results are consistent with previous observations made on a different set of IDPs that show favorable comparisons between simulation results and experimental data and poor correlations when using AGADIR-based predictions (Das et al., 2012).
Conclusions
We have succeeded in developing and deploying a systematic titration of intrinsic helicity profiles while satisfying the two constraints that we imposed on our design strategy. Deploying these designs in mechanistic experiments should enable detailed investigations of the impact of changes to intrinsic helicity, given a fixed amino acid composition, on the mechanisms of coupled folding and binding of IDPs that adopt helical conformations in their bound complexes. Experiments to investigate the effects of GADIS-based designs of PUMA on the binding to Mcl-1 are currently underway. Insights from these experiments should pave the way for an iterative procedure of assessing the effects of fewer or larger number of constraints on the designs. These designs that achieve target helicity profiles, when coupled to binding data, will help us uncover the sequence and structural determinants of specificity in coupled folding and binding.
Currently, GADIS can be deployed to any design problem that fits the PUMA archetype, and there are several such problems in the coupled folding and binding field. Interestingly, there are also several problems in spontaneous unimolecular folding that are similar in spirit to the coupled folding and binding problem. The folding of linear repeat proteins is one such example (Aksel and Barrick, 2009). Here, the free energy of folding is governed by the interplay between the intrinsic instability of a repeat versus the favorable interfacial free energy between repeats (Aksel et al., 2011). GADIS, in its current form, can be deployed to redesign helical units in repeat proteins to preserve the interfacial residues and amino acid compositions. This would enable a modulation of the balance between the intrinsic versus interfacial free energies and allow one to assess the impact of redesigns on overall stability and the cooperativity of folding. GADIS can also be generalized to work with fewer constraints on amino acid compositions or tightening the constraints in terms of specifying additional immutable residues that might contribute indirectly to stabilizing the interfaces between complexes. These generalizations of GADIS should be tailored to specific set of experiments that one has in mind since the algorithm has been developed to guide systematic sequence titrations that test specific hypotheses about intrinsic and coupling free energies.
Methods
All atom simulations
The simulations were performed using version 2.0 of the CAMPARI molecular modeling suite (http://camapri.sourceforge.net). This package provides full support for the ABSINTH implicit solvation model and forcefield paradigm (Vitalis and Pappu, 2009). In ABSINTH, the polypeptide chain and solution ions are modeled in atomistic detail. The solvent is modeled as a continuum that responds to conformational fluctuations through changes to atom-specific solvation states that modulate the reference free energies of solvation and solvent-mediated electrostatic interactions. All parameters for the forcefield were from the abs_3.2_opls.prm parameter file. Each simulation was initialized using a randomly generated self-avoiding conformation and distinct random seed. We set the simulation temperature to be 310 K and performed Metropolis Monte Carlo simulations using standard move sets that were previously deployed for simulations of other IDRs with intrinsic helicities (Das et al., 2012).
Design constraints and GADIS software
For PUMA, we use a numbering scheme that goes from 1 to 34. The overall amino acid composition is held fixed in the GADIS designs. All sequences were N-methylamidated at the N-terminus and acetylated at the C-terminus. Seven hydrophobic residues viz., W6, I10, L14, I17, A18, L21 and Y25 define the interfacial contacts between the folded PUMA sequence and Mcl-1. Accordingly, these seven are set as being immutable in the GADIS designs. This implies that their positions are held fixed and the identities are not changed when the swap/slide moves are deployed to generated offspring sequences. The implementation of heuristics that guide the GADIS-based design of offspring sequences is shown in the form of pseudo-code and is included as Fig. S1 of the Supplementary material. The evaluation of objective functions, the selection of parent sequences, and the generation of offspring sequences were implemented in MATLAB. The code was designed to interface with outputs from CAMPARI-based simulations.
UV-CD experiments
For the experiments, we purchased peptides with capped termini in pure form from Watsonbio Sciences. Mass spectrometry analysis from the vendor combined with amino acid analysis confirmed the identities of the peptides. All the peptides were reconstituted using 50 mM Sodium Phosphate pH 7.0, 0.05% (v/v) Tween 20. To remove residual salts, peptides were exchanged into 50 mM Sodium Phosphate pH 7.0, 0.05% (v/v) Tween 20 using HiTrap Desalting columns (GE Healthcare). The peptide concentrations for CD experiments were estimated using the absorbance measurements and use of Beer-Lambert law with an extinction coefficient of 7113 M−1 cm−1 at 280 nm. Final peptide stock concentrations were determined from the mean of two amino acid analysis runs. The final concentrations for UV-CD measurements were small and in the range of 2.5–10 µM. Care was taken to ensure that the results of our measurements are not confounded by peptide oligomerization.
For the CD measurements, each peptide was prepared and scanned in a single day. Peptides were diluted individually from the stock by weight. Two samples were prepared for each concentration. At least three different concentrations were scanned and compared to check for concentration dependence. The two samples from the highest concentration of peptide that did not show concentration dependence were averaged to give the final mean residue ellipticity. CD scans were performed at 25°C using an Applied Photophysics Chirascan and a 2 mm path length cuvette. Settings were 1 nm bandwidth and 15 s adaptive averaging. To rule out changes in signal as a function of time, separate measurements were performed following one-hour time intervals between the scans for each sample at the same concentration. The measured CD signal was converted to Mean Residue Ellipticity (MRE) by dividing through by the concentration (M), the cuvette path length (cm) and the total number of amino acid residues. For comparisons to computational results, the peptide MRE was reported as the mean of the highest concentration samples that did not display concentration dependence (3.5 μM for wild type, 5 μM for SBH2 and 10 μM for the remaining peptides).
Supplementary Material
Supplementary data
Funding
The US-National Science Foundation and US-National Institutes of Health supported this work through grants MCB-1121867 and 5RO1 NS056114, respectively to R.V.P. J.C. and S.L.S. were supported by the Wellcome Trust (WT 095195MA). M.D.C. was supported by a Biotechnology and Biological Sciences Research Council (BBSRC) studentship.
References
- Aksel T. and Barrick D. (2009) Methods Enzymol, 455, 95–125. First published on 2009/03/18, doi:10.1016/s0076-6879(08)04204-3. [DOI] [PMC free article] [PubMed] [Google Scholar]
- Aksel T., Majumdar A. and Barrick D. (2011) Structure, 19, 349–360. First published on 2011/03/15, doi:10.1016/j.str.2010.12.018. [DOI] [PMC free article] [PubMed] [Google Scholar]
- Aurora R. and Rose G.D. (1998) Protein Sci., 7, 21–38. First published on 1998/03/26, doi:10.1002/pro.5560070103. [DOI] [PMC free article] [PubMed] [Google Scholar]
- Babu M.M., Kriwacki R.W. and Pappu R.V. (2012) Science, 337, 1460–1461. First published on 2012/09/21, doi:10.1126/science.1228775. [DOI] [PubMed] [Google Scholar]
- Baker N.A., Sept D., Joseph S., Holst M.J. and McCammon J.A. (2001) Proc. Natl. Acad. Sci. U.S.A., 98, 10037–10041. First published on 2001/08/23, doi:10.1073/pnas.181342398. [DOI] [PMC free article] [PubMed] [Google Scholar]
- Borcherds W., Theillet F.-X., Katzer A. et al. (2014) Disorder and residual helicity alter p53-Mdm2 binding affinity and signaling in cells. Nat. Chem. Biol., 10, 1000–1002. First published on 2014/11/02, doi:10.1038/nchembio.1668 http://www.nature.com/nchembio/journal/v10/n12/abs/nchembio.1668.html - supplementary-information. [DOI] [PubMed] [Google Scholar]
- Brown C.J., Johnson A.K., Dunker A.K. and Daughdrill G.W. (2011) Curr. Opin. Struct. Biol., 21, 441–446. First published on 2011/04/11, doi:http://dx.doi.org/10.1016/j.sbi.2011.02.005. [DOI] [PMC free article] [PubMed] [Google Scholar]
- Chen Y.H. and Yang J.T. (1971) Biochem. Biophys. Res. Commun., 44, 1285–1291. First published on 1971/09/17. [DOI] [PubMed] [Google Scholar]
- Chen Y.H., Yang J.T. and Chau K.H. (1974) Biochemistry, 13, 3350–3359. First published on 1974/07/30. [DOI] [PubMed] [Google Scholar]
- Das R.K., Crick S.L. and Pappu R.V. (2012) N-Terminal Segments Modulate the alpha-Helical Propensities of the Intrinsically Disordered Basic Regions of bZIP Proteins. J. Mol. Biol., 416, 287–299. First published on 2011/12/28, doi:10.1016/j.jmb.2011.12.043. [DOI] [PubMed] [Google Scholar]
- Dogan J., Jonasson J., Andersson E. and Jemth P. (2015) Biochemistry, 54, 4741–4750. First published on 2015/07/15, doi:10.1021/acs.biochem.5b00520. [DOI] [PubMed] [Google Scholar]
- Dunker A.K., Brown C.J., Lawson J.D., Iakoucheva L.M. and Obradovic Z. (2002) Biochemistry, 41, 6573–6582. First published on 2002/05/01, doi:10.1021/bi012159+. [DOI] [PubMed] [Google Scholar]
- Dyson H.J. and Wright P.E. (2002) Curr. Opin. Struct. Biol., 12, 54–60. First published on 2002/02/05, doi:10.1016/s0959-440x(02)00289-0. [DOI] [PubMed] [Google Scholar]
- Dyson H.J. and Wright P.E. (2005) Nat. Rev. Mol. Cell. Biol., 6, 197–208. First published on 2005/03/06, doi:10.1038/nrm1589. [DOI] [PubMed] [Google Scholar]
- Gianni S., Dogan J. and Jemth P. (2016) Coupled binding and folding of intrinsically disordered proteins: what can we learn from kinetics. Curr. Opin. Struct. Biol., 36, 18–24. First published on 2016/01/01, doi:10.1016/j.sbi.2015.11.012. [DOI] [PubMed] [Google Scholar]
- Greenfield N. and Fasman G.D. (1969) Biochemistry, 8, 4108–4116. First published on 1969/10/01. [DOI] [PubMed] [Google Scholar]
- Kiefhaber T., Bachmann A. and Jensen K.S. (2012) Curr. Opin. Struct. Biol., 22, 21–29. First published on 2011/12/02, doi:10.1016/j.sbi.2011.09.010. [DOI] [PubMed] [Google Scholar]
- Lacroix E., Viguera A.R. and Serrano L. (1998) Elucidating the folding problem of alpha-helices: Local motifs, long-range electrostatics, ionic-strength dependence and prediction of NMR parameters. J. Mol. Biol., 284, 173–191. First published on 1998/11/20, doi:10.1006/jmbi.1998.2145. [DOI] [PubMed] [Google Scholar]
- Moesa H.A., Wakabayashi S., Nakai K. and Patil A. (2012) Mol. Biosyst., 8, 3262–3273. First published on 2012/10/18, doi:10.1039/C2MB25202C. [DOI] [PubMed] [Google Scholar]
- Mohan A., Oldfield C.J., Radivojac P., Vacic V., Cortese M.S., Dunker A.K. and Uversky V.N. (2006) J. Mol. Biol., 362, 1043–1059. First published on 2006/08/29, doi:10.1016/j.jmb.2006.07.087. [DOI] [PubMed] [Google Scholar]
- Peng Z.L., Oldfield C.J., Xue B., Mizianty M.J., Dunker A.K., Kurgan L. and Uversky V.N. (2014) Cell. Mol. Life Sci., 71, 1477–1504. First published on 2013/08/13, doi:10.1007/s00018-013-1446-6. [DOI] [PMC free article] [PubMed] [Google Scholar]
- Rogers J.M., Oleinikovas V., Shammas S.L., Wong C.T., De Sancho D., Baker C.M., Clarke J.2014. a, Proc. Natl. Acad. Sci. U.S.A. 111, 15420–15425. First published on 2014/10/13, doi:10.1073/pnas.1409122111. [DOI] [PMC free article] [PubMed] [Google Scholar]
- Rogers J.M., Steward A. and Clarke J. (2013) J. Am. Chem. Soc., 135, 1415–1422. First published on 2013/01/11, doi:10.1021/ja309527h. [DOI] [PMC free article] [PubMed] [Google Scholar]
- Rogers J.M., Wong C.T., Clarke J.(2014. b) J. Am. Chem. Soc., 136, 5197–5200. First published on 2014/03/21, doi:10.1021/ja4125065. [DOI] [PMC free article] [PubMed] [Google Scholar]
- Vacic V., Oldfield C.J., Mohan A., Radivojac P., Cortese M.S., Uversky V.N. and Dunker A.K. (2007) J. Proteome Res., 6, 2351–2366. First published on 2007/05/10, doi:10.1021/pr0701411. [DOI] [PMC free article] [PubMed] [Google Scholar]
- van der Lee R., Buljan M., Lang B. et al. (2014) Chem. Rev., 114, 6589–6631. First published on 2014/04/29, doi:10.1021/cr400525m. [DOI] [PMC free article] [PubMed] [Google Scholar]
- Vitalis A. and Pappu R.V. (2009) J. Comput. Chem., 30, 673–699. First published on 2008/05/28, doi:10.1002/jcc.21005. [DOI] [PMC free article] [PubMed] [Google Scholar]
- Wright P.E. and Dyson H.J. (2015) Nat. Rev. Mol. Cell. Biol., 16, 18–29. First published on 2014/12/23, doi:10.1038/nrm3920. [DOI] [PMC free article] [PubMed] [Google Scholar]
- Wright P.E. and Dyson H.J. (1999) Intrinsically unstructured proteins: Re-assessing the protein structure-function paradigm. J. Mol. Biol., 293, 321–331. First published on 1999/10/22, doi:10.1006/jmbi.1999.3110. [DOI] [PubMed] [Google Scholar]
- Wright P.E. and Dyson H.J. (2009) Curr. Opin. Struct. Biol., 19, 31–38. First published on 2009/01/23, doi:10.1016/j.sbi.2008.12.003. [DOI] [PMC free article] [PubMed] [Google Scholar]
Associated Data
This section collects any data citations, data availability statements, or supplementary materials included in this article.


