Abstract
Aims/hypothesis
Obesity is a global epidemic resulting from increased energy intake, leading to increased circulating free fatty acids, altering energy homeostasis and resulting in an imbalance in fat storage and breakdown. G0/G1 switch gene 2 (G0S2) has been recently characterized in vitro as an inhibitor of Adipose triglyceride lipase (ATGL), the rate-limiting step in fat catabolism. In the current study we aim to functionally characterize G0S2 within the physiological context of a mouse model.
Methods
We generated a mouse model in which G0S2 was deleted. G0S2 knockout mice were studied over a period of 22 weeks. Metabolic parameters were measured including body weight and body composition, food intake, glucose and insulin tolerance tests, energy metabolism and thermogenesis.
Results
We report that G0S2 inhibits ATGL and regulates lipolysis and energy metabolism in vivo. G0S2-knockout mice are lean, resistant to weight gain induced by high fat diet feeding and are glucose tolerant and insulin sensitive. White adipose tissues of G0S2-knockout mice have enhanced lipase activity and adipocytes showed enhanced stimulated lipolysis. Energy metabolism in the knockout mice is shifted toward enhanced lipid metabolism and increased thermogenesis. G0S2 knockout mice showed enhanced cold tolerance and increased expression of thermoregulatory and oxidation genes within white adipose tissue suggesting enhanced “browning” of the knockout-white adipose tissues.
Conclusions/Interpretation
Our data show that G0S2 is a physiological regulator of adiposity and energy metabolism and is a potential target in the treatment of obesity and insulin resistance.
Keywords: G0S2, ATGL, lipolysis, obesity, thermogenesis, energy expenditure
Introduction
Obesity is recognized as a global epidemic with increasing health complications. It is closely associated with several metabolic diseases known as the “metabolic syndrome” (reviewed in [1]), characterized by dyslipidemia, hypertension, nonalcoholic fatty liver disease, insulin resistance and others. These metabolic complications are associated with elevated risk for type 2 diabetes. The increase in fat mass particularly in the intra-abdominal area is closely associated with insulin resistance [2], subsequently leading to type 2 diabetes. In states of nutrient deprivation such as fasting or energy-demand (e.g. exercise) by the cell, fat stored in adipocytes are mobilized by a series of lipolytic enzymes acting in concert and leading to the release non-esterified fatty acids (FFAs) into the circulation. Adipose triglyceride lipase (ATGL) [3–5], the first and rate-limiting enzyme in this series acts on triacylglycerol (TG) stored in adipocyte, hydrolyzes it into diacylglycerol (DAG). Hormone-sensitive lipase (HSL) [6, 7] and monoglyceride lipase (MAGL) further hydrolyze DAG and monoacylglycerol (MAG) consecutively ultimately leading to FFA release into the circulation. Increased circulating FFAs levels is strongly associated with insulin resistance and plays a major role in the pathogenesis of type 2 diabetes [8]. Thus, lipid homeostasis is governed by genes and signaling molecules responsible for maintaining energy homeostasis.
ATGL activity was shown to be strongly stimulated by comparative gene identification-58 (CGI-58) protein [9], and mutations in either gene are linked to neutral lipid storage disease (NLSD) in humans [10]. Despite the physiological importance of lipid and energy homeostasis in human health, these processes are not yet fully understood. Recently, G0/G1 switch gene 2 (G0S2) emerged as a potential player in lipid homeostasis regulating the rate-limiting step of lipid catabolism. G0S2 was shown to inhibit ATGL catalytic activity by directly interacting with its N-terminal patatin domain, the same domain required for CGI-58 interaction [11], however it does not compete with CGI-58 binding [12]. G0S2 was also shown to inhibit ATGL activity and regulate its localization in human adipose tissues [13].
G0S2 is ubiquitously expressed and has been shown to localize to different cellular compartments including endoplasmic reticulum, mitochondria and lipid droplets [11, 14–16]. G0S2 has been initially implicated in cell cycle control [17]. We identified G0S2 in TNF-α screen of primary human fibroblasts and showed that it interacts and inhibits the antiapoptotic protein Bcl2 [16]. Moreover, others reported on G0S2 as a PPARγ target gene containing a PPAR-response element [14] and a carbohydrate response element (ChoRE) in its promoter region [18]. Thus, G0S2 is emerging as an important regulator of intracellular lipid metabolism but its hypothesized functions have yet to be placed within the physiological context of the whole organism.
In this study, we focused on the metabolic aspects of G0S2 and its regulation of ATGL in a mouse model where the G0S2 gene is deleted. We investigated the role of G0S2 in lipid metabolism and energy homeostasis in vivo and examined the fate of FFAs released. We report that G0S2-knockout mice are leaner, attenuate high fat diet-induced obesity, insulin sensitive and cold tolerant.
Methods
Generation of G0S2-knockout mice
G0S2-deficient mice were generated by homologous recombination in ES cells. A schematic of the targeting strategy is shown in figure 1A and additional information is described in supplemental methods. All animal protocols were approved by the Canadian Council on Animal care and the McGill University Animal Care committee. Male and female 129SvEv (wt) and G0S2-deficient mice were housed under controlled environment with 21°C temperature and on a 12 hour light/dark cycle with free access to food and water.
Fig. 1.
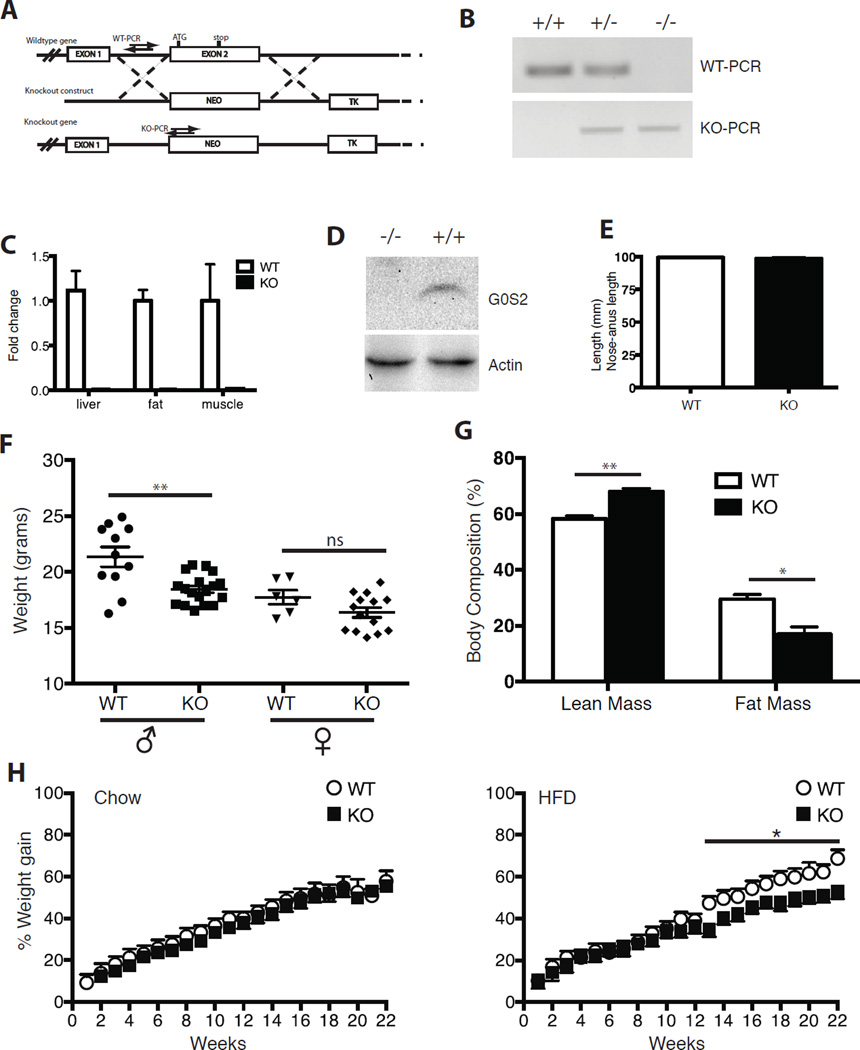
Effects of G0S2 deletion on weight gain. (A) schematic representation of the G0S2 knockout gene with locations of primers used for genotyping indicated. (B) PCR genotyping of G0S2 wt, heterozygote and knockout genes as described in methods (C) G0S2 expression levels in liver, fat and muscle tissues. (D) G0S2 protein levels in liver lysates. (E) comparison of body length of wt and KO mice. (F) comparison of body weights of male and female mice at 6-weeks on chow diet. n=11 for wt and 18 for KO male mice; n=6 for wt and 14 for female KO mice. (G) Body mass composition of 22 week old male wt and KO mice on chow diet. n=8 for wt and 7 for KO mice. H) percentage of weight gain of male mice housed on either chow or HFD for 22 weeks. n=8 for wt mice on both diets; n=13 on chow diet and n=12 for KO mice on HFD. Data are represented as mean ± SEM. * P<0.05, **P<0.001.
Weight studies
Mice were placed on HFD at 6 weeks of age (24.6% carbohydrates, 21% protein, 54.3% fat on caloric basis, Harlan Teklad, WI) or chow diet (60% carbohydrates, 24% protein, 16% fat on caloric basis; Harlan, Teklad) for 22 weeks. Body weights were measured and recorded on weekly basis and expressed as percentage of weight gain. At the end of the experiment, mice were killed and tissues were rapidly collected, weighed and either frozen in liquid nitrogen and stored at −80°C until time of analysis or processed for histological analysis.
Body mass composition
Analysis of whole-body fat and lean mass in fed mice (18 weeks old) was determined using EchoMRI 100 (Houston, TX).
In vivo Metabolic measurements
Food intake, energy expenditure, heat production and physical activity were measured in male mice (18–20 weeks old) in the Oxymax-CLAMS system (Columbus Instruments) housed at a normal light cycle with a 12 hour light/dark period with free access to water and food. Mice were placed on HFD for 14 weeks. The respiratory quotient (RQ) was calculated as VCO2/VO2.
Thermogenesis measurements
12-week old mice on either chow diet or HFD (9-weeks HFD) were housed individually and were exposed to cold temperature (4°C) for 30 hours in the chow group and 8 hours in the HFD group with access to food and water. Periodic measurements of body temperature using a digital rectal probe were performed (physitemp Instruments Inc, NJ).
Adipocyte measurements
Histological analyses were performed on haematoxylin and eosin (H&E) stained cross-sectional images using ImageJ software. More than 1500 cells on 10× images and 9000 nuclei on 20× images were counted manually using the cell counter plugin available on ImageJ from each genotype for WAT and BAT respectively.
Adipocyte differentiation and lipolysis measurement preadipocytes isolated from 3–4 week old mice were differentiated as described previously [19]. Glycerol (BioVision Incorporated) and FFA (Wako Chemicals) were measured according to the manufacturer’s instructions using appropriate standards. Data were normalized to protein content.
Real Time Quantitative PCR analysis
QRTPCR analysis and primers used are listed in supplemental methods and in table S1.
Western Blot Analysis proteins (40 ug) of either liver, WAT or BAT extracts were separated on Bio-Rad precast gels 4–15% mini-protean® TGX. Gels were transferred using the Trans-Blot® Turbo™ transfer system (Bio-Rad) using the Trans-blot ® Turbo™ transfer pack on PVDF membrane. G0S2, ATGL, HSL and UCP1 were determined with G0S2 [13], ATGL, HSL (Cell Signaling) and UCP1 (Abcam). Quantification was done using Image lab (BioRad). Immunoblots were performed twice in duplicates with one representative gel presented.
Statistical analyses
Data are presented as the mean ± SEM analyzed by graphpad prism software using unpaired two-tailed Student’s t-test. *P<0.05 was considered significant.
Results
G0S2-knockout mice are resistant to diet-induced obesity
To understand the role of G0S2 gene in lipolysis and whole body metabolism, we generated mice with targeted G0S2 deletions using homologous recombination (Figure 1A–B). G0S2 mRNA and protein levels are shown in Fig (1C,D). All experiments were performed in the 129SvEv genetic background. The homozygous G0S2-knockout (G0S2−/−) mice are viable and fertile however, are leaner compared to littermate controls (Fig S1A) with no difference in body length (Fig 1E). Figure 1F shows weights of mice at 6-weeks of age on chow diet. Both male and female G0S2−/− were leaner compared to littermate controls; however, only in male G0S2−/− mice was the reduced weight statistically significant (21.36 g ± 0.8 for wt versus 18.47 g ± 0.3 for G0S2−/− mice, P = 0.001). Analysis of body composition using MRI showed an increase in whole body lean mass and a decrease in fat mass by around 15% and 50% respectively (Fig. 1G) in 18-week old G0S2−/− mice. To further elucidate the effects of G0S2 on body weight, wt and G0S2−/− mice were placed either on chow or HFD and weights were recorded weekly for 22 weeks. There was no difference in weight gain between wt and G0S2−/− mice on chow diet, however, on HFD G0S2−/− mice were clearly leaner and resistant to obesity induced by HFD (Figure 1H and S1B). The resistance to weight gain became apparent at around 12 weeks of HFD feeding and persisted until the end of the experiment. Although 129SvEv background mice are known to be somewhat resistant to diet induced obesity [20, 21], G0S2−/− male mice showed increased resistance to HFD-induced obesity compared to wt littermates.
Blood chemistry analyses of wt and G0S2−/− mice are shown in Table 1. There were no significant changes in any of the measured parameters in either fed or fasted states including glucose, insulin or TG. Sera triglyceride (TG) levels were decreased in knockout mice under HFD conditions but did not achieve statistical significance.
Table 1.
Plasma levels of glucose, insulin, FFA, TG, cholesterol and HDL in 22 week old fed or overnight fasted male wt and G0S2−/− mice on chow and HFD
| Chow | HFD | |||
|---|---|---|---|---|
| wt | G0S2−/− | wt | G0S2−/− | |
| Glucose (mmol/l) | 4.8 ± 0.18 (n=8) |
4.26 ± 0.18 (n=10) |
5.57 ± 0.32 (n=8) |
5.8 ± 0.2 (n=11) |
|
Glucose (mmol/l) (Fed) |
8.3 ± 0.13 (n=8) |
8.1 ± 0.12 (n=10) |
8.3 ± 0.13 (n=8) |
8.3 ± 0.18 (n=10) |
|
Insulin (ng/ml) (Fed) |
0.51 ± 0.08 (n=6) |
0.49 ± 0.03 (n=6) |
1.40 ± 0.28 (n=8) |
1.25 ± 0.30 (n=9) |
| FFA (mmol/l) | 1.41 ± 0.28 (n=8) |
1.22 ± 0.16 (n=13) |
1.35 ± 0.14 (n=8) |
0.94 ± 0.13 (n=12) |
| TG (mmol/l) | n.d. | n.d. | 9.23 ± 2.2 (n=7) |
8.83 ±1.1 (n=11) |
|
Cholesterol (mmol/l) |
3.6 ± 0.08 (n=6) |
3.49 ± 0.15 (n=11) |
3.9 ± 0.21 (n=8) |
3.9 ± 0.16 (n=12) |
| HDL (mmol/l) | 3.58 ± 0.12 (n=6) |
3.4 ± 0.19 (n=11) |
4.02 ± 0.16 (n=8) |
3.9 ± 0.13 (n=12) |
Although no overall differences in FFA levels were observed, we determined if specific FFA species were affected. Studies of MAGL have suggested that alterations in lipase activity can lead to differences in the profile of specific FFA species [22]. We therefore determined if this was also the case in G0S2−/− mice. FFA profiling using gas chromatography coupled to mass spectrometry (GC-MS) on lipids from visceral fat (Fig. S2) was performed but did not show statistical differences between genotypes.
G0S2−/− mice have reduced fat deposition in the liver
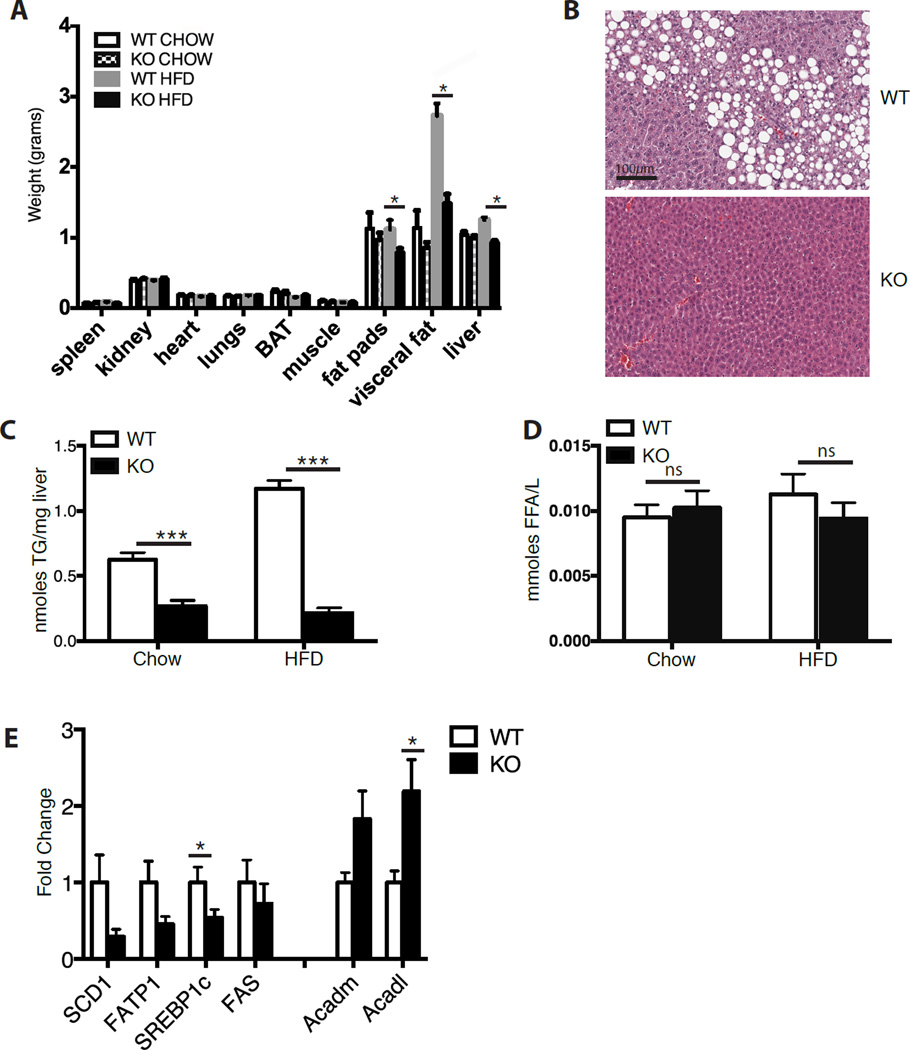
Analysis of organ weights and morphology showed no significant changes between genotypes under conditions of chow diet (Fig. 2A); however, under HFD significant increases were observed in weights of liver and WAT of wt animals that were not apparent in knockout mice (Fig. 2A). Histological analysis of liver sections showed increased fat deposition in the form of lipid droplets in wt mice, which were completely absent in G0S2−/− mice (Fig. 2B). TG levels in livers of wt mice were on average 60% higher than those of the G0S2−/− mice when fed chow diet. Under HFD, differences in TG levels were even greater with wt having approximately 80% more TG relative to knockouts (p < 0.0001) (Fig. 2C). Surprisingly, no differences were observed in the levels of FFA in liver (Fig. 2D) suggesting that FFAs may be rapidly utilized or oxidized in G0S2−/− mice. Consistent with the observation showing less fat deposition in livers of G0S2−/− mice, we generally observed reduced expression of genes encoding lipogenic factors such as SCD1 and SREBP1c and elevated levels of lipid oxidative genes (Fig. 2E).
Fig. 2.
TG accumulation in livers of G0S2−/− mice. (A) Analysis of body organs in mice on chow and HFD. (B) Representative images of H&E staining of liver sections of mice on HFD. n=4 per genotype. (C) Liver triglyceride (D) Liver FFA levels of mice on chow and HFD. (E) gene expression analysis of lipogenic and oxidative genes in livers of mice on HFD normalized to cyclophilin. (F) gene expression levels of CPT1-α and PGC1-α normalized to cyclophilin. Values represent means ± SEM. n= 8 for wt and 11 for G0S2−/− mice on chow diet; n= 5 for wt and 8 for G0S2−/− mice on HFD. *P<0.05, ***P<0.0001.
G0S2−/− mice have smaller adipocytes and elevated lipolysis
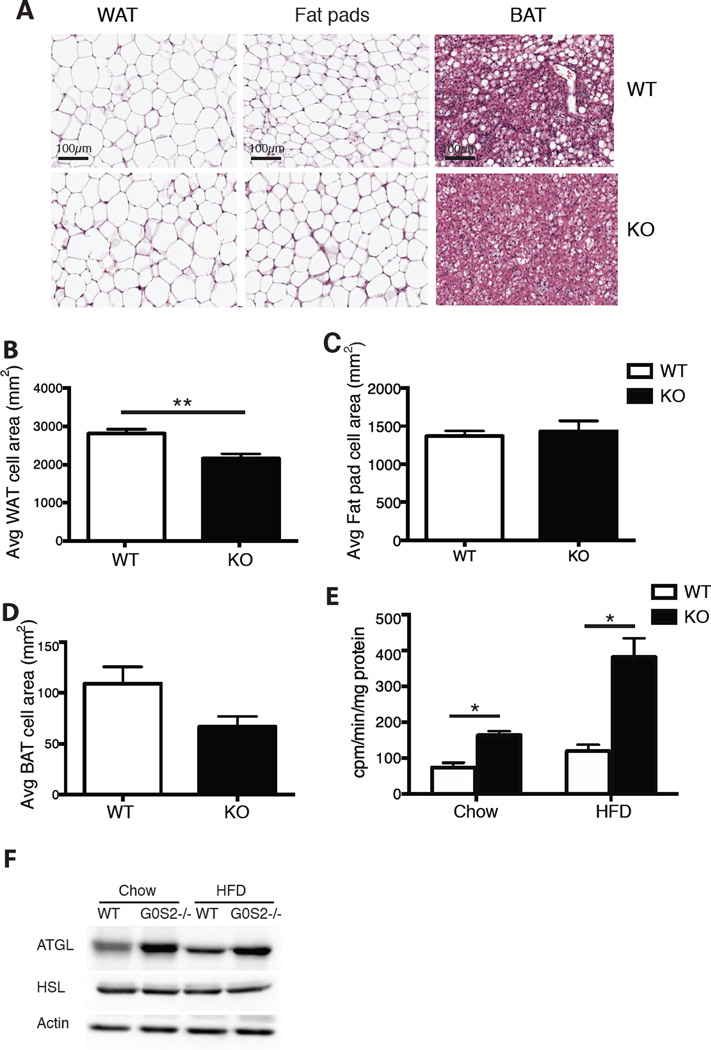
Figure 2A indicated that reduced body mass of the G0S2−/− is due primarily to differences in weight of visceral fat. On HFD, but not chow, weights of visceral fat were significantly elevated in wt animals relative to G0S2−/−. Further analyses of histological sections of visceral fat (Fig. 3A) showed a decrease in the average area of individual adipocytes in G0S2−/− mice (Fig. 3B). This again suggests that in G0S−/− mice, the adipocytes are smaller due to enhanced lipolysis and a decrease in the accumulation of TG. Similar trends were observed with brown adipose tissue (BAT) although the values did not reach statistical significance (Fig. 3A,D). No changes were observed in the size of fat pads between wt and G0S2−/− mice (Fig. 3A,C).
Fig. 3.
G0S2−/− mice have decreased adipocytes size and enhanced lipase activity. (A) H&E staining of WAT, fat pads and BAT of mice on 22 weeks of HFD. (B) WAT area, (C) fat pad area, (D) BAT area. (E) TG hydrolase activity measured in visceral fat extracts of male mice on chow and HFD. (F) protein levels of ATGL and HSL in visceral lysates of wt and KO mice. Values represent means ± SEM. (n=4 per genotype for adipocyte area and n=6 per genotype for TG hydrolase activity). n=4 per genotype for protein levels. *P<0.05, **P<0.005.
To understand the role of G0S2 on lipolysis in vivo, we measured TG hydrolase activity in visceral fat from wt and G0S2−/− mice. TG hydrolase activity was significantly higher in G0S2−/− mice compared to wt littermate controls (~2 fold increase) consistent with G0S2 being a lipase inhibitor (Fig. 3E) [13, 15]. Moreover, activity was even further enhanced in G0S2−/− mice fed HFD (more than 2.5 fold) compared with wt controls (Fig. 3E). In addition, to the increased lipase activity in G0S2−/− mice, ATGL protein levels were also increased under both chow and HFD conditions in G0S2−/− mice (Fig. 3F) suggesting that G0S2 may inhibit ATGL activity by decreasing steady state levels of the enzyme. No changes were observed in levels of HSL under both diets (Fig. 3F). No changes were observed at the expression level of these genes (supplementary Fig. S3).
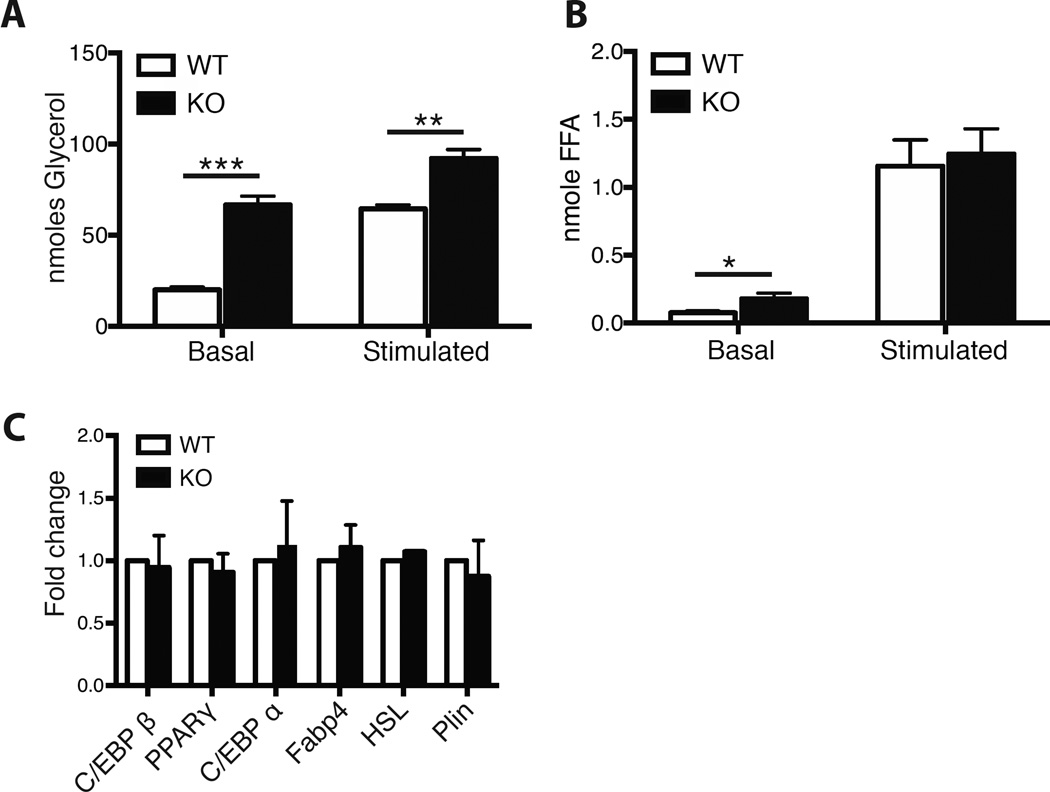
We further analyzed preadipocytes isolated from 3-week old wt and G0S2−/− mice differentiated in vitro. Once differentiated adipocytes were stimulated with the β-adrenergic agonist, isoproterenol (10uM) for 2 hours. Glycerol and FFA levels were measured in the media. Figure 4 shows increased basal and stimulated lipolysis as measured by glycerol release (Fig 4A) in G0S2−/− adipocytes. FFA levels were also increased under both conditions in G0S2−/− adipocytes (Fig 4B). In vivo lipolysis was also carried out in fasted 10–12 week wt and G0S2−/− mice treated with the β3-adrenergic receptor agonist isoproterenol. As expected, treating mice with isoproterenol increased serum free glycerol levels in all mice indicating hormone stimulated lipolysis; however, there were no significant differences between wt and G0S2−/− mice glycerol levels (Data not shown).
Fig. 4.
Deletion of G0S2 enhances lipolysis. In vitro lipolysis of differentiated adipocytes from 3 week old mice under basal and isoproterenol stimulated conditions. (A) Glycerol levels, (B) FFA levels under control and stimulated conditions. (n=9–10 mice per condition). (C) gene expression analysis of adipogenic differentiation markers. Data are normalized to cyclophilin. *P<0.05, **P<0.001, ***P<0.0001.
To determine whether the decrease in adipocyte size is related to G0S2-regulation of adipocyte differentiation, gene expression analysis of adipocyte transcription factors and differentiation genes was performed [23–25]. Figure 4C shows there were no significant changes between genotypes indicating that deletion of G0S2 does not interfere with adipocyte differentiation. Thus, the lean phenotype and decrease in adipocyte size observed in absence of G0S2 is likely due to elevated ATGL activity and enhanced lipolysis.
G0S2−/− mice displayed improved glucose and insulin tolerance on high fat feeding
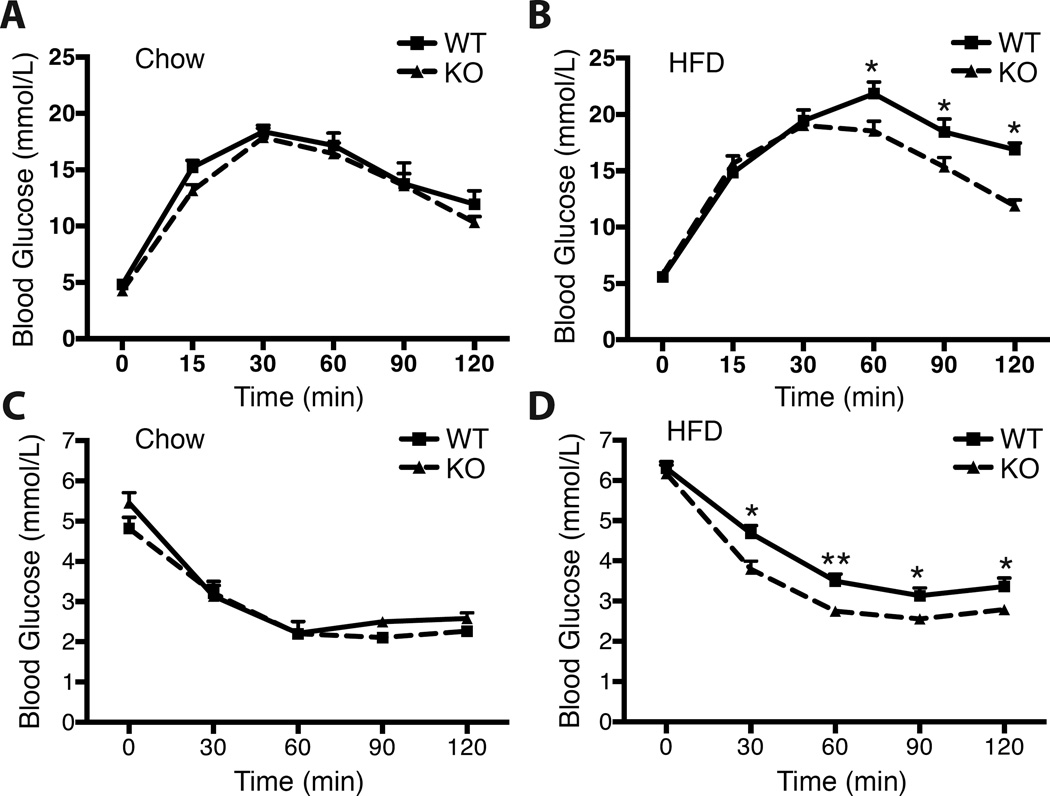
To examine whether insulin resistance developed in mice on HFD, intraperitoneal glucose (IPGTT) and insulin (IPITT) tolerance tests were performed on overnight-fasted male wt and G0S2−/− mice (Fig. 5). On chow diet, glucose and insulin response curves were not different (Figs. A,C). However, in high-fat fed mice, plasma glucose levels were higher in wt mice suggesting increased glucose tolerance in the knockout mice (Fig. 5B). Moreover, G0S2−/− mice exhibited lower levels of hyperglycemia in response to insulin load (Fig. 5D), suggesting that mice are more insulin tolerant. IPITT performed on female mice showed no changes between genotypes on either diet (supplementary Fig. S4). Insulin levels during GTT is shown in supplementary figure S4E.
Fig. 5.
Improved glucose and insulin sensitivity in G0S2−/− mice. Blood glucose levels during IPGTT (A,B) and IPITT (C,D) in fasted mice on (A,C) chow diet and (B,D) HFD. Values represent means ± SEM. n= 8 for wt and 13 for G0S2−/− mice *P<0.05, **P<0.001.
Enhanced energy expenditure in G0S2-knockout mice
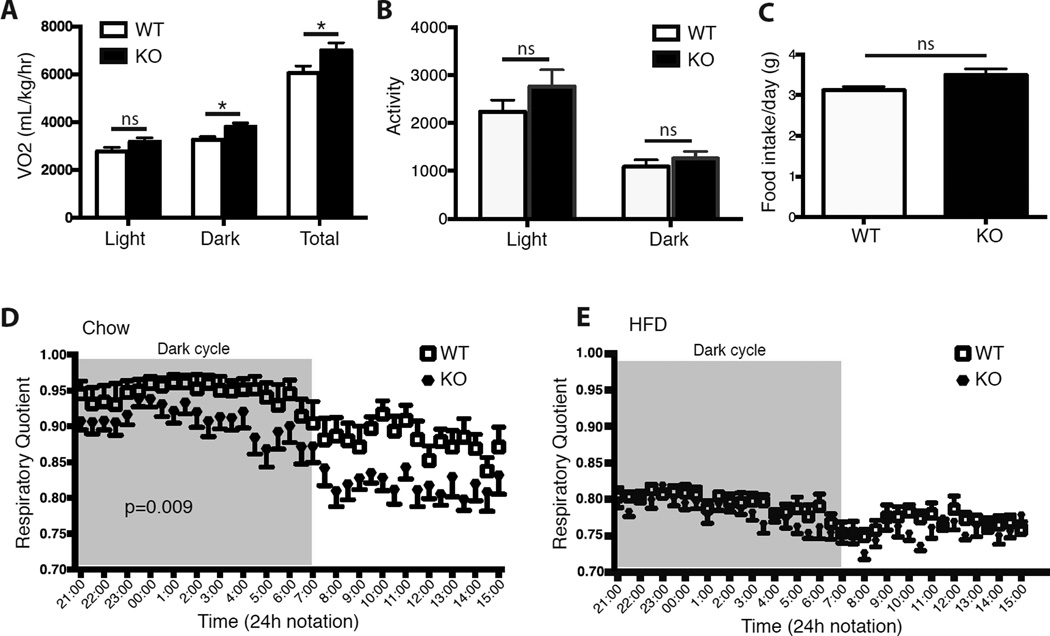
G0S2−/− mice are leaner and accumulate significantly less fat suggesting enhanced energy expenditure. To further study this phenotype, mice fed either chow or HFD were placed in metabolic cages (Columbus Instruments, Ohio) for 4 days with free access to food and H2O. Oxygen consumption, activity and body temperature were recorded. Oxygen consumption measurements (VO2) showed an increase in G0S2−/− mice both in light and dark cycles (around 20%), however the measurement was only statistically significant in dark cycle (Fig. 6A). No significant differences were observed in activity or food intake throughout the course of the metabolic cage analysis (Fig. 6B–C), confirming that the increased energy expenditure is not linked to physical activity or food intake, but is rather due to intrinsic changes in metabolism in G0S2−/− mice.
Fig. 6.
Increased energy expenditure in G0S2−/− mice. Mice were housed individually for 4 days in metabolic cages fed either chow or HFD (A) VO2 levels on HFD, (B) ambulatory activity of mice on HFD, (C) food intake on chow diet. Respiratory quotient in mice fed (D) chow, (E) HFD diet. Values represent means ± SEM. n=7 per genotype. *P<0.05.
Intriguingly, on chow diet the respiratory quotient (RQ), which represents the ratio of (VCO2/VO2), was shifted towards 0.7 in G0S2−/− mice indicating that fat is a preferred substrate in these animals (Fig 6D). The lower RQ is consistent with the G0S2−/− animals having enhanced lipolysis and fat metabolism. The RQ values of wt and G0S2−/− mice were nearly identical once animals were placed on HFD since this forces utilization of lipid in both groups (Fig. 6E).
Enhanced thermogenesis in G0S2-knockout mice
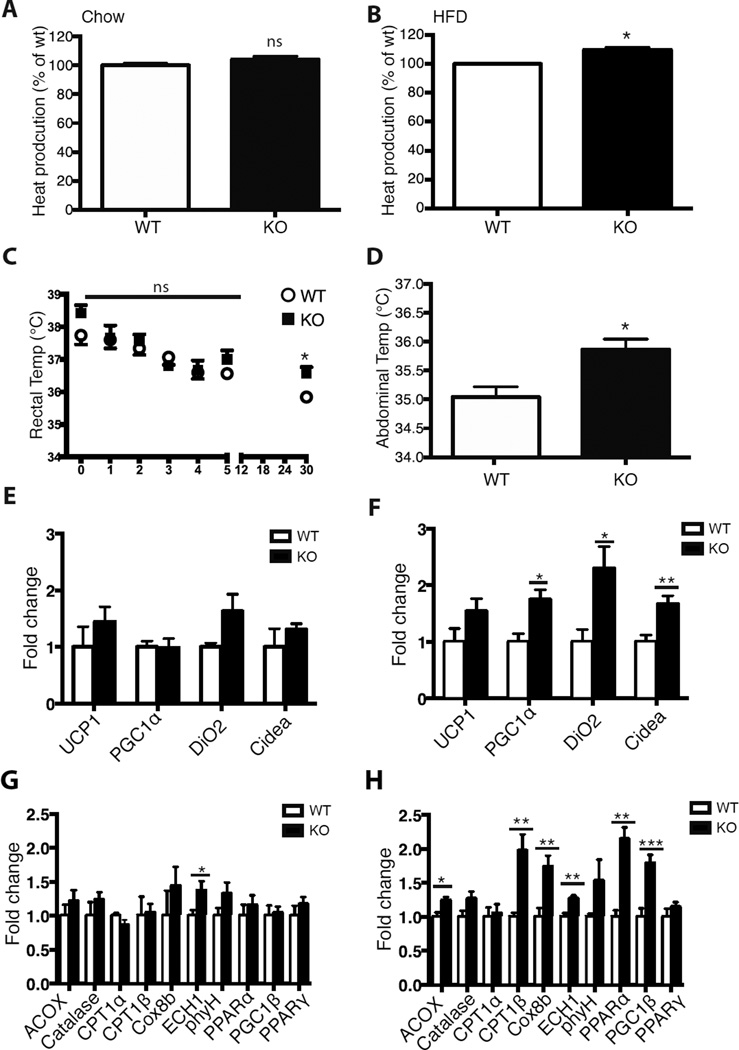
Brown adipocytes, unlike white adipocytes, produce heat as a means to counteract hypothermia, obesity, and diabetes. Brown fat have a high mitochondrial content and mitochondrial uncoupling protein UCP1 can be utilized to uncouple respiration and dissipate chemical energy as heat. Analysis of G0S2−/− mice housed in metabolic cages, showed an increase in heat production (Fig 7A–B) on 14 weeks of HFD conditions (Fig 7B). mRNA and protein levels of ATGL, HSL and UCP1 were measured in BAT tissue and showed a slight increase in UCP1 levels under HFD conditions (supplementary Fig. S5). These data prompted us to investigate G0S2−/− mice adaptation to cold exposure. Mice (12 weeks old) on chow diet were exposed to 4°C and their rectal temperature was recorded every hour for the first 5 hours and then at 30 hours (Fig 7C). G0S2−/− mice had an approximately 0.7°C higher temperature than wt mice. Moreover, their abdominal temperature was measured at 30 hours and was on average 0.8°C higher in G0S2−/− animals relative to wt (Fig 7D). These data suggest that G0S2−/− mice are overall more thermogenic and the heat generated is able to counteract obesity.
Fig. 7.
Increased thermogenicity and oxidation in G0S2−/− mice Body temperature was measured indirectly as heat production in metabolic cages. (A) chow, (B) HFD. (C,D) Mice on chow diet were housed for 30 hours at 4°C and (C) rectal temperature, (D) Abdominal temperatures were recorded. (E–H) Mice on 9-week HFD were housed at 4°C for 8 hours and expression analysis of thermogenic genes at normal temperature (E) and 4°C (F) and oxidation genes at room temperature (G) and 4°C (H) were done. n=7–8 per genotype. *P<0.05,**P<0.001, ***P<0.0001.
We next examined whether BAT molecular markers were increased in WAT of G0S2−/− mice at normal and cold temperatures. HFD-fed G0S2-knockout mice expressed higher levels of brown fat genes at normal temperature (Fig. E) and these were more enriched and significant under cold temperature (4°C) (Fig. 7F). We observed an increase in the expression levels of key thermogenic genes such as UCP1, DIO2 in G0S2−/− mice (Fig. 7E, F). This overall increase in selective brown fat genes in G0S2−/− WAT suggests an overall browning of these tissues. In addition, there was a significant increase in genes coding for both mitochondrial and peroxisomal FA oxidation (Fig. 7G, H) such as Cox8b, ACOX, PPARα, CPT1β, PGC1α, PGC1β and ECH1. These results suggest that the increased thermogenesis and browning of WAT are likely to be responsible for the enhanced energy dissipation in the knockout mice.
Discussion
In this study we report our findings on the role of G0S2 as an in vivo lipase inhibitor and on its role in the development of diet-induced obesity. Deletion of G0S2 was sufficient to attenuate effects of HFD-induced obesity. Mice lacking G0S2 expression had elevated TG hydrolase activity, were leaner and resistant to HFD weight increase compared to wt littermates. In addition, lipolysis was enhanced in differentiated adipocytes isolated from G0S2−/− mice and markedly enhanced in response to stimulation by isoproterenol. G0S2−/− mice had reduced triglyceride levels in liver and plasma and both WAT and BAT cells were smaller compared to wt controls. In addition, G0S2−/− mice had improved glucose tolerance and insulin sensitivity and were more thermogenic due to enhanced fat catabolism. Thus, taken together the data provide strong evidence showing G0S2 is a key regulator of lipid metabolism in vivo.
Several recent studies have highlighted a variety of functions for G0S2 [13, 15, 16]. G0S2 was initially reported as a regulator of cell cycle in blood mononuclear cells [26] and we later identified G0S2 in a screen to identify genes induced by TNF-α [16]. We also reported that G0S2 localizes to mitochondria where it binds and modulates anti-apoptotic activity of Bcl-2 [16]. Interestingly, a recent report by Kioka et al [27] has demonstrated another mitochondrial function for G0S2. They showed that G0S2 increases mitochondrial ATP production by interacting with FoF1-ATP synthase. In addition, G0S2 was shown to interact with ATGL and thereby regulate lipid metabolism, which prompted our current study [15]. Thus, G0S2 is emerging as a key regulator of metabolism that acts at multiple key points.
Dysregulated lipolysis and increased levels of FFAs have been associated with obesity, insulin resistance and the development of type 2 diabetes [28, 29]. We found that in mice lacking G0S2, TG hydrolase activity was increased under chow and HFD conditions. In addition, lipolysis was enhanced in isolated primary adipocytes from G0S2−/− mice and markedly enhanced in response to a β-adrenergic receptor agonist, which is consistent with the lean phenotype of the mice. Our results are in agreement with recent findings reported in an ATGL transgenic model [30] where overexpression of ATGL in adipose tissue caused reduced TG content in adipocytes and enhanced lipolysis. In contrast, ATGL−/− mice accumulate large amounts of fat in multiple tissues and the mice die at around 12 weeks of age [31]. In the current study, we have provided compelling physiological evidence showing that G0S2 regulation of ATGL controls lipid metabolism in mice. Correlative studies in human subjects have indicated that the regulatory effects of G0S2 and ATGL on lipid metabolism may extend to humans. For example, fasting in humans was shown to reduce levels of G0S2 and elevate ATGL [32]. Thus, understanding the regulation of the G0S2/ATGL axis as a regulatory mechanism of lipolysis may provide fundamental insights in the understanding of obesity and its related-diseases.
Despite the enhanced lipolysis and decreased TG levels in tissues and sera, serum FFA levels in the G0S2−/− mice were surprisingly unchanged. Moreover, we noticed that FFA levels in liver and sera of G0S2−/− mice tend to be even lower compared to wt mice on both diets suggesting enhanced fat use/uptake. Under normal conditions, a balance between hydrolysis and utilization/uptake regulates FFA levels by peripheral tissues. Many factors can regulate levels of FFAs in serum. Thus, the lack of increased serum FFA levels suggests alternative mechanisms by which FFAs are used. We have observed enhanced glucose tolerance and insulin sensitivity in the knockout mice, which could suggest increased FFA uptake by peripheral tissues. Oxidation and/or re-esterification of FFAs are potential mechanisms by which FFAs are used. FFAs can also be recycled back to DAG or MAG through the TG/FFA cycle bypassing the TG step, perhaps favoring shorter cycles to ensure the availability of different signaling intermediates as discussed in [33].
G0S2−/− mice had higher body temperatures measured as heat production in metabolic cages. In addition, knockout mice have increased oxygen consumption and lower RQ ratio indicating more fat usage. Moreover, knockout mice were more tolerant to cold temperatures and maintained higher body temperature compared to wt mice. We speculate that elevated fat oxidation and possibly uncoupling are the mechanisms by which G0S2−/− mice are able to utilize fat more rapidly and thus, generate heat. Expression levels of Acadm and Acadl, which encode the first two enzymes of β-oxidation, were elevated in liver suggesting increased FA oxidation is occurring in G0S2−/− mice. In addition, our findings showing increased expression of brown fat-like genes in WAT of G0S2-knockout mice further argues for enhanced uncoupling and energy dissipation in these animals as a means to counteract obesity. In addition, we also show increased expression of genes coding for mitochondrial and peroxisomal oxidation in WAT of G0S2−/− mice under cold challenge conditions. Our findings are in agreement with other mouse models that display enhanced FA oxidation and decreased serum FFA levels [34, 35]. Overexpression of UCP1 in WAT for example, showed enhanced uncoupling, leanness and increased FA oxidation [34] with improved insulin sensitivity [36] in mouse models. Prolonged cold exposure is known to induce WAT into a BAT-like state, a process termed “browning” [37, 38]. Interestingly, a recent study demonstrated that in response to cold exposure, expression levels of ATGL become elevated, whereas levels of G0S2 are decreased in fat deposits of SvEv mice [39]. These changes in gene expression would enhance the lipolytic potential of adipocytes. Our findings suggest that lack of G0S2 activity is on its own able to accelerate the process of browning. Inducing the browning of WAT has been proposed as a potential therapy for obesity and type II diabetes and our findings suggest that G0S2 may be an effective therapeutic target in this regard [40].
Our study is the first to show that G0S2 regulates WAT browning by acting as a negative regulator of lipolysis in an animal model. While writing this manuscript, it came to our attention another report [41] describing a knockout mouse that complements our study. Our study and the study by Zhang el al [41] both show that G0S2−/ mice are leaner and resistant to HFD feeding in 129SvEv and C57BL/6J genetic background respectively. Both studies show a decrease in TG accumulation in liver and enhanced lipase activity in visceral fat and liver. However, in our hands, effects of G0S2 on lipolysis and improvement in whole body glucose and insulin sensitivity were more significant in male G0S2−/− mice as compared to female mice in the study by Zhang el al [41]. These variations may be due to the different genetic background used in the two studies or to metabolic adaptation/compensation in female 129SvEv mice in our study. Sex differences have been previously reported to have different effects in metabolic studies [42]. Our data are also in agreement with a recently published report of G0S2 overexpression in adipocytes [43]. In this model, overexpression of G0S2 in adipocytes rendered the mice unable to maintain their body temperature at 4°C, probably due to the increased fat deposition in these mice. A new report also showed G0S2 regulation of thermogenesis and showed an increase in brown-like and oxidation genes in brown adipose tissue in G0S2−/− mice [44].
In conclusion, our study highlights the role of G0S2 in whole body lipid metabolism and suggests that regulation of G0S2 levels may have a role in metabolic disorders such as obesity, insulin resistance and type 2 diabetes.
Supplementary Material
Acknowledgments
We would like to thank Serge Hardy for reading the manuscript and Ailsa Lee Loy for assistance with mice experiments.
Funding This work was supported by grants from the CIHR (MOP-115195) and Cancer Research Society (CRS) to J.G.T. and NIH grant AI075118 to M.K.
Abbreviation
- ATGL
adipose triglyceride lipase
- BAT
brown adipose tissue
- CGI-58
comparative gene identification-58
- DAG
diacyl glycerol
- FFA
free fatty acids
- G0S2
G0/G1 switch gene 2
- HFD
high fat diet
- IPGTT
intraperitoneal glucose tolerance test
- IPITT
intraperitoneal insulin tolerance test
- MAG
monoacyl glycerol
- MTBSTFA
N-Methyl-N-tert-butyldimethylsilyltrifluoroacetamide
- PPAR gamma
peroxisome proliferator activated receptor gamma
- QRTPCR
quantitative real time PCR
- RQ
respiratory quotient
- TG
triglyceride
- WAT
white adipose tissue
Footnotes
Duality of interest The authors declare no duality of interest.
Contribution statement W.E., J.G.T., and M.L.T designed experiments; W.E., K.E., J.Y., performed experiments; W.E., A.H.M. analyzed adipocytes data; M.K.&N.H. generated the knockout mice; I.G. managed mice colonies; W.E., D.A., O.M. performed GC-MS experiments; W.E., J.G.T. analyzed data and wrote the manuscript. J.G.T supervised the work.
References
- 1.Miranda PJ, DeFronzo RA, Califf RM, Guyton JR. Metabolic syndrome: definition, pathophysiology, and mechanisms. American heart journal. 2005;149:33–45. doi: 10.1016/j.ahj.2004.07.013. [DOI] [PubMed] [Google Scholar]
- 2.Reaven GM. Banting lecture 1988. Role of insulin resistance in human disease. Diabetes. 1988;37:1595–1607. doi: 10.2337/diab.37.12.1595. [DOI] [PubMed] [Google Scholar]
- 3.Jenkins CM, Mancuso DJ, Yan W, Sims HF, Gibson B, Gross RW. Identification, cloning, expression, and purification of three novel human calcium-independent phospholipase A2 family members possessing triacylglycerol lipase and acylglycerol transacylase activities. The Journal of biological chemistry. 2004;279:48968–48975. doi: 10.1074/jbc.M407841200. [DOI] [PubMed] [Google Scholar]
- 4.Villena JA, Roy S, Sarkadi-Nagy E, Kim KH, Sul HS. Desnutrin, an adipocyte gene encoding a novel patatin domain-containing protein, is induced by fasting and glucocorticoids: ectopic expression of desnutrin increases triglyceride hydrolysis. The Journal of biological chemistry. 2004;279:47066–47075. doi: 10.1074/jbc.M403855200. [DOI] [PubMed] [Google Scholar]
- 5.Zimmermann R, Strauss JG, Haemmerle G, et al. Fat mobilization in adipose tissue is promoted by adipose triglyceride lipase. Science. 2004;306:1383–1386. doi: 10.1126/science.1100747. [DOI] [PubMed] [Google Scholar]
- 6.Holm C, Kirchgessner TG, Svenson KL, et al. Hormone-sensitive lipase: sequence, expression, and chromosomal localization to 19 cent-q13.3. Science. 1988;241:1503–1506. doi: 10.1126/science.3420405. [DOI] [PubMed] [Google Scholar]
- 7.Holm C, Osterlund T, Laurell H, Contreras JA. Molecular mechanisms regulating hormone-sensitive lipase and lipolysis. Annual review of nutrition. 2000;20:365–393. doi: 10.1146/annurev.nutr.20.1.365. [DOI] [PubMed] [Google Scholar]
- 8.Boden G, Shulman GI. Free fatty acids in obesity and type 2 diabetes: defining their role in the development of insulin resistance and beta-cell dysfunction. European journal of clinical investigation. 2002;32(Suppl 3):14–23. doi: 10.1046/j.1365-2362.32.s3.3.x. [DOI] [PubMed] [Google Scholar]
- 9.Lass A, Zimmermann R, Haemmerle G, et al. Adipose triglyceride lipase-mediated lipolysis of cellular fat stores is activated by CGI-58 and defective in Chanarin-Dorfman Syndrome. Cell Metab. 2006;3:309–319. doi: 10.1016/j.cmet.2006.03.005. [DOI] [PubMed] [Google Scholar]
- 10.Fischer J, Lefevre C, Morava E, et al. The gene encoding adipose triglyceride lipase (PNPLA2) is mutated in neutral lipid storage disease with myopathy. Nature genetics. 2007;39:28–30. doi: 10.1038/ng1951. [DOI] [PubMed] [Google Scholar]
- 11.Lu X, Yang X, Liu J. Differential control of ATGL-mediated lipid droplet degradation by CGI-58 and G0S2. Cell cycle. 2010;9:2719–2725. doi: 10.4161/cc.9.14.12181. [DOI] [PMC free article] [PubMed] [Google Scholar]
- 12.Cornaciu I, Boeszoermenyi A, Lindermuth H, et al. The minimal domain of adipose triglyceride lipase (ATGL) ranges until leucine 254 and can be activated and inhibited by CGI-58 and G0S2, respectively. PloS one. 2011;6:e26349. doi: 10.1371/journal.pone.0026349. [DOI] [PMC free article] [PubMed] [Google Scholar]
- 13.Schweiger M, Paar M, Eder C, et al. G0/G1 switch gene-2 regulates human adipocyte lipolysis by affecting activity and localization of adipose triglyceride lipase. Journal of lipid research. 2012;53:2307–2317. doi: 10.1194/jlr.M027409. [DOI] [PMC free article] [PubMed] [Google Scholar]
- 14.Zandbergen F, Mandard S, Escher P, et al. The G0/G1 switch gene 2 is a novel PPAR target gene. Biochem J. 2005;392:313–324. doi: 10.1042/BJ20050636. [DOI] [PMC free article] [PubMed] [Google Scholar]
- 15.Yang X, Lu X, Lombes M, et al. The G(0)/G(1) switch gene 2 regulates adipose lipolysis through association with adipose triglyceride lipase. Cell Metab. 2010;11:194–205. doi: 10.1016/j.cmet.2010.02.003. [DOI] [PMC free article] [PubMed] [Google Scholar]
- 16.Welch C, Santra MK, El-Assaad W, et al. Identification of a protein, G0S2, that lacks Bcl-2 homology domains and interacts with and antagonizes Bcl-2. Cancer Res. 2009;69:6782–6789. doi: 10.1158/0008-5472.CAN-09-0128. [DOI] [PMC free article] [PubMed] [Google Scholar]
- 17.Russell L, Forsdyke DR. A human putative lymphocyte G0/G1 switch gene containing a CpG-rich island encodes a small basic protein with the potential to be phosphorylated. DNA and cell biology. 1991;10:581–591. doi: 10.1089/dna.1991.10.581. [DOI] [PubMed] [Google Scholar]
- 18.Ma L, Robinson LN, Towle HC. ChREBP*Mlx is the principal mediator of glucose-induced gene expression in the liver. The Journal of biological chemistry. 2006;281:28721–28730. doi: 10.1074/jbc.M601576200. [DOI] [PubMed] [Google Scholar]
- 19.Le Bacquer O, Petroulakis E, Paglialunga S, et al. Elevated sensitivity to diet-induced obesity and insulin resistance in mice lacking 4E-BP1 and 4E-BP2. J Clin Invest. 2007;117:387–396. doi: 10.1172/JCI29528. [DOI] [PMC free article] [PubMed] [Google Scholar]
- 20.Almind K, Kahn CR. Genetic determinants of energy expenditure and insulin resistance in diet-induced obesity in mice. Diabetes. 2004;53:3274–3285. doi: 10.2337/diabetes.53.12.3274. [DOI] [PubMed] [Google Scholar]
- 21.Kulkarni RN, Almind K, Goren HJ, et al. Impact of genetic background on development of hyperinsulinemia and diabetes in insulin receptor/insulin receptor substrate-1 double heterozygous mice. Diabetes. 2003;52:1528–1534. doi: 10.2337/diabetes.52.6.1528. [DOI] [PubMed] [Google Scholar]
- 22.Nomura DK, Long JZ, Niessen S, Hoover HS, Ng SW, Cravatt BF. Monoacylglycerol lipase regulates a fatty acid network that promotes cancer pathogenesis. Cell. 2010;140:49–61. doi: 10.1016/j.cell.2009.11.027. [DOI] [PMC free article] [PubMed] [Google Scholar]
- 23.Brun RP, Kim JB, Hu E, Altiok S, Spiegelman BM. Adipocyte differentiation: a transcriptional regulatory cascade. Current opinion in cell biology. 1996;8:826–832. doi: 10.1016/s0955-0674(96)80084-6. [DOI] [PubMed] [Google Scholar]
- 24.Gregoire FM, Smas CM, Sul HS. Understanding adipocyte differentiation. Physiological reviews. 1998;78:783–809. doi: 10.1152/physrev.1998.78.3.783. [DOI] [PubMed] [Google Scholar]
- 25.Rosen ED, MacDougald OA. Adipocyte differentiation from the inside out. Nature reviews Molecular cell biology. 2006;7:885–896. doi: 10.1038/nrm2066. [DOI] [PubMed] [Google Scholar]
- 26.Siderovski DP, Blum S, Forsdyke RE, Forsdyke DR. A set of human putative lymphocyte G0/G1 switch genes includes genes homologous to rodent cytokine and zinc finger protein-encoding genes. DNA and cell biology. 1990;9:579–587. doi: 10.1089/dna.1990.9.579. [DOI] [PubMed] [Google Scholar]
- 27.Kioka H, Kato H, Fujikawa M, et al. Evaluation of intramitochondrial ATP levels identifies G0/G1 switch gene 2 as a positive regulator of oxidative phosphorylation. Proceedings of the National Academy of Sciences of the United States of America. 2014;111:273–278. doi: 10.1073/pnas.1318547111. [DOI] [PMC free article] [PubMed] [Google Scholar]
- 28.Schaffer JE. Lipotoxicity: when tissues overeat. Current opinion in lipidology. 2003;14:281–287. doi: 10.1097/00041433-200306000-00008. [DOI] [PubMed] [Google Scholar]
- 29.Unger RH. Lipotoxic diseases. Annual review of medicine. 2002;53:319–336. doi: 10.1146/annurev.med.53.082901.104057. [DOI] [PubMed] [Google Scholar]
- 30.Ahmadian M, Duncan RE, Varady KA, et al. Adipose overexpression of desnutrin promotes fatty acid use and attenuates diet-induced obesity. Diabetes. 2009;58:855–866. doi: 10.2337/db08-1644. [DOI] [PMC free article] [PubMed] [Google Scholar]
- 31.Haemmerle G, Lass A, Zimmermann R, et al. Defective lipolysis and altered energy metabolism in mice lacking adipose triglyceride lipase. Science. 2006;312:734–737. doi: 10.1126/science.1123965. [DOI] [PubMed] [Google Scholar]
- 32.Nielsen TS, Vendelbo MH, Jessen N, et al. Fasting, but not exercise, increases adipose triglyceride lipase (ATGL) protein and reduces G(0)/G(1) switch gene 2 (G0S2) protein and mRNA content in human adipose tissue. The Journal of clinical endocrinology and metabolism. 2011;96:E1293–E1297. doi: 10.1210/jc.2011-0149. [DOI] [PubMed] [Google Scholar]
- 33.Prentki M, Madiraju SR. Glycerolipid metabolism and signaling in health and disease. Endocrine reviews. 2008;29:647–676. doi: 10.1210/er.2008-0007. [DOI] [PubMed] [Google Scholar]
- 34.Kopecky J, Clarke G, Enerback S, Spiegelman B, Kozak LP. Expression of the mitochondrial uncoupling protein gene from the aP2 gene promoter prevents genetic obesity. J Clin Invest. 1995;96:2914–2923. doi: 10.1172/JCI118363. [DOI] [PMC free article] [PubMed] [Google Scholar]
- 35.Orci L, Cook WS, Ravazzola M, et al. Rapid transformation of white adipocytes into fat-oxidizing machines. Proceedings of the National Academy of Sciences of the United States of America. 2004;101:2058–2063. doi: 10.1073/pnas.0308258100. [DOI] [PMC free article] [PubMed] [Google Scholar]
- 36.Yamada T, Katagiri H, Ishigaki Y, et al. Signals from intra-abdominal fat modulate insulin and leptin sensitivity through different mechanisms: neuronal involvement in food-intake regulation. Cell Metab. 2006;3:223–229. doi: 10.1016/j.cmet.2006.02.001. [DOI] [PubMed] [Google Scholar]
- 37.Petrovic N, Walden TB, Shabalina IG, Timmons JA, Cannon B, Nedergaard J. Chronic peroxisome proliferator-activated receptor gamma (PPARgamma) activation of epididymally derived white adipocyte cultures reveals a population of thermogenically competent, UCP1-containing adipocytes molecularly distinct from classic brown adipocytes. The Journal of biological chemistry. 2010;285:7153–7164. doi: 10.1074/jbc.M109.053942. [DOI] [PMC free article] [PubMed] [Google Scholar]
- 38.Wu J, Bostrom P, Sparks LM, et al. Beige adipocytes are a distinct type of thermogenic fat cell in mouse and human. Cell. 2012;150:366–376. doi: 10.1016/j.cell.2012.05.016. [DOI] [PMC free article] [PubMed] [Google Scholar]
- 39.Barneda D, Frontini A, Cinti S, Christian M. Dynamic changes in lipid droplet-associated proteins in the "browning" of white adipose tissues. Biochimica et biophysica acta. 2013;1831:924–933. doi: 10.1016/j.bbalip.2013.01.015. [DOI] [PubMed] [Google Scholar]
- 40.Wu J, Cohen P, Spiegelman BM. Adaptive thermogenesis in adipocytes: is beige the new brown? Genes & development. 2013;27:234–250. doi: 10.1101/gad.211649.112. [DOI] [PMC free article] [PubMed] [Google Scholar]
- 41.Zhang X, Xie X, Heckmann BL, Saarinen AM, Czyzyk TA, Liu J. Target Disruption of G0/G1 Switch Gene 2 Enhances Adipose Lipolysis, Alters Hepatic Energy Balance, and Alleviates High Fat Diet-Induced Liver Steatosis. Diabetes. 2013 doi: 10.2337/db13-1422. [DOI] [PMC free article] [PubMed] [Google Scholar]
- 42.Peyot ML, Nolan CJ, Soni K, et al. Hormone-sensitive lipase has a role in lipid signaling for insulin secretion but is nonessential for the incretin action of glucagon-like peptide 1. Diabetes. 2004;53:1733–1742. doi: 10.2337/diabetes.53.7.1733. [DOI] [PubMed] [Google Scholar]
- 43.Heckmann BL, Zhang X, Xie X, et al. Defective adipose lipolysis and altered global energy metabolism in mice with adipose overexpression of the lipolytic inhibitor G0/G1 switch gene 2 (G0S2) The Journal of biological chemistry. 2014;289:1905–1916. doi: 10.1074/jbc.M113.522011. [DOI] [PMC free article] [PubMed] [Google Scholar]
- 44.Ma T, Lopez-Aguiar AG, Li A, et al. Mice lacking G0S2 are lean and cold-tolerant. Cancer biology & therapy. 2014;15:643–650. doi: 10.4161/cbt.28251. [DOI] [PMC free article] [PubMed] [Google Scholar]
Associated Data
This section collects any data citations, data availability statements, or supplementary materials included in this article.


