Abstract
Prader-Willi syndrome (PWS) may represent a genetic form of human obesity. The purpose of this study was to determine whether the relationship between resting metabolic rate and body weight/body composition was different in patients with PWS than in obese (body mass index 23–36) and lean (body mass index 15–20) controls. We determined body composition using bioelectrical impedance analysis (BIA) and skinfold thickness measurements in 36 subjects with PWS and in 31 controls (20 nonobese, 11 obese). The BIA measures of percentage of body fat were significantly correlated with those determined from skinfold thicknesses in all three groups. Resting metabolic rate (RMR) was measured in all lean and obese controls and in 22 of the 36 patients. Energy expenditure was compared among groups by comparing the regression relationship between RMR and either body weight or fat-free mass (FFM). The relationship between RMR and body weight and between RMR and FFM was different for patients with PWS than for lean and obese controls, who did not differ from each other. The nature of the relationship was such that patients with PWS had reduced rates of energy expenditure compared to controls, except for patients with the largest body mass and FFM. This suggests that a low energy expenditure exists initially for persons with PWS but may return to normal as obesity becomes greater. These results also suggest that reduced FFM is not the sole explanation for the lower energy expenditure seen in patients with PWS.
Keywords: fat-free mass (FFM), obesity, bioelectrical impedance analysis (BIA), skinfold thicknesses
The Prader-Willi syndrome (PWS) was first described in 1956,1 and subsequently over 700 cases have been reported.1–4 The syndrome is characterized by infantile hypotonia, early childhood obesity, mental deficiency, short stature, small hands and feet, and hypogonadism. Chromosome 15 deletion is detectable in about one-half of the patients.1–4 The incidence of PWS has been estimated at 1 in 10,000 to 25,000 live births.5,6 In a review of published surveys of over 500 patients, a combined total of 94% were obese, with a range of obesity from 76% to 100%.7 Because of its high incidence, there is a great deal of interest in understanding how the obesity develops in PWS. Several components of energy balance may contribute, including hyperphagia, persistent hunger, decreased perception of satiety,6 and decreased resting metabolic rate (RMR).8–10
The RMR varies widely among humans, but much of the variation can be explained by the subject’s body weight or body composition. The best predictor of RMR is fat-free mass (FFM).11 Differences in FFM usually account for differences in RMR between lean and obese subjects and between males and females.11 The FFM cannot explain all of the variation in RMR, however, and other, currently unidentified factors are likely involved. A central question regarding PWS is whether the reported low RMR is due largely to a low amount of FFM or whether other factors are involved. Results of a study by Schoeller et al.8 suggest a low FFM can account for much of the low RMR seen in patients with PWS. The present study was undertaken to examine this question further.
MATERIALS AND METHODS
Subjects for this study were 36 patients with PWS and 31 controls (Table 1). Twenty controls were normal-weight children and 11 were nonsyndromic obese children. Lean subjects were defined as those with body mass index (BMI; calculated as weight in kilograms divided by height squared in meters) less than or equal to 20, and obesity was defined as BMI equal to or greater than 23. All measurements on patients were made at the 1988 annual meeting of the Prader-Willi Association held in Louisville, Kentucky, or at Vanderbilt University School of Medicine in Nashville, Tennessee. All normal-weight and obese children were volunteers recruited by word of mouth and studied at Vanderbilt University. The obese controls were likely to be obese due to factors relating to diet or lack of physical activity, or both.
Table 1.
Characteristics of Individuals in Whom Resting Metabolic Rates Were Measured
| Subjects | Sex (M:F) |
Age (yrs) |
Body Weight (kg) |
Height (cm) |
Body Mass Index (wt/ht2) |
% IBW |
|---|---|---|---|---|---|---|
| PWS | 9:13 | 13 ± 1 | 42.6 ± 3.7 | 133.7 ± 3.8 | 24 ± 1 | 134 ±5 |
| Lean | 11:9 | 10 ± 1 | 39.7 ± 2.3 | 146.3 ± 6.1 | 19 ± 1 | 102 ± 2 |
| Obese | 4:7 | 10 ± 1 | 62.6 ± 4.6 | 148.8 ± 4.4 | 28 ± 1 | 156 ± 6 |
Values are means ± SEM.
Resting Metabolic Rate
Resting metabolic rate was measured in all lean and obese controls and in 22 of the 36 subjects with PWS. Measurements were made using a ventilated hood indirect calorimetry system (Sensormedics 2900 Oxygen Uptake System, Sensormedics Inc., Anaheim, CA). In the morning after an overnight fast, patients with PWS had their RMR measured for 15 to 20 minutes after they had been lying quietly for at least 30 minutes. Efforts were made to keep them as quiet and inactive as possible during measurement periods. Metabolic rates were calculated from oxygen consumption using the equation of Weir.12
The RMR of obese and nonobese control subjects was measured at Vanderbilt University in the same manner as described for patients. Subjects arrived at the laboratory, rested for 30 minutes, and were measured for 15 to 20 minutes.
Body Composition
Body composition for all subjects was determined using bioelectrical impedance analysis (BIA). The impedance analyzer was manufactured by Bio-dynamics (Bellevue, WA). Percentage of body fat and fat-free weight were determined using equations supplied by the manufacturer. Fat-free mass was calculated as body weight minus fat weight.
Body composition was also determined based on measurements of the triceps, subscapular, and suprailiac skinfold thicknesses. Percentage of body fat was determined from the sum of these skinfold thicknesses.13 All skinfold thicknesses were the average of at least three measurements at each site, always taken by the same person.
Statistical Analysis
The relationships between RMR and measures of body weight and body composition were made using linear regression analysis.14 Comparison of RMR among the three groups was made using one-way analysis of variance.14
RESULTS
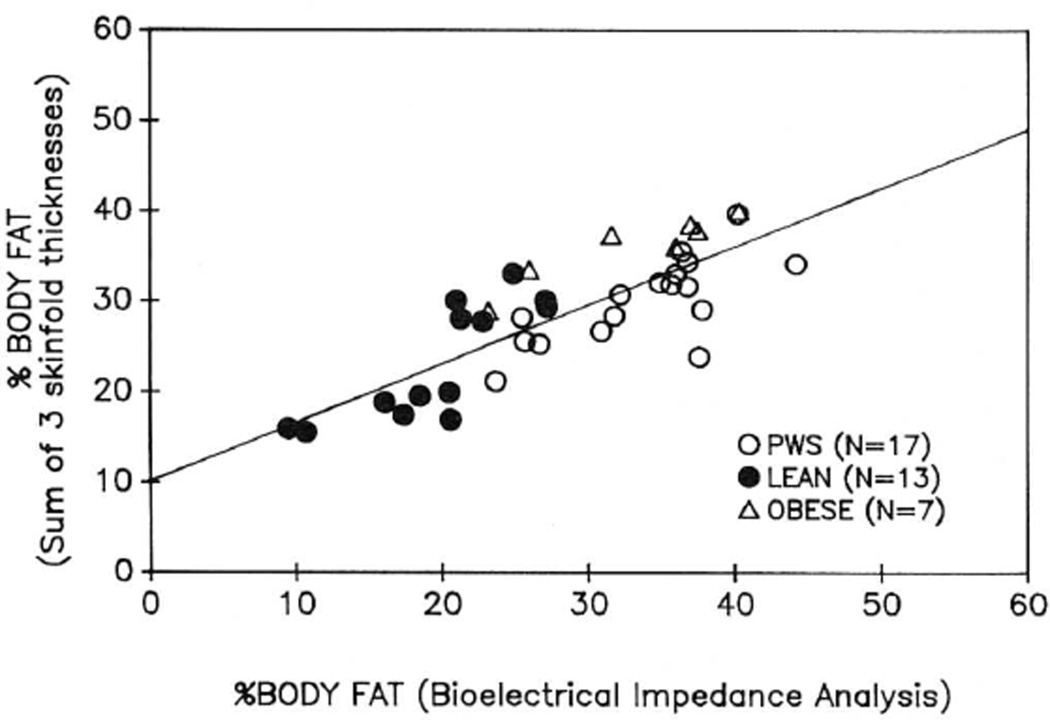
Figure 1 shows percentage of body fat measured by BIA compared with that measured by the sum of the three skinfold thicknesses. The correlation coefficient between the two measurements was 0.80. The individual correlation coefficients for the three groups were r = 0.80 for lean controls, r = 0.91 for obese controls, and r = 0.74 for patients with PWS.
Fig. 1.
The relationship between percentage body fat measured by bioelectrical impedance analysis (BIA) and by the sum of three skinfold thicknesses (triceps, subscapular, suprailiac). The line shows the best fit linear regression.
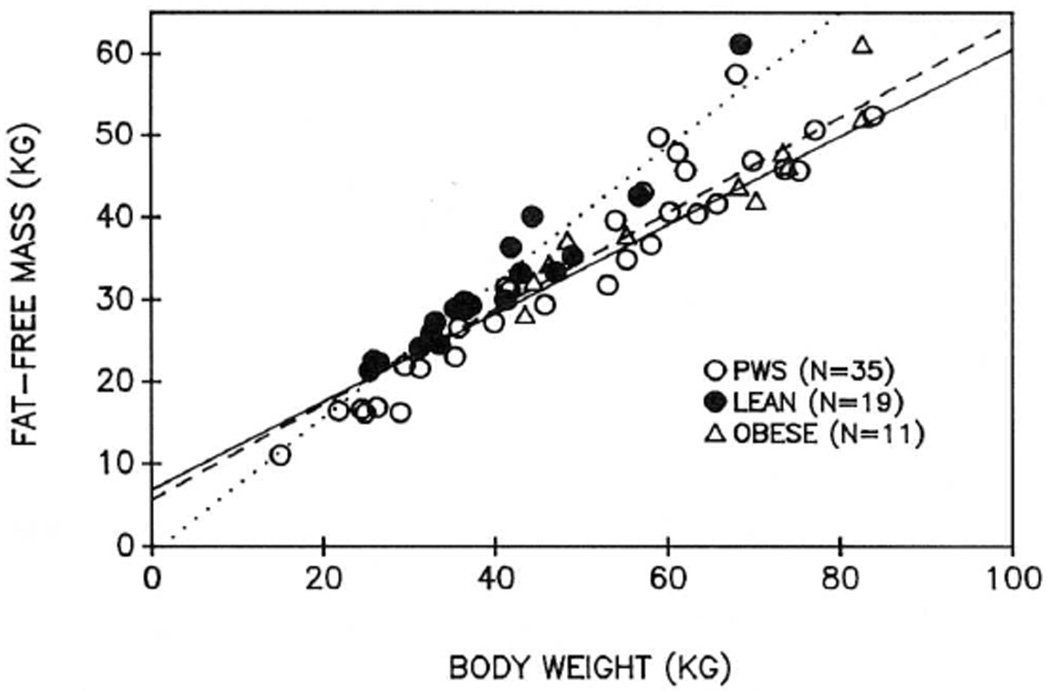
Figure 2 shows the linear regression relationship between total body weight and FFM for each of the three groups. The relationship for lean subjects was, as expected, different from the other two groups. The regression equations were not different for obese subjects and patients with PWS. This suggests that for a given body weight, patients were not fatter than obese subjects.
Fig. 2.
The linear regression relationships between body weight and fat-free mass (FFM) for each group. The regression lines are as follows: solid line, patients with PWS; dotted line, lean; dashed line, non-PWS obese. Patients with PWS with body weight greater than 100 kg are not shown.
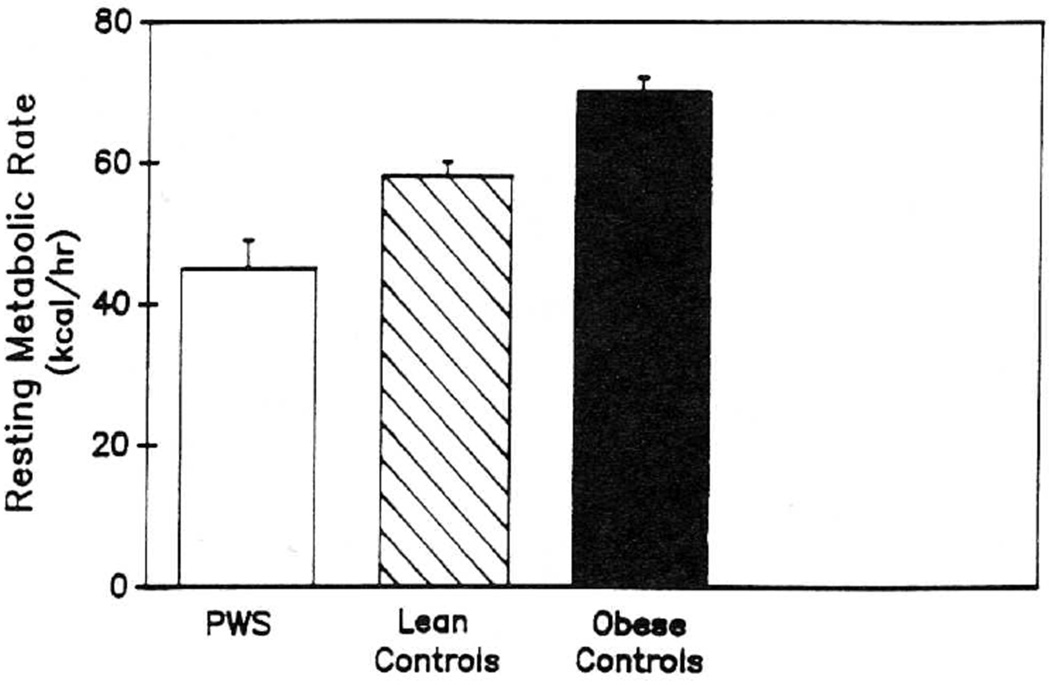
Figure 3 shows RMR in the patients and the two control groups. The value (expressed as kcal/hr) was significantly higher in obese than lean subjects and in lean subjects than patients with PWS (p < 0.05).
Fig. 3.
Resting metabolic rate (RMR) is shown for each group in the study. Values are means ± SEM.
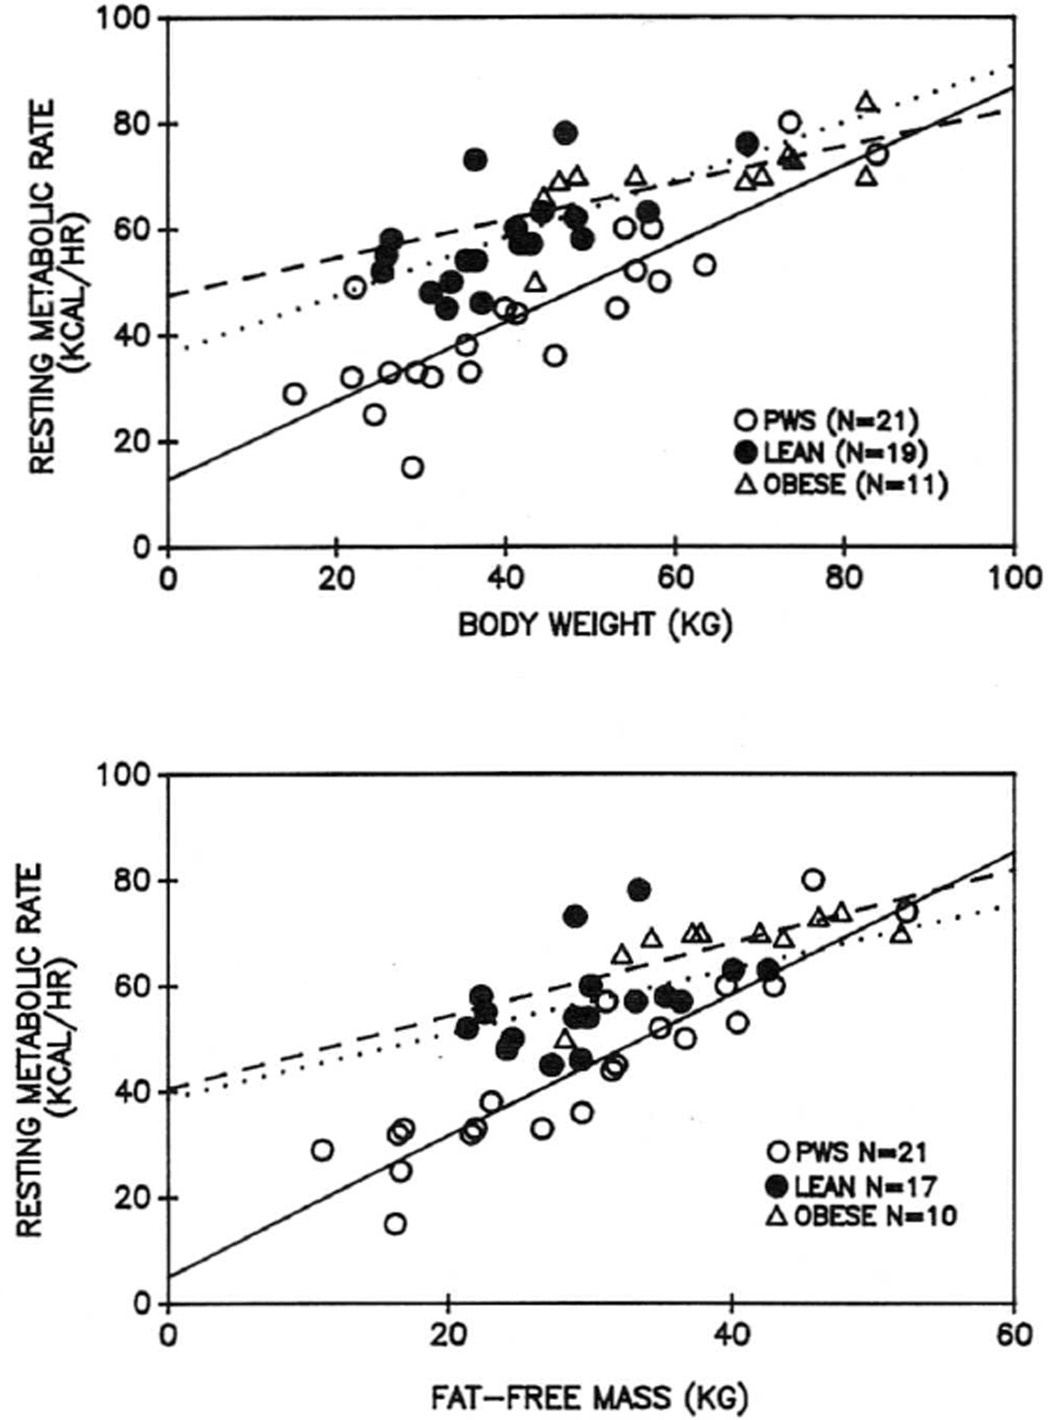
The top panel of Figure 4 shows the linear regression analysis relating RMR (expressed in kcal/hr) to body weight. There was a significant positive relationship between these values in all three groups. The regression line for patients with PWS was significantly different from those for normal and obese children, however.
Fig. 4.
The linear regressions between resting metabolic rate (RMR) and body weight (top) and fat-free mass (bottom) for each group in the study. The regression lines are as follows: solid line, PWS; dotted line, lean; dashed line, non-PWS obese. The regression line for patients with PWS was significantly different from that of the other two groups (p < 0.05).
The lower panel of Figure 4 shows RMR versus fat-free weight (as determined by BIA) of the subjects. Again, significant positive relationships existed for all three groups and, again, the relationship for subjects with PWS was different from those of normal and obese children. For the patients, the slope of the relationship was significantly higher, and the Y intercept was significantly lower, than for the other groups.
DISCUSSION
These results support those of others8–10 in that RMR for patients with PWS is significantly reduced in comparison to lean or obese children and adolescents. The reduction did not appear to be totally explained by a low FFM. A significant relationship between RMR and FFM was evident in all groups studied, but for patients with PWS it had a significantly different slope and Y intercept than that for lean and obese controls. The nature of the relationship suggests that a low rate of energy expenditure may be particularly apparent in individuals with low FFM (less obese patients) and may be an important factor in the further development of obesity in these individuals. Energy expenditure was closer to values predicted for controls in the patients with higher FFM, suggesting that energy expenditure may become normal as patients with PWS become increasingly obese.
It is important to note that our comparison of RMR among groups was not influenced by differences in body composition. One must use care in comparing RMR in groups with different body composition. The value reflects all of the metabolic activity of the body at rest. A strong relationship exists between RMR and FFM (reflecting the most metabolically active portion of the body), but it is important to note that the regression line relating FFM to RMR does not pass through the zero point.11 The predicted RMR at zero FFM is usually 300 to 500 kcal/day in adults.11 Thus, using FFM to predict RMR would lead to underestimations in subjects with low FFM and overestimations in subjects with high FFM. If the groups being compared differ considerably in body composition, a comparison of RMR/kg FFM might lead to erroneous conclusions. A more accurate method is to compare the relationship between RMR and FFM. We took this approach in the present study to avoid such problems.
The interpretation of these results depends heavily on measurement of body composition, and taking accurate measurements in children is difficult.15,16 It may be more difficult when the children are affected with obese conditions such as PWS. Bioelectrical impedance analysis is a promising technique, and many studies in adults have shown it agrees well with other more widely accepted methods.17,18 Although there are few studies of its validity in children, we found good agreement in all subject groups between percentage of body fat as determined by BIA and that using three skinfold thicknesses. The BIA measurements were determined using the equations provided by the manufacturer. In adults, other equations have been developed that appear to improve the correlation between BIA and underwater weighing,17 but they were not useful in our group of young individuals. Skinfold thicknesses appear to be a reasonable way to estimate body fat in subjects without13 and with PWS,19,20 and in this study they agreed well with measurements derived from BIA. The BIA may be preferable, however, since it requires less training, is quicker, and probably produces results that are more consistent among persons making the measurements. Certainly more research is required concerning the accuracy of methods of measuring body composition in children and adolescents.
Our results suggest that most subjects with PWS have a lower rate of energy expenditure than would be expected from their body weight and FFM. The exceptions are those at the very highest levels of body weight and FFM who have an RMR not different from that predicted from control data. We can speculate that a low RMR might be present initially in PWS and play a causal role in the further development of obesity. The further development of obesity is then associated with increasing amounts of FFM and a return to normal energy expenditure.
These results are different from those reported by Schoeller et al.8 Using doubly labeled water to determine body composition, they reported that children with PWS had a lower proportion of FFM per unit body weight than obese children without PWS, and that RMR was similar in both groups when expressed per kilogram of FFM. These authors further suggested that patients with PWS do not show the increase in FFM usually seen when obesity develops, and that the syndrome may be similar to some reported genetic rodent models, in which an apparent defect occurs in partitioning energy between fat and lean body mass.21 Although our sample of obese children was small, we did not see any difference in the relationship between body weight and FFM in those with and without PWS. It is possible that doubly labeled water provides a more accurate measurement of FFM in PWS than do other methods of determining body composition.
It is likely that the patients with PWS in the present study represented a population in whom dietary control is very high. All measurements were made at the annual meeting of the PWS Society, and parental involvement in this group may be indicative of a high degree of interest in the disease and willingness to try to control dietary intake. Certainly the average percentage of body fat in these children was lower than that often reported in similar patients,8 possibly as a result of greater dietary control. It should also be noted that the children with PWS were slightly older on average than controls. The most likely effect of age differences is on body composition and such differences were taken into account in comparing energy expenditure.
Obesity is an almost certain occurrence in patients with uncontrolled PWS since their caloric intake is high6 and their energy expenditure is low. Resting metabolic rate is the largest component of energy expenditure, but other components may be abnormally low as well. In particular, the thermic effect of food has been suggested to be a measure of food efficiency. Further work is required to determine if this is abnormally low in PWS. Differences in the amount and cost of exercise can also lead to differences in body weight regulation. There are conflicting reports concerning whether subjects with PWS show a lesser amount or cost of physical activity than do healthy children.22 Finally, more information is needed regarding total daily energy expenditure in PWS and whether daily oxidation rates of protein, carbohydrate, and fat differ in patients and in normal lean and obese subjects.
In summary, successful weight reduction in PWS is difficult to achieve since patients have an enlarged appetite coupled with a low rate of energy expenditure. It is important to attempt to increase energy expenditure with more physical activity as well as to control diet. The syndrome appears to be a form of genetic obesity and should provide a good model in which to study the interaction between genetics and nutrition.
Acknowledgments
We thank Judy Haynes for her technical assistance, and the Prader-Willi syndrome families for their cooperation.
This work was supported by grants DK 26657 and RR 00095 from The National Institutes of Health.
REFERENCES
- 1.Prader A, Labhart A, Willi H. Ein Syndrom von Adipositas, Kleinwuchs, Kryptorchismus und Oligophrenie nach myatonieartigem Zustand in Neugeborenenalter. Schweiz Med Wochenschr. 1956;86:1260–1261. [Google Scholar]
- 2.Bray GA, Dahms WT, Swerdloff RS, Fiser RH, Atkinson RL, Carrel RE. The Prader-Willi syndrome. Medicine. 1983;62:59–80. [PubMed] [Google Scholar]
- 3.Butler MG, Meaney FJ, Palmer CG. Clinical and cyto-genetic survey of 39 individuals with Prader-Labhart-Willi syndrome. Am J Med Genet. 1986;23:793–809. doi: 10.1002/ajmg.1320230307. [DOI] [PMC free article] [PubMed] [Google Scholar]
- 4.Hall BD, Smith DW. Prader-Willi syndrome. Pediatrics. 1972;81:286–293. doi: 10.1016/s0022-3476(72)80297-x. [DOI] [PubMed] [Google Scholar]
- 5.Zellweger H, Soper RT. The Prader-Willi syndrome. Med Hyg. 1979;37:3338–3345. [Google Scholar]
- 6.Holm VA. The diagnosis of Prader-Willi syndrome. In: Holm VA, Sulzbacher SJ, Pipes P, editors. Prader-Willi syndrome. Baltimore: University Park Press; 1981. pp. 27–44. [Google Scholar]
- 7.Butler MG. Prader-Willi syndrome: Current understanding of cause and diagnosis. Am J Med Genet. 1990 doi: 10.1002/ajmg.1320350306. in press. [DOI] [PMC free article] [PubMed] [Google Scholar]
- 8.Schoeller DA, Levitsky LL, Bandini LG, Dietz WW, Walczak A. Energy expenditure and body compositionin Prader-Willi syndrome. Metabolism. 1988;37:115–120. doi: 10.1016/s0026-0495(98)90003-8. [DOI] [PubMed] [Google Scholar]
- 9.Nelson RA, Lorrayne F, Anderson MS, Gastineau CF, Hayles AB, Stamnes CL. Physiology and natural history of obesity. JAMA. 1973;223:627–630. [PubMed] [Google Scholar]
- 10.Widhalm D, Veitt V, Irsigler K. Evidence for decreased energy expenditure in Prader-Labhart-Willi syndrome: assessment by means of the Vienna calorimeter [abstr] Proc Int Cong Nutr. 1981 [Google Scholar]
- 11.Ravussin E, Bogardus C. Relationship of genetics, age, and physical fitness to daily energy expenditure and fuel utilization. Am J Clin Nurr. 1980;49(suppl):968–975. doi: 10.1093/ajcn/49.5.968. [DOI] [PubMed] [Google Scholar]
- 12.Weir JB, de V. New methods for calculating metabolic rate with specific reference to protein metabolism. J Physiol (Lond) 1949;109:l–9. doi: 10.1113/jphysiol.1949.sp004363. [DOI] [PMC free article] [PubMed] [Google Scholar]
- 13.Merriman JE. Body composition. In: Barbar Sanders, editor. Guidelines for preseason athletic participation evaluation. Washington, DC: American Physical Therapy Association; 1985. pp. 79–82. [Google Scholar]
- 14.Winer BJ. Statistical principles in experimental design. New York: McGraw-Hill; 1984. [Google Scholar]
- 15.Slaughter MH, Lohman TG, Boileau RA, et al. Skinfold equations for estimations of body fatness in children and youth. Hum Biol. 1988;60:709–723. [PubMed] [Google Scholar]
- 16.Lohman TG. Assessment of body composition in children. Pediatr Exercise Sci. 1989;l:19–30. doi: 10.1123/pes.1.1.19. [DOI] [PubMed] [Google Scholar]
- 17.Jackson AS, Pollock ML, Graves JE, Mahar MT. Reliability and validity of bioelectrical impedance in determining body composition. Appl Physiol. 1988;64:529–534. doi: 10.1152/jappl.1988.64.2.529. [DOI] [PubMed] [Google Scholar]
- 18.Lukaski HC, Bolonchuk WW, Hall CB, Siders WA. Validation of tetrapolar bioelectrical impedance method to assess human body composition. J Appl Physiol. 1986;60:1327–1332. doi: 10.1152/jappl.1986.60.4.1327. [DOI] [PubMed] [Google Scholar]
- 19.Butler MG, Butler RI, Meaney FJ. The use of skinfold measurements to judge obesity during the early phase of Prader-Willi syndrome. Int J Obesity. 1988;12:L417–L422. [PMC free article] [PubMed] [Google Scholar]
- 20.Meaney FJ, Butler MG. Characterization of obesity in Prader-Willi syndrome: fatness patterning. Med Anthropol. 1989;3:294–305. doi: 10.1525/maq.1989.3.3.02a00080. [DOI] [PMC free article] [PubMed] [Google Scholar]
- 21.Martin RJ. Genetic influence on nutritional aspects of metabolic regulation. Fed Proc. 1976;35:2291–2294. [PubMed] [Google Scholar]
- 22.Nardella MT, Sulzbacker SI, Worthington-Roberts BS. Activity levels of persons with Prader-Willi syndrome. Am J Ment Defic. 1983;87:498–505. [PubMed] [Google Scholar]


