

Purpose and intended audience
Each year, the Canadian Cancer Statistics publication provides an estimate of expected case counts and rates for common cancer sites for the current year in Canada as a whole and in the provinces and territories. This monograph expands on the Canadian Cancer Statistics publication by providing historical and projected cancer incidence frequencies and rates at national and regional levels from 1983 to 2032. The aim is that this monograph will be an important resource for health researchers and planners. Most importantly, it is hoped the monograph will:
provide evidence-based input for the development of public health policy priorities at the regional and national levels; and
guide public health officials in planning strategy including designing and evaluating preventive interventions and planning resources (treatment requirements) and infrastructure for future cancer control and care intended to reduce the burden of cancer in Canada.
Executive Summary
In this monograph, we present historical and projected cancer incidence frequencies and rates for Canada, excluding non-melanoma skin cancers (i.e. basal and squamous carcinomas), in 1983 to 2032. The information is intended to help in planning strategy and allocating resources and infrastructure for future cancer control and health care.
Projected changes in cancer incidence rates
From 2003–2007 to 2028–2032, the age-standardized incidence rates (ASIRs) for all cancers combined are predicted to decrease in Canadian males by 5%, from 464.8 to 443.2 per 100 000 population, and increase in Canadian females by 4%, from 358.3 to 371.0 per 100 000. The overall decrease in cancer rates in males will be driven by the decrease in lung cancer rates in men aged 65* or older and in prostate cancer rates in men aged 75 or older. The overall increase in cancer rates in females reflects the predicted rise in lung cancer rates in women aged 65 or older. The increase also represents the expected increase in cancers of the uterus, thyroid, breast (in females under 45), leukemia, pancreas, kidney and melanoma.
The largest changes in ASIRs projected over the 25-year forecasting horizon are increases in thyroid cancer (55% in males and 65% in females) and liver cancer in males (43%) and decreases in larynx cancer (47% in males and 59% in females), lung cancer in males (34%) and stomach cancer (30% in males and 24% in females). The incidence rate of lung cancer in females is projected to continue to rise by 2% from 2003–2007 to 2008–2012 and then start to decrease in the last 20 projection years, by 18%. Breast cancer incidence is expected to change the least (an increase of less than 1%) of all cancers in females. The predicted changes in the rates for colorectal cancer are below the medians in all cancers, with a decrease of 6% for both males and females during the entire projection period. The rates for prostate cancer are projected to be stable, based on an assumption of future stabilization in the prevalence of screening.
New cancer cases to rise
The annual number of new cancer cases is predicted to increase by 84% in Canadian males, from 80 800 in 2003–2007 to 148 400 in 2028–2032, and by 74% in Canadian females, from 74 200 to 128 800.
Drivers of the changes in cancer cases
The primary reason for the increase in the number of all newly diagnosed cancer cases will be the aging of the Canadian population and, to a lesser extent, the increase in population size. Changes in the risk of cancer will constitute a relatively small component of the projected increase in new cases. Preventive interventions can have a strong influence on future incidence rates for individual cancer types.
Most common cancers
The most common new cancers in males—prostate, colorectal, lung and bladder cancers, and non-Hodgkin lymphoma—are projected to remain the same from 2003–2007 to 2028–2032, but colorectal cancer is predicted to outrank lung cancer as the second most frequently diagnosed cancer by 2028–2032. For females, breast, lung, colorectal and uterine cancers figure as the top 4 most common incident cancers in both periods. However, thyroid cancer will overtake non-Hodgkin lymphoma as the fifth most common cancer by 2028–2032.
Incidence by geographical region
There is an east–west gradient in incidence across Canada. The highest incidence rates for most cancers are projected to be in eastern Canada (Atlantic region [New Brunswick, Prince Edward Island, Nova Scotia, and Newfoundland and Labrador], Quebec or Ontario) for both males and females. While British Columbia is projected to continue to have the lowest incidence rates for the majority of cancers in both sexes, this province will also continue to experience the highest rates for esophageal cancer in females, liver cancer in both sexes and testis cancer. The Atlantic region is projected to have the lowest incidence rates for cancers of the breast, uterus and ovary in females, and for liver cancer and leukemia in both sexes. In contrast, this region is projected to experience elevated incidence rates in males for about half the cancers studied.
The incidence rates for all cancers combined are projected to continue to be highest for males in the Atlantic region and for females in Quebec in 15 years but in Ontario thereafter, and lowest in British Columbia. The inter-regional differences are larger in males than in females, possibly due to variations in prostate-specific antigen (PSA) testing (for prostate cancer) and risk factors. In both males and females, colorectal cancer incidence rates will remain highest in the Atlantic region and lowest in British Columbia. Lung cancer incidence rates are projected to be highest in Quebec and lowest in Ontario and British Columbia for both sexes. The similar regional rates of breast cancer in females are expected to persist. The significantly lowest rates of prostate cancer in Quebec are projected to continue, as are the elevated rates in the Atlantic region.
Incidence by sex and age
Cancer is more common in males than in females except in those aged under 55. The overall cancer incidence rate in men aged 65 or older has been falling and will continue to do so. The decrease in lung cancer rates in men aged 65 or older from decreased tobacco use and the decrease in prostate cancer rates in men aged 75 or older have contributed to the overall decrease in this age range. In women aged 65 or older, the relatively stable rate is primarily the result of an increase in lung cancer incidence offset by decreases in incidence for the other cancer sites. This stable trend is projected to continue. Targeted cancer prevention efforts and specific needs for health care services can be expected to vary at different points in the age continuum for males and females.
Smoking-related cancers
Between 2003–2007 and 2028–2032, substantial risk reductions are projected for major common tobacco-related cancers in Canada, even with relatively lower reductions or delayed downturn trends in females. The differences between males and females in the predicted incidence trends of these cancers mirror the historical pattern of reductions in smoking prevalence that took place in males 20 years earlier than in females. Given the lag of 20 years or more between the reduction in smoking and subsequent decrease in cancer incidence, the incidence rates in females will likely begin to drop more noticeably over the longer term. By comparison, the risk of cancer incidence is forecast to increase for non-tobacco-related cancers.
Cancers associated with excess weight and physical inactivity
Over the 25-year projection period, the incidence rates for cancers associated with excess weight and physical inactivity are estimated to increase by 0.6% to 16% for cancers of the uterus, kidney, pancreas, female breast and male esophagus, in descending order. Incidence rates are expected to decrease by 2% to 6% for colorectal and female esophageal cancer. Increased obesity prevalence in Canada may contribute to the increased incidence trends.
Most common infection-associated cancers
From 2003–2007 to 2028–2032, the incidence rates of liver cancer are expected to escalate almost 3 times faster in males than in females (43% vs. 15%), while the rate of stomach and cervical cancer will continue to decrease by 20% to 30%. The ongoing increasing trend of liver cancer incidence is possibly linked to the historical increase and continued high incidence in hepatitis C virus (HCV) infection, the aging of the previously infected population, and increasing immigration from areas where risk factors such as hepatitis B virus (HBV) are prevalent. The persisting decrease in incidence of stomach cancer may be explained by improved healthy behaviours, such as decreased smoking and changes in diet, and increased recognition and treatment of Helicobacter pylori infection. The continuing downward trend in the rates of cervical cancer is mainly attributable to general population screening with the Papanicolaou (Pap) test and successful treatment of screening-detected premalignant lesions. The immunization of school-aged children with the vaccine for human papilloma virus (HPV) is anticipated to further reduce the incidence of cervical cancer.
Implications for cancer control strategies
The projected aging and growth of the population are expected to lead to a progressive and significant increase in the total number of new cancer cases in Canada over the next 25 years. Consequently, this report indicates the need to continue to strengthen cancer control strategies and leverage resources to meet future health care requirements and reduce the burden of cancer in Canada. Although incidence rates are projected to decrease for many cancers, the rates for some cancers, for example, thyroid, liver, uterus, pancreas, kidney and leukemia, are estimated to increase. Additional etiological research is needed to better understand risk factors and guide prevention efforts.
This monograph underscores the importance of cancer prevention by curbing smoking; promoting healthy eating, physical activity and weight management; enhancing uptake of cancer screening; and increasing coverage of HPV vaccination. The implication of future changes in our demographic profiles and cancer trends should be addressed from the full spectrum of cancer control, including research and surveillance, prevention and early detection, treatment, and psychosocial, palliative and medical care.
Chapter 1: Introduction
A prominent characteristic of current sociodemographic changes in Canada is the accelerated growth in the number and proportion of seniors. Figure 1.1 shows that the percentage of men aged 65* or older is projected to increase from 12% in 2003–2007 to 21% in 2028–2032 and of women the same age from 15% to 24% in the same period. The increase in the number of older adults is a consequence of reduced mortality rates in all age groups and the aging of the baby boomer generation. This demographic trend is expected to result in a significantly higher number of cancer diagnoses and therefore demand for health care services. Defining the expected societal burden of cancer can provide evidence-based input into planning cancer control programs, leveraging resources to meet future health care needs and reducing the expected burden of cancer in Canada.
FIGURE 1.1. Historic and projected growth in average annual population in Canada by age, 1983–2032.

We quantify the future burden of cancer from two perspectives: age-standardized rate and the number of new cancer cases. Changes in incidence rates communicate changes in risk of developing cancer over time. The future number of new cases is a consequence of changes both in the cancer rates and in the population size and composition.
The main source of estimates of expected case counts and rates for common cancer sites in the current year for Canada and the provinces and territories is the annual Canadian Cancer Statistics report.1 These estimates provide important information for cancer control planners, public policy analysts, and provincial and territorial health care professionals who need to know the relative burden of different types of cancer and for different geographical regions.
Currently, there are no widely available long-term national projections for Canada, whereas several other developed countries have documented their profiles.2–5 To map out such a possible future cancer scenario, this monograph presents estimates of cancer incidence frequencies and rates in Canada for 25 cancer sites by geographical area, sex and age group through 2028–2032.
Chapter 2: Data and Methods
2.1 Data
The observed cancer incidence data used for the projections cover 1983 to 2007, which represents the most recent period for which data are available for all parts of Canada. We extracted data from the Canadian Cancer Registry (CCR) for 1992 to 2007 and from the National Cancer Incidence Reporting System (NCIRS) for the earlier years. While the CCR is a person-oriented database, the NCIRS is an event-oriented database with cases diagnosed from 1969 to 1991. The cases in the NCIRS were coded in or converted to the International Classification of Diseases, Ninth Revision (ICD-9).6 Projections were prepared for the most frequent invasive primary cancers (including in situ bladder cancers but excluding non-melanoma skin cancer (i.e. basal and squamous carcinoma). We generally defined cancer cases based on the International Classification of Diseases for Oncology, Third Edition (ICD-O-3) and classified them using Surveillance, Epidemiology, and End Results (SEER) Program Incidence Site Recode shown in Table 2.1.7,8 Cases retrieved from the NCIRS used equivalent ICD-9 codes. Changes in cancer definition over time were derived following the methods outlined in the Canadian Cancer Statistics.1
TABLE 2.1.
Cancer definitions for incidence
| Cancer | ICD-O-3 site/histology typea |
|---|---|
| (Incidence) | |
| Oral | C00–C14 |
| Esophagus | C15 |
| Stomach | C16 |
| Colorectal | C18–C20, C26.0 |
| Liver | C22.0 |
| Pancreas | C25 |
| Larynx | C32 |
| Lung | C34 |
| Melanoma | C44 (Type 8720–8790) |
| Breast | C50 |
| Cervix | C53 |
| Body of uterus | C54–C55 |
| Ovary | C56.9 |
| Prostate | C61.9 |
| Testis | C62 |
| Kidney | C64.9, C65.9 |
| Bladder (including in situ) | C67 |
| Central nervous system | C70–C72 |
| Thyroid | C73.9 |
| Hodgkin lymphomab | Type 9650–9667 |
| Non-Hodgkin lymphomab | Type 9590–9596, 9670–9719, 9727–9729 |
| Type 9823, all sites except C42.0,.1,.4 | |
| Type 9827, all sites except C42.0,.1,.4 | |
| Multiple myelomab | Type 9731, 9732, 9734 |
| Leukemiab | Type 9733, 9742, 9800–9801, 9805, 9820, 9826, |
| 9831–9837, 9840, 9860–9861, 9863, 9866–9867, | |
| 9870–9876, 9891, 9895–9897, 9910, 9920, 9930– | |
| 9931, 9940, 9945–9946, 9948, 9963–9964 | |
| Type 9823 and 9827, sites C42.0,.1,.4 | |
| All other cancers | All sites C00–C80, C97 not listed above |
| Mesotheliomab | 9050-9055 |
| Kaposi's sarcomab,c | 9140 |
| Small intestine | C17 |
| Anus | C21 |
| Gallbladder | C23 |
| Other digestive system | C22.1, C24, C26.8–9, C48 |
| Other respiratory system | C30–31, C33, C38.1–9, C39 |
| Bone and joints | C40–41 |
| Soft tissue (including heart) | C38.0, C47, C49 |
| Other skin | C44 excl. 8050:8084, 8090:8110, 8720:8790 |
| Other female genital system | C51–52, C57–58 |
| Penis | C60 |
| Other male genital system | C63 |
| Ureter | C66 |
| Other urinary system | C68 |
| Eye | C69 |
| Cancer | ICD-O-3 site/histology typea |
| (Incidence) | |
| Other endocrine | C37.9, C74, C75 |
| Other, ill-defined, and unknown | Type 9740, 9741, 9750–9758, 9760–9769, 9950– |
| 9962, 9970–9989; C76.0–76.8 (type 8000–9589); | |
| C80.9 (type 8000–9589); C42.0–42.4 (type 8000– | |
| 9589); C77.0–C77.9 (type 8000–9589) | |
| All cancers | All invasive sites |
ICD-O-3 refers to the International Classification of Diseases for Oncology,Third Edition.7Cancers are classified by SEER Incidence Site Record.8
Histology types 9590–9989 (leukemia, lymphoma and multiple myeloma), 9050–9055 (mesothelioma) and 9140 (Kaposi's sarcoma) are excluded from other specific organ sites.
Data are not available for Ontario and Canada.
Population estimates for Canada and the provinces/territories are based on quinquennial censuses conducted from 1981 to 2006. We used intercensal estimates prepared by Statistics Canada for the years between these censuses and postcensal estimates for 2007 to 2010.9 Projected population estimates were used for 2011 to 2032, as prepared by Statistics Canada under assumptions of medium growth (scenario M1).10 The scenario M1 incorporates medium growth and historical trends (1981–2008) of interprovincial migration. For the total population, the low and high growth scenarios are about 6% below and above the M1 scenario, but this range is reduced to 3% for ages 65 or older.
Data on cancer incidence counts and population estimates were summarized into 5-year age groups (0–4, 5–9, …, 80–84, 85+) and 5-year periods of diagnosis (1983–1987, 1988–1992, 1993–1997, 1998–2002, 2003–2007) by sex and geographical region (British Columbia, the Prairie provinces [Alberta, Saskatchewan and Manitoba] individually and together, Ontario, Quebec, the Atlantic provinces [New Brunswick, Prince Edward Island, Nova Scotia and Newfoundland and Labrador] individually and together, and the North [Yukon, Northwest Territories and Nunavut]). The projected population figures were similarly aggregated for 5 projection quinquennia (2008–2012, 2013–2017, 2018–2022, 2023–2027, 2028–2032). The single-year data from 1994 to 2007 were used for projecting prostate cancer incidence. Rates for each category were calculated by dividing the number of cases in each category (a combination of cancer site, sex, region, period, and age group) by the corresponding population figure. These age-specific rates were standardized to the 1991 Canadian population (Table 2.2), using the direct method,11 to obtain the age-standardized incidence rates (ASIRs).
TABLE 2.2.
1991 Canadian standard population
| Age Group | Population (per 100 000) |
|---|---|
| 0–4 | 6946.40 |
| 5–9 | 6945.40 |
| 10–14 | 6803.40 |
| 15–19 | 6849.50 |
| 20–24 | 7501.60 |
| 25–29 | 8994.40 |
| 30–34 | 9240.00 |
| 35–39 | 8338.80 |
| 40–44 | 7606.30 |
| 45–49 | 5953.60 |
| 50–54 | 4764.90 |
| 55–59 | 4404.10 |
| 60–64 | 4232.60 |
| 65–69 | 3857.00 |
| 70–74 | 2965.90 |
| 75–79 | 2212.70 |
| 80–84 | 1359.50 |
| 85+ | 1023.70 |
| Total | 100 000.00 |
Data source: Census and Demographics Branch, Statistics Canada
Note: The Canadian population distribution is based on the final postcensal estimates of the July 1, 1991, Canadian population, adjusted for census undercoverage. The age distribution of the population has been weighted and normalized.
2.2 Methods
2.2.1 Projection methods
Future trends in cancer incidence rates are generally estimated by extending past trends using statistical models. A statistical model formulates the relationship between the risk factors and the cancer rates, and projections can be obtained by applying the future times in the equation.
There are several methods for projecting cancer burden, differing in terms of the type of model, selection of the data used for model fitting, and the method of extrapolating the model components into future periods. The model type diverges from simple linear or log-linear regression of age-specific rates or counts against time2,12,13 to age–period–cohort (APC) modelling. 11,14,15 Within the framework of APC models, effects of age, period and cohort are addressed in heterogeneous ways such as generalized linear models16,17 including their derivative, Nordpred method, based on a step function on 5-year intervals,3,15 generalized additive models18,19 with polynomial15,20 or spline smoothing methods,21 and Bayesian models22 with Markov chain Monte Carlo (MCMC) simulation.23 The link function is either common exponential11,14,22 or non-canonical power.3,15 A model is fitted to all available data or their subset for an adequate fit through a goodness-of-fit test.3,15 The assumptions used for extrapolating the observed trends include keeping current rates unchanged in future,24 continuing overall historical trend,2,22 extending only the most recent trend,3,15 and adjusting the extent to which the observed trend are likely to influence the future.3,15 To develop the most accurate profile of future cancer burden, we used the major projection models to produce projections of current rates as would have been forecast 15 or 20 years ago based on the long-term data series in Canada, compared the projected rates with those observed, and concluded with a cancer-dependent modelling approach. This multiple modelling approach consists of the following models and integrates the strengths of these models.
The common projection models relate incidence to the 3 intrinsically interdependent time dimensions: age at diagnosis (age), year of diagnosis (period), and year of birth (cohort). The Nordpred APC model3,15 uses the power-5 link function instead of the traditional logarithmic link to reduce the exponential changes; summarizes the linear trends in period and cohort over the observed data into a drift component and then arithmetically attenuates the drift into the future to damp the impact of past trends in the future; chooses data for model fitting; and chooses the drift for extrapolations. Nordpred with its standard and various modified parameter settings was the primary method used in the projections in this monograph. When cohort effects were not present, we considered a Nordpred model without cohort component as an alternative. When there were too few observed cases to properly estimate model parameters via the Nordpred method or projections from
Nordpred seemed unlikely based on biological and clinical grounds, we pursued Bayesian APC models22 or submodels with various prior settings, 5-year average method or applying a relative percentage adjustment to national estimates to obtain the estimates for a jurisdiction. Bayesian models estimate the age-specific rates from their posterior distribution through repeated iterative sampling. The 5-year average model assumes the current age-specific rates will remain in future. In addition, we used an age-specific trend power-5 model fitted to most recent data for the projections of prostate cancer to reduce the impact of prostate-specific antigen (PSA) screening on the long-term historical trend.
All the long-term projection models depend on an assumption of the continuity of past trends in age-specific rates, but with different extent. The details of these models, model section methods, and ‘‘best’’ models are described below.
2.2.1.1 Projection models
2.2.1.1.1 Nordpred power-5 models—modified generalized linear models (NP_ADPC and NP_ADP)
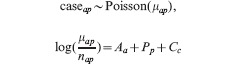
The Nordpred approach was developed as part of a comprehensive analysis of cancer trends in the Nordic countries.3,25 The approach is based on a standard APC Poisson regression model14,16,26 but has been shown to give more realistic predictions, especially for long-term projections.15,27 It is now one of the most frequently used methods for cancer projections worldwide.28–31 The log-linear relationship between the rate and the covariates in the standard model produces predictions in which the rates grow exponentially with time. Nordpred uses a power-link function instead of the log-link function to lower this growth. The power-link function is an approximation of the log-link function based on Box-Cox power transformation theory, in which  . The Nordpred model is defined as
where Rap is the incidence rate for age group a in calendar period p, which is the mean count μap of caseap divided by the corresponding population size nap; Aa, Pp and Cc are the non-linear components of age group a, period p and cohort c, respectively; and D is the common linear drift parameter of period and cohort.26 A cohort is calculated by subtracting age from period: c = A + p – a, with A = number of age groups (i.e. 18).
To achieve an adequate fit of each data to the model, the number of 5-year periods on which the projections should be based is chosen in the Nordpred software by using a goodness-of-fit test to successively remove the earlier periods. To extrapolate the model for future periods, two approaches are considered instead of simple continuation of the overall historical trend. Firstly, the software determines whether the average trend across all observed values, or the slope for the last 10 years of observed values, is used as the drift component D to be projected. The software does this by testing for departure from a linear trend. If the trend across the entire observation period departs significantly from linearity, only the trend in the most recent 10 years is used for projection. The ‘‘recent’’ option in the software allows choosing between using the average trend (recent = F) or the trend for the last 10 years (recent = T). Secondly, to attenuate the impact of current trends in future periods, a ‘‘cut trend’’ (or ‘‘drift’’) option is used, which is a vector of proportions indicating how much to cut the trend estimate for each 5-year projection period. A gradual reduction in the drift parameter of 25%, 50%, 75% and 75% in the second, third, fourth and fifth 5-year period, respectively, is used as a default ‘‘cut’’ in Nordpred.3,25
To explore accurate projection methods for this study, we compared the power-5 models and Poisson models (using log link instead of the power link in equation NP_ADPC), with the Nordpred option recommendations and their modifications. The default ‘‘cut trend’’ vector was modified to reduce or increase the impact of current trend in future periods.
For each age group, a minimum of 5 cases in each 5-year period was required; for age groups below this limit, the average number of cases in the last 2 periods was used to calculate future rates. If a limit of 10 had been used, as in the report for Nordic countries in most of the situations,3 a larger number of age groups would have been based on the average rates. This would reduce the effect of current trends, so a low limit of 5 was chosen as a trade-off between unbiased estimation of the underlying trend and a large estimation error.
In addition to the full ADPC model, we also considered using an age-drift-period model (ADP) with power-5 link functions for cancers with average annual counts of fewer than 50 over the last observed 5 years when cohort effects were not present based on a significance test:
This ADP model was used for rare cancers in Iceland in an analysis of cancer trends in the Nordic countries.3
2.2.1.1.2 Bayesian Markov chain Monte Carlo method
Instead of a maximum likelihood approach, we applied a Bayesian framework to the APC model or submodel. The Bayesian method incorporates prior knowledge into the model to derive a posterior distribution and uses MCMC approximations22,23 for inference (parameter estimates). We considered this approach for situations in which average annual count over the last observed 5 years was less than or equal to 10 (when there were too few observed cases to properly estimate model parameters via the Nordpred method) or if projections from Nordpred seemed unlikely. We considered 2 Bayesian approaches.
2.2.1.1.2.1 Bayesian APC model with autoregressive prior – Bray approach (B_APC)
For the classical APC Poisson model,26 Bray specified a second-order autoregressive prior model to smooth age, period and cohort effects and to extrapolate period and cohort effects.22,23 The model can be written as,
 |
Supposing that we compute N-period projections based on P-period observed data, there are total C = A+P −1 cohorts. With the Nordpred model, an individual cohort c can be calculated as c = A + p − a. The prior distributions are defined as follows. For the A age effects:
 |
For the P + N period effects:
 |
For the C + N cohort effects:
 |
The variance parameters τA, τP and τC (determining the smoothness of age, period and cohort effects, respectively) are given the same gamma prior,
Fitted and projected rates are derived by combining the simulated age, period and cohort effects based on
Three MCMC chains were run for a ‘‘burn-in’’ of 50 000 iterations. Parameter estimates (posterior medians) were based on an additional 50 000 iterations for each chain, thinned to every thirtieth sample (N=150 000 samples). Chain convergence was assessed via the Gelman-Rubin statistic, examination of sample autocorrelation, and visual inspection. All Bayesian modelling was implemented in WinBUGS (Windows Version of Bayesian inference Using Gibbs Sampling);32 additional details can be found elsewhere.33
2.2.1.1.2.2 Bayesian age–period model using national coefficients as priors’ means for regional projections (B_AP)
To stabilize regional estimates, initial or ‘‘prior’’ distributions based on national data were assumed for regional parameters and then updated using the actual regional data. The model can be written as
 |
We first used the model to estimate national-level age and period coefficients, denoted as Âa P̂p respectively. Regional age Aa and period Pp effects were then given normally distributed priors with means equal to the corresponding national estimates,
 |
where variance parameters τA, τP were given the same gamma prior,
Following Spiegelhalter et al.,34 corner constraints were imposed on the first age effect (A1 = 0) to facilitate computations.
2.2.1.1.3 Five-year average model (AVG)
The 5-year average model assumes that the age-specific average rates of cancer incidence in the most recent 5 years of observed data will remain constant in future years, so that future numbers of cancer would be affected only because of demographic changes in the population. The projected rates are calculated as
where Ra represents the rate for age group a, Cat the number of cases for age group a in year t, and Pat the population size for age group a in year t.
2.2.1.1.4 Relative percent adjustment method – regional projections derived from scaling down national-level projections (SD)
For a cancer site in a region with average annual counts over the last observed 5 years of fewer than 10, the age-specific counts were also calculated by adjusting the national estimates (based on a modified method used in the Cancer Registry of Norway).35 Let w denote the relative difference of the averages of the ASIRs in the last 5 observation years between the region and the whole country, that is,
then the cancer incidence rate in a region R, age group a and period p,
where RNap, CNap and PNap are the national cancer incidence rate, count and population size at age group a and period p, respectively. For example, if the region had 5% lower rates than the national average in the last 5 observation years, the age-specific rates in each future period were adjusted down by 5% for that region. We therefore have the corresponding number of new cancer cases,
2.2.1.1.5 Age-specific trend power-5 model fitting single-year data for short-term projections of prostate cancer (ADa)
Trends in prostate cancer incidence since the early 1990s have been subject to over-diagnosis (the detection of latent cancer that would never have been diagnosed in the absence of screening) because of the rapid dissemination of the PSA test.36 The projections of period analysis from Nordpred seem unlikely. Therefore, an age-specific trend power-5 model based on yearly data was fitted to a minimum of 8 years of observations from 1994 to 2007 for projections of prostate cancer incidence in the first 5 (2008–2012) or 10 (2008–2017) future years: Rap = (Aa + Da·p)5, where Da is the slope parameter in age group a, which takes the differentiation in trend from different age groups into consideration. This model also allowed for the ‘‘spike’’ value in the year 2001. Another peak year was in 1993, which was excluded from the modelling.
2.2.1.2 Comparison of models
We fitted the projection models described above to observed incidence counts in 1972–1991 and used them to estimate average annual number of cancer cases for the 5-year periods in 1992–2011. Projections were made for males and females, by age group, for the Canadian provinces and at the national level, for the cancer types shown in Table 2.1. Quebec was excluded from this analysis because of data quality issues prior to 1983.37,38
Given that prostate cancer accounts for nearly one-third of all new cancer cases in males in Canada, the effect of PSA screening is also clearly seen in the incidence of ‘‘all cancers combined’’ in males. The model comparisons were therefore considered with and without prostate cancer and ‘‘all cancers combined’’ for males when appropriate.
We compared projected average annual numbers of cancer cases with observed values. Median absolute relative difference between projected and observed values, |projected–observed|/observed, was calculated to examine each model's overall tendency to over- or underestimate the actual number of cancer cases. The absolute difference was used when comparing for rare cancers. We compared median prediction errors for each model for combinations of cancer type, geographical area and sex by length of projection. The comparisons considered only combinations for which the models produced projections. We used Friedman's test39 to test for statistical difference in medians between different projection models. In addition to considering prediction error across all cancers, we separately compared model performance for each cancer type, across the geographical areas and sexes.
2.2.1.3 Projection validation and adjustment
The model selection was performed by assessing the models and integrating these model comparison results with those from other published studies. However, a model created on cohorts in early periods may give inaccurate predictions when applied to contemporary cohorts. Owing to limitations in the availability of different long-term datasets used for validating the selected models, we examined the projections from the selected models using our knowledge of data quality, trends in cancer rates in different regions, risk factors or interventions to ensure the estimates are appropriate. When the estimated trends seemed unlikely, we used such knowledge to adjust the extrapolation methods of the fitted models, or used Bayesian simulations instead of the generalized linear models. Such modifications were applied in the following situations: all cancers combined in males in Prince Edward Island, Saskatchewan and Alberta, and in females in Ontario, Manitoba and Alberta; female non-Hodgkin lymphoma in New Brunswick; multiple myeloma in males in the Atlantic region and New Brunswick, and in females in Ontario and British Columbia; and thyroid cancer in the provinces except Manitoba, Saskatchewan and British Columbia.
2.2.1.4 Selected models by cancer category
We used the following projection methods in this monograph.
Common cancers (average annual count over the latest 5 observation years for a national or regional series, N > 50): NP_ADPC model with varied ‘‘recent’’ and ‘‘drift’’ values. One exception is that B_APC was applied to multiple myeloma in males in the Atlantic region as the projections from NP_ADPC seem questionable.
Less common cancers (10 <N ≤ 50): NP_ADPC or NP_ADP model (based on the significance of the cohort effect and comparison with AVG results) with varied ‘‘recent’’ and ‘‘drift’’ values. The simple age-effect only AVG model has been proven to be the best approach for rare cancers in our model evaluation and other studies27 and has been used in recent reports.35 With this, we adopted either NP_ADPC or NP_ADP, from which the projections were closer to the AVG results, instead of basing them solely on linear extrapolation of the 5-year average rate into the future. One exception is that B_APC was applied to multiple myeloma in males in New Brunswick.
Rare cancers (N ≤ 10): NP_ADPC, NP_ADP, B_APC, B_AP or SD model, whichever projections were closer to the AVG results.
-
Prostate cancer: ADa + AVG, defined as
using ADa to project for the first 5 future years, and then
using the age-specific average rates of the predicted 5-year data to estimate counts for the second to fifth 5-year periods.
‘‘All cancers’’ for males: The estimates of incidence counts were computed as the sum of the estimates for prostate cancer and for all cancers excluding prostate, as estimated by NP_ADPC modelling.
Tables 2.3 shows the selected projection models for rare cancers or in small areas by cancer type, sex and geographical area.
TABLE 2.3.
Projection models for rare cancers or in small areas by cancer type, sex and geographical area
| Cause | Model | |||
|---|---|---|---|---|
| B_APa | B_APCa | SDa | NP_ADPa | |
| Oral | PE/F, TC/M+F | MB/F | ||
| Esophagus | TC/M, NL/F | PE+TC/F | NS/F | |
| Stomach | PE/M | TC/F | PE/F, TC/M | NB/F |
| Colorectal | PE/F | TC/M+F | ||
| Liver | NS/F, TC/M | PE+NL/M+F, NB+SK+TC/F | MB+SK/M, AT/M+F | |
| Pancreas | TC/M+F | PE/M+F | NL/F | |
| Larynx | PE/F, TC/M | PE/M, NS+NB+MB+SK/F | NL+TC/F | AT/F |
| Melanoma | TC/M+F | |||
| Breast | TC/F | |||
| Cervix | PE/F, TC/F | MB/F | ||
| Body of uterus | TC/F | |||
| Ovary | TC/F | PE/F | ||
| Testis | PE+NL+TC/M | NS+NB+MB/M | ||
| Kidney | PE/F | TC/F | TC/M | PE/M, NL/M+F |
| Bladder | PE+TC/F, TC/M | NL/F | ||
| Central nervous system | PE+TC/M+F | NS/M, NB+NL+SK/F, MB/M+F | ||
| Thyroid | PE/M | PE/F | TC/M+F | NS/M, SK/F |
| Hodgkin lymphoma | NB/F | PE+NL+TC/M+F | NB+AB+AT/M, BC/F, NS+MB+SK/M+F | |
| Non-Hodgkin lymphoma | PE/F, TC/M+F | PE/M | NL/M+F, AT+NS+NB/F | |
| Multiple myeloma | AT+NB/M, PE/F | PE/M, NL/F, TC/M+F | NS+MB+SK/M+F, NL/M | |
| Leukemia | PE/M, TC/F | PE/F | TC/M | NL/M+F |
| All other cancers | PE/F | TC/F | ||
Abbreviations: AB, Alberta; AT, All Atlantic provinces together (PE, NS, NB and NL); BC, British Columbia; MB, Manitoba; NB, New Brunswick; NL, Newfoundland and Labrador; NS, Nova Scotia; PE, Prince Edward Island; SK, Saskatchewan; TC, All Territories (Yukon, Northwest Territories and Nunavut).
Note: The abbreviation before ‘/’ refers to the province or region; ‘M’ or ‘F’ after ‘/’ refers to males or females. For example, PE+TC/M+F in the ‘SD’ model was used for both males and females in PE and TC for central nervous system cancers.
See Methods for the definitions.
2.2.2 Other analysis methods
2.2.2.1 Joinpoint regression analysis
We assessed observed trends (1986–2007) using joinpoint regression,40,41 which involves fitting a series of joined straight lines on a logarithmic scale to the trends in ASIRs. The trends in incidence are reflected by the annual percent change. The models incorporated estimated standard errors of the ASIRs. The tests of significance used a Monte Carlo Permutation method. The estimated slope from this model was then transformed back to represent an annual percentage increase or decrease in the rate.
A minimum of 5 years of data before and after a changepoint in years in which the annual percent change changed significantly was required for a new trend to be identified. Thus, the most recent possible changepoint is 2003. In Figures 3.1 and 3.2, if no changepoint was detected from 1998 to 2007, then the annual percent change was estimated by fitting a model within this time period. If a changepoint was detected within this decade, then the annual percent change was estimated from the trend in the last segment. Both the changepoint year and the annual percent change for the years beyond the changepoint are indicated in these two figures.
FIGURE 3.1. Annual percent changes in age-standardized incidence rates (1998–2007) for selected cancers, males, Canada.

Note: The error bars refer to 95% confidence intervals.
FIGURE 3.2. Annual percent changes in age-standardized incidence rates (1998–2007) for selected cancers, females, Canada.

Note: The error bars refer to 95% confidence intervals.
2.2.2.2 Contribution of change in cancer risk, population growth and population age structure to incidence trend
Figure 3.4 shows the relative contributions of changes in the total numbers of new cases that can be attributed to changes in cancer risk, population growth, and aging of the population. The series were defined as follows (the annual ASIR was calculated by using the average annual population distribution in 1983–1987 for males or females as the standard weights):1
FIGURE 3.4. Trends in average annual new cases for all cancers and ages, attributed to changes in cancer risk, population growth, and aging population, Canada, 1983–2032.

The baseline (red reference line) represents the observed average annual number of new cancer cases during 1983–1987 for males or females.
The lowest black line represents the average annual number of new cancer cases that would have occurred in each period if the average annual population size and composition had remained the same as they were in 1983–1987. Thus, it measures the impact of changes in cancer risk. This series was computed by multiplying the average annual population in 1983–1987 by the ASIR.
The middle black line represents the average annual number of new cases that would have occurred if the age distribution of the average annual population had remained the same as it was in 1983–1987, measuring the impact of changes in risk and population growth. This series was computed by multiplying the average annual population by the ASIR.
The top line represents the total average annual number of new cases that actually occurred (projected estimates as of 2008) in each period for males or females, reflecting the combined impact of changes in cancer risk, and population growing and aging.
2.3 Presentation of results
In this monograph, while the figures display longer-termtimetrendsinASIRsofeachcancer for broader areas, the tables show cancer incidencefrequenciesandratesinallprovinces andterritoriesfromthelastobservationperiod (2003–2007) onward. The numbers of cases shown in the tables and figures are average annualnumbers.AlltheASIRswerecalculated per100 000person-years.
For each type of cancer, the historical and projected ASIRs are shown in figures to illustrate their time trends and differences between (1) sexes and age groups (<45, 45–54, 55–64, 65–74, 75–84, 85+), and (2) regions (British Columbia, the Prairies, Ontario, Quebec, the Atlantic region and Canada as a whole). The trends for the North are not shown in the figures because of small numbers. Number of cases in Figure 3.8–3.10 was rounded to the nearest 100.
FIGURE 3.8. Most common newly diagnosed cancers in Canada, 1983–1987.

a Total of rounded numbers may not equal rounded total number;
b CNS refers to central nervous system cancer;
c NHL refers to non-Hodgkin lymphoma.
FIGURE 3.10. Projected most common newly diagnosed cancers in Canada, 2028–2032.

a Total of rounded numbers may not equal rounded total number;
b CNS refers to central nervous system cancer;
c NHL refers to non-Hodgkin lymphoma.
Tables for males and females give the observed (2003–2007) and projected average annual number of cases and ASIRs by the 10-year age group and province/territories combined. Number of cases was rounded to the nearest 5. The numbers were rounded separately, so it is possible that the totals in the tables do not add up.
Chapter 3 presents the overview of historical and projected trends for all cancers combined, whereas Chapter 4 breaks down such information by cancer sites.
The cancers are ordered by the ICD-O-3 codes.
Chapter 3: Overview of Observed and Projected Status of All Cancers
Recent changes in observed cancer incidence rates
The annual percent change in cancer-specific ASIRs in males and females in the last observed decade (1998–2007) shows varying trends by cancer site (Figures 3.1 and 3.2). Between 1998 and 2007, the overall incidence rate increased significantly in females by 0.3% per year. Statistically significant increases of 2% or more per year occurred for liver cancer in both males (3.6%) and females (2.4%), kidney cancer in males (2.6% since 2003) and thyroid in both males (6.8%) and females (6.9% since 2002). Significant annual decreases of 2% or more occurred in larynx cancer for both males (3.8%) and females (3.4%) and in stomach cancer in males (2.0%). The possible explanations for the observed trends can be found in the corresponding section of Chapter 4.
Overall (historic and projected) trends
Figure 3.3 illustrates the average annual number of new cases and ASIRs for all cancers combined for 1983–2032, with projections as of the year 2008. Even though the observed ASIRs for all cancers combined stabilized, the number of new cancer cases continues to increase as the Canadian population grows and ages. The ASIRs in males decreased after increasing until 1993–1997. This pattern mirrors a similar trend in the incidence of prostate cancer, the leading cancer in males. The decrease also represents the decrease in lung cancer rates in men aged 65 or older. In females, the cancer incidence rate increased slightly over the observation horizon. The increase reflects the rise in rates in cancers of lung (in women aged 65 or older), uterus, thyroid, breast (in females aged under 45), leukemia, kidney, and melanoma.
FIGURE 3.3. Average annual new cases and age-standardized incidence rates (ASIRs) for all cancers, Canada, 1983–2032.

Note: The error bars refer to 95% confidence intervals.
All cancers combined excludes non-mela-noma skin cancer. In Canada, non-mela-noma skin cancer accounts for about 30% of all new cancer cases.
Tables 3.1 to 3.4 show historic and projected numbers of new cancer cases and ASIRs by sex, period, age group and geographical region. From 2003–2007 to 2028–2032, the ASIRs for all cancers in Canada are projected to decrease in males by 5%, from 464.8 to 443.2 per 100 000, and to increase in females by 4%, from 358.3 to 371.0 per 100 000. The annual number of cases is projected to increase by 84% (from 80 810 to 148 370) in males and by 74% (from 74 165 to 128 830) in females.
TABLE 3.1.
Observed (2003–2007) and projected average annual new cases by age and province/territories combined (TC), all cancers, males, Canada, 2003–2032
| Period | Age | New cases | |||||||||||
|---|---|---|---|---|---|---|---|---|---|---|---|---|---|
| CA | BC | AB | SK | MB | ON | QC | NB | NS | PE | NL | TC | ||
| 2003–07 | <45 | 4720 | 560 | 495 | 125 | 155 | 1950 | 1080 | 100 | 155 | 20 | 65 | 15 |
| 45–54 | 8265 | 970 | 850 | 230 | 280 | 3230 | 2000 | 225 | 285 | 40 | 140 | 20 | |
| 55–64 | 18 860 | 2280 | 1655 | 540 | 600 | 7145 | 4870 | 545 | 715 | 110 | 360 | 40 | |
| 65–74 | 24 570 | 3090 | 2090 | 840 | 825 | 9375 | 6135 | 710 | 905 | 140 | 420 | 40 | |
| 75–84 | 19 040 | 2600 | 1555 | 705 | 725 | 6985 | 4925 | 500 | 670 | 95 | 260 | 20 | |
| 85+ | 5350 | 785 | 440 | 235 | 240 | 1750 | 1470 | 155 | 195 | 30 | 55 | 5 | |
| Total | 80 810 | 10 280 | 7090 | 2675 | 2825 | 30 430 | 20 480 | 2235 | 2925 | 440 | 1295 | 140 | |
| 2008–12 | <45 | 4810 | 555 | 555 | 125 | 135 | 1940 | 1060 | 100 | 140 | 20 | 65 | 10 |
| 45–54 | 9490 | 1015 | 1015 | 255 | 280 | 3865 | 2180 | 235 | 320 | 50 | 140 | 25 | |
| 55–64 | 23 235 | 2665 | 2120 | 695 | 680 | 9090 | 5640 | 710 | 875 | 135 | 455 | 55 | |
| 65–74 | 27 390 | 3435 | 2160 | 870 | 830 | 10 455 | 6875 | 850 | 1060 | 160 | 495 | 50 | |
| 75–84 | 20 520 | 2775 | 1680 | 675 | 660 | 7435 | 5520 | 545 | 705 | 110 | 275 | 25 | |
| 85+ | 7065 | 1050 | 560 | 245 | 265 | 2385 | 2055 | 180 | 220 | 30 | 55 | 5 | |
| Total | 92 515 | 11 495 | 8085 | 2860 | 2850 | 35 170 | 23 330 | 2620 | 3320 | 510 | 1490 | 170 | |
| 2013–17 | <45 | 5085 | 590 | 590 | 120 | 130 | 2030 | 1110 | 100 | 140 | 20 | 65 | 10 |
| 45–54 | 9505 | 1000 | 1035 | 245 | 260 | 3965 | 2085 | 230 | 315 | 50 | 145 | 25 | |
| 55–64 | 26 330 | 2985 | 2610 | 795 | 750 | 10 455 | 6140 | 760 | 910 | 150 | 470 | 60 | |
| 65–74 | 33 695 | 4245 | 2810 | 1005 | 990 | 12 860 | 8175 | 1070 | 1320 | 200 | 630 | 75 | |
| 75–84 | 22 080 | 2955 | 1855 | 680 | 660 | 7910 | 5935 | 620 | 780 | 125 | 310 | 35 | |
| 85+ | 8940 | 1265 | 750 | 265 | 295 | 3080 | 2670 | 205 | 250 | 35 | 65 | 5 | |
| Total | 105 630 | 13 040 | 9645 | 3115 | 3085 | 40 300 | 26 115 | 2985 | 3715 | 580 | 1685 | 210 | |
| 2018–22 | <45 | 5420 | 650 | 605 | 125 | 130 | 2170 | 1155 | 105 | 145 | 20 | 70 | 10 |
| 45–54 | 8895 | 925 | 1015 | 220 | 235 | 3735 | 1890 | 215 | 280 | 45 | 130 | 20 | |
| 55–64 | 28 975 | 3235 | 2945 | 845 | 800 | 11 885 | 6500 | 780 | 970 | 170 | 465 | 65 | |
| 65–74 | 40 245 | 5110 | 3665 | 1220 | 1165 | 15 510 | 9295 | 1250 | 1505 | 235 | 735 | 95 | |
| 75–84 | 25 830 | 3445 | 2220 | 740 | 750 | 9150 | 6925 | 760 | 950 | 145 | 385 | 50 | |
| 85+ | 10 370 | 1450 | 915 | 285 | 305 | 3530 | 3155 | 240 | 280 | 45 | 80 | 10 | |
| Total | 119 730 | 14 810 | 11 360 | 3440 | 3385 | 45 985 | 28 915 | 3355 | 4130 | 655 | 1870 | 250 | |
| 2023–27 | <45 | 5765 | 710 | 620 | 130 | 130 | 2340 | 1190 | 110 | 150 | 20 | 70 | 10 |
| 45–54 | 9065 | 950 | 1065 | 215 | 240 | 3785 | 1940 | 215 | 275 | 40 | 125 | 20 | |
| 55–64 | 28 925 | 3245 | 2970 | 815 | 775 | 12 195 | 6210 | 750 | 950 | 170 | 460 | 60 | |
| 65–74 | 46 165 | 5815 | 4515 | 1415 | 1325 | 18 160 | 10 280 | 1350 | 1615 | 260 | 770 | 110 | |
| 75–84 | 32 640 | 4395 | 2960 | 895 | 945 | 11 625 | 8475 | 975 | 1220 | 180 | 505 | 70 | |
| 85+ | 11 725 | 1615 | 1055 | 305 | 335 | 3995 | 3570 | 280 | 330 | 50 | 95 | 10 | |
| Total | 134 285 | 16 725 | 13 185 | 3780 | 3750 | 52 105 | 31 670 | 3685 | 4545 | 725 | 2025 | 280 | |
| 2028–32 | <45 | 5990 | 745 | 620 | 135 | 125 | 2475 | 1220 | 115 | 150 | 15 | 70 | 10 |
| 45–54 | 9780 | 1070 | 1135 | 235 | 260 | 4065 | 2060 | 215 | 295 | 45 | 135 | 15 | |
| 55–64 | 27 300 | 3075 | 2930 | 750 | 715 | 11 615 | 5685 | 700 | 860 | 150 | 420 | 55 | |
| 65–74 | 51 070 | 6370 | 5090 | 1510 | 1440 | 20 765 | 10 950 | 1405 | 1745 | 295 | 780 | 115 | |
| 75–84 | 39 720 | 5365 | 3930 | 1115 | 1140 | 14 280 | 9880 | 1155 | 1415 | 215 | 600 | 90 | |
| 85+ | 14 510 | 2010 | 1335 | 350 | 400 | 4855 | 4475 | 365 | 425 | 65 | 130 | 15 | |
| Total | 148 370 | 18 635 | 15 040 | 4090 | 4085 | 58 055 | 34 275 | 3955 | 4890 | 785 | 2140 | 305 | |
Abbreviations: AB, Alberta; BC, British Columbia; CA, Canada; MB, Manitoba; NB, New Brunswick; NL, Newfoundland and Labrador; NS, Nova Scotia; ON, Ontario; PE, Prince Edward Island; QC, Quebec; SK, Saskatchewan; TC, All Territories (Yukon, Northwest Territories and Nunavut).
Note: Totals may not add up due to rounding.
TABLE 3.4.
Observed (2003–2007) and projected age-standardized incidence rates (ASIRs) by age and province/territories combined (TC), all cancers, females, Canada, 2003–2032
| Period | Age | ASIRs | |||||||||||
|---|---|---|---|---|---|---|---|---|---|---|---|---|---|
| CA | BC | AB | SK | MB | ON | QC | NB | NS | PE | NL | TC | ||
| 2003–07 | <45 | 77.6 | 67.3 | 76.0 | 65.9 | 68.9 | 86.2 | 73.4 | 74.7 | 77.5 | 68.5 | 67.6 | 60.3 |
| 45–54 | 459.8 | 405.1 | 442.7 | 424.9 | 456.7 | 477.2 | 479.8 | 454.7 | 454.1 | 423.5 | 416.5 | 435.8 | |
| 55–64 | 875.8 | 779.9 | 865.6 | 901.5 | 908.0 | 876.9 | 914.4 | 886.4 | 923.9 | 902.5 | 848.4 | 1003.9 | |
| 65–74 | 1372.1 | 1283.4 | 1396.0 | 1386.5 | 1363.1 | 1362.6 | 1405.8 | 1391.2 | 1515.1 | 1583.5 | 1277.7 | 1680.4 | |
| 75–84 | 1828.8 | 1737.8 | 1805.9 | 1757.9 | 1867.6 | 1758.8 | 1971.2 | 1907.9 | 2085.6 | 1956.8 | 1569.3 | 2078.9 | |
| 85+ | 2023.8 | 1869.5 | 1978.6 | 1772.8 | 1919.8 | 1894.5 | 2453.6 | 1982.7 | 2097.8 | 1973.2 | 1081.8 | 1834.0 | |
| Total | 358.3 | 326.1 | 354.8 | 344.6 | 354.4 | 361.7 | 372.7 | 360.4 | 381.4 | 368.9 | 319.0 | 382.9 | |
| 2008–12 | <45 | 79.4 | 64.2 | 77.6 | 67.1 | 69.6 | 90.6 | 74.0 | 79.3 | 72.9 | 71.3 | 71.2 | 57.1 |
| 45–54 | 465.1 | 389.1 | 445.4 | 415.8 | 432.8 | 493.0 | 484.2 | 454.3 | 459.2 | 407.4 | 459.5 | 414.1 | |
| 55–64 | 880.0 | 747.8 | 864.4 | 869.6 | 888.1 | 889.5 | 947.0 | 877.0 | 878.7 | 830.8 | 848.1 | 886.4 | |
| 65–74 | 1397.4 | 1250.5 | 1437.2 | 1447.9 | 1444.3 | 1384.0 | 1458.9 | 1445.6 | 1470.6 | 1530.6 | 1408.4 | 1718.1 | |
| 75–84 | 1838.1 | 1668.4 | 1892.9 | 1812.9 | 1899.0 | 1781.7 | 2000.7 | 1920.2 | 2079.2 | 1980.7 | 1605.8 | 2509.1 | |
| 85+ | 2042.4 | 1937.0 | 2094.1 | 1856.0 | 1992.9 | 1924.8 | 2419.9 | 1990.6 | 2126.3 | 1846.7 | 1145.8 | 1890.5 | |
| Total | 362.7 | 315.5 | 363.2 | 348.7 | 358.0 | 370.2 | 380.7 | 367.0 | 372.0 | 358.9 | 337.0 | 386.7 | |
| 2013–17 | <45 | 81.1 | 62.3 | 78.4 | 69.9 | 71.6 | 94.5 | 74.9 | 83.0 | 72.4 | 75.3 | 74.9 | 54.4 |
| 45–54 | 476.5 | 387.4 | 464.0 | 397.7 | 428.8 | 521.5 | 482.0 | 461.4 | 447.9 | 392.3 | 458.6 | 404.5 | |
| 55–64 | 875.1 | 711.8 | 860.9 | 857.5 | 879.2 | 896.0 | 947.3 | 863.2 | 848.7 | 819.6 | 880.9 | 892.3 | |
| 65–74 | 1402.8 | 1217.3 | 1431.1 | 1435.6 | 1423.2 | 1395.4 | 1500.4 | 1446.6 | 1431.8 | 1396.2 | 1450.0 | 1556.5 | |
| 75–84 | 1862.5 | 1650.6 | 1965.0 | 1903.5 | 1963.8 | 1800.5 | 2045.9 | 1963.9 | 2042.2 | 2056.7 | 1712.4 | 2623.6 | |
| 85+ | 2059.0 | 1845.4 | 2165.1 | 1944.2 | 2011.0 | 1933.9 | 2480.6 | 2062.5 | 2253.8 | 1990.6 | 1264.3 | 2115.6 | |
| Total | 366.1 | 307.0 | 368.4 | 351.0 | 359.3 | 378.0 | 386.2 | 371.4 | 365.2 | 354.0 | 350.2 | 379.7 | |
| 2018–22 | <45 | 80.9 | 61.2 | 79.4 | 70.7 | 74.3 | 95.9 | 73.0 | 81.5 | 69.4 | 73.9 | 76.7 | 50.4 |
| 45–54 | 494.7 | 386.2 | 473.2 | 401.4 | 431.9 | 557.2 | 489.0 | 496.7 | 451.8 | 411.0 | 462.2 | 412.6 | |
| 55–64 | 883.4 | 701.1 | 866.3 | 850.7 | 865.4 | 919.4 | 947.2 | 888.2 | 850.5 | 791.0 | 899.4 | 875.5 | |
| 65–74 | 1387.1 | 1168.3 | 1409.8 | 1396.5 | 1386.3 | 1390.1 | 1512.8 | 1401.1 | 1388.5 | 1340.6 | 1447.6 | 1564.1 | |
| 75–84 | 1881.5 | 1640.5 | 2005.3 | 1960.3 | 1982.8 | 1810.6 | 2087.7 | 1984.7 | 2025.1 | 2089.3 | 1827.0 | 2560.5 | |
| 85+ | 2061.9 | 1821.2 | 2209.9 | 1961.0 | 2090.4 | 1938.0 | 2500.3 | 2084.3 | 2196.0 | 1982.0 | 1337.4 | 2302.1 | |
| Total | 368.3 | 301.3 | 370.9 | 350.8 | 359.3 | 384.9 | 388.2 | 374.2 | 359.4 | 349.9 | 358.0 | 376.5 | |
| 2023–27 | <45 | 80.5 | 61.5 | 78.7 | 71.2 | 74.5 | 96.9 | 71.1 | 82.8 | 64.9 | 73.3 | 80.4 | 49.2 |
| 45–54 | 503.5 | 379.6 | 478.4 | 419.1 | 442.0 | 573.2 | 491.3 | 514.4 | 478.8 | 448.5 | 459.7 | 411.6 | |
| 55–64 | 897.5 | 708.1 | 889.7 | 817.0 | 854.4 | 957.5 | 934.6 | 896.3 | 846.0 | 780.0 | 880.7 | 890.9 | |
| 65–74 | 1376.2 | 1134.0 | 1394.3 | 1381.2 | 1371.9 | 1392.5 | 1501.1 | 1383.3 | 1365.3 | 1332.4 | 1472.4 | 1618.6 | |
| 75–84 | 1878.9 | 1616.7 | 1979.2 | 1938.3 | 1946.1 | 1812.1 | 2126.5 | 1977.2 | 1997.4 | 1923.5 | 1831.2 | 2407.2 | |
| 85+ | 2092.4 | 1833.8 | 2294.3 | 2104.9 | 2144.1 | 1950.6 | 2550.1 | 2135.5 | 2204.3 | 2148.6 | 1405.5 | 2445.5 | |
| Total | 369.7 | 298.3 | 371.9 | 349.8 | 357.8 | 391.0 | 387.1 | 376.8 | 356.4 | 347.8 | 361.2 | 376.6 | |
| 2028–32 | <45 | 79.3 | 60.6 | 78.3 | 69.7 | 71.4 | 96.4 | 69.3 | 86.6 | 64.9 | 72.6 | 84.4 | 48.0 |
| 45–54 | 504.3 | 382.7 | 485.0 | 429.0 | 478.0 | 582.6 | 477.6 | 485.1 | 451.0 | 444.3 | 452.0 | 390.9 | |
| 55–64 | 924.9 | 712.0 | 903.0 | 820.6 | 859.0 | 1011.6 | 940.4 | 950.5 | 855.6 | 814.0 | 876.3 | 921.1 | |
| 65–74 | 1385.3 | 1127.1 | 1399.5 | 1365.6 | 1345.9 | 1421.1 | 1493.7 | 1415.0 | 1380.4 | 1308.4 | 1483.6 | 1620.8 | |
| 75–84 | 1852.7 | 1562.0 | 1946.5 | 1884.9 | 1896.6 | 1797.0 | 2129.0 | 1906.7 | 1951.7 | 1895.8 | 1819.4 | 2483.2 | |
| 85+ | 2099.2 | 1825.4 | 2300.0 | 2107.2 | 2136.8 | 1948.8 | 2582.1 | 2131.0 | 2190.7 | 2121.5 | 1498.1 | 2307.0 | |
| Total | 371.0 | 295.8 | 372.7 | 347.2 | 356.3 | 397.6 | 384.8 | 380.5 | 353.5 | 346.9 | 364.1 | 377.6 | |
Abbreviations: AB, Alberta; BC, British Columbia; CA, Canada; MB, Manitoba; NB, New Brunswick; NL, Newfoundland and Labrador; NS, Nova Scotia; ON, Ontario; PE, Prince Edward Island; QC, Quebec; SK, Saskatchewan; TC, All Territories (Yukon, Northwest Territories and Nunavut).
TABLE 3.2.
Observed (2003–2007) and projected average annual new cases by age and province/territories combined (TC), all cancers, females, Canada, 2003–2032
| Period | Age | New cases | |||||||||||
|---|---|---|---|---|---|---|---|---|---|---|---|---|---|
| CA | BC | AB | SK | MB | ON | QC | NB | NS | PE | NL | TC | ||
| 2003–07 | <45 | 7940 | 895 | 820 | 190 | 240 | 3505 | 1725 | 175 | 230 | 30 | 110 | 20 |
| 45–54 | 11 490 | 1370 | 1095 | 310 | 395 | 4490 | 2950 | 280 | 345 | 45 | 185 | 30 | |
| 55–64 | 15 485 | 1870 | 1305 | 440 | 550 | 5810 | 4195 | 400 | 530 | 75 | 275 | 35 | |
| 65–74 | 16 325 | 2025 | 1350 | 515 | 570 | 6245 | 4280 | 405 | 570 | 85 | 250 | 25 | |
| 75–84 | 15 975 | 2035 | 1225 | 550 | 655 | 5960 | 4280 | 420 | 565 | 75 | 200 | 15 | |
| 85+ | 6945 | 900 | 540 | 280 | 310 | 2380 | 1990 | 190 | 265 | 35 | 55 | 5 | |
| Total | 74 165 | 9100 | 6335 | 2280 | 2715 | 28 385 | 19 425 | 1870 | 2505 | 345 | 1075 | 130 | |
| 2008–12 | <45 | 7900 | 850 | 875 | 185 | 235 | 3605 | 1630 | 165 | 195 | 25 | 105 | 20 |
| 45–54 | 12 670 | 1430 | 1245 | 325 | 400 | 5195 | 3125 | 290 | 370 | 50 | 205 | 30 | |
| 55–64 | 18 805 | 2235 | 1690 | 520 | 645 | 7140 | 5030 | 480 | 595 | 85 | 335 | 45 | |
| 65–74 | 18 915 | 2315 | 1600 | 565 | 655 | 7135 | 5075 | 485 | 640 | 95 | 330 | 35 | |
| 75–84 | 16 755 | 2025 | 1390 | 545 | 630 | 6310 | 4635 | 420 | 575 | 80 | 215 | 20 | |
| 85+ | 8885 | 1185 | 730 | 315 | 375 | 3170 | 2530 | 225 | 305 | 40 | 65 | 5 | |
| Total | 83 930 | 10 040 | 7525 | 2460 | 2945 | 32 560 | 22 020 | 2070 | 2675 | 375 | 1255 | 160 | |
| 2013–17 | <45 | 8280 | 860 | 935 | 200 | 255 | 3865 | 1670 | 170 | 190 | 30 | 100 | 20 |
| 45–54 | 12 770 | 1425 | 1290 | 290 | 385 | 5595 | 2910 | 275 | 340 | 45 | 195 | 30 | |
| 55–64 | 21 300 | 2425 | 2045 | 600 | 720 | 8270 | 5560 | 515 | 635 | 90 | 370 | 55 | |
| 65–74 | 23 685 | 2870 | 2075 | 660 | 795 | 8915 | 6405 | 625 | 785 | 115 | 445 | 50 | |
| 75–84 | 17 955 | 2150 | 1575 | 560 | 650 | 6745 | 4965 | 460 | 610 | 90 | 255 | 30 | |
| 85+ | 10 500 | 1310 | 915 | 355 | 420 | 3770 | 3125 | 260 | 345 | 50 | 85 | 5 | |
| Total | 94 495 | 11 035 | 8830 | 2660 | 3220 | 37 160 | 24 635 | 2305 | 2900 | 420 | 1450 | 195 | |
| 2018–22 | <45 | 8685 | 905 | 995 | 210 | 280 | 4130 | 1715 | 165 | 180 | 30 | 100 | 15 |
| 45–54 | 12 365 | 1370 | 1275 | 260 | 360 | 5685 | 2610 | 260 | 300 | 40 | 175 | 30 | |
| 55–64 | 23 405 | 2590 | 2300 | 635 | 760 | 9510 | 5820 | 550 | 675 | 95 | 380 | 60 | |
| 65–74 | 28 330 | 3400 | 2640 | 790 | 940 | 10 780 | 7505 | 735 | 900 | 130 | 535 | 70 | |
| 75–84 | 21 170 | 2545 | 1915 | 620 | 735 | 7820 | 5945 | 550 | 720 | 110 | 340 | 45 | |
| 85+ | 11 635 | 1415 | 1075 | 365 | 450 | 4190 | 3530 | 280 | 360 | 55 | 100 | 10 | |
| Total | 105 590 | 12 230 | 10 200 | 2875 | 3525 | 42 110 | 27 125 | 2545 | 3140 | 465 | 1630 | 235 | |
| 2023–27 | <45 | 9035 | 975 | 1025 | 220 | 295 | 4425 | 1695 | 165 | 175 | 30 | 100 | 15 |
| 45–54 | 12 750 | 1380 | 1340 | 280 | 375 | 5890 | 2665 | 265 | 305 | 45 | 160 | 30 | |
| 55–64 | 23 410 | 2625 | 2350 | 570 | 735 | 10 080 | 5360 | 525 | 635 | 90 | 360 | 60 | |
| 65–74 | 32 100 | 3775 | 3165 | 915 | 1050 | 12 430 | 8270 | 800 | 985 | 145 | 585 | 90 | |
| 75–84 | 26 800 | 3245 | 2495 | 740 | 905 | 9860 | 7535 | 715 | 910 | 135 | 455 | 65 | |
| 85+ | 13 085 | 1600 | 1270 | 400 | 480 | 4675 | 3975 | 320 | 405 | 70 | 120 | 15 | |
| Total | 117 185 | 13 600 | 11 645 | 3125 | 3845 | 47 365 | 29 500 | 2790 | 3415 | 515 | 1780 | 280 | |
| 2028–32 | <45 | 9110 | 995 | 1020 | 215 | 295 | 4580 | 1655 | 175 | 175 | 30 | 105 | 15 |
| 45–54 | 13 610 | 1505 | 1475 | 310 | 435 | 6340 | 2785 | 250 | 295 | 45 | 150 | 25 | |
| 55–64 | 22 685 | 2560 | 2310 | 520 | 695 | 10 190 | 4825 | 500 | 570 | 80 | 325 | 60 | |
| 65–74 | 35 275 | 4085 | 3550 | 970 | 1115 | 14 235 | 8655 | 855 | 1065 | 155 | 605 | 100 | |
| 75–84 | 32 250 | 3900 | 3180 | 900 | 1080 | 11 955 | 8875 | 845 | 1065 | 160 | 550 | 95 | |
| 85+ | 15 895 | 1950 | 1570 | 445 | 555 | 5590 | 4925 | 390 | 500 | 85 | 170 | 25 | |
| Total | 128 830 | 14 995 | 13 105 | 3360 | 4170 | 52 890 | 31 720 | 3015 | 3670 | 555 | 1900 | 320 | |
Abbreviations: AB, Alberta; BC, British Columbia; CA, Canada; MB, Manitoba; NB, New Brunswick; NL, Newfoundland and Labrador; NS, Nova Scotia; ON, Ontario; PE, Prince Edward Island; QC, Quebec; SK, Saskatchewan; TC, All Territories (Yukon, Northwest Territories and Nunavut).
Note: Totals may not add up due to rounding.
TABLE 3.3.
Observed (2003–2007) and projected age-standardized incidence rates (ASIRs) by age and povince/territories combined (TC), all cancers, males, Canada, 2003–2032
| Period | Age | ASIRs | |||||||||||
|---|---|---|---|---|---|---|---|---|---|---|---|---|---|
| CA | BC | AB | SK | MB | ON | QC | NB | NS | PE | NL | TC | ||
| 2003–07 | <45 | 46.0 | 43.1 | 43.4 | 42.8 | 42.4 | 48.3 | 45.6 | 44.4 | 54.1 | 53.3 | 40.8 | 35.0 |
| 45–54 | 331.4 | 291.0 | 330.1 | 307.3 | 316.8 | 346.2 | 327.3 | 368.3 | 381.3 | 393.1 | 319.7 | 259.3 | |
| 55–64 | 1109.9 | 975.6 | 1099.4 | 1132.0 | 1019.7 | 1133.7 | 1120.4 | 1239.1 | 1295.8 | 1369.8 | 1124.0 | 932.9 | |
| 65–74 | 2287.3 | 2035.9 | 2305.9 | 2453.0 | 2218.9 | 2302.8 | 2297.5 | 2672.0 | 2642.8 | 2782.8 | 2238.1 | 2446.9 | |
| 75–84 | 3068.1 | 2876.7 | 3046.6 | 3012.9 | 2999.1 | 2907.7 | 3404.9 | 3358.1 | 3583.7 | 3517.4 | 2724.6 | 3229.8 | |
| 85+ | 3506.6 | 3246.0 | 3394.8 | 3122.3 | 3355.0 | 3093.5 | 4643.9 | 3735.2 | 3631.1 | 3692.9 | 2367.1 | 2467.3 | |
| Total | 464.8 | 420.2 | 461.3 | 467.3 | 444.3 | 461.1 | 489.3 | 517.7 | 535.7 | 550.6 | 433.8 | 440.2 | |
| 2008–12 | <45 | 47.7 | 42.4 | 45.1 | 42.4 | 37.9 | 49.3 | 46.6 | 47.6 | 54.9 | 49.3 | 47.5 | 31.2 |
| 45–54 | 342.9 | 279.5 | 340.0 | 321.4 | 295.3 | 362.0 | 331.4 | 380.8 | 405.2 | 434.7 | 330.5 | 281.2 | |
| 55–64 | 1129.3 | 929.0 | 1062.6 | 1165.2 | 959.9 | 1190.9 | 1113.7 | 1341.0 | 1347.4 | 1419.7 | 1191.9 | 928.6 | |
| 65–74 | 2208.8 | 1946.8 | 2055.6 | 2394.1 | 2001.2 | 2254.4 | 2185.5 | 2666.1 | 2652.8 | 2729.1 | 2216.4 | 2327.6 | |
| 75–84 | 2942.7 | 2714.5 | 2860.4 | 2867.5 | 2672.3 | 2767.8 | 3280.2 | 3371.6 | 3424.2 | 3519.0 | 2613.7 | 3340.0 | |
| 85+ | 3368.6 | 3176.5 | 3220.2 | 2878.2 | 2999.6 | 2950.5 | 4469.9 | 3416.4 | 3477.7 | 3603.6 | 2139.2 | 3120.6 | |
| Total | 457.6 | 401.9 | 434.8 | 459.7 | 403.5 | 458.7 | 476.0 | 526.9 | 536.7 | 552.1 | 437.7 | 442.0 | |
| 2013–17 | <45 | 49.3 | 43.1 | 45.7 | 41.0 | 35.0 | 50.4 | 48.0 | 50.8 | 56.9 | 48.0 | 51.4 | 30.3 |
| 45–54 | 341.9 | 268.5 | 344.9 | 330.3 | 282.8 | 357.2 | 328.3 | 386.7 | 413.8 | 441.6 | 348.7 | 292.8 | |
| 55–64 | 1120.4 | 919.8 | 1076.3 | 1150.2 | 915.9 | 1183.3 | 1085.6 | 1340.3 | 1296.4 | 1458.8 | 1186.2 | 893.9 | |
| 65–74 | 2157.2 | 1898.1 | 2018.9 | 2309.2 | 1895.1 | 2203.5 | 2104.0 | 2607.6 | 2617.2 | 2651.4 | 2200.5 | 2186.3 | |
| 75–84 | 2867.6 | 2608.8 | 2824.4 | 2879.8 | 2587.1 | 2684.2 | 3159.4 | 3320.8 | 3332.2 | 3382.3 | 2515.8 | 3452.5 | |
| 85+ | 3345.1 | 3061.9 | 3272.9 | 2824.4 | 2935.6 | 2902.9 | 4447.3 | 3397.1 | 3467.1 | 3615.1 | 2135.7 | 3071.7 | |
| Total | 451.4 | 392.1 | 433.7 | 452.5 | 385.4 | 451.3 | 464.1 | 523.7 | 528.8 | 545.3 | 437.3 | 433.5 | |
| 2018–22 | <45 | 50.5 | 44.6 | 45.4 | 40.6 | 33.3 | 51.5 | 48.5 | 52.0 | 59.0 | 46.4 | 56.1 | 27.4 |
| 45–54 | 346.3 | 260.4 | 350.8 | 330.7 | 273.4 | 361.9 | 334.4 | 409.4 | 422.5 | 421.0 | 361.5 | 301.1 | |
| 55–64 | 1114.2 | 907.9 | 1083.8 | 1145.1 | 900.8 | 1176.9 | 1068.0 | 1332.7 | 1297.5 | 1502.9 | 1168.9 | 884.7 | |
| 65–74 | 2130.2 | 1870.0 | 2026.7 | 2258.2 | 1822.8 | 2190.7 | 2046.5 | 2573.5 | 2538.7 | 2609.4 | 2173.6 | 2126.1 | |
| 75–84 | 2782.1 | 2532.5 | 2759.1 | 2829.2 | 2486.9 | 2600.1 | 3020.4 | 3228.1 | 3286.9 | 3286.9 | 2500.3 | 3213.3 | |
| 85+ | 3277.6 | 2968.9 | 3268.1 | 2849.4 | 2826.1 | 2810.4 | 4351.1 | 3422.5 | 3345.9 | 3625.9 | 2135.2 | 3445.8 | |
| Total | 446.6 | 385.6 | 432.9 | 446.8 | 372.3 | 447.2 | 453.7 | 520.9 | 523.1 | 539.6 | 438.0 | 422.8 | |
| 2023–27 | <45 | 51.8 | 46.0 | 45.7 | 41.4 | 31.7 | 52.7 | 49.7 | 54.2 | 59.3 | 43.5 | 58.9 | 27.8 |
| 45–54 | 354.3 | 264.7 | 354.7 | 315.8 | 273.9 | 373.8 | 340.6 | 423.8 | 445.9 | 424.3 | 380.5 | 275.7 | |
| 55–64 | 1112.2 | 889.6 | 1094.3 | 1169.0 | 893.6 | 1173.6 | 1061.8 | 1338.3 | 1322.3 | 1510.5 | 1204.6 | 902.2 | |
| 65–74 | 2115.6 | 1862.3 | 2045.3 | 2238.9 | 1788.2 | 2190.6 | 2000.2 | 2559.6 | 2468.9 | 2653.8 | 2143.9 | 2033.8 | |
| 75–84 | 2715.7 | 2477.3 | 2707.2 | 2724.7 | 2401.9 | 2556.1 | 2910.6 | 3132.1 | 3252.1 | 3133.1 | 2448.2 | 3025.3 | |
| 85+ | 3183.1 | 2848.0 | 3199.1 | 2872.0 | 2823.0 | 2745.5 | 4177.2 | 3286.2 | 3284.9 | 3337.1 | 1982.1 | 3329.5 | |
| Total | 443.8 | 381.8 | 433.2 | 443.0 | 365.2 | 446.8 | 445.9 | 518.7 | 521.3 | 533.2 | 439.6 | 407.6 | |
| 2028–32 | <45 | 52.8 | 46.8 | 45.8 | 42.0 | 29.9 | 53.8 | 51.0 | 55.6 | 57.2 | 36.2 | 59.7 | 28.1 |
| 45–54 | 361.1 | 276.1 | 352.9 | 313.4 | 278.1 | 381.6 | 339.2 | 427.6 | 476.5 | 443.8 | 427.6 | 242.0 | |
| 55–64 | 1121.5 | 873.7 | 1106.0 | 1173.9 | 882.6 | 1186.9 | 1074.8 | 1383.0 | 1343.2 | 1459.9 | 1230.4 | 909.2 | |
| 65–74 | 2106.3 | 1845.6 | 2060.8 | 2239.0 | 1779.0 | 2184.7 | 1973.7 | 2541.9 | 2485.4 | 2730.1 | 2122.2 | 2018.7 | |
| 75–84 | 2682.2 | 2449.9 | 2725.4 | 2670.3 | 2326.4 | 2548.3 | 2832.4 | 3087.4 | 3143.8 | 3089.7 | 2426.8 | 2927.3 | |
| 85+ | 3086.7 | 2794.6 | 3120.2 | 2776.5 | 2689.4 | 2651.1 | 4018.4 | 3189.2 | 3258.1 | 3340.9 | 2043.7 | 2983.8 | |
| Total | 443.2 | 379.5 | 434.9 | 440.6 | 358.8 | 447.9 | 441.4 | 520.1 | 521.9 | 529.5 | 445.8 | 396.8 | |
Abbreviations: AB, Alberta; BC, British Columbia; CA, Canada; MB, Manitoba; NB, New Brunswick; NL, Newfoundland and Labrador; NS, Nova Scotia; ON, Ontario; PE, Prince Edward Island; QC, Quebec; SK, Saskatchewan; TC, All Territories (Yukon, Northwest Territories and Nunavut).
Figure 3.4, presenting the determinants of increases in the total average annual numbers of cancer incidence cases (see Chapter 2 for definitions of the series), shows that the observed and projected increase in the number of cancer cases mainly results from the aging of the population and, to a lesser extent, population growth. Changes in the risk of cancer have been contributing marginally to the increase in new cases, especially in males. In 2028–2032, the percentages of the total changes due to aging, population increase and cancer risk are predicted to be 70.9%, 29.1% and 0.1% respectively in males, and 58.4%, 35.5% and 6.1% in females. In addition, the percentages of the total changes due to change of age distribution increase with time, from 41.5% in 1988–1992 to 70.9% in 2028–2032 in males and from 42.0% to 58.4% in females. The percentages due to change of population size generally decrease over the same period, from 39.8% to 29.1% in males and from 46.8% to 35.5% in females. The percentages due to change of cancer risk decrease in males from 18.7% to 0.1% over the study period, whereas the percentages in females increased from 11.2% in 1988–1992 to 14.1% in 1998–2002 (in part because of increased mammography screening) and decrease thereafter to 6.1% in 2028–2032.
Trends by age
Figure 3.5 shows similar patterns of cancer occurrence and population distribution in males and females. The figure shows the increase in percentage of the population at older ages along with the corresponding increase in the number of expected cancer cases. Cancer cases increase with age until the peak in the 70–74 age group in both sexes, and illustrate approximately bell-shaped symmetric distributions about the peak in the 50-or-older age groups.
FIGURE 3.5. Historic and projecteda growth in average annual population (pop) and in average annual incidence cases of all cancers in Canada by age, 1983–2032.

a Cases and populations in the 2028–2032 period are projected. over one-third of all new cancer cases, will be examined in Chapter 4.
Trends by sex
Figure 3.6 compares the ASIRs for all cancers between sexes by 10-year age group from 1983 to 2032. Cancer is more common in males than in females except in those aged under 55. Breast cancer is the most common cancer in females under 55, accounting for 30% to 40% of cases in this age range in 2003–2007 (see Figure 3.9). Thyroid and cervical cancer also account for the higher cancer incidence in younger females. The overall cancer incidence rate in men aged 65 or older has been falling. The decrease in lung cancer incidence rates in males aged 65 or older as a result of decrease in tobacco use36,42,43 and the decrease in prostate cancer rates in people aged 75 or older have together contributed to the overall decrease in this age range, as these two cancers account for 42% of all new cancer cases in Canadian men in 2003–2007. In women aged 65 or older, the relatively stable rate is the result of an increase primarily of lung cancer incidence offset by decreases in incidence for the other cancer sites.
FIGURE 3.6. Age-standardized incidence rates (ASIRs) for all cancers by age group (–males, –females), Canada, 1983–2032.

FIGURE 3.9. Most common newly diagnosed cancers in Canada, 2003–2007.

a Total of rounded numbers may not equal rounded total number;
b CNS refers to central nervous system cancer;
c NHL refers to non-Hodgkin lymphoma.
Trends by geographical region
Figure 3.7 shows historic and estimated ASIRs for all cancers combined by sex and region from 1983 to 2032. In males, the ASIRs for all cancers combined are projected to continue to be highest in the Atlantic region and lowest in British Columbia. Male incidence rates in Quebec, Ontario, the Prairies and British Columbia are projected to decrease and then stabilize, while rates in the Atlantic region will be relatively stable. In females, Ontario is predicted to surpass Quebec and experience the highest rates in 15 years (i.e. after 2018–2022), while British Columbia will continue to have the lowest incidence. Female incidence rates are predicted to increase 10%, 3% and 1% in Ontario, Quebec and the Atlantic region, respectively, and decrease 9% and 7% in British Columbia and the Prairies by 2028–2032. This follows an increasing trend in the former regions prior to 2008 and a decreasing trend in the latter regions starting in 1998–2002. The overall differences in cancer incidence across the country are smaller in females, ranging from 7.1 to 101.8 per 100 000 versus 45.9 to 134.6 per 100 000 in males over the observation and projection periods.
FIGURE 3.7. Age-Standardized Incidence Rates (ASIRs) by region, all cancers, 1983–2032.

Observed most common cancers by sex and age
Figures 3.8 and 3.9 show the most common newly diagnosed cancers by sex and age group for 1983–1987 and 2003–2007. Overall, 52% of new cases in the last observation period (2003–2007) were in males and 48% in females. For males in each period, prostate, lung and colorectum were among the most frequently diagnosed cancer sites, together accounting for just over half the cases. In the last period the incidence of prostate cancer had replaced lung cancer in first place, followed by cancers of the colorectum and bladder. These cancers were similarly distributed for males within the various age groups, with some variation in proportions and ranking. The only exception was the youngest age group (<45 years), in which testis cancer was the most common newly diagnosed cancer. The incidence of testis cancer increased over the 2 periods of study. Other common cancers in the youngest males included non-Hodgkin lymphoma (NHL), leukemia and cancer of the central nervous system (CNS). Prostate cancer cases in men aged 45 to 74 increased markedly and occurred with the highest frequency in the most recent period, as a prevalent pool of undiagnosed cancers were detected by prostate-specific antigen (PSA) screening.36
Breast cancer dominated cancer incidence in females, representing the same proportion of 27% of all diagnoses in the 2 periods studied, followed by lung and colorectal cancers (which had switched places between 1983–1987 and 2003–2007). The top 3 cancer diagnoses for females within each age group of 45 or older were these same 3, but with slight variations in rank. For the youngest females (<45 years), the most common newly diagnosed cancer was breast cancer, with 30% of new cases. The other common cancers in this age group included thyroid, cervical cancers and melanoma.
The most noticeable difference between males and females under 45 was the much higher proportion of thyroid cancer incidence in females. The most dramatic changes in the incidence proportions of different types of cancer as a function of age (<45 and 45+) occurred with melanoma, leukemia, CNS tumours, NHL, thyroid and genital tract malignancies.
The incidence proportions (by 10-year age group) of lung cancer in males aged 45 to 74 decreased by 7% to 12% between 1983–1987 and 2003–2007, whereas the incidence proportions of prostate cancer increased more pronouncedly (10%–20%) over the 2 periods for the same age groups. The incidence share attributed to NHL also registered some increase in the 2 youngest age groups, while the proportion of stomach cancer incidence decreased in each age group.
The increase of 6% to 8% between the study periods in the incidence proportion of lung cancer in women 65 or older is notable. A similar trend was observed in European countries.4 The proportional increase in lung cancer incidence in females of all ages was 4% from 1983–1987 to 2003–2007. The incidence percentage also increased notably for NHL in women aged 65 to 84 and for thyroid cancer in those under 55. The proportion of breast cancer incidence increased by 2% to 3% in women aged between 45 and 64. This increased share for breast cancer may be partly attributable to the impact of early detection with the increased uptake of mammography screening. There was a marked reduction in the incidence proportion for cervical cancer in females aged under 45 as well as noteworthy reductions in the incidence proportions for stomach cancer and colorectal cancer in all female age groups. Many more cervical cancers are prevented by screening each year.
Projected most common cancers by sex and age
As the projected change in cancer incidence is attributable primarily to demographic factors, the relative frequencies of major cancers are not expected to change significantly. Figure 3.10 shows the cancer types that are projected to be newly diagnosed with the greatest frequency in 2028–2032 by sex and age group. By 2028–2032, colorectal cancer is projected to have overtaken lung cancer as the second most frequently diagnosed cancer in males, even though colorectal cancer will maintain a similar percentage of the total cancer cases in males as during 2003–2007. This change in ranking is the result of a decrease of 27% in the incidence of lung cancer as a proportion of all cancers, reflecting the historical reduction in smoking prevalence after accounting for a lag period.42–44 In males, the most common cancers in 2028–2032 are projected to be prostate cancer (28%), color-ectal (13%), lung (11%), bladder (6%) and NHL (4%). The age-specific analysis indicates that, between 2003–2007 and 2028–2032, the incidence of lung cancer in males (as a proportion of total cancer cases) will decrease by 19%, 34%, 32%, 30% and 21% for each of the 10-year age groups from 45 to 85 and over, respectively. Another notable change in the incidence frequency will be the 32% decrease in the melanoma incidence proportion in the youngest males (<45 years). Cancers of the prostate, colorectum and lung are projected to be the top 3 most common types, in that order, within each age group from 45 years and older.
For females, the top 4 most common incident cancers are expected to remain the same as in the last observation period (2003–2007). However, thyroid cancer will outrank NHL as the fifth most common cancer. Specifically, the most commonly diagnosed cancers in females in 2028–2032 are projected to be breast cancer (24%), lung cancer (12%), colorectal cancer (12%), uterine cancer (6%), thyroid cancer (5%) and NHL (4%). The overall increase in thyroid cancer will be mainly from the proportional increases of 67% in women aged 45 to 54, 140% in those aged 55 to 64, and 105% in those aged 65 to 74. The 26% predicted reduction in the incidence proportion for cervical cancer in females under 45 will underscore the further success of prevention and screening programs.45,46 Compared with the 2003–2007 age-specific results, the projected most common incident cancers in females will be the same within each 10-year age group, but with changes in ranking order for the under-65 and 75–84 age groups. The cancers in the ‘Other’ category, together representing just over one-third of all new cancer cases, will be examined in Chapter 4.
Chapter 4: Projections by Cancer Site
1. Oral cancer
Oral cancers are also referred to as cancers of the buccal cavity and pharynx. In 2003–2007, the average annual number of new oral cancer cases was 2285 in males and 1085 in females (Tables 4.1.1 and 4.1.2), accounting for 2.8% and 1.5% of all male and female cancer cases, respectively. Oral cancer was the ninth most common cancer for males and the fourteenth most common in females in that period. The lifetime risk of developing oral cancer is about 1 in 67 for males and 1 in 137 for females.1 Within oral cancers the percentages of cases in 2007 by subsite were lip (9%), tongue (25%), salivary gland (11%), mouth (19%), naso-pharynx (7%), oropharynx (4%), and other and unspecified (23%).1 The male-to-female ratio of ASIRs in Canada has decreased rapidly, from 3.3:1 in 1983–1987 to 2.4:1 in 2003–2007 for all ages combined (Figure 4.1.1). In 2003–2007, the incidence rates of oral cancer were low for both males and females aged under 45 (Tables 4.1.3 and 4.1.4). Rates increased steeply up to ages 70 to 74 and then rose slowly. The majority of cases (72% in men and 73% in women) occurred in people aged 55 or over (Tables 4.1.1 and 4.1.2). The 5-year relative survival rates for oral cancer diagnosed between 2006 and 2008 were 61% for males and 68% for females.1
TABLE 4.1.1.
Observed (2003–2007) and projected average annual new cases by age and province/territories combined (TC), oral cancer, males, Canada, 2003–2032
| Period | Age | New cases | |||||||||||
|---|---|---|---|---|---|---|---|---|---|---|---|---|---|
| CA | BC | AB | SK | MB | ON | QC | NB | NS | PE | NL | TC | ||
| 2003–07 | <45 | 185 | 25 | 15 | 5 | 5 | 80 | 35 | 5 | 5 | 0 | 5 | 0 |
| 45–54 | 455 | 65 | 45 | 10 | 20 | 180 | 95 | 10 | 15 | 0 | 5 | 0 | |
| 55–64 | 660 | 85 | 45 | 15 | 25 | 250 | 175 | 15 | 25 | 5 | 15 | 0 | |
| 65–74 | 545 | 65 | 45 | 15 | 20 | 200 | 150 | 15 | 20 | 0 | 10 | 0 | |
| 75–84 | 340 | 35 | 20 | 10 | 15 | 145 | 90 | 10 | 10 | 0 | 5 | 0 | |
| 85+ | 100 | 10 | 5 | 5 | 5 | 40 | 25 | 5 | 5 | 0 | 0 | 0 | |
| Total | 2285 | 285 | 180 | 65 | 95 | 895 | 570 | 60 | 80 | 10 | 40 | 5 | |
| 2008–12 | <45 | 180 | 20 | 15 | 5 | 5 | 80 | 30 | 5 | 5 | 0 | 5 | 0 |
| 45–54 | 505 | 70 | 55 | 10 | 15 | 205 | 105 | 10 | 20 | 0 | 5 | 0 | |
| 55–64 | 770 | 100 | 60 | 15 | 30 | 300 | 190 | 20 | 25 | 5 | 10 | 5 | |
| 65–74 | 585 | 65 | 40 | 15 | 20 | 205 | 160 | 15 | 20 | 0 | 10 | 0 | |
| 75–84 | 365 | 40 | 25 | 10 | 15 | 145 | 95 | 10 | 15 | 0 | 5 | 0 | |
| 85+ | 125 | 15 | 5 | 5 | 10 | 45 | 30 | 5 | 5 | 0 | 0 | 0 | |
| Total | 2525 | 310 | 200 | 60 | 95 | 975 | 605 | 60 | 90 | 10 | 40 | 10 | |
| 2013–17 | <45 | 190 | 20 | 15 | 5 | 5 | 80 | 30 | 5 | 5 | 0 | 5 | 0 |
| 45–54 | 485 | 70 | 50 | 5 | 15 | 200 | 100 | 10 | 20 | 0 | 10 | 0 | |
| 55–64 | 890 | 115 | 80 | 15 | 30 | 350 | 205 | 20 | 30 | 5 | 15 | 5 | |
| 65–74 | 715 | 85 | 50 | 15 | 30 | 260 | 185 | 20 | 25 | 5 | 15 | 0 | |
| 75–84 | 355 | 40 | 25 | 10 | 15 | 135 | 95 | 10 | 15 | 0 | 5 | 0 | |
| 85+ | 155 | 15 | 10 | 5 | 5 | 60 | 35 | 5 | 5 | 0 | 0 | 0 | |
| Total | 2795 | 345 | 230 | 55 | 100 | 1085 | 655 | 65 | 100 | 10 | 45 | 10 | |
| 2018–22 | <45 | 215 | 20 | 15 | 5 | 5 | 90 | 30 | 5 | 5 | 0 | 5 | 0 |
| 45–54 | 445 | 60 | 45 | 5 | 10 | 185 | 100 | 10 | 20 | 0 | 5 | 0 | |
| 55–64 | 965 | 130 | 95 | 15 | 30 | 395 | 220 | 20 | 35 | 5 | 15 | 5 | |
| 65–74 | 870 | 105 | 70 | 20 | 35 | 325 | 215 | 25 | 30 | 5 | 15 | 5 | |
| 75–84 | 405 | 45 | 25 | 10 | 15 | 155 | 115 | 10 | 15 | 0 | 5 | 0 | |
| 85+ | 160 | 20 | 10 | 5 | 5 | 65 | 40 | 5 | 5 | 0 | 0 | 0 | |
| Total | 3060 | 380 | 260 | 55 | 105 | 1210 | 720 | 70 | 110 | 10 | 45 | 10 | |
| 2023–27 | <45 | 245 | 25 | 15 | 5 | 5 | 100 | 30 | 5 | 5 | 0 | 5 | 0 |
| 45–54 | 460 | 60 | 45 | 5 | 10 | 195 | 110 | 5 | 15 | 0 | 5 | 0 | |
| 55–64 | 930 | 130 | 95 | 10 | 30 | 395 | 225 | 20 | 40 | 5 | 15 | 5 | |
| 65–74 | 1015 | 125 | 105 | 20 | 35 | 395 | 250 | 30 | 35 | 5 | 15 | 5 | |
| 75–84 | 510 | 60 | 40 | 10 | 20 | 205 | 145 | 15 | 20 | 0 | 10 | 0 | |
| 85+ | 165 | 20 | 10 | 5 | 5 | 65 | 45 | 5 | 5 | 0 | 0 | 0 | |
| Total | 3325 | 415 | 305 | 55 | 110 | 1360 | 800 | 75 | 120 | 10 | 50 | 10 | |
| 2028–32 | <45 | 255 | 25 | 10 | 5 | 5 | 100 | 25 | 5 | 5 | 0 | 5 | 0 |
| 45–54 | 525 | 65 | 45 | 5 | 10 | 235 | 105 | 5 | 15 | 0 | 5 | 0 | |
| 55–64 | 870 | 125 | 90 | 10 | 25 | 375 | 230 | 15 | 35 | 5 | 15 | 5 | |
| 65–74 | 1105 | 145 | 125 | 20 | 40 | 455 | 280 | 30 | 40 | 5 | 20 | 5 | |
| 75–84 | 635 | 75 | 55 | 15 | 25 | 270 | 180 | 20 | 25 | 5 | 10 | 0 | |
| 85+ | 210 | 20 | 15 | 5 | 10 | 85 | 60 | 10 | 5 | 0 | 5 | 0 | |
| Total | 3595 | 450 | 340 | 60 | 115 | 1515 | 880 | 80 | 130 | 10 | 55 | 10 | |
Abbreviations: AB, Alberta; BC, British Columbia; CA, Canada; MB, Manitoba; NB, New Brunswick; NL, Newfoundland and Labrador; NS, Nova Scotia; ON, Ontario; PE, Prince Edward Island; QC, Quebec; SK, Saskatchewan; TC, All Territories (Yukon, Northwest Territories and Nunavut).
Note: Totals may not add up due to rounding.
TABLE 4.1.2.
Observed (2003–2007) and projected average annual new cases by age and province/territories combined (TC), oral cancer, females, Canada, 2003–2032
| Period | Age | New cases | |||||||||||
|---|---|---|---|---|---|---|---|---|---|---|---|---|---|
| CA | BC | AB | SK | MB | ON | QC | NB | NS | PE | NL | TC | ||
| 2003–07 | <45 | 120 | 15 | 10 | 5 | 5 | 55 | 25 | 5 | 0 | 0 | 0 | 0 |
| 45–54 | 170 | 20 | 15 | 5 | 5 | 70 | 40 | 5 | 5 | 0 | 5 | 0 | |
| 55–64 | 230 | 30 | 20 | 5 | 5 | 95 | 60 | 5 | 10 | 0 | 0 | 0 | |
| 65–74 | 240 | 30 | 20 | 5 | 10 | 95 | 65 | 5 | 5 | 0 | 0 | 0 | |
| 75–84 | 220 | 30 | 20 | 10 | 10 | 85 | 50 | 5 | 5 | 0 | 5 | 0 | |
| 85+ | 105 | 15 | 10 | 5 | 5 | 40 | 25 | 0 | 5 | 0 | 0 | 0 | |
| Total | 1085 | 140 | 90 | 30 | 45 | 435 | 260 | 20 | 30 | 5 | 15 | 5 | |
| 2008–12 | <45 | 120 | 15 | 10 | 5 | 5 | 55 | 25 | 0 | 0 | 0 | 0 | 0 |
| 45–54 | 190 | 25 | 15 | 5 | 5 | 80 | 45 | 5 | 5 | 0 | 5 | 0 | |
| 55–64 | 285 | 35 | 25 | 5 | 10 | 115 | 75 | 5 | 10 | 0 | 5 | 0 | |
| 65–74 | 245 | 30 | 20 | 10 | 10 | 95 | 65 | 5 | 10 | 0 | 0 | 0 | |
| 75–84 | 230 | 25 | 20 | 5 | 10 | 90 | 60 | 5 | 5 | 0 | 5 | 0 | |
| 85+ | 125 | 15 | 10 | 5 | 10 | 50 | 35 | 0 | 5 | 0 | 0 | 0 | |
| Total | 1195 | 150 | 100 | 30 | 50 | 480 | 300 | 25 | 35 | 5 | 15 | 5 | |
| 2013–17 | <45 | 125 | 15 | 10 | 5 | 5 | 60 | 30 | 0 | 0 | 0 | 0 | 0 |
| 45–54 | 195 | 30 | 10 | 5 | 5 | 85 | 45 | 5 | 5 | 0 | 5 | 0 | |
| 55–64 | 335 | 40 | 30 | 5 | 10 | 140 | 85 | 5 | 10 | 0 | 5 | 0 | |
| 65–74 | 295 | 35 | 30 | 10 | 15 | 110 | 80 | 5 | 10 | 0 | 5 | 0 | |
| 75–84 | 225 | 25 | 15 | 5 | 10 | 85 | 60 | 5 | 5 | 0 | 5 | 0 | |
| 85+ | 155 | 20 | 15 | 5 | 10 | 55 | 45 | 5 | 5 | 0 | 0 | 0 | |
| Total | 1330 | 160 | 110 | 35 | 55 | 535 | 340 | 25 | 40 | 5 | 15 | 5 | |
| 2018–22 | <45 | 140 | 15 | 10 | 5 | 5 | 65 | 25 | 0 | 0 | 0 | 0 | 0 |
| 45–54 | 180 | 30 | 10 | 5 | 5 | 80 | 45 | 5 | 5 | 0 | 5 | 0 | |
| 55–64 | 375 | 45 | 30 | 5 | 15 | 160 | 90 | 5 | 10 | 0 | 5 | 0 | |
| 65–74 | 365 | 40 | 35 | 10 | 15 | 140 | 100 | 10 | 10 | 0 | 5 | 0 | |
| 75–84 | 240 | 25 | 20 | 10 | 10 | 90 | 65 | 5 | 10 | 0 | 0 | 0 | |
| 85+ | 160 | 20 | 15 | 5 | 10 | 60 | 50 | 5 | 5 | 0 | 0 | 0 | |
| Total | 1465 | 175 | 120 | 35 | 60 | 595 | 375 | 30 | 40 | 5 | 15 | 5 | |
| 2023–27 | <45 | 150 | 15 | 10 | 5 | 5 | 75 | 30 | 0 | 0 | 0 | 0 | 0 |
| 45–54 | 185 | 25 | 10 | 5 | 5 | 80 | 45 | 5 | 5 | 0 | 0 | 0 | |
| 55–64 | 380 | 55 | 25 | 5 | 15 | 165 | 85 | 5 | 10 | 0 | 5 | 0 | |
| 65–74 | 430 | 45 | 40 | 10 | 20 | 175 | 110 | 10 | 15 | 0 | 5 | 0 | |
| 75–84 | 295 | 30 | 30 | 10 | 15 | 110 | 85 | 5 | 10 | 0 | 5 | 0 | |
| 85+ | 165 | 20 | 15 | 5 | 10 | 60 | 50 | 5 | 5 | 0 | 0 | 0 | |
| Total | 1605 | 190 | 130 | 35 | 65 | 660 | 405 | 30 | 45 | 10 | 15 | 10 | |
| 2028–32 | <45 | 155 | 15 | 10 | 5 | 5 | 85 | 30 | 0 | 0 | 0 | 0 | 0 |
| 45–54 | 210 | 25 | 10 | 5 | 5 | 85 | 45 | 5 | 5 | 0 | 0 | 0 | |
| 55–64 | 355 | 50 | 20 | 5 | 10 | 155 | 85 | 5 | 10 | 0 | 5 | 0 | |
| 65–74 | 480 | 55 | 40 | 10 | 20 | 200 | 120 | 10 | 15 | 0 | 5 | 0 | |
| 75–84 | 370 | 40 | 35 | 10 | 20 | 145 | 100 | 10 | 15 | 0 | 5 | 0 | |
| 85+ | 185 | 20 | 20 | 5 | 10 | 65 | 55 | 5 | 10 | 0 | 0 | 0 | |
| Total | 1760 | 205 | 140 | 40 | 70 | 735 | 435 | 35 | 50 | 10 | 15 | 10 | |
Abbreviations: AB, Alberta; BC, British Columbia; CA, Canada; MB, Manitoba; NB, New Brunswick; NL, Newfoundland and Labrador; NS, Nova Scotia; ON, Ontario; PE, Prince Edward Island; QC, Quebec; SK, Saskatchewan; TC, All Territories (Yukon, Northwest Territories and Nunavut).
Note: Totals may not add up due to rounding.
FIGURE 4.1.1. Age-standardized incidence rates (ASIRs) by region, oral cancer, 1983–2032.

TABLE 4.1.3.
Observed (2003–2007) and projected age-standardized incidence rates (ASIRs) by age and province/territories combined (TC), oral cancer, males, Canada, 2003–2032
| Period | Age | ASIRs | |||||||||||
|---|---|---|---|---|---|---|---|---|---|---|---|---|---|
| CA | BC | AB | SK | MB | ON | QC | NB | NS | PE | NL | TC | ||
| 2003–07 | <45 | 1.7 | 1.7 | 1.4 | 1.5 | 1.5 | 1.9 | 1.5 | 1.6 | 2.3 | 1.2 | 2.8 | 3.7 |
| 45–54 | 18.3 | 19.1 | 18.3 | 15.8 | 20.8 | 19.6 | 15.7 | 16.9 | 22.9 | 11.8 | 16.4 | 22.9 | |
| 55–64 | 38.3 | 35.8 | 29.5 | 33.4 | 44.9 | 39.3 | 40.4 | 33.0 | 43.1 | 39.9 | 40.2 | 53.2 | |
| 65–74 | 50.8 | 43.0 | 48.2 | 49.9 | 53.7 | 49.0 | 56.0 | 63.5 | 58.5 | 35.7 | 56.4 | 68.8 | |
| 75–84 | 54.6 | 38.7 | 41.5 | 41.9 | 70.8 | 59.5 | 61.6 | 59.2 | 52.8 | 43.8 | 33.4 | 93.9 | |
| 85+ | 66.4 | 48.0 | 54.1 | 66.5 | 80.7 | 68.0 | 74.1 | 106.9 | 59.6 | 79.7 | 80.4 | 0.0 | |
| Total | 12.6 | 11.2 | 10.8 | 11.2 | 14.2 | 13.0 | 13.0 | 13.3 | 14.3 | 10.4 | 13.0 | 17.6 | |
| 2008–12 | <45 | 1.8 | 1.6 | 1.2 | 1.0 | 1.1 | 1.9 | 1.3 | 1.4 | 2.1 | 1.5 | 2.9 | 2.5 |
| 45–54 | 18.3 | 19.3 | 17.9 | 11.5 | 17.4 | 19.2 | 15.9 | 16.5 | 24.7 | 18.5 | 17.7 | 26.1 | |
| 55–64 | 37.2 | 33.7 | 30.2 | 25.0 | 41.7 | 38.8 | 37.0 | 34.1 | 41.2 | 30.2 | 31.1 | 53.0 | |
| 65–74 | 47.0 | 37.5 | 38.4 | 42.2 | 51.5 | 44.4 | 50.2 | 50.4 | 50.7 | 37.2 | 48.2 | 66.9 | |
| 75–84 | 52.0 | 40.5 | 40.9 | 43.6 | 61.6 | 53.1 | 56.7 | 58.4 | 65.3 | 47.1 | 47.5 | 74.2 | |
| 85+ | 58.5 | 41.7 | 42.0 | 58.4 | 88.1 | 57.9 | 60.3 | 86.0 | 61.7 | 54.0 | 80.8 | 83.3 | |
| Total | 12.1 | 10.5 | 9.9 | 9.2 | 12.9 | 12.3 | 11.9 | 12.1 | 14.1 | 10.4 | 12.4 | 17.2 | |
| 2013–17 | <45 | 1.9 | 1.5 | 1.1 | 1.0 | 1.0 | 2.0 | 1.3 | 1.3 | 2.0 | 1.5 | 2.8 | 2.6 |
| 45–54 | 17.7 | 18.4 | 16.2 | 8.8 | 15.4 | 18.3 | 16.1 | 15.5 | 27.7 | 18.5 | 18.9 | 25.2 | |
| 55–64 | 37.6 | 35.3 | 33.4 | 23.5 | 38.1 | 39.1 | 36.2 | 35.2 | 43.7 | 27.9 | 31.7 | 53.6 | |
| 65–74 | 45.9 | 36.9 | 36.4 | 37.2 | 53.8 | 44.6 | 47.3 | 45.6 | 48.6 | 35.9 | 47.2 | 65.3 | |
| 75–84 | 46.2 | 34.8 | 36.3 | 35.8 | 51.3 | 46.4 | 51.9 | 53.0 | 59.2 | 36.9 | 36.7 | 65.9 | |
| 85+ | 57.1 | 40.8 | 37.2 | 52.3 | 72.7 | 58.3 | 58.2 | 82.2 | 67.1 | 65.9 | 68.2 | 81.4 | |
| Total | 11.8 | 10.3 | 9.5 | 8.0 | 11.9 | 12.0 | 11.5 | 11.5 | 14.3 | 9.9 | 11.9 | 16.8 | |
| 2018–22 | <45 | 2.0 | 1.4 | 1.0 | 0.9 | 1.0 | 2.1 | 1.1 | 1.3 | 2.0 | 1.5 | 2.7 | 2.9 |
| 45–54 | 17.5 | 17.4 | 15.3 | 7.9 | 14.1 | 18.0 | 17.8 | 14.4 | 28.1 | 18.5 | 18.1 | 25.0 | |
| 55–64 | 37.0 | 37.1 | 35.3 | 20.4 | 35.9 | 38.8 | 36.2 | 32.2 | 49.6 | 26.5 | 36.8 | 52.7 | |
| 65–74 | 46.1 | 37.7 | 39.4 | 34.6 | 52.2 | 46.2 | 47.6 | 49.6 | 49.8 | 32.6 | 43.1 | 65.6 | |
| 75–84 | 43.5 | 32.1 | 33.7 | 33.7 | 49.9 | 43.8 | 50.2 | 50.5 | 55.4 | 39.9 | 37.2 | 61.9 | |
| 85+ | 50.9 | 37.1 | 33.5 | 47.0 | 68.2 | 50.0 | 56.2 | 77.8 | 59.5 | 48.1 | 59.4 | 72.5 | |
| Total | 11.7 | 10.2 | 9.6 | 7.3 | 11.3 | 12.0 | 11.4 | 11.2 | 14.7 | 9.4 | 11.9 | 16.6 | |
| 2023–27 | <45 | 2.1 | 1.4 | 0.9 | 0.9 | 1.0 | 2.1 | 1.1 | 1.3 | 2.0 | 1.5 | 2.7 | 3.0 |
| 45–54 | 18.1 | 16.9 | 14.7 | 7.5 | 13.7 | 19.7 | 19.1 | 13.9 | 27.9 | 18.5 | 17.7 | 25.8 | |
| 55–64 | 36.0 | 36.4 | 34.9 | 17.8 | 33.8 | 38.4 | 38.5 | 32.2 | 55.4 | 25.8 | 40.3 | 51.3 | |
| 65–74 | 46.6 | 40.7 | 46.6 | 35.3 | 50.2 | 47.9 | 48.6 | 52.3 | 53.5 | 31.0 | 45.8 | 66.3 | |
| 75–84 | 42.5 | 32.5 | 34.7 | 31.7 | 54.2 | 45.5 | 49.8 | 48.0 | 53.9 | 42.9 | 36.6 | 60.6 | |
| 85+ | 45.3 | 31.6 | 32.2 | 40.6 | 55.5 | 46.1 | 53.2 | 74.4 | 55.6 | 46.6 | 45.3 | 64.5 | |
| Total | 11.7 | 10.2 | 10.0 | 6.9 | 11.0 | 12.3 | 11.8 | 11.2 | 15.3 | 9.4 | 12.1 | 16.7 | |
| 2028–32 | <45 | 2.2 | 1.4 | 0.9 | 0.9 | 0.9 | 2.0 | 1.0 | 1.2 | 2.0 | 1.5 | 2.7 | 3.1 |
| 45–54 | 19.6 | 16.4 | 14.1 | 7.1 | 13.3 | 22.4 | 17.2 | 13.4 | 27.7 | 18.5 | 17.3 | 28.0 | |
| 55–64 | 35.7 | 35.1 | 34.3 | 17.0 | 32.2 | 38.4 | 43.2 | 31.3 | 56.4 | 25.2 | 39.5 | 50.9 | |
| 65–74 | 45.7 | 42.7 | 50.1 | 31.8 | 48.4 | 47.9 | 50.4 | 50.1 | 61.5 | 29.5 | 53.8 | 65.1 | |
| 75–84 | 42.9 | 33.6 | 39.3 | 31.1 | 53.4 | 47.8 | 51.7 | 55.2 | 55.5 | 40.9 | 34.3 | 61.1 | |
| 85+ | 44.2 | 31.2 | 31.0 | 43.4 | 63.4 | 45.3 | 54.5 | 74.2 | 52.5 | 58.4 | 55.8 | 62.9 | |
| Total | 11.8 | 10.2 | 10.2 | 6.6 | 10.7 | 12.6 | 12.2 | 11.1 | 15.9 | 9.3 | 12.6 | 16.8 | |
Abbreviations: AB, Alberta; BC, British Columbia; CA, Canada; MB, Manitoba; NB, New Brunswick; NL, Newfoundland and Labrador; NS, Nova Scotia; ON, Ontario; PE, Prince Edward Island; QC, Quebec; SK, Saskatchewan; TC, All Territories (Yukon, Northwest Territories and Nunavut).
TABLE 4.1.4.
Observed (2003–2007) and projected age-standardized incidence rates (ASIRs) by age and province/territories combined (TC), oral cancer, females, Canada, 2003–2032
| Period | Age | ASIRs | |||||||||||
|---|---|---|---|---|---|---|---|---|---|---|---|---|---|
| CA | BC | AB | SK | MB | ON | QC | NB | NS | PE | NL | TC | ||
| 2003–07 | <45 | 1.2 | 1.2 | 0.9 | 1.2 | 1.1 | 1.3 | 1.0 | 1.1 | 0.6 | 0.4 | 1.4 | 2.2 |
| 45–54 | 6.8 | 6.3 | 6.7 | 6.1 | 6.9 | 7.3 | 6.5 | 6.8 | 6.8 | 7.5 | 6.7 | 14.0 | |
| 55–64 | 13.1 | 12.4 | 13.0 | 9.8 | 11.3 | 14.2 | 13.0 | 8.4 | 14.2 | 16.1 | 6.0 | 34.7 | |
| 65–74 | 20.0 | 17.5 | 18.9 | 19.5 | 26.6 | 20.5 | 20.7 | 18.2 | 16.9 | 29.8 | 12.2 | 68.2 | |
| 75–84 | 25.2 | 24.5 | 27.0 | 26.2 | 35.9 | 25.5 | 23.4 | 18.2 | 26.1 | 30.7 | 23.6 | 0.0 | |
| 85+ | 30.8 | 30.4 | 35.7 | 24.2 | 41.2 | 31.5 | 29.5 | 25.2 | 25.5 | 32.2 | 23.5 | 0.0 | |
| Total | 5.2 | 5.0 | 5.1 | 4.8 | 6.0 | 5.5 | 5.1 | 4.4 | 4.7 | 5.9 | 4.1 | 10.7 | |
| 2008–12 | <45 | 1.2 | 1.2 | 0.8 | 1.1 | 1.1 | 1.4 | 1.2 | 0.9 | 0.7 | 1.4 | 1.2 | 2.4 |
| 45–54 | 7.0 | 7.1 | 5.2 | 6.1 | 6.6 | 7.6 | 7.0 | 6.2 | 6.1 | 7.8 | 6.8 | 14.1 | |
| 55–64 | 13.3 | 12.0 | 12.9 | 9.8 | 15.0 | 14.2 | 13.6 | 9.3 | 11.9 | 14.9 | 8.2 | 26.9 | |
| 65–74 | 18.1 | 15.5 | 19.7 | 20.8 | 24.0 | 18.1 | 18.5 | 14.9 | 20.4 | 20.3 | 9.3 | 36.7 | |
| 75–84 | 25.0 | 21.5 | 23.9 | 21.4 | 32.5 | 25.3 | 26.3 | 23.6 | 24.3 | 28.1 | 21.1 | 50.7 | |
| 85+ | 29.1 | 25.5 | 34.8 | 20.1 | 41.7 | 28.8 | 31.3 | 19.0 | 27.5 | 32.7 | 20.9 | 58.9 | |
| Total | 5.2 | 4.7 | 4.8 | 4.6 | 6.0 | 5.4 | 5.3 | 4.1 | 4.7 | 5.8 | 3.9 | 10.4 | |
| 2013–17 | <45 | 1.3 | 1.0 | 0.8 | 1.1 | 1.1 | 1.4 | 1.3 | 0.9 | 0.7 | 1.4 | 1.2 | 2.5 |
| 45–54 | 7.2 | 8.6 | 4.2 | 6.1 | 6.6 | 7.6 | 7.3 | 6.1 | 6.1 | 8.1 | 6.8 | 14.6 | |
| 55–64 | 13.8 | 11.3 | 12.5 | 9.3 | 15.0 | 15.1 | 14.3 | 9.1 | 12.1 | 15.5 | 8.6 | 27.9 | |
| 65–74 | 17.5 | 14.6 | 19.1 | 17.6 | 24.0 | 17.4 | 18.8 | 14.7 | 21.0 | 19.6 | 8.2 | 35.3 | |
| 75–84 | 23.1 | 18.8 | 22.1 | 23.8 | 32.6 | 23.1 | 25.1 | 22.7 | 23.9 | 26.0 | 17.1 | 46.8 | |
| 85+ | 30.7 | 26.8 | 35.8 | 20.3 | 41.8 | 29.5 | 34.2 | 28.2 | 26.9 | 34.4 | 28.5 | 62.1 | |
| Total | 5.2 | 4.5 | 4.5 | 4.5 | 6.0 | 5.4 | 5.4 | 4.1 | 4.8 | 5.8 | 3.8 | 10.4 | |
| 2018–22 | <45 | 1.3 | 1.0 | 0.8 | 1.1 | 1.1 | 1.5 | 1.2 | 0.9 | 0.7 | 1.5 | 1.2 | 2.7 |
| 45–54 | 7.2 | 7.8 | 3.6 | 6.1 | 6.7 | 7.6 | 8.5 | 6.1 | 6.1 | 8.1 | 6.8 | 14.6 | |
| 55–64 | 14.1 | 12.4 | 10.8 | 9.1 | 15.0 | 15.5 | 14.8 | 9.0 | 12.3 | 15.8 | 8.9 | 28.5 | |
| 65–74 | 17.9 | 14.0 | 18.9 | 16.2 | 24.1 | 18.3 | 19.8 | 16.1 | 18.0 | 20.1 | 10.1 | 36.3 | |
| 75–84 | 21.5 | 16.4 | 22.8 | 24.2 | 32.7 | 21.1 | 23.7 | 19.6 | 27.4 | 24.1 | 12.5 | 43.5 | |
| 85+ | 28.7 | 25.2 | 28.9 | 19.3 | 41.9 | 26.7 | 34.8 | 26.4 | 30.6 | 32.2 | 19.1 | 58.0 | |
| Total | 5.2 | 4.4 | 4.3 | 4.3 | 6.0 | 5.5 | 5.5 | 4.1 | 4.7 | 5.8 | 3.7 | 10.5 | |
| 2023–27 | <45 | 1.3 | 1.0 | 0.8 | 1.1 | 1.1 | 1.6 | 1.2 | 0.9 | 0.7 | 1.5 | 1.2 | 2.7 |
| 45–54 | 7.4 | 6.5 | 3.6 | 6.1 | 6.7 | 7.8 | 8.7 | 6.1 | 6.1 | 8.3 | 6.8 | 15.0 | |
| 55–64 | 14.5 | 14.9 | 9.1 | 8.9 | 15.1 | 15.6 | 14.9 | 9.0 | 12.3 | 16.3 | 9.0 | 29.3 | |
| 65–74 | 18.5 | 13.3 | 18.2 | 16.0 | 24.1 | 19.4 | 20.1 | 15.9 | 18.1 | 20.7 | 10.3 | 37.4 | |
| 75–84 | 20.8 | 15.6 | 21.9 | 21.1 | 32.7 | 20.5 | 23.8 | 20.7 | 26.2 | 23.4 | 11.8 | 42.1 | |
| 85+ | 26.4 | 21.0 | 29.6 | 24.9 | 41.9 | 24.7 | 31.3 | 26.0 | 27.1 | 29.6 | 17.7 | 53.3 | |
| Total | 5.2 | 4.4 | 4.0 | 4.3 | 6.0 | 5.6 | 5.6 | 4.1 | 4.7 | 5.9 | 3.6 | 10.6 | |
| 2028–32 | <45 | 1.3 | 1.0 | 0.8 | 1.1 | 1.1 | 1.8 | 1.2 | 0.9 | 0.7 | 1.5 | 1.2 | 2.7 |
| 45–54 | 7.8 | 6.4 | 3.5 | 6.1 | 6.7 | 7.8 | 7.4 | 6.1 | 6.1 | 8.8 | 6.8 | 15.8 | |
| 55–64 | 14.5 | 13.9 | 7.9 | 8.8 | 15.1 | 15.6 | 16.8 | 9.0 | 12.4 | 16.2 | 9.2 | 29.3 | |
| 65–74 | 18.9 | 15.0 | 15.9 | 15.8 | 24.2 | 19.8 | 20.7 | 15.9 | 18.2 | 21.3 | 10.4 | 38.3 | |
| 75–84 | 21.5 | 15.0 | 22.2 | 19.8 | 32.8 | 21.6 | 24.6 | 21.9 | 23.3 | 24.1 | 13.7 | 43.5 | |
| 85+ | 24.8 | 19.3 | 30.9 | 21.7 | 42.0 | 22.6 | 30.0 | 20.9 | 36.0 | 27.8 | 9.9 | 50.1 | |
| Total | 5.3 | 4.4 | 3.8 | 4.1 | 6.1 | 5.8 | 5.7 | 4.1 | 4.7 | 6.0 | 3.7 | 10.8 | |
Abbreviations: AB, Alberta; BC, British Columbia; CA, Canada; MB, Manitoba; NB, New Brunswick; NL, Newfoundland and Labrador; NS, Nova Scotia; ON, Ontario; PE, Prince Edward Island; QC, Quebec; SK, Saskatchewan; TC, All Territories (Yukon, Northwest Territories and Nunavut).
In males, incidence rates of oral cancers have decreased over the observation period, falling from 18.8 per 100 000 in 1983–1987 to 12.6 in 2003–2007 (Figure 4.1.1). The decreased trends accelerated with age in males (Figure 4.1.2). Across the country, the largest decrease was observed in the Prairies. Rates of oral cancers have decreased marginally in females.
FIGURE 4.1.2. Age-standardized incidence rates (ASIRs) for oral cancer by age group (– males, – females), Canada, 1983–2032.

From 1998 to 2007, the ASIRs for oral cancers have significantly decreased by 1.0% per year in males and have remained relatively static in females (Figures 3.1 and 3.2). The trend pattern by sex is similar for all age groups except in the group younger than 45 (Figure 4.1.2).
The ASIRs for oral cancer in Canadian males are projected to continue to fall in all age groups above 45, but beginning to increase after 15 years for the group aged between 45 and 54 (Figure 4.1.2). However, the projections in the young age groups may be affected by random error from the small number of cases in these age ranges. The rates in females will remain stable in each age group (Figure 4.1.2). Oral cancer rates will continue to be significantly higher for males than for females, but the male-to-female ratio will decrease to 2.2:1 in 2028–2032.
Figure 4.1.1 illustrates the inter-regional variation of ASIRs for oral cancer. The predictions indicate that the rates of oral cancer in males will continue to gradually decrease and then stabilize in all regions. The rates in the Prairies will have dropped from being the highest in the country in 1983–1987 to the lowest as of 2008–2012. In females, the rates are projected to decrease in British Columbia and, to a lesser extent, in the Prairies, but are likely to increase in the Atlantic region and Quebec, and remain stable in Ontario. The ASIRs for females will be 4.4 per 100 000 in British Columbia and 4.9–5.8 per 100 000 in the other regions by 2028–2032. In general, the incidence rates are projected to be higher in eastern Canada than in western Canada.
From 2003–2007 to 2028–2032, ASIRs for Canada are predicted to decrease by 6% in males, from 12.6 to 11.8 per 100 000, and to remain stable in females, changing only from 5.2 to 5.3 per 100 000 (Tables 4.1.3 and 4.1.4). Due to the projected Canada population growth and aging, the annual number of cases is estimated to increase by 57% in males, from 2285 to 3595, and by 62% in females, from 1085 to 1760 (Tables 4.1.1 and 4.1.2).
Comments
The major risk factors for oral cancer (except salivary gland, nasopharyngeal and lip cancers) are tobacco and alcohol use.47–50 In 2011, the age-standardized prevalence of current smoking in Canadians aged 12 or older was 23.0% for males and 17.9% for females, with crude rates of 22.3% and 17.5%, respectively.51 A decrease in smoking prevalence began in the mid-1960s in males and in the mid-1980s in females.42,43 The decrease in smoking likely accounts for the downward trends in male oral cancer incidence. For females, the impact of decrease in smoking is largely not yet reflected in the incidence data used for the projections, given the lag of at least 20 years between the fall in smoking rates and the decrease in oral cancer incidence rates. It is likely that incidence rates in females will begin to drop as well over the longer term.
Human papilloma virus (HPV), particularly HPV type 16, is a risk factor for orophar-yngeal cancer, and Epstein-Barr virus (EBV) is a risk factor for nasopharyngeal cancer.52,53 Oropharynx cancer is increasing in incidence in Canada,54,55 with a decreasing age at diagnosis.55 This increase has also been reported in the United States (US),56 Denmark57 and Korea,58 where HPV-unrelated oral cancers have decreased. A change in sexual behaviour that increases oral exposure to HPV may be one reason for the rise in HPV-associated oral cancers.54 Since the fall of 2008, all provinces and territories have introduced HPV immunization programs for girls into their routine immunization schedules (see more in Section 11).59 The vaccination coverage has increased significantly in Ontario since the program was initiated in the 2007.60 HPV vaccination and the upward trend in coverage may cause a decrease in rates of HPV-associated oral cancers in the future. The contributions of other risk factors for oral cancers, including diet and sun exposure (linked to lip cancer), are unclear.
2. Esophagus cancer
Esophageal cancer is infrequent but very malignant. The average annual number of new esophageal cancer cases in 2003–2007 was 1095 in males and 385 in females (Tables 4.2.1 and 4.2.2), constituting 1.4% and 0.5% of all male and female cancer cases, respectively. From 1983–1987 to 2003–2007, the ASIRs of esophageal cancer in Canada increased by 6.9% in males, from 5.8 to 6.2 per 100 000, and decreased by 10.5% in females, from 1.9 to 1.7 per 100 000 (Figure 4.2.1). In recent years, the ASIRs have remained relatively stable (Figures 3.1 and 3.2). The distribution of morphology in Canada in 2002–2006 for adenocarcinoma, squamous cell carcinoma, and other and unknown types was 56%, 30% and 14% in males and 28%, 53% and 19% in females, respectively.61 Survival is poor, with a 5-year relative survival rate of 14% in 2006–2008.1
TABLE 4.2.1.
Observed (2003–2007) and projected average annual new cases by age and province/territories combined (TC), esophagus cancer, males, Canada, 2003–2032
| Period | Age | New cases | |||||||||||
|---|---|---|---|---|---|---|---|---|---|---|---|---|---|
| CA | BC | AB | SK | MB | ON | QC | NB | NS | PE | NL | TC | ||
| 2003–07 | <45 | 30 | 5 | 0 | 0 | 0 | 15 | 5 | 0 | 0 | 0 | 0 | 0 |
| 45–54 | 130 | 15 | 20 | 5 | 5 | 50 | 30 | 5 | 5 | 0 | 5 | 0 | |
| 55–64 | 280 | 40 | 25 | 5 | 10 | 105 | 70 | 5 | 15 | 0 | 5 | 0 | |
| 65–74 | 320 | 45 | 25 | 5 | 10 | 120 | 80 | 10 | 15 | 0 | 5 | 0 | |
| 75–84 | 265 | 40 | 20 | 10 | 10 | 100 | 55 | 10 | 10 | 0 | 5 | 0 | |
| 85+ | 65 | 10 | 5 | 0 | 5 | 25 | 15 | 0 | 5 | 0 | 0 | 0 | |
| Total | 1095 | 155 | 100 | 30 | 35 | 415 | 255 | 30 | 45 | 5 | 20 | 0 | |
| 2008–12 | <45 | 35 | 5 | 0 | 0 | 0 | 15 | 5 | 0 | 0 | 0 | 0 | 0 |
| 45–54 | 155 | 20 | 20 | 5 | 5 | 65 | 30 | 5 | 5 | 0 | 0 | 0 | |
| 55–64 | 345 | 45 | 40 | 10 | 10 | 125 | 80 | 10 | 15 | 0 | 5 | 0 | |
| 65–74 | 370 | 50 | 35 | 5 | 10 | 130 | 95 | 10 | 15 | 5 | 5 | 0 | |
| 75–84 | 290 | 45 | 25 | 10 | 10 | 110 | 60 | 10 | 10 | 0 | 5 | 0 | |
| 85+ | 100 | 15 | 10 | 5 | 5 | 40 | 20 | 0 | 5 | 0 | 0 | 0 | |
| Total | 1290 | 180 | 135 | 35 | 40 | 485 | 295 | 40 | 55 | 5 | 20 | 5 | |
| 2013–17 | <45 | 35 | 5 | 0 | 0 | 0 | 15 | 5 | 0 | 0 | 0 | 0 | 0 |
| 45–54 | 155 | 20 | 25 | 5 | 5 | 70 | 30 | 5 | 5 | 0 | 0 | 0 | |
| 55–64 | 405 | 55 | 60 | 10 | 15 | 150 | 95 | 15 | 15 | 0 | 5 | 0 | |
| 65–74 | 460 | 70 | 45 | 10 | 15 | 160 | 120 | 15 | 25 | 0 | 10 | 0 | |
| 75–84 | 305 | 45 | 30 | 10 | 10 | 115 | 65 | 10 | 15 | 0 | 5 | 0 | |
| 85+ | 125 | 20 | 15 | 5 | 5 | 50 | 25 | 5 | 5 | 0 | 0 | 0 | |
| Total | 1490 | 210 | 170 | 35 | 45 | 560 | 345 | 45 | 60 | 10 | 20 | 5 | |
| 2018–22 | <45 | 40 | 5 | 0 | 0 | 0 | 15 | 5 | 0 | 0 | 0 | 0 | 0 |
| 45–54 | 155 | 20 | 25 | 5 | 5 | 70 | 25 | 5 | 5 | 0 | 0 | 0 | |
| 55–64 | 440 | 55 | 65 | 10 | 15 | 175 | 105 | 15 | 15 | 5 | 5 | 0 | |
| 65–74 | 560 | 85 | 65 | 10 | 15 | 195 | 145 | 20 | 25 | 0 | 10 | 0 | |
| 75–84 | 355 | 55 | 30 | 10 | 10 | 125 | 85 | 15 | 15 | 0 | 5 | 0 | |
| 85+ | 140 | 25 | 15 | 5 | 5 | 55 | 30 | 5 | 5 | 0 | 0 | 0 | |
| Total | 1690 | 240 | 200 | 40 | 55 | 640 | 395 | 50 | 65 | 10 | 25 | 5 | |
| 2023–27 | <45 | 40 | 5 | 0 | 0 | 0 | 20 | 5 | 0 | 0 | 0 | 0 | 0 |
| 45–54 | 160 | 20 | 25 | 5 | 5 | 70 | 25 | 5 | 5 | 0 | 0 | 0 | |
| 55–64 | 435 | 60 | 65 | 10 | 15 | 185 | 100 | 15 | 15 | 5 | 5 | 0 | |
| 65–74 | 655 | 95 | 85 | 15 | 20 | 240 | 170 | 20 | 25 | 0 | 10 | 0 | |
| 75–84 | 450 | 70 | 40 | 10 | 15 | 160 | 110 | 15 | 20 | 0 | 10 | 0 | |
| 85+ | 155 | 25 | 15 | 5 | 5 | 60 | 35 | 5 | 5 | 0 | 0 | 0 | |
| Total | 1900 | 275 | 235 | 45 | 60 | 730 | 445 | 55 | 75 | 10 | 30 | 5 | |
| 2028–32 | <45 | 40 | 5 | 0 | 0 | 0 | 20 | 5 | 0 | 0 | 0 | 0 | 0 |
| 45–54 | 170 | 20 | 25 | 5 | 5 | 70 | 30 | 5 | 5 | 0 | 0 | 0 | |
| 55–64 | 440 | 60 | 65 | 10 | 15 | 185 | 90 | 10 | 15 | 5 | 5 | 0 | |
| 65–74 | 710 | 105 | 95 | 15 | 20 | 280 | 185 | 20 | 25 | 5 | 10 | 0 | |
| 75–84 | 555 | 90 | 60 | 15 | 15 | 200 | 130 | 20 | 25 | 0 | 10 | 0 | |
| 85+ | 195 | 35 | 15 | 5 | 5 | 70 | 50 | 5 | 10 | 0 | 5 | 0 | |
| Total | 2110 | 315 | 265 | 50 | 65 | 825 | 495 | 60 | 75 | 10 | 35 | 5 | |
Abbreviations: AB, Alberta; BC, British Columbia; CA, Canada; MB, Manitoba; NB, New Brunswick; NL, Newfoundland and Labrador; NS, Nova Scotia; ON, Ontario; PE, Prince Edward Island; QC, Quebec; SK, Saskatchewan; TC, All Territories (Yukon, Northwest Territories and Nunavut).
Note: Totals may not add up due to rounding.
TABLE 4.2.2.
Observed (2003–2007) and projected average annual new cases by age and province/territories combined (TC), esophagus cancer, females, Canada, 2003–2032
| Period | Age | New cases | |||||||||||
|---|---|---|---|---|---|---|---|---|---|---|---|---|---|
| CA | BC | AB | SK | MB | ON | QC | NB | NS | PE | NL | TC | ||
| 2003–07 | <45 | 10 | 0 | 0 | 0 | 0 | 5 | 0 | 0 | 0 | 0 | 0 | 0 |
| 45–54 | 25 | 5 | 0 | 0 | 0 | 10 | 5 | 0 | 0 | 0 | 0 | 0 | |
| 55–64 | 65 | 10 | 5 | 0 | 0 | 25 | 15 | 0 | 0 | 0 | 0 | 0 | |
| 65–74 | 100 | 20 | 10 | 5 | 5 | 40 | 20 | 5 | 5 | 0 | 0 | 0 | |
| 75–84 | 120 | 20 | 5 | 5 | 5 | 50 | 25 | 5 | 5 | 0 | 0 | 0 | |
| 85+ | 70 | 10 | 5 | 5 | 5 | 25 | 10 | 0 | 5 | 0 | 0 | 0 | |
| Total | 385 | 70 | 30 | 10 | 10 | 150 | 80 | 10 | 15 | 0 | 5 | 0 | |
| 2008–12 | <45 | 5 | 0 | 0 | 0 | 0 | 5 | 0 | 0 | 0 | 0 | 0 | 0 |
| 45–54 | 30 | 5 | 0 | 0 | 0 | 10 | 5 | 0 | 0 | 0 | 0 | 0 | |
| 55–64 | 75 | 15 | 5 | 5 | 0 | 25 | 20 | 0 | 5 | 0 | 0 | 0 | |
| 65–74 | 100 | 20 | 10 | 5 | 5 | 40 | 20 | 5 | 5 | 0 | 0 | 0 | |
| 75–84 | 125 | 20 | 10 | 5 | 5 | 50 | 25 | 5 | 5 | 0 | 0 | 0 | |
| 85+ | 90 | 15 | 10 | 5 | 5 | 35 | 20 | 5 | 5 | 0 | 0 | 0 | |
| Total | 430 | 80 | 35 | 15 | 15 | 165 | 90 | 10 | 15 | 0 | 5 | 0 | |
| 2013–17 | <45 | 5 | 0 | 0 | 0 | 0 | 5 | 0 | 0 | 0 | 0 | 0 | 0 |
| 45–54 | 35 | 5 | 0 | 0 | 0 | 10 | 5 | 0 | 0 | 0 | 0 | 0 | |
| 55–64 | 85 | 20 | 10 | 5 | 0 | 30 | 20 | 0 | 5 | 0 | 0 | 0 | |
| 65–74 | 125 | 20 | 10 | 5 | 5 | 50 | 25 | 5 | 5 | 0 | 0 | 0 | |
| 75–84 | 130 | 30 | 10 | 5 | 5 | 50 | 25 | 5 | 5 | 0 | 0 | 0 | |
| 85+ | 100 | 15 | 10 | 5 | 5 | 40 | 20 | 5 | 5 | 0 | 0 | 0 | |
| Total | 480 | 90 | 45 | 15 | 15 | 180 | 95 | 15 | 15 | 0 | 5 | 0 | |
| 2018–22 | <45 | 10 | 0 | 0 | 0 | 0 | 5 | 0 | 0 | 0 | 0 | 0 | 0 |
| 45–54 | 30 | 5 | 0 | 0 | 0 | 10 | 5 | 0 | 0 | 0 | 0 | 0 | |
| 55–64 | 100 | 20 | 10 | 5 | 0 | 30 | 15 | 0 | 5 | 0 | 0 | 0 | |
| 65–74 | 150 | 25 | 20 | 5 | 5 | 55 | 35 | 5 | 5 | 0 | 0 | 0 | |
| 75–84 | 140 | 35 | 10 | 5 | 5 | 55 | 25 | 5 | 5 | 0 | 0 | 0 | |
| 85+ | 115 | 20 | 15 | 5 | 5 | 45 | 20 | 5 | 5 | 0 | 0 | 0 | |
| Total | 540 | 105 | 60 | 15 | 15 | 195 | 105 | 15 | 20 | 5 | 10 | 0 | |
| 2023–27 | <45 | 10 | 0 | 0 | 0 | 0 | 5 | 0 | 0 | 0 | 0 | 0 | 0 |
| 45–54 | 30 | 5 | 0 | 0 | 0 | 10 | 5 | 0 | 0 | 0 | 0 | 0 | |
| 55–64 | 105 | 20 | 15 | 5 | 0 | 30 | 15 | 0 | 5 | 0 | 0 | 0 | |
| 65–74 | 170 | 35 | 25 | 5 | 5 | 60 | 35 | 0 | 5 | 0 | 5 | 0 | |
| 75–84 | 175 | 35 | 15 | 5 | 5 | 65 | 35 | 10 | 5 | 0 | 5 | 0 | |
| 85+ | 115 | 25 | 15 | 5 | 5 | 40 | 20 | 5 | 5 | 0 | 0 | 0 | |
| Total | 605 | 125 | 75 | 20 | 10 | 210 | 110 | 15 | 20 | 5 | 10 | 0 | |
| 2028–32 | <45 | 10 | 0 | 0 | 0 | 0 | 5 | 0 | 0 | 0 | 0 | 0 | 0 |
| 45–54 | 35 | 5 | 5 | 0 | 0 | 10 | 5 | 0 | 0 | 0 | 0 | 0 | |
| 55–64 | 100 | 20 | 15 | 5 | 0 | 30 | 15 | 0 | 5 | 0 | 0 | 0 | |
| 65–74 | 195 | 40 | 30 | 5 | 5 | 65 | 30 | 0 | 5 | 0 | 5 | 0 | |
| 75–84 | 210 | 45 | 25 | 5 | 5 | 75 | 45 | 10 | 5 | 0 | 5 | 0 | |
| 85+ | 140 | 25 | 20 | 5 | 5 | 55 | 30 | 5 | 5 | 0 | 0 | 0 | |
| Total | 690 | 140 | 90 | 20 | 15 | 235 | 120 | 15 | 20 | 5 | 10 | 0 | |
Abbreviations: AB, Alberta; BC, British Columbia; CA, Canada; MB, Manitoba; NB, New Brunswick; NL, Newfoundland and Labrador; NS, Nova Scotia; ON, Ontario; PE, Prince Edward Island; QC, Quebec; SK, Saskatchewan; TC, All Territories (Yukon, Northwest Territories and Nunavut).
Note: Totals may not add up due to rounding.
FIGURE 4.2.1. Age-standardized incidence rates (ASIRs) by region, esophagus cancer, 1983–2032.

From 2003–2007 to 2028–2032, the ASIRs of esophageal cancer for the country are projected to remain stable, at 6.2 per 100 000 in males and at 1.7 per 100 000 in females (Tables 4.2.3 and 4.2.4). Because of the aging and growth of the Canadian population, the annual number of new male cases is projected to increase by 93%, from 1095 to 2110, and of new female cases by 79%, from 385 to 690 (Tables 4.2.1 and 4.2.2). The overall stable ASIRs are expected to continue in both sexes for all age groups, the only exception being an increase in males younger than 55 (Figure 4.2.2). Random error from the few cases in this age group could potentially influence the accuracy of this finding.
TABLE 4.2.3.
Observed (2003–2007) and projected age-standardized incidence rates (ASIRs) by age and province/territories combined (TC), esophagus cancer, males, Canada, 2003–2032
| Period | Age | ASIRs | |||||||||||
|---|---|---|---|---|---|---|---|---|---|---|---|---|---|
| CA | BC | AB | SK | MB | ON | QC | NB | NS | PE | NL | TC | ||
| 2003–07 | <45 | 0.3 | 0.3 | 0.1 | 0.1 | 0.6 | 0.3 | 0.3 | 0.1 | 0.3 | 0.8 | 0.2 | 0.6 |
| 45–54 | 5.3 | 4.8 | 6.9 | 5.4 | 3.6 | 5.4 | 4.6 | 7.2 | 5.9 | 3.6 | 6.1 | 2.6 | |
| 55–64 | 16.5 | 16.2 | 18.2 | 12.4 | 14.4 | 16.7 | 15.7 | 15.8 | 23.1 | 23.6 | 15.4 | 23.8 | |
| 65–74 | 29.9 | 29.9 | 30.1 | 19.1 | 27.9 | 29.7 | 29.6 | 39.3 | 42.1 | 31.5 | 24.4 | 25.1 | |
| 75–84 | 42.5 | 44.0 | 43.1 | 47.0 | 36.7 | 42.5 | 39.5 | 52.9 | 51.4 | 36.8 | 43.7 | 61.3 | |
| 85+ | 42.9 | 50.4 | 43.3 | 29.3 | 41.7 | 40.0 | 43.3 | 43.7 | 52.2 | 26.6 | 62.5 | 0.0 | |
| Total | 6.2 | 6.2 | 6.4 | 5.0 | 5.7 | 6.2 | 5.9 | 7.2 | 8.0 | 6.7 | 6.0 | 6.6 | |
| 2008–12 | <45 | 0.3 | 0.3 | 0.1 | 0.1 | 0.5 | 0.4 | 0.2 | 0.2 | 0.2 | 0.6 | 0.1 | 0.3 |
| 45–54 | 5.5 | 5.0 | 7.4 | 5.6 | 4.1 | 6.0 | 4.7 | 7.1 | 7.7 | 6.0 | 4.5 | 5.0 | |
| 55–64 | 16.7 | 15.9 | 20.9 | 13.2 | 15.6 | 16.3 | 16.1 | 21.8 | 22.5 | 12.5 | 16.8 | 19.5 | |
| 65–74 | 29.8 | 29.7 | 32.5 | 20.5 | 27.0 | 28.0 | 30.6 | 38.3 | 43.5 | 46.7 | 24.6 | 36.3 | |
| 75–84 | 41.4 | 43.8 | 45.1 | 41.0 | 37.1 | 41.3 | 36.2 | 53.3 | 52.7 | 52.7 | 37.9 | 42.0 | |
| 85+ | 48.1 | 52.8 | 49.7 | 36.4 | 40.9 | 46.6 | 48.1 | 40.5 | 57.8 | 50.4 | 62.1 | 38.2 | |
| Total | 6.3 | 6.2 | 7.0 | 5.1 | 5.7 | 6.2 | 5.9 | 7.7 | 8.4 | 7.7 | 5.7 | 6.8 | |
| 2013–17 | <45 | 0.4 | 0.3 | 0.1 | 0.1 | 0.5 | 0.4 | 0.2 | 0.2 | 0.2 | 0.6 | 0.1 | 0.3 |
| 45–54 | 5.6 | 5.4 | 7.8 | 5.7 | 4.1 | 6.3 | 4.7 | 7.4 | 7.9 | 6.0 | 4.5 | 5.0 | |
| 55–64 | 17.3 | 16.5 | 24.2 | 16.2 | 15.7 | 17.1 | 16.4 | 22.8 | 21.4 | 19.4 | 16.6 | 19.3 | |
| 65–74 | 29.6 | 30.4 | 32.1 | 17.5 | 27.7 | 27.6 | 31.4 | 35.9 | 45.2 | 32.2 | 26.7 | 36.3 | |
| 75–84 | 39.6 | 39.7 | 45.6 | 41.3 | 35.3 | 38.5 | 36.0 | 59.4 | 53.9 | 44.3 | 41.5 | 41.9 | |
| 85+ | 47.2 | 52.3 | 55.0 | 32.8 | 49.4 | 47.3 | 43.9 | 48.1 | 51.6 | 58.3 | 36.2 | 38.1 | |
| Total | 6.3 | 6.2 | 7.4 | 5.1 | 5.8 | 6.2 | 6.0 | 8.0 | 8.4 | 7.1 | 5.7 | 6.8 | |
| 2018–22 | <45 | 0.4 | 0.3 | 0.1 | 0.1 | 0.5 | 0.4 | 0.2 | 0.2 | 0.2 | 0.6 | 0.1 | 0.3 |
| 45–54 | 6.1 | 5.4 | 7.8 | 5.7 | 4.1 | 6.7 | 4.7 | 7.4 | 7.9 | 6.0 | 4.5 | 5.0 | |
| 55–64 | 16.9 | 16.1 | 24.2 | 16.2 | 15.7 | 17.4 | 17.0 | 22.8 | 21.4 | 25.5 | 16.6 | 19.3 | |
| 65–74 | 29.6 | 30.9 | 35.4 | 18.9 | 27.1 | 27.9 | 31.9 | 37.3 | 39.9 | 21.0 | 26.7 | 36.1 | |
| 75–84 | 38.1 | 39.5 | 40.1 | 37.1 | 36.4 | 36.1 | 36.6 | 53.5 | 57.7 | 48.7 | 42.9 | 41.6 | |
| 85+ | 44.8 | 47.9 | 49.4 | 39.0 | 47.0 | 44.2 | 42.2 | 47.4 | 60.0 | 35.0 | 56.8 | 38.1 | |
| Total | 6.2 | 6.2 | 7.4 | 5.1 | 5.7 | 6.1 | 6.0 | 7.8 | 8.3 | 6.8 | 5.9 | 6.7 | |
| 2023–27 | <45 | 0.4 | 0.3 | 0.1 | 0.1 | 0.5 | 0.4 | 0.2 | 0.2 | 0.2 | 0.6 | 0.1 | 0.3 |
| 45–54 | 6.3 | 5.4 | 7.8 | 5.7 | 4.1 | 6.7 | 4.7 | 7.4 | 7.9 | 6.0 | 4.5 | 5.0 | |
| 55–64 | 16.9 | 16.7 | 24.2 | 16.2 | 15.7 | 17.9 | 17.1 | 22.8 | 21.4 | 29.0 | 16.6 | 19.2 | |
| 65–74 | 30.0 | 31.1 | 37.7 | 21.8 | 27.1 | 28.9 | 32.6 | 37.0 | 37.7 | 24.0 | 26.7 | 35.8 | |
| 75–84 | 37.2 | 39.5 | 38.5 | 31.5 | 36.4 | 35.4 | 37.7 | 50.7 | 56.6 | 29.8 | 46.4 | 41.4 | |
| 85+ | 42.2 | 42.5 | 49.0 | 34.7 | 44.6 | 40.6 | 43.2 | 53.3 | 54.3 | 28.7 | 49.1 | 37.5 | |
| Total | 6.2 | 6.2 | 7.5 | 5.1 | 5.7 | 6.2 | 6.2 | 7.8 | 8.0 | 6.6 | 6.0 | 6.7 | |
| 2028–32 | <45 | 0.4 | 0.3 | 0.1 | 0.1 | 0.5 | 0.4 | 0.2 | 0.2 | 0.2 | 0.6 | 0.1 | 0.3 |
| 45–54 | 6.3 | 5.4 | 7.8 | 5.7 | 4.1 | 6.7 | 4.7 | 7.4 | 7.9 | 6.0 | 4.5 | 5.0 | |
| 55–64 | 18.0 | 16.7 | 24.2 | 16.2 | 15.7 | 18.8 | 17.1 | 22.8 | 21.4 | 33.0 | 16.6 | 19.2 | |
| 65–74 | 29.1 | 30.9 | 37.7 | 21.8 | 27.1 | 29.3 | 33.5 | 37.0 | 37.7 | 27.4 | 26.7 | 35.9 | |
| 75–84 | 37.5 | 40.6 | 42.7 | 35.0 | 35.8 | 35.9 | 38.1 | 51.8 | 50.3 | 14.3 | 46.4 | 41.3 | |
| 85+ | 41.1 | 45.7 | 40.1 | 31.2 | 48.1 | 38.7 | 43.8 | 41.3 | 64.0 | 32.2 | 58.5 | 37.4 | |
| Total | 6.2 | 6.2 | 7.5 | 5.2 | 5.7 | 6.3 | 6.2 | 7.7 | 7.9 | 6.6 | 6.1 | 6.7 | |
Abbreviations: AB, Alberta; BC, British Columbia; CA, Canada; MB, Manitoba; NB, New Brunswick; NL, Newfoundland and Labrador; NS, Nova Scotia; ON, Ontario; PE, Prince Edward Island; QC, Quebec; SK, Saskatchewan; TC, All Territories (Yukon, Northwest Territories and Nunavut).
TABLE 4.2.4.
Observed (2003–2007) and projected age-standardized incidence rates (ASIRs) by age and province/territories combined (TC), esophagus cancer, females, Canada, 2003–2032
| Period | Age | ASIRs | |||||||||||
|---|---|---|---|---|---|---|---|---|---|---|---|---|---|
| CA | BC | AB | SK | MB | ON | QC | NB | NS | PE | NL | TC | ||
| 2003–07 | <45 | 0.1 | 0.0 | 0.1 | 0.0 | 0.1 | 0.1 | 0.1 | 0.1 | 0.1 | 0.0 | 0.0 | 0.0 |
| 45–54 | 1.0 | 1.4 | 0.7 | 0.3 | 0.7 | 1.3 | 0.9 | 0.7 | 1.3 | 2.0 | 0.4 | 0.0 | |
| 55–64 | 3.6 | 4.8 | 3.3 | 4.0 | 1.8 | 3.7 | 3.4 | 2.5 | 3.8 | 2.7 | 2.1 | 0.0 | |
| 65–74 | 8.2 | 11.3 | 9.3 | 8.7 | 6.6 | 8.2 | 6.4 | 10.0 | 9.8 | 7.3 | 2.9 | 27.5 | |
| 75–84 | 13.3 | 17.9 | 9.9 | 10.5 | 13.0 | 13.9 | 11.3 | 16.3 | 15.4 | 20.4 | 7.6 | 0.0 | |
| 85+ | 19.7 | 24.1 | 21.9 | 16.6 | 18.7 | 21.2 | 15.3 | 21.0 | 20.8 | 10.7 | 11.8 | 0.0 | |
| Total | 1.7 | 2.2 | 1.7 | 1.5 | 1.4 | 1.8 | 1.5 | 1.8 | 1.9 | 1.8 | 0.8 | 1.9 | |
| 2008–12 | <45 | 0.1 | 0.1 | 0.1 | 0.0 | 0.0 | 0.1 | 0.1 | 0.0 | 0.1 | 0.1 | 0.1 | 0.1 |
| 45–54 | 1.1 | 1.6 | 0.8 | 0.8 | 0.7 | 1.0 | 0.8 | 0.8 | 1.6 | 1.2 | 1.1 | 1.3 | |
| 55–64 | 3.5 | 4.7 | 3.5 | 4.1 | 2.2 | 3.4 | 3.4 | 3.4 | 4.6 | 3.7 | 3.2 | 4.0 | |
| 65–74 | 7.5 | 11.0 | 8.3 | 9.2 | 6.0 | 7.8 | 6.0 | 7.7 | 7.2 | 7.9 | 6.5 | 8.4 | |
| 75–84 | 13.5 | 18.4 | 12.1 | 9.9 | 13.7 | 14.4 | 10.5 | 20.6 | 14.1 | 14.2 | 12.6 | 15.1 | |
| 85+ | 20.5 | 23.8 | 25.6 | 18.0 | 14.8 | 21.2 | 18.4 | 26.1 | 24.7 | 21.6 | 19.2 | 23.0 | |
| Total | 1.7 | 2.3 | 1.7 | 1.6 | 1.3 | 1.7 | 1.4 | 1.9 | 1.9 | 1.8 | 1.5 | 1.9 | |
| 2013–17 | <45 | 0.1 | 0.1 | 0.1 | 0.0 | 0.0 | 0.1 | 0.1 | 0.0 | 0.1 | 0.1 | 0.1 | 0.1 |
| 45–54 | 1.3 | 1.6 | 0.8 | 0.8 | 0.7 | 1.0 | 0.7 | 0.8 | 1.6 | 1.3 | 1.1 | 1.4 | |
| 55–64 | 3.6 | 5.5 | 3.9 | 4.1 | 2.1 | 3.2 | 3.2 | 1.1 | 4.5 | 3.8 | 3.1 | 4.0 | |
| 65–74 | 7.3 | 9.0 | 8.3 | 9.6 | 5.5 | 7.7 | 6.4 | 8.4 | 7.0 | 7.7 | 6.4 | 8.2 | |
| 75–84 | 13.0 | 21.9 | 13.9 | 10.7 | 11.7 | 12.6 | 9.4 | 24.3 | 13.7 | 13.6 | 12.4 | 14.5 | |
| 85+ | 19.3 | 21.2 | 22.3 | 17.7 | 15.2 | 20.5 | 17.0 | 20.1 | 24.1 | 20.2 | 18.9 | 21.6 | |
| Total | 1.7 | 2.3 | 1.8 | 1.7 | 1.2 | 1.6 | 1.4 | 1.9 | 1.9 | 1.7 | 1.5 | 1.8 | |
| 2018–22 | <45 | 0.1 | 0.1 | 0.1 | 0.0 | 0.0 | 0.1 | 0.1 | 0.0 | 0.1 | 0.1 | 0.1 | 0.1 |
| 45–54 | 1.3 | 1.6 | 0.8 | 0.8 | 0.7 | 0.9 | 0.7 | 0.8 | 1.6 | 1.3 | 1.1 | 1.4 | |
| 55–64 | 3.7 | 5.5 | 4.3 | 4.1 | 2.0 | 3.0 | 2.7 | 1.0 | 4.4 | 3.9 | 3.1 | 4.2 | |
| 65–74 | 7.3 | 9.1 | 9.5 | 9.9 | 5.1 | 7.1 | 6.8 | 8.6 | 6.8 | 7.6 | 6.4 | 8.1 | |
| 75–84 | 12.4 | 21.4 | 12.8 | 11.3 | 8.9 | 12.5 | 9.1 | 19.2 | 13.4 | 13.1 | 12.4 | 13.9 | |
| 85+ | 20.1 | 25.3 | 30.1 | 18.5 | 17.6 | 20.1 | 15.5 | 38.4 | 23.5 | 21.1 | 18.7 | 22.5 | |
| Total | 1.7 | 2.3 | 1.9 | 1.7 | 1.1 | 1.5 | 1.3 | 1.9 | 1.8 | 1.7 | 1.5 | 1.9 | |
| 2023–27 | <45 | 0.1 | 0.1 | 0.1 | 0.0 | 0.0 | 0.1 | 0.1 | 0.0 | 0.1 | 0.1 | 0.1 | 0.1 |
| 45–54 | 1.2 | 1.6 | 0.8 | 0.8 | 0.7 | 0.9 | 0.6 | 0.8 | 1.6 | 1.3 | 1.0 | 1.4 | |
| 55–64 | 4.1 | 5.5 | 4.7 | 4.1 | 1.9 | 2.9 | 2.6 | 0.9 | 4.3 | 4.3 | 3.1 | 4.6 | |
| 65–74 | 7.3 | 10.3 | 10.7 | 10.0 | 4.8 | 6.8 | 6.2 | 3.6 | 6.6 | 7.6 | 6.4 | 8.1 | |
| 75–84 | 12.0 | 18.0 | 12.9 | 11.6 | 8.3 | 12.2 | 9.7 | 23.7 | 13.0 | 12.6 | 12.3 | 13.5 | |
| 85+ | 18.1 | 29.7 | 29.6 | 18.9 | 11.3 | 16.4 | 13.7 | 33.6 | 22.9 | 19.0 | 18.7 | 20.3 | |
| Total | 1.6 | 2.3 | 2.0 | 1.7 | 1.0 | 1.5 | 1.3 | 1.6 | 1.8 | 1.7 | 1.5 | 1.8 | |
| 2028–32 | <45 | 0.1 | 0.1 | 0.1 | 0.0 | 0.0 | 0.1 | 0.1 | 0.0 | 0.1 | 0.1 | 0.1 | 0.1 |
| 45–54 | 1.2 | 1.6 | 0.8 | 0.8 | 0.7 | 0.9 | 0.6 | 0.7 | 1.6 | 1.3 | 1.1 | 1.4 | |
| 55–64 | 4.1 | 5.6 | 5.1 | 4.1 | 1.8 | 2.8 | 2.5 | 0.8 | 4.3 | 4.3 | 3.1 | 4.6 | |
| 65–74 | 7.7 | 10.3 | 12.0 | 10.1 | 4.4 | 6.4 | 5.6 | 3.4 | 6.4 | 8.1 | 6.4 | 8.6 | |
| 75–84 | 12.1 | 18.7 | 14.4 | 11.9 | 7.8 | 11.4 | 10.3 | 19.0 | 12.7 | 12.7 | 12.4 | 13.5 | |
| 85+ | 18.5 | 25.2 | 26.4 | 19.4 | 10.6 | 18.8 | 14.5 | 24.8 | 22.4 | 19.4 | 18.8 | 20.7 | |
| Total | 1.7 | 2.3 | 2.2 | 1.8 | 0.9 | 1.4 | 1.2 | 1.3 | 1.7 | 1.8 | 1.5 | 1.9 | |
Abbreviations: AB, Alberta; BC, British Columbia; CA, Canada; MB, Manitoba; NB, New Brunswick; NL, Newfoundland and Labrador; NS, Nova Scotia; ON, Ontario; PE, Prince Edward Island; QC, Quebec; SK, Saskatchewan; TC, All Territories (Yukon, Northwest Territories and Nunavut).
FIGURE 4.2.2. Age-standardized incidence rates (ASIRs) for esophagus cancer by age group (– males, – females), Canada, 1983–2032.

In 2003–2007, incidence rates for esopha-geal cancer increased steeply with age: most of the cases occurred in people aged 55 or older (85% in males and 92% in females). In the same period, the overall ASIRs for esophageal cancer were 3.6 times greater for males than for females. By age group, the male-to-female rate ratio of esophageal cancer at the national level decreased with age from 5.3:1 in the 45–54 age group to 2.2:1 in those 85 and older. This pattern is projected to continue over the projection period.
Across all regions of Canada and all periods shown in Tables 4.2.3 and 4.2.4, the average ASIRs of esophageal cancer range from 5.0 (Saskatchewan) to 8.4 (Nova Scotia) per 100 000 in males and from 0.8 (Newfoundland and Labrador) to 2.3 (British Columbia) per 100 000 in females. These differences are likely related to the combined effects of variation in risk factor prevalence and cancer registry practices. Figure 4.2.1 shows the differences in ASIRs by broader areas. In males, the Atlantic region is projected to have about 18% higher rates than the Prairies and between 25% and 28% higher rates than other regions, where the rates are trending to the same level after 2023–2027. The predictions indicate that rates will slightly increase in the Atlantic and Prairie regions, and remain stable in other regions.
In females, the rates in British Columbia are predicted to be between 42% and 75% higher than those in the other regions. This is notable given that British Columbia generally has lower than national average rates for most cancers. Quebec is projected to continue to have the lowest rates of esophageal cancer. Incidence rates for females have and will continue to decrease steadily from 1993–1997 rates in the Prairies, in Quebec, and most markedly in Ontario. In contrast, the rates in British Columbia are projected to increase marginally. The increase in rates of esophageal cancer is less evident for females than for males in Atlantic Canada.
Comments
While overall incidence rate has stabilized over the past 2 decades, the 2 main types of esophageal cancer demonstrate opposite trends. Adenocarcinoma incidence rose by 4% per year, whereas squamous cell carcinoma incidence decreased by 3% per year from 1986 to 2006.61 Similar incidence trends have been observed in Australia, the US, and parts of Europe.62,63 Furthermore, the observation that the increase is also seen in more recent birth cohorts would suggest that adenocarcinoma incidence will continue to increase in the years to come.64 The observed trends may be linked to changes in risk factors, which include smoking, alcohol use, overweight (body mass index [BMI]: 25–29 kg/m2) and obesity (BMI ≥30 kg/m2), and insufficient intake of fruit and vegetables.
Tobacco smoking and alcohol drinking are the main risk factors for this cancer, with a stronger association with squamous cell carcinoma than with adenocarcinoma.65,66 In a US case-control study, ever smoking, alcohol use, and low fruit and vegetable consumption were linked to 56.9% (95% confidence interval [CI]: 36.6%–75.1%), 72.4% (CI: 53.3%–85.8%) and 28.7% (CI: 11.1%–56.5%) of squamous cell carcinoma cases, respectively.67 Reduced smoking in Canada may contribute to the decreasing incidence of squamous cell carcinoma.43,61 About 55% of male esophageal cancers and 44% of female esophageal cancers could be avoided if smoking were eliminated, as could 40% and 30% of such cancers in males and females, respectively, if drinking were eliminated.3
The increasing prevalence of gastroesopha-geal reflux disease (GERD) and obesity is thought to add to the changes in incidence of esophageal cancer. An important risk factor for adenocarcinoma is GERD and the associated development of Barrett's esophagus.68 In Western countries, the prevalence of GERD ranges from 10% to 20% of the population.69 Obesity causally increases risk of adenocarcinoma,70,71 and the link is greater than that of any other obesity-associated cancer.68 A proposed mechanism is that obesity increases intra-abdominal pressure and gastroesophageal reflux.68 In contrast to adenocarcinoma, increased BMI may reduce the risk of squamous cell carcinoma.70,71 Recent Canadian data suggest that the prevalence rates of obesity have nearly doubled in adults from 1978/79 to 2012.51,72,73 The prevalence of GERD has increased significantly in Western populations in recent decades74 and likely continues to increase because of the aging of the population69 and the increased prevalence of obesity. The observed slight increase in esophagus cancer incidence in males may reflect these changes in the prevalence of GERD and obesity in Canada, as adenocar-cinoma accounts for a majority of all male esophageal cancer cases.61 The increased prevalence of obesity might play a part in the decrease of squamous cell carcinoma incidence, and therefore the slight decrease of overall esophagus cancer rates in females.
The high incidence rates of esophagus cancer in females in British Columbia could partially be explained by high number of immigrants from South Asia and China where hepatitis B virus (HBV) is endemic (see the detailed explanations in Chapter 5).75–78
3. Stomach cancer
Stomach cancer (sometimes referred to as gastric cancer) was responsible for approximately 1.9% of all incident cases of cancer in Canada in 2003–2007 (Tables 4.3.1 and 4.3.2). It is the tenth most common cancer in males and the fifteenth most common in females. One in 73 males and 1 in 127 females can expect to be diagnosed with stomach cancer in their lifetime, and 1 in 111 males and 1 in 195 females can expect to die from it.1 On average, 1925 and 1080 new cases of stomach cancer were diagnosed each year in males and females, respectively, during 2003–2007.
TABLE 4.3.1.
Observed (2003–2007) and projected average annual new cases by age and province/territories combined (TC), stomach cancer, males, Canada, 2003–2032
| Period | Age | New cases | |||||||||||
|---|---|---|---|---|---|---|---|---|---|---|---|---|---|
| CA | BC | AB | SK | MB | ON | QC | NB | NS | PE | NL | TC | ||
| 2003–07 | <45 | 75 | 10 | 10 | 0 | 5 | 30 | 15 | 0 | 0 | 0 | 0 | 0 |
| 45–54 | 200 | 25 | 20 | 5 | 10 | 70 | 50 | 5 | 10 | 0 | 5 | 0 | |
| 55–64 | 400 | 50 | 30 | 10 | 15 | 145 | 105 | 10 | 15 | 0 | 15 | 0 | |
| 65–74 | 545 | 70 | 45 | 15 | 20 | 205 | 145 | 15 | 15 | 0 | 15 | 0 | |
| 75–84 | 535 | 65 | 40 | 15 | 25 | 190 | 150 | 15 | 15 | 0 | 15 | 0 | |
| 85+ | 175 | 25 | 15 | 5 | 10 | 55 | 45 | 5 | 5 | 0 | 5 | 0 | |
| Total | 1925 | 245 | 160 | 55 | 80 | 700 | 510 | 55 | 65 | 5 | 50 | 5 | |
| 2008–12 | <45 | 70 | 10 | 10 | 0 | 0 | 30 | 15 | 0 | 0 | 0 | 0 | 0 |
| 45–54 | 205 | 25 | 20 | 5 | 10 | 85 | 45 | 5 | 10 | 0 | 5 | 0 | |
| 55–64 | 440 | 55 | 35 | 10 | 20 | 160 | 110 | 15 | 15 | 0 | 15 | 0 | |
| 65–74 | 560 | 70 | 45 | 15 | 20 | 205 | 150 | 15 | 20 | 5 | 15 | 0 | |
| 75–84 | 550 | 75 | 45 | 15 | 20 | 195 | 155 | 15 | 15 | 0 | 10 | 0 | |
| 85+ | 200 | 30 | 20 | 5 | 10 | 70 | 50 | 5 | 5 | 0 | 5 | 0 | |
| Total | 2020 | 260 | 170 | 55 | 80 | 745 | 525 | 55 | 65 | 10 | 50 | 5 | |
| 2013–17 | <45 | 70 | 10 | 10 | 0 | 0 | 30 | 15 | 0 | 0 | 0 | 0 | 0 |
| 45–54 | 200 | 30 | 15 | 5 | 5 | 80 | 40 | 5 | 5 | 0 | 0 | 0 | |
| 55–64 | 460 | 55 | 40 | 15 | 25 | 175 | 105 | 10 | 15 | 0 | 10 | 0 | |
| 65–74 | 650 | 80 | 55 | 15 | 25 | 245 | 165 | 20 | 20 | 5 | 20 | 0 | |
| 75–84 | 545 | 75 | 45 | 15 | 20 | 200 | 155 | 15 | 15 | 0 | 10 | 0 | |
| 85+ | 225 | 35 | 20 | 5 | 10 | 80 | 60 | 5 | 5 | 0 | 5 | 0 | |
| Total | 2150 | 280 | 185 | 55 | 85 | 805 | 540 | 60 | 70 | 10 | 50 | 5 | |
| 2018–22 | <45 | 65 | 10 | 10 | 0 | 0 | 30 | 15 | 0 | 0 | 0 | 0 | 0 |
| 45–54 | 195 | 30 | 15 | 0 | 5 | 80 | 40 | 5 | 5 | 0 | 0 | 0 | |
| 55–64 | 480 | 60 | 40 | 15 | 20 | 195 | 105 | 10 | 15 | 0 | 10 | 0 | |
| 65–74 | 735 | 100 | 65 | 20 | 35 | 270 | 175 | 20 | 25 | 5 | 20 | 0 | |
| 75–84 | 585 | 75 | 50 | 15 | 20 | 215 | 160 | 15 | 20 | 5 | 15 | 0 | |
| 85+ | 250 | 35 | 20 | 5 | 10 | 95 | 65 | 5 | 10 | 0 | 5 | 0 | |
| Total | 2315 | 310 | 200 | 55 | 95 | 880 | 560 | 60 | 70 | 10 | 50 | 5 | |
| 2023–27 | <45 | 65 | 10 | 5 | 0 | 0 | 25 | 10 | 0 | 0 | 0 | 0 | 0 |
| 45–54 | 195 | 30 | 10 | 0 | 5 | 85 | 45 | 5 | 5 | 0 | 0 | 0 | |
| 55–64 | 480 | 70 | 35 | 10 | 20 | 190 | 95 | 10 | 15 | 0 | 5 | 0 | |
| 65–74 | 790 | 105 | 75 | 25 | 35 | 300 | 180 | 20 | 25 | 5 | 20 | 0 | |
| 75–84 | 705 | 95 | 60 | 15 | 30 | 260 | 190 | 25 | 20 | 5 | 15 | 0 | |
| 85+ | 255 | 35 | 25 | 5 | 10 | 100 | 65 | 5 | 10 | 0 | 5 | 0 | |
| Total | 2490 | 340 | 215 | 60 | 100 | 960 | 585 | 60 | 75 | 10 | 50 | 5 | |
| 2028–32 | <45 | 55 | 10 | 5 | 0 | 0 | 25 | 10 | 0 | 0 | 0 | 0 | 0 |
| 45–54 | 185 | 25 | 10 | 0 | 5 | 80 | 40 | 5 | 5 | 0 | 0 | 0 | |
| 55–64 | 475 | 70 | 30 | 10 | 15 | 185 | 95 | 5 | 10 | 0 | 5 | 0 | |
| 65–74 | 845 | 110 | 75 | 20 | 35 | 340 | 185 | 20 | 25 | 5 | 15 | 5 | |
| 75–84 | 820 | 120 | 75 | 20 | 40 | 295 | 210 | 25 | 25 | 5 | 20 | 0 | |
| 85+ | 300 | 40 | 30 | 5 | 10 | 115 | 75 | 10 | 10 | 0 | 5 | 0 | |
| Total | 2680 | 370 | 225 | 60 | 110 | 1040 | 610 | 60 | 80 | 10 | 45 | 10 | |
Abbreviations: AB, Alberta; BC, British Columbia; CA, Canada; MB, Manitoba; NB, New Brunswick; NL, Newfoundland and Labrador; NS, Nova Scotia; ON, Ontario; PE, Prince Edward Island; QC, Quebec; SK, Saskatchewan; TC, All Territories (Yukon, Northwest Territories and Nunavut).
Note: Totals may not add up due to rounding.
The overall incidence rate of stomach cancer in Canada has decreased for a long time (Figure 4.3.1). In 1998–2007, the incidence rate of stomach cancer was the second most rapidly decreasing of all cancers after larynx (2% per year in males and 1.6% per year in females) (Figures 3.1 and 3.2). Stomach cancer has a poor 5-year relative survival rate, at 23% in males and 28% in females in 2006–2008.1
FIGURE 4.3.1. Age-standardized incidence rates (ASIRs) by region, stomach cancer, 1983–2032.

The incidence rates increased with age from 0.7 per 100 000 in males aged under 45 to 113.5 in those aged 85 or older, and from 0.6 to 55.1 per 100 000 in females for the same age groups (Tables 4.3.3 and 4.3.4) in 2003–2007. Most people diagnosed with stomach cancer are 65 or older (65% in men and 70% in women). The male-to-female ratio of rates approximated 1:1 in those younger than 45 and increased to 1.9:1 to 2.7:1 in the over-45-year age groups in 2003–2007.
TABLE 4.3.3.
Observed (2003–2007) and projected age-standardized incidence rates (ASIRs) by age and province/territories combined (TC), stomach cancer, males, Canada, 2003–2032
| Period | Age | ASIRs | |||||||||||
|---|---|---|---|---|---|---|---|---|---|---|---|---|---|
| CA | BC | AB | SK | MB | ON | QC | NB | NS | PE | NL | TC | ||
| 2003–07 | <45 | 0.7 | 0.6 | 0.8 | 0.4 | 0.8 | 0.7 | 0.7 | 0.6 | 0.7 | 0.4 | 0.9 | 0.6 |
| 45–54 | 7.9 | 7.5 | 8.2 | 6.1 | 10.7 | 7.6 | 7.9 | 7.5 | 10.7 | 13.3 | 9.9 | 7.6 | |
| 55–64 | 23.6 | 20.9 | 21.2 | 19.3 | 27.7 | 23.4 | 24.2 | 26.3 | 26.9 | 12.6 | 42.2 | 25.6 | |
| 65–74 | 50.7 | 44.6 | 47.1 | 50.4 | 50.0 | 50.2 | 54.2 | 61.1 | 47.3 | 42.9 | 73.3 | 84.7 | |
| 75–84 | 86.1 | 74.1 | 80.2 | 64.7 | 93.7 | 79.5 | 103.1 | 107.1 | 91.4 | 50.4 | 148.1 | 61.3 | |
| 85+ | 113.5 | 103.4 | 103.6 | 82.5 | 116.8 | 101.6 | 138.8 | 126.3 | 137.9 | 106.3 | 223.3 | 290.3 | |
| Total | 11.1 | 9.8 | 10.4 | 9.2 | 12.1 | 10.6 | 12.2 | 12.8 | 11.9 | 8.6 | 17.9 | 14.4 | |
| 2008–12 | <45 | 0.7 | 0.8 | 0.6 | 0.6 | 0.6 | 0.7 | 0.7 | 0.6 | 0.6 | 0.6 | 0.8 | 0.9 |
| 45–54 | 7.4 | 6.7 | 6.8 | 5.2 | 8.5 | 7.8 | 6.8 | 7.8 | 9.4 | 7.7 | 6.5 | 9.6 | |
| 55–64 | 21.4 | 19.7 | 18.3 | 19.4 | 28.4 | 21.3 | 21.2 | 25.6 | 23.3 | 21.4 | 36.0 | 27.8 | |
| 65–74 | 45.1 | 38.5 | 44.4 | 41.8 | 48.4 | 44.7 | 47.1 | 48.4 | 46.1 | 45.8 | 74.6 | 58.5 | |
| 75–84 | 78.4 | 73.0 | 72.9 | 62.3 | 84.5 | 72.1 | 92.1 | 93.8 | 81.3 | 73.5 | 116.0 | 101.6 | |
| 85+ | 95.6 | 85.4 | 103.0 | 67.2 | 104.1 | 88.2 | 113.1 | 120.7 | 112.1 | 89.0 | 139.3 | 123.9 | |
| Total | 10.0 | 9.0 | 9.4 | 8.4 | 11.2 | 9.7 | 10.7 | 11.3 | 10.7 | 9.7 | 15.1 | 12.9 | |
| 2013–17 | <45 | 0.7 | 0.7 | 0.6 | 0.6 | 0.6 | 0.7 | 0.7 | 0.6 | 0.6 | 0.5 | 0.8 | 0.9 |
| 45–54 | 7.4 | 8.1 | 5.2 | 4.1 | 8.0 | 7.3 | 6.2 | 7.2 | 7.9 | 7.1 | 5.4 | 9.6 | |
| 55–64 | 19.6 | 17.6 | 17.4 | 19.3 | 28.0 | 19.6 | 19.0 | 19.4 | 23.6 | 19.9 | 28.6 | 25.4 | |
| 65–74 | 41.6 | 35.8 | 38.6 | 38.2 | 48.5 | 41.7 | 42.1 | 49.7 | 41.7 | 42.3 | 73.4 | 53.9 | |
| 75–84 | 70.6 | 64.5 | 68.5 | 57.8 | 76.5 | 66.8 | 81.2 | 81.5 | 71.3 | 68.0 | 88.7 | 91.5 | |
| 85+ | 84.1 | 78.9 | 87.9 | 55.4 | 90.8 | 77.8 | 98.5 | 103.1 | 98.5 | 82.3 | 138.7 | 109.0 | |
| Total | 9.2 | 8.4 | 8.5 | 7.7 | 10.6 | 9.0 | 9.6 | 10.2 | 9.7 | 9.0 | 13.2 | 11.9 | |
| 2018–22 | <45 | 0.6 | 0.6 | 0.6 | 0.6 | 0.6 | 0.6 | 0.6 | 0.6 | 0.5 | 0.5 | 0.8 | 0.7 |
| 45–54 | 7.8 | 8.6 | 4.5 | 3.2 | 7.5 | 7.8 | 7.0 | 6.8 | 6.9 | 6.6 | 4.5 | 10.1 | |
| 55–64 | 18.5 | 16.2 | 15.5 | 17.3 | 22.9 | 19.3 | 17.4 | 17.1 | 22.4 | 18.4 | 19.3 | 24.0 | |
| 65–74 | 38.8 | 36.9 | 35.1 | 36.3 | 51.7 | 38.2 | 38.5 | 44.8 | 39.9 | 39.4 | 65.6 | 50.3 | |
| 75–84 | 63.0 | 54.6 | 63.3 | 54.0 | 73.8 | 60.6 | 70.7 | 69.8 | 63.3 | 63.2 | 86.3 | 81.7 | |
| 85+ | 79.8 | 72.0 | 78.1 | 56.4 | 90.3 | 77.3 | 91.0 | 101.4 | 93.0 | 76.6 | 110.0 | 103.4 | |
| Total | 8.5 | 7.9 | 7.7 | 7.2 | 10.3 | 8.5 | 8.7 | 9.2 | 9.0 | 8.4 | 11.4 | 11.1 | |
| 2023–27 | <45 | 0.6 | 0.5 | 0.5 | 0.6 | 0.6 | 0.6 | 0.4 | 0.6 | 0.5 | 0.5 | 0.8 | 0.7 |
| 45–54 | 7.5 | 7.8 | 3.8 | 2.5 | 7.0 | 8.3 | 7.6 | 6.4 | 6.0 | 6.2 | 3.7 | 9.8 | |
| 55–64 | 18.5 | 19.3 | 12.6 | 14.5 | 21.8 | 18.4 | 16.3 | 15.2 | 19.5 | 17.3 | 16.8 | 24.0 | |
| 65–74 | 36.1 | 33.1 | 34.0 | 36.1 | 50.0 | 36.1 | 35.2 | 36.2 | 40.7 | 37.0 | 52.0 | 46.8 | |
| 75–84 | 58.8 | 52.4 | 55.9 | 49.6 | 73.3 | 57.2 | 64.5 | 72.5 | 57.9 | 59.3 | 82.3 | 76.3 | |
| 85+ | 69.8 | 62.6 | 77.3 | 49.4 | 76.8 | 68.7 | 78.4 | 80.5 | 78.6 | 72.0 | 82.9 | 90.4 | |
| Total | 8.1 | 7.6 | 7.0 | 6.7 | 9.8 | 8.1 | 8.0 | 8.3 | 8.3 | 7.9 | 9.8 | 10.5 | |
| 2028–32 | <45 | 0.5 | 0.5 | 0.5 | 0.6 | 0.6 | 0.5 | 0.4 | 0.6 | 0.5 | 0.5 | 0.8 | 0.6 |
| 45–54 | 7.0 | 7.0 | 3.3 | 2.0 | 6.6 | 7.4 | 6.2 | 6.0 | 5.3 | 5.9 | 3.1 | 9.0 | |
| 55–64 | 19.4 | 20.5 | 11.1 | 12.1 | 20.7 | 19.2 | 17.9 | 13.4 | 17.4 | 16.5 | 14.6 | 25.2 | |
| 65–74 | 34.7 | 31.5 | 30.2 | 32.6 | 42.5 | 35.6 | 32.8 | 32.6 | 38.2 | 35.1 | 38.1 | 44.9 | |
| 75–84 | 55.3 | 53.7 | 51.6 | 48.0 | 79.7 | 52.6 | 59.6 | 65.1 | 56.3 | 56.4 | 75.1 | 71.6 | |
| 85+ | 63.6 | 52.3 | 68.4 | 48.7 | 81.2 | 63.6 | 69.4 | 74.4 | 73.1 | 68.6 | 94.9 | 82.5 | |
| Total | 7.7 | 7.5 | 6.3 | 6.1 | 9.5 | 7.8 | 7.5 | 7.5 | 7.8 | 7.5 | 8.4 | 10.0 | |
Abbreviations: AB, Alberta; BC, British Columbia; CA, Canada; MB, Manitoba; NB, New Brunswick; NL, Newfoundland and Labrador; NS, Nova Scotia; ON, Ontario; PE, Prince Edward Island; QC, Quebec; SK, Saskatchewan; TC, All Territories (Yukon, Northwest Territories and Nunavut).
TABLE 4.3.4.
Observed (2003–2007) and projected age-standardized incidence rates (ASIRs) by age and province/territories combined (TC), stomach cancer, females, Canada, 2003–2032
| Period | Age | ASIRs | |||||||||||
|---|---|---|---|---|---|---|---|---|---|---|---|---|---|
| CA | BC | AB | SK | MB | ON | QC | NB | NS | PE | NL | TC | ||
| 2003–07 | <45 | 0.6 | 0.5 | 0.7 | 0.6 | 0.6 | 0.7 | 0.5 | 0.8 | 0.5 | 1.5 | 1.6 | 2.8 |
| 45–54 | 4.1 | 3.7 | 3.9 | 3.0 | 3.7 | 4.7 | 3.9 | 4.8 | 2.4 | 1.7 | 4.4 | 2.8 | |
| 55–64 | 8.7 | 8.0 | 10.0 | 6.4 | 9.4 | 8.6 | 8.7 | 7.5 | 8.6 | 4.8 | 15.2 | 23.1 | |
| 65–74 | 20.2 | 15.2 | 15.3 | 18.7 | 18.7 | 19.7 | 22.8 | 26.4 | 20.6 | 44.0 | 42.5 | 27.5 | |
| 75–84 | 37.5 | 31.3 | 35.1 | 30.4 | 35.6 | 34.2 | 45.8 | 42.8 | 32.0 | 32.4 | 76.1 | 92.7 | |
| 85+ | 55.1 | 35.8 | 54.7 | 35.7 | 47.4 | 54.3 | 74.4 | 62.9 | 47.9 | 21.4 | 47.0 | 96.5 | |
| Total | 4.9 | 4.0 | 4.6 | 4.0 | 4.6 | 4.8 | 5.5 | 5.7 | 4.4 | 6.0 | 9.0 | 10.4 | |
| 2008–12 | <45 | 0.7 | 0.6 | 0.6 | 0.4 | 0.7 | 0.7 | 0.6 | 0.6 | 0.4 | 0.8 | 1.2 | 1.9 |
| 45–54 | 3.9 | 3.6 | 4.3 | 2.8 | 3.7 | 4.4 | 3.3 | 3.7 | 3.5 | 4.7 | 5.1 | 9.5 | |
| 55–64 | 8.2 | 6.6 | 8.4 | 7.1 | 8.8 | 8.9 | 7.9 | 7.2 | 9.8 | 10.0 | 12.3 | 17.6 | |
| 65–74 | 17.7 | 13.3 | 16.1 | 13.2 | 18.4 | 17.6 | 19.6 | 18.4 | 15.7 | 21.5 | 32.3 | 30.8 | |
| 75–84 | 34.1 | 29.9 | 30.0 | 28.5 | 29.0 | 31.4 | 40.5 | 38.6 | 27.3 | 41.4 | 69.7 | 53.0 | |
| 85+ | 48.0 | 32.4 | 50.0 | 34.6 | 52.0 | 46.4 | 59.9 | 58.4 | 45.0 | 58.3 | 54.8 | 83.2 | |
| Total | 4.5 | 3.7 | 4.3 | 3.5 | 4.4 | 4.5 | 4.8 | 4.7 | 4.0 | 5.5 | 7.7 | 8.7 | |
| 2013–17 | <45 | 0.7 | 0.6 | 0.4 | 0.4 | 0.7 | 0.8 | 0.6 | 0.6 | 0.4 | 0.8 | 1.2 | 2.0 |
| 45–54 | 3.9 | 3.4 | 4.5 | 2.5 | 3.7 | 4.5 | 3.1 | 3.7 | 3.5 | 4.7 | 4.4 | 10.1 | |
| 55–64 | 8.1 | 7.0 | 8.4 | 6.2 | 7.6 | 8.6 | 7.4 | 6.4 | 7.8 | 9.9 | 12.3 | 19.2 | |
| 65–74 | 15.6 | 12.1 | 15.5 | 11.0 | 16.5 | 16.2 | 16.5 | 15.9 | 13.7 | 19.0 | 25.8 | 34.4 | |
| 75–84 | 31.2 | 26.4 | 27.1 | 25.8 | 29.9 | 28.8 | 37.0 | 34.0 | 25.1 | 37.9 | 60.1 | 59.6 | |
| 85+ | 42.6 | 29.2 | 42.7 | 29.7 | 39.9 | 42.3 | 52.5 | 51.9 | 37.4 | 51.8 | 54.5 | 92.9 | |
| Total | 4.2 | 3.4 | 4.0 | 3.1 | 4.1 | 4.3 | 4.4 | 4.2 | 3.5 | 5.1 | 6.8 | 9.6 | |
| 2018–22 | <45 | 0.6 | 0.5 | 0.4 | 0.4 | 0.7 | 0.7 | 0.5 | 0.6 | 0.4 | 0.8 | 1.2 | 2.1 |
| 45–54 | 4.5 | 3.4 | 4.3 | 2.3 | 3.7 | 5.5 | 3.7 | 3.7 | 3.5 | 5.4 | 3.9 | 10.7 | |
| 55–64 | 7.8 | 7.1 | 8.9 | 5.1 | 6.5 | 8.4 | 6.7 | 5.8 | 6.3 | 9.5 | 9.7 | 20.7 | |
| 65–74 | 15.0 | 11.8 | 13.8 | 10.4 | 17.1 | 16.3 | 14.9 | 13.7 | 14.2 | 18.3 | 25.7 | 37.9 | |
| 75–84 | 27.7 | 22.8 | 26.6 | 21.7 | 27.2 | 25.9 | 32.6 | 29.9 | 19.6 | 33.7 | 47.6 | 66.8 | |
| 85+ | 38.1 | 26.4 | 37.5 | 25.6 | 34.4 | 36.7 | 47.8 | 46.2 | 32.2 | 46.4 | 52.5 | 104.0 | |
| Total | 4.0 | 3.2 | 3.8 | 2.7 | 3.9 | 4.2 | 4.0 | 3.8 | 3.2 | 4.9 | 6.1 | 10.4 | |
| 2023–27 | <45 | 0.5 | 0.5 | 0.4 | 0.4 | 0.7 | 0.6 | 0.5 | 0.6 | 0.4 | 0.7 | 1.2 | 2.2 |
| 45–54 | 4.9 | 3.0 | 3.3 | 2.1 | 3.7 | 6.1 | 4.0 | 3.7 | 3.5 | 5.9 | 3.4 | 11.2 | |
| 55–64 | 7.8 | 6.8 | 9.2 | 4.2 | 5.6 | 8.6 | 6.2 | 5.2 | 5.0 | 9.5 | 7.6 | 22.1 | |
| 65–74 | 14.9 | 12.6 | 14.1 | 9.2 | 15.2 | 16.0 | 14.3 | 11.8 | 11.8 | 18.1 | 25.1 | 41.2 | |
| 75–84 | 25.0 | 21.4 | 25.5 | 19.1 | 26.1 | 24.4 | 28.1 | 26.4 | 19.1 | 30.4 | 39.2 | 74.4 | |
| 85+ | 35.9 | 23.1 | 35.0 | 24.4 | 40.7 | 35.4 | 44.5 | 41.2 | 31.7 | 43.7 | 41.0 | 116.6 | |
| Total | 3.9 | 3.1 | 3.6 | 2.4 | 3.7 | 4.1 | 3.7 | 3.5 | 2.9 | 4.7 | 5.4 | 11.3 | |
| 2028–32 | <45 | 0.5 | 0.4 | 0.3 | 0.4 | 0.7 | 0.5 | 0.4 | 0.6 | 0.4 | 0.6 | 1.2 | 2.3 |
| 45–54 | 4.6 | 2.6 | 2.9 | 1.9 | 3.7 | 5.4 | 3.5 | 3.7 | 3.5 | 5.6 | 3.1 | 11.7 | |
| 55–64 | 8.8 | 6.9 | 9.0 | 3.4 | 4.8 | 10.2 | 7.3 | 4.8 | 4.0 | 10.7 | 5.9 | 23.3 | |
| 65–74 | 14.4 | 12.7 | 14.7 | 7.7 | 13.4 | 15.7 | 13.0 | 10.2 | 9.7 | 17.5 | 20.5 | 44.4 | |
| 75–84 | 24.4 | 20.9 | 22.8 | 18.2 | 26.3 | 24.7 | 25.9 | 23.2 | 18.8 | 29.6 | 39.6 | 81.9 | |
| 85+ | 30.8 | 19.7 | 35.8 | 18.6 | 30.4 | 30.6 | 38.0 | 36.7 | 21.3 | 37.5 | 32.4 | 130.8 | |
| Total | 3.7 | 3.0 | 3.5 | 2.2 | 3.4 | 4.1 | 3.5 | 3.1 | 2.5 | 4.6 | 4.8 | 12.1 | |
Abbreviations: AB, Alberta; BC, British Columbia; CA, Canada; MB, Manitoba; NB, New Brunswick; NL, Newfoundland and Labrador; NS, Nova Scotia; ON, Ontario; PE, Prince Edward Island; QC, Quebec; SK, Saskatchewan; TC, All Territories (Yukon, Northwest Territories and Nunavut).
From 2003–2007 to 2028–2032, ASIRs of stomach cancer for Canada are expected to decrease by 30% in males, from 11.1 to 7.7 per 100 000, and by 24% in females, from 4.9 to 3.7 per 100 000 (Tables 4.3.3 and 4.3.4). With the projected Canada population growth and aging, however, the annual number of male cases is predicted to rise by 39%, from 1925 to 2680, and the number of female cases is predicted to rise by 32%, from 1080 to 1425 (Tables 4.3.1 and 4.3.2). The projected long-term trends in males and females show a tendency toward a convergence of rates in each age group (Figure 4.3.2). Elevated rates are reported for the Atlantic region, with the highest rates in Newfoundland and Labrador, but the long-term trends indicate a convergence of rates in regions as well (Figure 4.3.1).
TABLE 4.3.2.
Observed (2003–2007) and projected average annual new cases by age and province/territories combined (TC), stomach cancer, females, Canada, 2003–2032
| Period | Age | New cases | |||||||||||
|---|---|---|---|---|---|---|---|---|---|---|---|---|---|
| CA | BC | AB | SK | MB | ON | QC | NB | NS | PE | NL | TC | ||
| 2003–07 | <45 | 65 | 5 | 5 | 0 | 0 | 25 | 10 | 0 | 0 | 0 | 5 | 0 |
| 45–54 | 105 | 10 | 10 | 0 | 5 | 45 | 25 | 5 | 0 | 0 | 0 | 0 | |
| 55–64 | 155 | 20 | 15 | 5 | 5 | 55 | 40 | 5 | 5 | 0 | 5 | 0 | |
| 65–74 | 240 | 25 | 15 | 5 | 10 | 90 | 70 | 10 | 10 | 0 | 10 | 0 | |
| 75–84 | 330 | 35 | 25 | 10 | 15 | 115 | 100 | 10 | 10 | 0 | 10 | 0 | |
| 85+ | 190 | 15 | 15 | 5 | 10 | 70 | 60 | 5 | 5 | 0 | 0 | 0 | |
| Total | 1080 | 115 | 85 | 30 | 40 | 405 | 305 | 30 | 30 | 5 | 30 | 5 | |
| 2008–12 | <45 | 65 | 10 | 5 | 0 | 0 | 30 | 15 | 0 | 0 | 0 | 0 | 0 |
| 45–54 | 105 | 15 | 10 | 0 | 5 | 45 | 20 | 0 | 5 | 0 | 0 | 0 | |
| 55–64 | 175 | 20 | 15 | 5 | 5 | 70 | 40 | 5 | 5 | 0 | 5 | 0 | |
| 65–74 | 240 | 25 | 20 | 5 | 10 | 90 | 70 | 5 | 5 | 0 | 10 | 0 | |
| 75–84 | 315 | 35 | 20 | 10 | 10 | 115 | 95 | 10 | 10 | 0 | 10 | 0 | |
| 85+ | 210 | 20 | 15 | 5 | 10 | 75 | 65 | 5 | 5 | 0 | 5 | 0 | |
| Total | 1110 | 120 | 90 | 25 | 40 | 425 | 300 | 30 | 30 | 5 | 30 | 5 | |
| 2013–17 | <45 | 70 | 10 | 5 | 0 | 0 | 30 | 15 | 0 | 0 | 0 | 0 | 0 |
| 45–54 | 105 | 10 | 10 | 0 | 5 | 50 | 20 | 0 | 5 | 0 | 0 | 0 | |
| 55–64 | 195 | 25 | 20 | 5 | 5 | 80 | 45 | 5 | 5 | 0 | 5 | 0 | |
| 65–74 | 265 | 30 | 20 | 5 | 10 | 105 | 70 | 5 | 10 | 0 | 10 | 0 | |
| 75–84 | 305 | 35 | 20 | 10 | 10 | 110 | 90 | 10 | 5 | 0 | 10 | 0 | |
| 85+ | 215 | 20 | 20 | 5 | 10 | 80 | 65 | 5 | 5 | 0 | 5 | 0 | |
| Total | 1155 | 130 | 100 | 25 | 40 | 455 | 305 | 30 | 30 | 5 | 30 | 5 | |
| 2018–22 | <45 | 70 | 5 | 5 | 0 | 0 | 30 | 15 | 0 | 0 | 0 | 0 | 0 |
| 45–54 | 110 | 10 | 10 | 0 | 5 | 55 | 20 | 0 | 0 | 0 | 0 | 0 | |
| 55–64 | 205 | 25 | 25 | 5 | 5 | 85 | 40 | 5 | 5 | 0 | 5 | 0 | |
| 65–74 | 305 | 35 | 25 | 5 | 10 | 125 | 75 | 5 | 10 | 0 | 10 | 0 | |
| 75–84 | 315 | 35 | 25 | 5 | 10 | 115 | 95 | 10 | 5 | 0 | 10 | 0 | |
| 85+ | 215 | 20 | 20 | 5 | 5 | 80 | 70 | 5 | 5 | 0 | 5 | 0 | |
| Total | 1220 | 135 | 110 | 25 | 40 | 490 | 310 | 30 | 30 | 5 | 30 | 5 | |
| 2023–27 | <45 | 65 | 5 | 5 | 0 | 5 | 25 | 10 | 0 | 0 | 0 | 0 | 0 |
| 45–54 | 125 | 10 | 10 | 0 | 5 | 65 | 20 | 0 | 0 | 0 | 0 | 0 | |
| 55–64 | 205 | 25 | 25 | 5 | 5 | 90 | 35 | 5 | 5 | 0 | 5 | 0 | |
| 65–74 | 350 | 40 | 30 | 5 | 10 | 145 | 80 | 5 | 10 | 0 | 10 | 0 | |
| 75–84 | 360 | 45 | 30 | 5 | 10 | 135 | 100 | 10 | 10 | 0 | 10 | 0 | |
| 85+ | 225 | 20 | 20 | 5 | 10 | 85 | 70 | 5 | 5 | 0 | 5 | 0 | |
| Total | 1320 | 150 | 120 | 25 | 45 | 540 | 315 | 30 | 30 | 5 | 30 | 10 | |
| 2028–32 | <45 | 55 | 5 | 5 | 0 | 5 | 25 | 10 | 0 | 0 | 0 | 0 | 0 |
| 45–54 | 125 | 10 | 10 | 0 | 5 | 60 | 20 | 0 | 0 | 0 | 0 | 0 | |
| 55–64 | 215 | 25 | 25 | 0 | 5 | 105 | 35 | 5 | 5 | 0 | 0 | 0 | |
| 65–74 | 370 | 45 | 40 | 5 | 10 | 155 | 75 | 5 | 10 | 0 | 10 | 5 | |
| 75–84 | 425 | 50 | 35 | 10 | 15 | 165 | 110 | 10 | 10 | 5 | 10 | 5 | |
| 85+ | 235 | 20 | 25 | 5 | 10 | 90 | 70 | 5 | 5 | 0 | 5 | 0 | |
| Total | 1425 | 160 | 135 | 25 | 45 | 595 | 325 | 30 | 30 | 10 | 30 | 10 | |
Abbreviations: AB, Alberta; BC, British Columbia; CA, Canada; MB, Manitoba; NB, New Brunswick; NL, Newfoundland and Labrador; NS, Nova Scotia; ON, Ontario; PE, Prince Edward Island; QC, Quebec; SK, Saskatchewan; TC, All Territories (Yukon, Northwest Territories and Nunavut).
Note: Totals may not add up due to rounding.
FIGURE 4.3.2. Age-standardized incidence rates (ASIRs) for stomach cancer by age group (– males, – females), Canada, 1983–2032.

Comments
The gram-negative bacterium Helicobacter pylori (H. pylori) is a major risk factor for stomach cancer. In addition, dietary habits, tobacco smoking, alcohol, genetic factors, occupational exposure to dusty and high temperature environments, X-radiation, gamma-radiation and socioeconomic factors contribute to stomach carcinogenesis.47,79
Elevated risk for stomach cancer has been linked to diets rich in starch, poor in protein quality, and poor in fruits and vegetables.79 A meta-analysis of prospective studies found that stomach cancer risk increases with increasing salt intake.80 High salt intake may cause damage to gastric mucosa and help H. pylori colonization.79 Dietary nitrate can also increase stomach cancer risk, as it may result in endogenous N-nitrosation.
Since the early 1960s, annual per capita fruit and vegetable consumption rates in Canada have increased by over 30%, from 84 kg of fruits and 139 kg of vegetables in 1963 to 132 kg of fruits and 179 kg of vegetables in 2009.81 The decrease in stomach cancer incidence rates may be attributable to improved healthy lifestyles such as decreased smoking42,43 and changes in diet,82 and more recently to the increased recognition and treatment of H. pylori infection.83
4. Colorectal cancer
Colorectal cancer is the third most common cancer for both males and females in Canada. In 2003–2007, the average annual number of new cases of colorectal cancer in Canada was 10 620 in males and 9010 in females, 13.1% and 12.1% of all male and female cases, respectively (Tables 4.4.1 and 4.4.2, Figure 3.9). Slightly more than two-thirds of new cases of colorectal cancer were cancers of the colon. One in 13 males and 1 in 15 females can expect to be diagnosed with colorectal cancer in their lifetime, and 1 in 29 males and 1 in 31 females can expect to die from it.1 The 5-year relative survival rate following a diagnosis of colorectal cancer was 65% in 2006–2008.1
TABLE 4.4.1.
Observed (2003–2007) and projected average annual new cases by age and province/territories combined (TC), cancers of colon and rectum, males, Canada, 2003–2032
| Period | Age | New cases | |||||||||||
|---|---|---|---|---|---|---|---|---|---|---|---|---|---|
| CA | BC | AB | SK | MB | ON | QC | NB | NS | PE | NL | TC | ||
| 2003–07 | <45 | 335 | 35 | 35 | 5 | 15 | 135 | 75 | 10 | 15 | 0 | 5 | 0 |
| 45–54 | 1060 | 120 | 110 | 30 | 40 | 405 | 250 | 30 | 35 | 5 | 30 | 5 | |
| 55–64 | 2375 | 280 | 185 | 75 | 90 | 875 | 625 | 60 | 95 | 15 | 70 | 10 | |
| 65–74 | 3285 | 405 | 250 | 115 | 105 | 1220 | 885 | 75 | 120 | 15 | 75 | 10 | |
| 75–84 | 2785 | 365 | 230 | 100 | 110 | 995 | 740 | 70 | 100 | 15 | 60 | 5 | |
| 85+ | 780 | 115 | 60 | 35 | 40 | 260 | 195 | 20 | 40 | 5 | 15 | 0 | |
| Total | 10 620 | 1320 | 865 | 365 | 400 | 3890 | 2770 | 270 | 405 | 55 | 255 | 30 | |
| 2008–12 | <45 | 335 | 40 | 35 | 10 | 10 | 135 | 65 | 5 | 10 | 0 | 5 | 0 |
| 45–54 | 1105 | 130 | 120 | 30 | 45 | 425 | 240 | 30 | 40 | 5 | 25 | 5 | |
| 55–64 | 2795 | 315 | 240 | 85 | 105 | 1065 | 690 | 75 | 100 | 15 | 85 | 15 | |
| 65–74 | 3650 | 465 | 285 | 130 | 125 | 1315 | 1000 | 90 | 135 | 20 | 95 | 15 | |
| 75–84 | 3160 | 405 | 270 | 110 | 115 | 1130 | 860 | 80 | 115 | 20 | 70 | 5 | |
| 85+ | 1045 | 155 | 85 | 40 | 45 | 355 | 270 | 25 | 45 | 5 | 15 | 0 | |
| Total | 12 090 | 1505 | 1035 | 405 | 440 | 4430 | 3130 | 310 | 450 | 60 | 295 | 40 | |
| 2013–17 | <45 | 365 | 45 | 40 | 10 | 10 | 160 | 65 | 5 | 15 | 0 | 5 | 0 |
| 45–54 | 1125 | 135 | 120 | 30 | 45 | 445 | 230 | 35 | 40 | 5 | 25 | 5 | |
| 55–64 | 3070 | 350 | 295 | 95 | 115 | 1200 | 710 | 80 | 100 | 10 | 85 | 15 | |
| 65–74 | 4455 | 560 | 360 | 150 | 155 | 1605 | 1190 | 120 | 170 | 30 | 125 | 20 | |
| 75–84 | 3445 | 445 | 300 | 120 | 120 | 1225 | 960 | 90 | 125 | 20 | 85 | 10 | |
| 85+ | 1320 | 180 | 115 | 50 | 50 | 465 | 360 | 35 | 55 | 5 | 20 | 0 | |
| Total | 13 780 | 1715 | 1235 | 455 | 495 | 5095 | 3515 | 360 | 505 | 70 | 345 | 50 | |
| 2018–22 | <45 | 420 | 55 | 50 | 10 | 10 | 190 | 70 | 5 | 15 | 0 | 5 | 0 |
| 45–54 | 1075 | 140 | 120 | 30 | 40 | 425 | 210 | 30 | 35 | 5 | 20 | 5 | |
| 55–64 | 3310 | 390 | 335 | 100 | 130 | 1320 | 725 | 85 | 110 | 10 | 80 | 15 | |
| 65–74 | 5290 | 655 | 465 | 180 | 185 | 1980 | 1340 | 145 | 190 | 30 | 155 | 30 | |
| 75–84 | 4035 | 530 | 355 | 145 | 140 | 1405 | 1150 | 110 | 155 | 30 | 110 | 10 | |
| 85+ | 1540 | 205 | 145 | 55 | 55 | 545 | 435 | 40 | 55 | 5 | 25 | 0 | |
| Total | 15 670 | 1980 | 1465 | 515 | 565 | 5870 | 3930 | 415 | 560 | 80 | 395 | 65 | |
| 2023–27 | <45 | 440 | 55 | 50 | 10 | 10 | 205 | 70 | 5 | 15 | 0 | 5 | 0 |
| 45–54 | 1155 | 150 | 135 | 35 | 35 | 485 | 215 | 25 | 35 | 5 | 20 | 5 | |
| 55–64 | 3360 | 410 | 340 | 95 | 135 | 1370 | 710 | 95 | 110 | 10 | 75 | 15 | |
| 65–74 | 5915 | 760 | 575 | 215 | 215 | 2270 | 1435 | 155 | 195 | 25 | 160 | 35 | |
| 75–84 | 5090 | 670 | 465 | 175 | 180 | 1790 | 1430 | 150 | 195 | 40 | 150 | 15 | |
| 85+ | 1780 | 245 | 165 | 65 | 60 | 625 | 520 | 45 | 70 | 10 | 30 | 5 | |
| Total | 17 735 | 2290 | 1730 | 595 | 635 | 6750 | 4385 | 480 | 625 | 85 | 435 | 75 | |
| 2028–32 | <45 | 450 | 60 | 50 | 10 | 10 | 215 | 65 | 5 | 15 | 0 | 5 | 0 |
| 45–54 | 1330 | 180 | 155 | 35 | 35 | 590 | 235 | 25 | 35 | 5 | 20 | 5 | |
| 55–64 | 3230 | 425 | 340 | 105 | 125 | 1335 | 660 | 85 | 105 | 10 | 65 | 15 | |
| 65–74 | 6465 | 850 | 655 | 220 | 240 | 2545 | 1515 | 175 | 210 | 30 | 150 | 35 | |
| 75–84 | 6155 | 800 | 605 | 215 | 220 | 2245 | 1660 | 185 | 225 | 35 | 185 | 25 | |
| 85+ | 2180 | 310 | 210 | 80 | 75 | 745 | 655 | 60 | 90 | 15 | 45 | 5 | |
| Total | 19 815 | 2625 | 2015 | 665 | 705 | 7675 | 4790 | 540 | 685 | 95 | 470 | 85 | |
Abbreviations: AB, Alberta; BC, British Columbia; CA, Canada; MB, Manitoba; NB, New Brunswick; NL, Newfoundland and Labrador; NS, Nova Scotia; ON, Ontario; PE, Prince Edward Island; QC, Quebec; SK, Saskatchewan; TC, All Territories (Yukon, Northwest Territories and Nunavut).
Note: Totals may not add up due to rounding.
TABLE 4.4.2.
Observed (2003–2007) and projected average annual new cases by age and province/territories combined (TC), cancers of colon and rectum, females, Canada, 2003–2032
| Period | Age | New cases | |||||||||||
|---|---|---|---|---|---|---|---|---|---|---|---|---|---|
| CA | BC | AB | SK | MB | ON | QC | NB | NS | PE | NL | TC | ||
| 2003–07 | <45 | 310 | 35 | 25 | 5 | 15 | 130 | 70 | 5 | 15 | 0 | 5 | 0 |
| 45–54 | 830 | 105 | 80 | 25 | 30 | 310 | 205 | 20 | 30 | 5 | 20 | 5 | |
| 55–64 | 1545 | 180 | 115 | 45 | 55 | 575 | 425 | 40 | 55 | 10 | 45 | 5 | |
| 65–74 | 2225 | 265 | 175 | 70 | 70 | 845 | 590 | 50 | 85 | 10 | 50 | 5 | |
| 75–84 | 2740 | 335 | 195 | 95 | 115 | 1020 | 740 | 70 | 110 | 15 | 50 | 5 | |
| 85+ | 1355 | 165 | 100 | 60 | 60 | 460 | 385 | 40 | 60 | 10 | 20 | 0 | |
| Total | 9010 | 1090 | 690 | 300 | 345 | 3345 | 2410 | 225 | 350 | 50 | 195 | 20 | |
| 2008–12 | <45 | 310 | 35 | 30 | 5 | 15 | 120 | 65 | 5 | 10 | 0 | 10 | 0 |
| 45–54 | 895 | 115 | 90 | 30 | 30 | 345 | 215 | 20 | 35 | 5 | 25 | 5 | |
| 55–64 | 1800 | 225 | 160 | 55 | 60 | 660 | 475 | 45 | 65 | 10 | 60 | 5 | |
| 65–74 | 2385 | 280 | 185 | 75 | 80 | 880 | 645 | 60 | 95 | 15 | 70 | 5 | |
| 75–84 | 2790 | 335 | 215 | 90 | 100 | 1025 | 785 | 65 | 105 | 15 | 55 | 5 | |
| 85+ | 1685 | 220 | 135 | 65 | 75 | 575 | 475 | 45 | 65 | 10 | 25 | 0 | |
| Total | 9870 | 1210 | 815 | 315 | 360 | 3605 | 2660 | 235 | 380 | 55 | 240 | 25 | |
| 2013–17 | <45 | 320 | 40 | 30 | 5 | 15 | 120 | 65 | 5 | 10 | 0 | 10 | 0 |
| 45–54 | 925 | 115 | 95 | 25 | 35 | 365 | 205 | 15 | 35 | 5 | 30 | 5 | |
| 55–64 | 1985 | 255 | 210 | 65 | 70 | 740 | 490 | 45 | 70 | 10 | 60 | 5 | |
| 65–74 | 2855 | 340 | 235 | 85 | 90 | 1030 | 780 | 70 | 120 | 15 | 100 | 5 | |
| 75–84 | 2880 | 350 | 240 | 90 | 95 | 1040 | 805 | 70 | 110 | 15 | 65 | 5 | |
| 85+ | 1935 | 240 | 160 | 70 | 80 | 660 | 570 | 45 | 75 | 10 | 30 | 0 | |
| Total | 10 900 | 1340 | 970 | 345 | 385 | 3955 | 2915 | 250 | 420 | 60 | 290 | 30 | |
| 2018–22 | <45 | 345 | 50 | 30 | 5 | 15 | 135 | 45 | 5 | 10 | 0 | 10 | 0 |
| 45–54 | 895 | 110 | 90 | 20 | 40 | 345 | 200 | 15 | 30 | 5 | 30 | 5 | |
| 55–64 | 2180 | 285 | 240 | 70 | 75 | 840 | 510 | 50 | 80 | 10 | 65 | 5 | |
| 65–74 | 3355 | 425 | 315 | 100 | 105 | 1220 | 870 | 75 | 140 | 20 | 115 | 10 | |
| 75–84 | 3250 | 400 | 280 | 100 | 105 | 1140 | 915 | 80 | 135 | 20 | 90 | 5 | |
| 85+ | 2110 | 265 | 195 | 70 | 75 | 715 | 630 | 50 | 75 | 15 | 30 | 5 | |
| Total | 12 135 | 1525 | 1150 | 375 | 415 | 4395 | 3170 | 275 | 465 | 65 | 340 | 35 | |
| 2023–27 | <45 | 395 | 50 | 35 | 5 | 15 | 165 | 45 | 5 | 10 | 0 | 10 | 0 |
| 45–54 | 910 | 125 | 95 | 20 | 45 | 330 | 195 | 15 | 30 | 5 | 30 | 5 | |
| 55–64 | 2245 | 295 | 240 | 65 | 80 | 900 | 485 | 50 | 75 | 10 | 65 | 5 | |
| 65–74 | 3770 | 490 | 400 | 125 | 125 | 1405 | 910 | 85 | 150 | 20 | 120 | 10 | |
| 75–84 | 4010 | 495 | 360 | 115 | 125 | 1395 | 1115 | 100 | 170 | 25 | 120 | 10 | |
| 85+ | 2290 | 295 | 220 | 80 | 75 | 770 | 670 | 55 | 85 | 15 | 40 | 5 | |
| Total | 13 620 | 1750 | 1350 | 415 | 465 | 4970 | 3420 | 305 | 520 | 75 | 385 | 40 | |
| 2028–32 | <45 | 365 | 50 | 35 | 5 | 15 | 170 | 45 | 5 | 10 | 0 | 10 | 0 |
| 45–54 | 1040 | 150 | 100 | 25 | 45 | 395 | 145 | 15 | 30 | 5 | 30 | 5 | |
| 55–64 | 2200 | 280 | 235 | 55 | 95 | 865 | 470 | 45 | 70 | 10 | 65 | 5 | |
| 65–74 | 4175 | 550 | 460 | 140 | 135 | 1615 | 945 | 90 | 165 | 25 | 125 | 15 | |
| 75–84 | 4780 | 630 | 480 | 145 | 145 | 1690 | 1260 | 115 | 200 | 25 | 140 | 15 | |
| 85+ | 2700 | 335 | 265 | 85 | 90 | 885 | 805 | 65 | 105 | 15 | 55 | 5 | |
| Total | 15 260 | 2000 | 1570 | 455 | 525 | 5620 | 3680 | 335 | 580 | 85 | 420 | 50 | |
Abbreviations: AB, Alberta; BC, British Columbia; CA, Canada; MB, Manitoba; NB, New Brunswick; NL, Newfoundland and Labrador; NS, Nova Scotia; ON, Ontario; PE, Prince Edward Island; QC, Quebec; SK, Saskatchewan; TC, All Territories (Yukon, Northwest Territories and Nunavut).
Note: Totals may not add up due to rounding.
In both males and females, the overall incidence rates of colorectal cancer have continued to decrease since 1983–1987, although the decrease was interrupted between 1993–1997 and 1998–2002 (Figure 4.4.1). This pattern appeared for all regions except in Atlantic Canada, where male rates in the last 2 observed periods increased slightly. From 2000 to 2007, colorectal cancer rates in Canada decreased significantly in both males and females by 0.8% per year (Figures 3.1 and 3.2).
FIGURE 4.4.1. Age-standardized incidence rates (ASIRs) by region, colorectal cancer, 1983–2032.

Like most other cancers, the occurrence of colorectal cancer is strongly related to age, with 87% of cases in people 55 or older in 2003–2007. The ASIRs rose steeply with age, from 3.1 per 100 000 in males aged under 45 to 510.3 per 100 000 for those aged 85 and over and, correspondingly, from 2.9 to 394.9 per 100 000 in females (Tables 4.4.3 and 4.4.4). The incidence rates in males and females were almost the same in those under 45 (Figure 4.4.2). Above this age, the male-to-female incidence rate ratio increased with age to 1.6:1 in the 65–74 age group and then decreased to 1.3:1 in those aged 85 or older.
TABLE 4.4.3.
Observed (2003–2007) and projected age-standardized incidence rates (ASIRs) by age and province/territories combined (TC), cancers of colon and rectum, males, Canada, 2003–2032
| Period | Age | ASIRs | |||||||||||
|---|---|---|---|---|---|---|---|---|---|---|---|---|---|
| CA | BC | AB | SK | MB | ON | QC | NB | NS | PE | NL | TC | ||
| 2003–07 | <45 | 3.1 | 2.7 | 3.0 | 2.3 | 3.5 | 3.2 | 3.0 | 3.4 | 4.7 | 2.6 | 3.8 | 4.3 |
| 45–54 | 42.5 | 36.7 | 41.9 | 43.1 | 47.5 | 43.5 | 40.7 | 49.7 | 45.4 | 25.8 | 67.5 | 60.7 | |
| 55–64 | 139.5 | 118.9 | 121.4 | 156.1 | 153.6 | 138.7 | 143.7 | 138.9 | 169.7 | 177.6 | 213.3 | 206.6 | |
| 65–74 | 305.2 | 266.2 | 275.7 | 339.1 | 285.3 | 299.0 | 332.0 | 288.9 | 351.9 | 324.1 | 406.4 | 530.9 | |
| 75–84 | 449.0 | 401.2 | 454.3 | 424.0 | 445.9 | 413.3 | 511.3 | 473.1 | 547.0 | 535.9 | 629.0 | 605.7 | |
| 85+ | 510.3 | 480.5 | 454.5 | 471.1 | 528.6 | 456.2 | 611.7 | 539.1 | 715.8 | 504.8 | 607.4 | 580.6 | |
| Total | 60.8 | 53.5 | 56.8 | 62.8 | 61.6 | 58.7 | 66.0 | 61.8 | 73.7 | 66.4 | 84.7 | 91.1 | |
| 2008–12 | <45 | 3.3 | 3.0 | 3.0 | 3.7 | 3.5 | 3.4 | 2.8 | 3.1 | 4.8 | 2.8 | 4.1 | 4.1 |
| 45–54 | 39.9 | 35.2 | 39.5 | 39.4 | 45.7 | 40.0 | 36.8 | 47.5 | 47.9 | 27.4 | 59.7 | 58.9 | |
| 55–64 | 136.1 | 108.8 | 120.8 | 141.9 | 145.8 | 139.7 | 136.4 | 144.5 | 157.7 | 132.9 | 222.5 | 223.2 | |
| 65–74 | 295.0 | 263.0 | 273.0 | 355.4 | 298.5 | 284.0 | 319.7 | 289.0 | 342.5 | 362.6 | 424.7 | 574.2 | |
| 75–84 | 452.3 | 397.1 | 460.2 | 462.1 | 460.6 | 420.4 | 512.2 | 488.4 | 550.6 | 556.4 | 655.2 | 673.5 | |
| 85+ | 497.4 | 464.6 | 494.3 | 480.7 | 512.2 | 440.3 | 589.4 | 521.5 | 727.2 | 592.3 | 633.8 | 903.9 | |
| Total | 59.7 | 52.1 | 56.9 | 64.7 | 61.9 | 57.6 | 63.8 | 62.2 | 72.6 | 67.0 | 87.3 | 100.9 | |
| 2013–17 | <45 | 3.5 | 3.2 | 3.2 | 3.6 | 2.7 | 3.9 | 2.7 | 3.1 | 5.2 | 2.8 | 4.2 | 4.1 |
| 45–54 | 40.5 | 35.7 | 40.0 | 39.6 | 50.3 | 39.9 | 36.6 | 55.1 | 51.7 | 28.0 | 56.9 | 58.9 | |
| 55–64 | 130.9 | 108.0 | 122.6 | 140.0 | 141.5 | 136.4 | 125.4 | 139.6 | 145.7 | 101.0 | 218.8 | 230.6 | |
| 65–74 | 285.8 | 251.6 | 261.0 | 347.0 | 300.8 | 275.9 | 306.4 | 291.9 | 338.7 | 379.7 | 438.4 | 599.9 | |
| 75–84 | 446.9 | 392.5 | 455.9 | 509.5 | 460.0 | 415.1 | 512.3 | 479.6 | 531.5 | 580.5 | 680.9 | 702.7 | |
| 85+ | 494.6 | 438.8 | 512.7 | 509.8 | 502.3 | 436.4 | 598.5 | 539.0 | 742.2 | 580.7 | 645.7 | 940.8 | |
| Total | 58.6 | 51.1 | 56.4 | 65.9 | 61.6 | 56.9 | 62.0 | 62.7 | 71.4 | 66.2 | 88.7 | 104.7 | |
| 2018–22 | <45 | 3.8 | 3.5 | 3.5 | 3.5 | 2.7 | 4.4 | 2.7 | 3.0 | 5.3 | 2.8 | 4.2 | 4.1 |
| 45–54 | 41.8 | 38.6 | 41.3 | 48.3 | 47.9 | 41.5 | 37.4 | 54.3 | 55.7 | 28.5 | 57.4 | 58.9 | |
| 55–64 | 127.4 | 109.7 | 123.7 | 134.7 | 147.6 | 131.0 | 119.3 | 149.1 | 146.1 | 105.2 | 198.6 | 235.7 | |
| 65–74 | 279.6 | 240.0 | 257.1 | 332.5 | 291.3 | 279.5 | 294.0 | 297.4 | 317.3 | 306.3 | 452.1 | 617.5 | |
| 75–84 | 434.3 | 391.0 | 440.7 | 544.1 | 457.3 | 399.2 | 501.7 | 469.7 | 536.1 | 643.4 | 702.5 | 722.7 | |
| 85+ | 487.0 | 425.0 | 519.7 | 524.5 | 509.8 | 432.1 | 597.5 | 550.2 | 688.7 | 579.1 | 670.8 | 966.0 | |
| Total | 57.7 | 50.8 | 56.1 | 66.7 | 61.2 | 56.6 | 60.3 | 63.5 | 70.1 | 63.9 | 89.0 | 107.4 | |
| 2023–27 | <45 | 3.8 | 3.5 | 3.5 | 3.4 | 2.7 | 4.5 | 2.7 | 3.0 | 5.3 | 2.8 | 4.2 | 4.1 |
| 45–54 | 45.4 | 42.6 | 44.8 | 47.6 | 38.1 | 48.5 | 37.8 | 53.9 | 60.3 | 28.7 | 57.6 | 58.9 | |
| 55–64 | 129.2 | 112.5 | 125.2 | 137.6 | 159.2 | 131.7 | 121.4 | 171.1 | 154.6 | 105.8 | 189.9 | 238.3 | |
| 65–74 | 270.4 | 242.5 | 261.3 | 335.9 | 287.6 | 273.5 | 278.7 | 290.3 | 295.6 | 246.9 | 437.6 | 626.4 | |
| 75–84 | 423.4 | 377.6 | 424.2 | 535.9 | 461.6 | 393.5 | 491.7 | 480.2 | 526.2 | 653.4 | 719.3 | 732.9 | |
| 85+ | 483.4 | 431.7 | 508.6 | 611.8 | 504.2 | 429.3 | 611.0 | 532.3 | 683.8 | 615.1 | 692.8 | 978.9 | |
| Total | 57.2 | 51.2 | 56.2 | 67.7 | 61.0 | 56.8 | 59.2 | 65.1 | 69.5 | 60.6 | 88.1 | 108.7 | |
| 2028–32 | <45 | 3.8 | 3.5 | 3.5 | 3.4 | 2.7 | 4.5 | 2.6 | 3.0 | 5.3 | 2.8 | 4.2 | 4.1 |
| 45–54 | 49.1 | 46.4 | 48.8 | 46.8 | 38.1 | 55.4 | 38.7 | 53.5 | 60.5 | 28.9 | 57.8 | 58.9 | |
| 55–64 | 132.7 | 120.5 | 128.7 | 162.3 | 153.5 | 136.5 | 124.7 | 170.1 | 163.4 | 106.5 | 190.5 | 240.9 | |
| 65–74 | 265.4 | 245.7 | 263.2 | 321.2 | 297.6 | 266.7 | 270.5 | 315.9 | 299.2 | 253.7 | 402.4 | 635.5 | |
| 75–84 | 414.9 | 364.4 | 420.8 | 518.3 | 445.0 | 399.6 | 475.4 | 489.1 | 493.5 | 518.1 | 738.5 | 743.2 | |
| 85+ | 464.0 | 427.9 | 489.1 | 621.8 | 503.3 | 406.0 | 588.6 | 530.5 | 694.7 | 694.5 | 711.4 | 991.9 | |
| Total | 57.0 | 51.9 | 56.8 | 68.2 | 60.5 | 57.5 | 58.2 | 67.0 | 69.4 | 57.1 | 86.7 | 110.0 | |
Abbreviations: AB, Alberta; BC, British Columbia; CA, Canada; MB, Manitoba; NB, New Brunswick; NL, Newfoundland and Labrador; NS, Nova Scotia; ON, Ontario; PE, Prince Edward Island; QC, Quebec; SK, Saskatchewan; TC, All Territories (Yukon, Northwest Territories and Nunavut).
TABLE 4.4.4.
Observed (2003–2007) and projected age-standardized incidence rates (ASIRs) by age and province/territories combined (TC), cancers of colon and rectum, females, Canada, 2003–2032
| Period | Age | ASIRs | |||||||||||
|---|---|---|---|---|---|---|---|---|---|---|---|---|---|
| CA | BC | AB | SK | MB | ON | QC | NB | NS | PE | NL | TC | ||
| 2003–07 | <45 | 2.9 | 2.7 | 2.4 | 2.5 | 4.0 | 3.1 | 2.8 | 2.6 | 4.2 | 4.2 | 3.9 | 4.6 |
| 45–54 | 33.1 | 31.4 | 32.1 | 33.7 | 33.9 | 32.7 | 33.0 | 29.9 | 38.3 | 38.8 | 48.7 | 62.3 | |
| 55–64 | 88.0 | 74.8 | 77.2 | 94.3 | 89.0 | 87.4 | 92.8 | 90.5 | 99.0 | 101.4 | 137.8 | 128.0 | |
| 65–74 | 185.9 | 167.1 | 177.4 | 193.5 | 171.0 | 184.0 | 193.3 | 168.4 | 226.7 | 214.0 | 263.7 | 248.8 | |
| 75–84 | 311.9 | 283.0 | 284.7 | 296.5 | 320.0 | 299.8 | 339.7 | 314.4 | 393.7 | 348.3 | 390.4 | 394.0 | |
| 85+ | 394.9 | 346.2 | 364.1 | 368.6 | 380.5 | 368.4 | 472.1 | 396.1 | 463.0 | 493.3 | 360.6 | 482.6 | |
| Total | 41.0 | 36.7 | 37.8 | 41.1 | 41.1 | 40.2 | 43.6 | 39.6 | 49.8 | 47.9 | 55.5 | 56.9 | |
| 2008–12 | <45 | 3.0 | 2.7 | 2.5 | 2.4 | 4.2 | 2.9 | 2.9 | 2.9 | 3.9 | 3.6 | 5.1 | 6.1 |
| 45–54 | 32.7 | 30.7 | 32.3 | 36.6 | 34.2 | 32.7 | 32.8 | 27.7 | 40.1 | 38.4 | 58.8 | 67.7 | |
| 55–64 | 84.4 | 75.1 | 82.3 | 88.6 | 81.5 | 82.7 | 89.6 | 79.2 | 97.7 | 99.1 | 148.6 | 111.4 | |
| 65–74 | 176.3 | 151.8 | 168.0 | 194.0 | 170.7 | 170.1 | 186.2 | 173.6 | 222.2 | 206.9 | 299.8 | 220.6 | |
| 75–84 | 304.1 | 273.0 | 290.5 | 296.0 | 299.8 | 287.6 | 337.3 | 296.6 | 380.6 | 357.0 | 406.3 | 422.1 | |
| 85+ | 387.2 | 360.2 | 388.1 | 367.4 | 391.3 | 347.5 | 456.1 | 383.2 | 460.1 | 454.6 | 388.8 | 614.2 | |
| Total | 39.8 | 35.4 | 38.1 | 40.8 | 40.0 | 38.1 | 42.7 | 38.2 | 48.9 | 46.7 | 61.6 | 57.5 | |
| 2013–17 | <45 | 3.1 | 2.9 | 2.5 | 2.4 | 4.2 | 2.9 | 2.8 | 2.8 | 3.8 | 3.7 | 5.7 | 6.0 |
| 45–54 | 34.0 | 31.2 | 32.7 | 35.0 | 38.8 | 33.7 | 33.7 | 28.4 | 42.1 | 39.9 | 67.4 | 66.5 | |
| 55–64 | 81.7 | 74.7 | 87.6 | 92.7 | 85.7 | 80.3 | 84.0 | 76.3 | 95.4 | 95.9 | 147.0 | 109.6 | |
| 65–74 | 169.4 | 143.5 | 163.9 | 183.7 | 163.0 | 161.3 | 182.4 | 160.4 | 217.1 | 198.9 | 328.6 | 217.6 | |
| 75–84 | 296.4 | 268.6 | 295.9 | 313.8 | 281.8 | 275.3 | 329.0 | 293.5 | 374.5 | 347.9 | 436.6 | 417.2 | |
| 85+ | 379.5 | 338.3 | 384.6 | 381.1 | 383.2 | 339.5 | 451.2 | 359.9 | 492.0 | 445.5 | 426.0 | 607.4 | |
| Total | 38.9 | 34.7 | 38.5 | 41.1 | 39.6 | 36.8 | 41.6 | 36.6 | 48.6 | 45.7 | 66.3 | 56.7 | |
| 2018–22 | <45 | 3.2 | 3.2 | 2.5 | 2.4 | 4.1 | 3.1 | 1.9 | 2.7 | 3.8 | 3.7 | 6.2 | 6.0 |
| 45–54 | 35.4 | 30.3 | 33.2 | 32.9 | 49.9 | 33.3 | 37.7 | 29.3 | 43.0 | 41.6 | 77.1 | 65.8 | |
| 55–64 | 82.3 | 76.7 | 89.6 | 96.0 | 85.1 | 81.2 | 82.9 | 79.4 | 97.6 | 96.6 | 157.6 | 108.5 | |
| 65–74 | 163.9 | 145.4 | 168.2 | 181.5 | 153.9 | 157.3 | 174.5 | 145.7 | 211.5 | 192.4 | 314.1 | 215.7 | |
| 75–84 | 287.9 | 255.1 | 291.4 | 319.4 | 277.8 | 262.7 | 320.9 | 287.3 | 375.2 | 338.0 | 473.0 | 413.9 | |
| 85+ | 373.6 | 338.3 | 398.7 | 375.5 | 352.8 | 329.9 | 447.2 | 360.1 | 456.7 | 438.6 | 428.1 | 602.9 | |
| Total | 38.4 | 34.6 | 39.0 | 41.1 | 39.6 | 36.2 | 40.5 | 35.7 | 48.2 | 45.1 | 68.9 | 56.2 | |
| 2023–27 | <45 | 3.4 | 3.1 | 2.5 | 2.4 | 4.1 | 3.6 | 1.9 | 2.6 | 3.8 | 4.0 | 6.4 | 6.0 |
| 45–54 | 35.7 | 34.5 | 33.1 | 32.8 | 49.7 | 31.6 | 34.9 | 28.8 | 42.9 | 41.9 | 79.8 | 65.4 | |
| 55–64 | 85.9 | 79.4 | 90.3 | 92.9 | 95.5 | 85.3 | 84.3 | 83.2 | 102.2 | 100.9 | 166.0 | 107.9 | |
| 65–74 | 161.0 | 146.0 | 176.9 | 189.4 | 163.5 | 157.0 | 164.2 | 145.4 | 208.6 | 189.1 | 301.3 | 214.7 | |
| 75–84 | 280.3 | 247.2 | 285.0 | 304.1 | 266.4 | 255.9 | 313.4 | 271.9 | 369.1 | 329.0 | 488.8 | 412.3 | |
| 85+ | 366.4 | 335.3 | 399.8 | 416.4 | 341.1 | 321.2 | 429.5 | 363.3 | 472.5 | 430.1 | 450.6 | 600.7 | |
| Total | 38.3 | 35.0 | 39.4 | 41.2 | 40.6 | 36.4 | 39.1 | 35.4 | 48.3 | 45.0 | 70.0 | 56.0 | |
| 2028–32 | <45 | 3.1 | 3.1 | 2.5 | 2.4 | 4.1 | 3.5 | 1.9 | 2.6 | 3.8 | 3.6 | 6.7 | 6.0 |
| 45–54 | 38.5 | 37.8 | 33.1 | 32.8 | 49.4 | 36.2 | 25.0 | 28.3 | 42.7 | 45.2 | 82.6 | 65.0 | |
| 55–64 | 89.5 | 78.0 | 91.2 | 88.0 | 118.6 | 85.8 | 92.2 | 86.2 | 104.2 | 105.1 | 180.9 | 107.4 | |
| 65–74 | 163.4 | 152.4 | 179.7 | 194.6 | 160.2 | 160.5 | 162.7 | 152.0 | 213.9 | 191.8 | 309.6 | 213.7 | |
| 75–84 | 273.3 | 252.5 | 293.5 | 303.0 | 254.9 | 252.7 | 299.8 | 252.2 | 360.8 | 320.8 | 452.1 | 410.6 | |
| 85+ | 356.9 | 313.2 | 388.8 | 399.9 | 343.1 | 308.0 | 423.3 | 354.6 | 463.8 | 419.0 | 477.6 | 598.5 | |
| Total | 38.6 | 35.5 | 39.9 | 41.0 | 41.9 | 36.9 | 38.1 | 35.3 | 48.4 | 45.3 | 71.3 | 55.8 | |
Abbreviations: AB, Alberta; BC, British Columbia; CA, Canada; MB, Manitoba; NB, New Brunswick; NL, Newfoundland and Labrador; NS, Nova Scotia; ON, Ontario; PE, Prince Edward Island; QC, Quebec; SK, Saskatchewan; TC, All Territories (Yukon, Northwest Territories and Nunavut).
FIGURE 4.4.2. Age-standardized incidence rates (ASIRs) for colorectal cancer by age group (– males, – females), Canada, 1983–2032.

The predictions indicate that the incidence rates of colorectal cancer for both males and females will marginally decrease and then stabilize in most regions of Canada except Quebec, where rates will show a relatively striking decrease (Figure 4.4.1). Only male rates in the Atlantic region are predicted to increase until 2013–2017, followed by a levelling off. Internal ranking of the ASIRs in geographical areas is projected to be similar for both sexes, with elevated rates in the Atlantic region, where the highest rates will be in Newfoundland and Labrador, and the lowest rates in British Columbia. The long-term trends of the rates are projected to approach convergence everywhere except in the Atlantic region.
The rates are expected to rise in younger people (<55), displaying a downward trend in the under 45 age group after 2018–2022 in males and 5 years later in females. The rates will decrease in the opposite ages (≥55), showing a reverse trend in 55–64 age range after 2018–2022 in men and 5 years sooner in women.
From 2003–2007 to 2028–2032, the ASIRs of colorectal cancer for Canada are expected to decrease by 6% in both sexes, from 60.8 to 57.0 per 100 000 for males and from 41.0 to 38.6 per 100 000 for females (Tables 4.4.3 and 4.4.4). Because of projected Canada population growth and aging, the annual number of new male cases is predicted to increase by 87%, from 10 620 to 19 815, and the number of new female cases, by 69%, from 9010 to 15 260 (Tables 4.4.1 and 4.4.2).
Comments
The decrease in colorectal cancer incidence likely reflects changes in prevalence of risk and protective factors and screening uptake. Lifestyle factors play a major role in colorectal cancer etiology. These risk factors include high consumption of red and processed meat, alcohol, smoking, obesity and physical inactivity.47,84,85 High intake of fruit and vegetables may be protective.86,87 Since the early 1960s, annual per capita red meat consumption rates in Canada increased by 25% from 65 kg (carcass weight) in 1963 to 81 kg in 1976, but has since dropped by 30% to 56 kg in 2009.81 The proportion of Canadians who were at least moderately active increased from 39% in 1994/1995 to 52% in 2003, then stabilized in 2005.88 A decrease in smoking prevalence began in the mid-1960s in males and in the mid-1980s in females in Canada.42,43 These risk factor changes may partly account for the decrease in incidence.
The use of hormone replacement therapy (estrogen plus progesterone) by women appears to reduce colorectal cancer risk;89 this may partially explain the lower incidence in females than in males, especially in those older than 55. In addition, compared with males, females in Canada have been engaging in healthier eating patterns.90,91 This may also contribute to the gender difference in colorectal cancer risk. Known modifiable risk factors and genetic factors explain only a fraction of colorectal cancer cases.36
The decrease in colorectal cancer incidence rates may also result from the introduction or increased use of screening that allows the detection and removal of adenomatous polyps.92,93 The screening rates increased from 2005 to 2008 in most provinces in Canada.94 In 2008, 32% (range: 16%–46%) of Canadians aged 50 to 74 reported having either a fecal occult blood test (FOBT) in the past 2 years or a sigmoidoscopy/colonoscopy in the past 5 years.36,94 Uptake of screening in Canada lags behind that in the US.36,95 As of 2010, all provinces had announced or started implementing organized colorectal cancer screening programs. It should be noted that these estimates may change with the increased use of screening in the near future, which may result in more color-ectal cancer cases being diagnosed in the early stages.
5. Liver cancer
In 2003–2007, liver cancer was responsible for 1.3% and 0.5% of all new cancer cases in Canadian males and females, respectively. During this period, the average annual number of new cases of liver cancer was 1025 in males and 350 in females (Tables 4.5.1 and 4.5.2). While incidence rates for all cancers combined and for most types of cancer are stable or decreasing, liver cancer incidence rates are rising significantly in both sexes. Though rare in Canada, liver cancer is the second fastest increasing cancer in both males and females (after thyroid cancer). Between 1998 and 2007, liver cancer rates rose an average of 3.6% per year in males and 2.4% per year in females (Figures 3.1 and 3.2). Approximately 95% of all liver cancer cases in the last observed period occurred in people aged 45 or older (Tables 4.5.1 and 4.5.2). The overall incidence rate of liver cancer in males was 3.5 times higher than in females (Tables 4.5.3 and 4.5.4). The male-to-female ratio of the rates ranged between 2.5:1 and 5.1:1 for all age groups. Survival is poor, with a 5-year relative survival rate of 20% in 2006–2008.1
TABLE 4.5.1.
Observed (2003–2007) and projected average annual new cases by age and province/territories combined (TC), liver cancer, males, Canada, 2003–2032
| Period | Age | New cases | |||||||||||
|---|---|---|---|---|---|---|---|---|---|---|---|---|---|
| CA | BC | AB | SK | MB | ON | QC | NB | NS | PE | NL | TC | ||
| 2003–07 | <45 | 50 | 10 | 5 | 0 | 0 | 20 | 10 | 0 | 0 | 0 | 0 | 0 |
| 45–54 | 175 | 30 | 25 | 0 | 5 | 75 | 30 | 0 | 5 | 0 | 0 | 0 | |
| 55–64 | 265 | 40 | 25 | 5 | 10 | 100 | 70 | 5 | 5 | 0 | 0 | 0 | |
| 65–74 | 285 | 45 | 25 | 5 | 10 | 105 | 85 | 5 | 5 | 0 | 5 | 0 | |
| 75–84 | 210 | 30 | 15 | 5 | 5 | 75 | 65 | 5 | 5 | 0 | 0 | 0 | |
| 85+ | 40 | 5 | 5 | 0 | 5 | 10 | 15 | 0 | 0 | 0 | 0 | 0 | |
| Total | 1025 | 160 | 95 | 20 | 30 | 390 | 280 | 15 | 20 | 5 | 10 | 0 | |
| 2008–12 | <45 | 50 | 10 | 5 | 0 | 0 | 25 | 10 | 0 | 0 | 0 | 0 | 0 |
| 45–54 | 180 | 35 | 20 | 0 | 5 | 80 | 35 | 0 | 5 | 0 | 0 | 0 | |
| 55–64 | 425 | 65 | 50 | 5 | 10 | 165 | 105 | 5 | 5 | 0 | 5 | 0 | |
| 65–74 | 375 | 55 | 30 | 5 | 15 | 145 | 110 | 5 | 10 | 0 | 5 | 0 | |
| 75–84 | 265 | 40 | 25 | 5 | 10 | 90 | 85 | 5 | 5 | 0 | 0 | 0 | |
| 85+ | 70 | 10 | 10 | 0 | 5 | 20 | 25 | 0 | 0 | 0 | 0 | 0 | |
| Total | 1370 | 210 | 140 | 20 | 45 | 520 | 370 | 20 | 25 | 5 | 10 | 0 | |
| 2013–17 | <45 | 50 | 10 | 5 | 0 | 0 | 25 | 10 | 0 | 0 | 0 | 0 | 0 |
| 45–54 | 180 | 35 | 25 | 0 | 5 | 80 | 35 | 0 | 5 | 0 | 0 | 0 | |
| 55–64 | 535 | 80 | 60 | 5 | 15 | 220 | 120 | 5 | 5 | 0 | 5 | 0 | |
| 65–74 | 575 | 85 | 50 | 10 | 20 | 215 | 160 | 5 | 15 | 0 | 5 | 0 | |
| 75–84 | 320 | 45 | 30 | 5 | 10 | 110 | 105 | 5 | 5 | 0 | 5 | 0 | |
| 85+ | 100 | 15 | 10 | 0 | 5 | 30 | 30 | 0 | 0 | 0 | 0 | 0 | |
| Total | 1760 | 270 | 185 | 25 | 55 | 680 | 460 | 20 | 30 | 5 | 15 | 0 | |
| 2018–22 | <45 | 50 | 10 | 5 | 0 | 0 | 30 | 10 | 0 | 0 | 0 | 0 | 0 |
| 45–54 | 160 | 30 | 30 | 0 | 5 | 70 | 30 | 0 | 0 | 0 | 0 | 0 | |
| 55–64 | 555 | 85 | 55 | 5 | 20 | 235 | 130 | 5 | 10 | 0 | 5 | 0 | |
| 65–74 | 855 | 125 | 90 | 10 | 25 | 325 | 210 | 10 | 15 | 5 | 10 | 0 | |
| 75–84 | 410 | 60 | 35 | 5 | 15 | 145 | 125 | 10 | 10 | 0 | 5 | 0 | |
| 85+ | 130 | 20 | 15 | 0 | 5 | 40 | 45 | 0 | 0 | 0 | 0 | 0 | |
| Total | 2165 | 330 | 230 | 30 | 70 | 845 | 550 | 25 | 40 | 10 | 20 | 0 | |
| 2023–27 | <45 | 50 | 10 | 5 | 0 | 0 | 25 | 10 | 0 | 0 | 0 | 0 | 0 |
| 45–54 | 150 | 30 | 30 | 0 | 5 | 65 | 25 | 0 | 0 | 0 | 0 | 0 | |
| 55–64 | 530 | 80 | 60 | 5 | 20 | 225 | 115 | 5 | 10 | 0 | 5 | 0 | |
| 65–74 | 1025 | 150 | 100 | 10 | 30 | 410 | 240 | 10 | 20 | 5 | 10 | 0 | |
| 75–84 | 620 | 95 | 55 | 5 | 15 | 210 | 180 | 10 | 15 | 0 | 5 | 0 | |
| 85+ | 155 | 20 | 20 | 5 | 5 | 50 | 50 | 0 | 0 | 0 | 0 | 0 | |
| Total | 2530 | 390 | 270 | 30 | 80 | 990 | 620 | 25 | 45 | 10 | 20 | 0 | |
| 2028–32 | <45 | 50 | 10 | 5 | 0 | 0 | 25 | 10 | 0 | 0 | 0 | 0 | 0 |
| 45–54 | 140 | 35 | 35 | 0 | 5 | 65 | 25 | 0 | 0 | 0 | 0 | 0 | |
| 55–64 | 475 | 75 | 60 | 5 | 20 | 200 | 105 | 5 | 5 | 0 | 5 | 0 | |
| 65–74 | 1065 | 155 | 95 | 10 | 35 | 435 | 245 | 10 | 20 | 5 | 10 | 0 | |
| 75–84 | 905 | 140 | 95 | 10 | 20 | 315 | 230 | 10 | 20 | 5 | 10 | 0 | |
| 85+ | 210 | 30 | 20 | 5 | 10 | 65 | 65 | 5 | 5 | 0 | 0 | 0 | |
| Total | 2845 | 450 | 310 | 35 | 90 | 1110 | 675 | 30 | 50 | 10 | 25 | 0 | |
Abbreviations: AB, Alberta; BC, British Columbia; CA, Canada; MB, Manitoba; NB, New Brunswick; NL, Newfoundland and Labrador; NS, Nova Scotia; ON, Ontario; PE, Prince Edward Island; QC, Quebec; SK, Saskatchewan; TC, All Territories (Yukon, Northwest Territories and Nunavut).
Note: Totals may not add up due to rounding.
TABLE 4.5.2.
Observed (2003–2007) and projected average annual new cases by age and province/territories combined (TC), liver cancer, females, Canada, 2003–2032
| Period | Age | New cases | |||||||||||
|---|---|---|---|---|---|---|---|---|---|---|---|---|---|
| CA | BC | AB | SK | MB | ON | QC | NB | NS | PE | NL | TC | ||
| 2003–07 | <45 | 20 | 5 | 0 | 0 | 0 | 10 | 5 | 0 | 0 | 0 | 0 | 0 |
| 45–54 | 35 | 5 | 5 | 0 | 0 | 15 | 5 | 0 | 0 | 0 | 0 | 0 | |
| 55–64 | 55 | 10 | 5 | 0 | 0 | 20 | 15 | 0 | 0 | 0 | 0 | 0 | |
| 65–74 | 90 | 15 | 5 | 0 | 5 | 30 | 30 | 0 | 0 | 0 | 0 | 0 | |
| 75–84 | 110 | 15 | 10 | 0 | 5 | 35 | 35 | 0 | 0 | 0 | 0 | 0 | |
| 85+ | 40 | 5 | 5 | 0 | 0 | 5 | 15 | 0 | 0 | 0 | 0 | 0 | |
| Total | 350 | 55 | 35 | 5 | 15 | 120 | 105 | 5 | 10 | 0 | 5 | 0 | |
| 2008–12 | <45 | 25 | 0 | 0 | 0 | 0 | 10 | 5 | 0 | 0 | 0 | 0 | 0 |
| 45–54 | 40 | 5 | 5 | 0 | 0 | 20 | 10 | 0 | 0 | 0 | 0 | 0 | |
| 55–64 | 75 | 15 | 10 | 0 | 5 | 25 | 20 | 0 | 0 | 0 | 0 | 0 | |
| 65–74 | 105 | 15 | 10 | 0 | 5 | 40 | 30 | 0 | 0 | 0 | 0 | 0 | |
| 75–84 | 130 | 15 | 15 | 5 | 5 | 45 | 40 | 0 | 0 | 0 | 0 | 0 | |
| 85+ | 60 | 10 | 10 | 0 | 5 | 15 | 20 | 0 | 0 | 0 | 0 | 0 | |
| Total | 435 | 65 | 45 | 10 | 15 | 150 | 125 | 5 | 5 | 0 | 5 | 0 | |
| 2013–17 | <45 | 25 | 5 | 0 | 0 | 0 | 10 | 5 | 0 | 0 | 0 | 0 | 0 |
| 45–54 | 30 | 5 | 5 | 0 | 0 | 20 | 10 | 0 | 0 | 0 | 0 | 0 | |
| 55–64 | 95 | 20 | 10 | 0 | 5 | 40 | 20 | 0 | 0 | 0 | 0 | 0 | |
| 65–74 | 135 | 20 | 10 | 0 | 5 | 50 | 40 | 0 | 0 | 0 | 0 | 0 | |
| 75–84 | 145 | 20 | 15 | 5 | 5 | 50 | 50 | 0 | 0 | 0 | 0 | 0 | |
| 85+ | 80 | 10 | 10 | 0 | 5 | 20 | 30 | 0 | 0 | 0 | 0 | 0 | |
| Total | 520 | 80 | 55 | 10 | 20 | 185 | 150 | 5 | 10 | 0 | 5 | 0 | |
| 2018–22 | <45 | 30 | 5 | 0 | 0 | 0 | 10 | 5 | 0 | 0 | 0 | 0 | 0 |
| 45–54 | 25 | 5 | 5 | 0 | 0 | 15 | 10 | 0 | 0 | 0 | 0 | 0 | |
| 55–64 | 110 | 25 | 10 | 0 | 5 | 50 | 25 | 0 | 0 | 0 | 0 | 0 | |
| 65–74 | 175 | 30 | 15 | 5 | 5 | 65 | 45 | 0 | 0 | 0 | 0 | 0 | |
| 75–84 | 165 | 20 | 20 | 5 | 5 | 55 | 55 | 0 | 0 | 0 | 0 | 0 | |
| 85+ | 100 | 15 | 15 | 0 | 5 | 25 | 35 | 0 | 0 | 0 | 0 | 0 | |
| Total | 605 | 100 | 65 | 10 | 20 | 220 | 170 | 10 | 10 | 0 | 5 | 0 | |
| 2023–27 | <45 | 30 | 5 | 5 | 0 | 0 | 15 | 5 | 0 | 0 | 0 | 0 | 0 |
| 45–54 | 25 | 5 | 5 | 0 | 0 | 10 | 10 | 0 | 0 | 0 | 0 | 0 | |
| 55–64 | 90 | 25 | 10 | 0 | 5 | 45 | 25 | 0 | 0 | 0 | 0 | 0 | |
| 65–74 | 215 | 35 | 20 | 5 | 5 | 90 | 45 | 5 | 0 | 0 | 0 | 0 | |
| 75–84 | 210 | 30 | 25 | 5 | 5 | 65 | 60 | 5 | 5 | 0 | 0 | 0 | |
| 85+ | 110 | 15 | 15 | 0 | 5 | 25 | 40 | 0 | 0 | 0 | 0 | 0 | |
| Total | 680 | 115 | 80 | 10 | 25 | 250 | 185 | 10 | 10 | 0 | 5 | 0 | |
| 2028–32 | <45 | 30 | 5 | 5 | 0 | 0 | 15 | 5 | 0 | 0 | 0 | 0 | 0 |
| 45–54 | 30 | 10 | 5 | 0 | 0 | 15 | 10 | 0 | 0 | 0 | 0 | 0 | |
| 55–64 | 70 | 25 | 10 | 0 | 5 | 35 | 20 | 0 | 0 | 0 | 0 | 0 | |
| 65–74 | 235 | 40 | 25 | 5 | 5 | 105 | 50 | 5 | 0 | 0 | 0 | 0 | |
| 75–84 | 265 | 40 | 35 | 5 | 10 | 85 | 70 | 5 | 5 | 0 | 5 | 0 | |
| 85+ | 125 | 15 | 20 | 0 | 5 | 30 | 40 | 0 | 0 | 0 | 0 | 0 | |
| Total | 760 | 130 | 95 | 10 | 25 | 285 | 195 | 10 | 10 | 0 | 5 | 0 | |
Abbreviations: AB, Alberta; BC, British Columbia; CA, Canada; MB, Manitoba; NB, New Brunswick; NL, Newfoundland and Labrador; NS, Nova Scotia; ON, Ontario; PE, Prince Edward Island; QC, Quebec; SK, Saskatchewan; TC, All Territories (Yukon, Northwest Territories and Nunavut).
Note: Totals may not add up due to rounding.
TABLE 4.5.3.
Observed (2003–2007) and projected age-standardized incidence rates (ASIRs) by age and province/territories combined (TC), liver cancer, males, Canada, 2003–2032
| Period | Age | ASIRs | |||||||||||
|---|---|---|---|---|---|---|---|---|---|---|---|---|---|
| CA | BC | AB | SK | MB | ON | QC | NB | NS | PE | NL | TC | ||
| 2003–07 | <45 | 0.5 | 0.6 | 0.3 | 0.5 | 0.3 | 0.5 | 0.5 | 0.2 | 0.1 | 1.0 | 0.2 | 0.0 |
| 45–54 | 7.1 | 9.7 | 8.8 | 2.4 | 5.1 | 8.3 | 5.2 | 1.9 | 4.5 | 3.6 | 3.8 | 2.6 | |
| 55–64 | 15.3 | 16.1 | 16.6 | 10.9 | 13.8 | 15.8 | 16.2 | 10.3 | 12.5 | 4.3 | 6.5 | 10.9 | |
| 65–74 | 26.5 | 28.2 | 25.9 | 14.7 | 22.3 | 25.6 | 32.4 | 15.9 | 17.4 | 19.4 | 18.0 | 10.9 | |
| 75–84 | 33.7 | 35.9 | 32.1 | 16.9 | 31.3 | 30.4 | 44.9 | 25.0 | 22.6 | 36.8 | 16.7 | 0.0 | |
| 85+ | 27.3 | 21.5 | 38.6 | 16.0 | 38.9 | 20.9 | 43.1 | 14.6 | 18.6 | 26.6 | 8.9 | 0.0 | |
| Total | 5.7 | 6.3 | 5.9 | 3.3 | 5.0 | 5.7 | 6.5 | 3.3 | 3.8 | 4.3 | 3.0 | 2.0 | |
| 2008–12 | <45 | 0.5 | 0.6 | 0.4 | 0.5 | 0.4 | 0.6 | 0.5 | 0.2 | 0.2 | 0.4 | 0.3 | 0.4 |
| 45–54 | 6.6 | 9.1 | 7.2 | 2.8 | 5.8 | 7.4 | 5.2 | 2.1 | 3.4 | 5.1 | 3.4 | 2.2 | |
| 55–64 | 20.5 | 22.3 | 24.4 | 9.1 | 15.4 | 21.4 | 20.6 | 8.4 | 10.6 | 15.8 | 10.7 | 5.2 | |
| 65–74 | 30.4 | 30.1 | 30.2 | 16.4 | 32.4 | 31.2 | 35.2 | 17.5 | 21.7 | 23.4 | 15.9 | 11.7 | |
| 75–84 | 37.9 | 40.7 | 42.3 | 20.4 | 33.9 | 32.7 | 50.1 | 28.5 | 29.1 | 29.2 | 19.9 | 25.8 | |
| 85+ | 34.0 | 32.4 | 49.3 | 22.6 | 41.0 | 27.0 | 50.8 | 22.4 | 10.9 | 26.2 | 17.8 | 48.3 | |
| Total | 6.6 | 7.2 | 7.2 | 3.5 | 6.1 | 6.6 | 7.4 | 3.5 | 4.0 | 5.1 | 3.5 | 3.2 | |
| 2013–17 | <45 | 0.5 | 0.7 | 0.4 | 0.5 | 0.4 | 0.7 | 0.5 | 0.2 | 0.2 | 0.4 | 0.3 | 0.4 |
| 45–54 | 6.4 | 9.0 | 8.6 | 2.8 | 5.8 | 7.0 | 5.3 | 2.2 | 3.4 | 5.0 | 3.4 | 2.0 | |
| 55–64 | 22.7 | 24.6 | 24.9 | 9.5 | 17.9 | 25.1 | 21.6 | 7.3 | 10.5 | 17.5 | 11.9 | 4.7 | |
| 65–74 | 36.8 | 37.7 | 37.1 | 17.4 | 36.8 | 36.8 | 41.3 | 17.9 | 27.6 | 28.4 | 19.3 | 10.7 | |
| 75–84 | 41.6 | 41.5 | 47.2 | 21.5 | 38.6 | 37.1 | 54.9 | 31.2 | 29.3 | 32.1 | 21.8 | 23.6 | |
| 85+ | 36.8 | 35.9 | 48.3 | 23.8 | 46.3 | 28.7 | 52.1 | 22.3 | 16.3 | 28.3 | 19.3 | 44.0 | |
| Total | 7.4 | 8.0 | 8.0 | 3.6 | 6.8 | 7.5 | 8.1 | 3.6 | 4.5 | 5.7 | 3.9 | 2.9 | |
| 2018–22 | <45 | 0.5 | 0.7 | 0.4 | 0.5 | 0.4 | 0.7 | 0.5 | 0.2 | 0.2 | 0.4 | 0.2 | 0.3 |
| 45–54 | 6.3 | 8.8 | 9.7 | 2.8 | 5.8 | 6.8 | 5.3 | 2.2 | 3.4 | 4.8 | 3.3 | 1.8 | |
| 55–64 | 21.4 | 23.2 | 21.0 | 9.7 | 19.8 | 23.5 | 21.0 | 7.4 | 10.4 | 16.5 | 11.2 | 4.3 | |
| 65–74 | 45.3 | 46.5 | 49.1 | 18.0 | 40.1 | 46.0 | 46.5 | 16.5 | 27.3 | 34.9 | 23.7 | 9.7 | |
| 75–84 | 44.1 | 43.9 | 45.1 | 22.3 | 41.9 | 40.6 | 54.6 | 32.7 | 37.6 | 34.0 | 23.1 | 21.5 | |
| 85+ | 41.7 | 40.7 | 58.7 | 24.7 | 50.2 | 31.2 | 60.6 | 22.9 | 20.5 | 32.2 | 21.9 | 40.3 | |
| Total | 7.9 | 8.6 | 8.7 | 3.7 | 7.4 | 8.1 | 8.5 | 3.5 | 4.8 | 6.1 | 4.2 | 2.7 | |
| 2023–27 | <45 | 0.4 | 0.7 | 0.4 | 0.5 | 0.4 | 0.6 | 0.5 | 0.2 | 0.2 | 0.3 | 0.2 | 0.3 |
| 45–54 | 5.7 | 9.0 | 10.3 | 2.8 | 5.8 | 6.6 | 4.2 | 2.2 | 3.4 | 4.4 | 3.0 | 1.7 | |
| 55–64 | 20.3 | 22.1 | 22.1 | 9.9 | 20.7 | 21.5 | 20.0 | 7.4 | 10.4 | 15.6 | 10.6 | 4.0 | |
| 65–74 | 46.8 | 48.1 | 44.5 | 18.4 | 41.8 | 49.2 | 46.4 | 14.5 | 27.2 | 36.0 | 24.5 | 8.8 | |
| 75–84 | 51.8 | 53.0 | 52.2 | 22.7 | 43.7 | 46.3 | 61.3 | 33.0 | 44.2 | 39.9 | 27.1 | 19.6 | |
| 85+ | 42.7 | 37.1 | 55.8 | 25.1 | 52.3 | 34.4 | 59.8 | 26.5 | 18.2 | 32.9 | 22.4 | 36.8 | |
| Total | 8.2 | 8.9 | 8.7 | 3.8 | 7.6 | 8.3 | 8.5 | 3.5 | 5.0 | 6.3 | 4.3 | 2.4 | |
| 2028–32 | <45 | 0.4 | 0.7 | 0.4 | 0.5 | 0.4 | 0.6 | 0.5 | 0.2 | 0.2 | 0.3 | 0.2 | 0.3 |
| 45–54 | 5.2 | 9.1 | 10.9 | 2.8 | 5.8 | 6.2 | 4.0 | 2.2 | 3.4 | 4.0 | 2.7 | 1.6 | |
| 55–64 | 19.5 | 21.3 | 23.2 | 10.0 | 21.7 | 20.4 | 19.6 | 7.5 | 10.4 | 15.0 | 10.2 | 3.6 | |
| 65–74 | 43.7 | 45.3 | 37.5 | 18.7 | 43.6 | 45.4 | 43.4 | 14.5 | 27.1 | 33.7 | 22.9 | 8.0 | |
| 75–84 | 61.4 | 63.2 | 64.6 | 23.1 | 45.5 | 56.5 | 66.0 | 30.6 | 44.0 | 47.3 | 32.2 | 17.8 | |
| 85+ | 44.9 | 42.3 | 50.0 | 25.6 | 54.4 | 36.5 | 57.5 | 25.1 | 30.0 | 34.6 | 23.6 | 33.5 | |
| Total | 8.2 | 9.1 | 8.8 | 3.9 | 7.9 | 8.3 | 8.3 | 3.4 | 5.1 | 6.3 | 4.3 | 2.2 | |
Abbreviations: AB, Alberta; BC, British Columbia; CA, Canada; MB, Manitoba; NB, New Brunswick; NL, Newfoundland and Labrador; NS, Nova Scotia; ON, Ontario; PE, Prince Edward Island; QC, Quebec; SK, Saskatchewan; TC, All Territories (Yukon, Northwest Territories and Nunavut).
TABLE 4.5.4.
Observed (2003–2007) and projected age-standardized incidence rates (ASIRs) by age and province/territories combined (TC), liver cancer, females, Canada, 2003–2032
| Period | Age | ASIRs | |||||||||||
|---|---|---|---|---|---|---|---|---|---|---|---|---|---|
| CA | BC | AB | SK | MB | ON | QC | NB | NS | PE | NL | TC | ||
| 2003–07 | <45 | 0.2 | 0.3 | 0.2 | 0.2 | 0.1 | 0.2 | 0.2 | 0.1 | 0.4 | 0.0 | 0.3 | 0.0 |
| 45–54 | 1.4 | 2.0 | 1.3 | 0.3 | 1.7 | 1.6 | 1.0 | 0.3 | 0.5 | 2.0 | 0.9 | 0.0 | |
| 55–64 | 3.2 | 3.9 | 4.4 | 0.8 | 2.7 | 3.2 | 3.2 | 1.7 | 2.6 | 2.1 | 0.5 | 8.9 | |
| 65–74 | 7.7 | 9.1 | 7.6 | 6.1 | 7.4 | 7.0 | 9.1 | 6.2 | 5.2 | 3.4 | 5.0 | 0.0 | |
| 75–84 | 12.5 | 12.7 | 15.1 | 6.5 | 17.1 | 10.8 | 16.7 | 3.1 | 7.5 | 0.0 | 4.8 | 0.0 | |
| 85+ | 11.0 | 13.3 | 18.2 | 10.2 | 10.0 | 4.9 | 17.9 | 10.5 | 6.4 | 10.7 | 7.8 | 0.0 | |
| Total | 1.6 | 1.9 | 1.9 | 1.0 | 1.7 | 1.5 | 1.9 | 0.9 | 1.3 | 0.7 | 0.9 | 0.8 | |
| 2008–12 | <45 | 0.2 | 0.2 | 0.2 | 0.1 | 0.1 | 0.2 | 0.2 | 0.1 | 0.3 | 0.1 | 0.1 | 0.1 |
| 45–54 | 1.4 | 1.8 | 1.2 | 0.8 | 1.1 | 1.8 | 1.2 | 0.8 | 0.6 | 0.6 | 0.8 | 0.6 | |
| 55–64 | 3.6 | 5.2 | 4.0 | 2.1 | 3.8 | 3.3 | 3.6 | 2.0 | 1.6 | 1.6 | 2.0 | 1.6 | |
| 65–74 | 7.8 | 8.5 | 7.8 | 4.6 | 9.4 | 7.4 | 9.4 | 4.3 | 3.5 | 3.5 | 4.4 | 3.5 | |
| 75–84 | 14.4 | 14.4 | 17.3 | 8.6 | 13.8 | 12.7 | 18.2 | 8.0 | 7.0 | 6.4 | 8.2 | 6.5 | |
| 85+ | 13.7 | 15.0 | 25.7 | 8.1 | 16.7 | 8.0 | 20.8 | 7.6 | 9.3 | 6.1 | 7.8 | 6.1 | |
| Total | 1.8 | 2.0 | 2.0 | 1.1 | 1.8 | 1.7 | 2.1 | 1.0 | 1.0 | 0.8 | 1.0 | 0.8 | |
| 2013–17 | <45 | 0.3 | 0.2 | 0.2 | 0.2 | 0.1 | 0.3 | 0.2 | 0.1 | 0.3 | 0.1 | 0.1 | 0.1 |
| 45–54 | 1.2 | 1.9 | 1.2 | 0.7 | 1.1 | 1.6 | 1.3 | 0.6 | 0.6 | 0.5 | 0.7 | 0.5 | |
| 55–64 | 4.0 | 6.0 | 4.0 | 2.4 | 4.0 | 4.4 | 3.5 | 2.2 | 1.5 | 1.8 | 2.3 | 1.8 | |
| 65–74 | 8.1 | 9.1 | 8.3 | 4.8 | 7.6 | 7.5 | 9.3 | 4.5 | 3.4 | 3.6 | 4.6 | 3.6 | |
| 75–84 | 15.1 | 14.6 | 18.7 | 8.9 | 19.3 | 12.9 | 19.6 | 8.4 | 6.6 | 6.7 | 8.6 | 6.8 | |
| 85+ | 16.1 | 15.6 | 27.0 | 9.6 | 16.7 | 10.6 | 23.4 | 8.9 | 8.8 | 7.2 | 9.1 | 7.2 | |
| Total | 1.9 | 2.2 | 2.1 | 1.1 | 1.9 | 1.8 | 2.2 | 1.1 | 1.0 | 0.8 | 1.1 | 0.9 | |
| 2018–22 | <45 | 0.3 | 0.2 | 0.2 | 0.2 | 0.1 | 0.3 | 0.2 | 0.2 | 0.4 | 0.1 | 0.2 | 0.1 |
| 45–54 | 1.0 | 2.0 | 1.2 | 0.6 | 1.1 | 1.3 | 1.4 | 0.5 | 0.6 | 0.4 | 0.5 | 0.4 | |
| 55–64 | 4.2 | 6.3 | 4.0 | 2.5 | 4.1 | 4.9 | 3.9 | 2.3 | 1.5 | 1.8 | 2.4 | 1.9 | |
| 65–74 | 8.6 | 10.4 | 8.6 | 5.1 | 7.9 | 8.1 | 9.2 | 4.7 | 3.2 | 3.8 | 4.9 | 3.8 | |
| 75–84 | 14.6 | 13.6 | 19.8 | 8.7 | 18.5 | 12.7 | 18.4 | 8.1 | 6.3 | 6.5 | 8.3 | 6.5 | |
| 85+ | 18.1 | 19.3 | 27.8 | 10.7 | 16.9 | 11.4 | 24.6 | 10.0 | 8.3 | 8.1 | 10.2 | 8.1 | |
| Total | 1.9 | 2.3 | 2.2 | 1.2 | 1.9 | 1.9 | 2.1 | 1.1 | 1.0 | 0.9 | 1.1 | 0.9 | |
| 2023–27 | <45 | 0.3 | 0.2 | 0.2 | 0.2 | 0.1 | 0.3 | 0.2 | 0.2 | 0.4 | 0.1 | 0.2 | 0.1 |
| 45–54 | 1.0 | 2.0 | 1.2 | 0.6 | 1.1 | 1.2 | 1.5 | 0.6 | 0.6 | 0.4 | 0.6 | 0.4 | |
| 55–64 | 3.5 | 6.5 | 4.0 | 2.1 | 4.1 | 4.2 | 4.1 | 1.9 | 1.5 | 1.6 | 2.0 | 1.6 | |
| 65–74 | 9.2 | 11.2 | 8.8 | 5.5 | 8.1 | 9.9 | 8.5 | 5.1 | 3.1 | 4.1 | 5.2 | 4.1 | |
| 75–84 | 14.8 | 14.1 | 20.4 | 8.8 | 15.1 | 12.2 | 17.5 | 8.2 | 5.9 | 6.6 | 8.4 | 6.6 | |
| 85+ | 17.2 | 16.3 | 28.6 | 10.2 | 26.5 | 10.7 | 24.5 | 9.5 | 7.8 | 7.7 | 9.8 | 7.7 | |
| Total | 1.9 | 2.4 | 2.2 | 1.1 | 1.9 | 1.9 | 2.1 | 1.1 | 1.0 | 0.9 | 1.1 | 0.9 | |
| 2028–32 | <45 | 0.3 | 0.2 | 0.2 | 0.2 | 0.1 | 0.3 | 0.2 | 0.2 | 0.5 | 0.1 | 0.2 | 0.1 |
| 45–54 | 1.0 | 2.1 | 1.2 | 0.6 | 1.1 | 1.3 | 1.5 | 0.6 | 0.6 | 0.4 | 0.6 | 0.5 | |
| 55–64 | 2.9 | 6.7 | 4.0 | 1.7 | 4.2 | 3.5 | 4.3 | 1.6 | 1.5 | 1.3 | 1.7 | 1.3 | |
| 65–74 | 9.2 | 11.5 | 9.0 | 5.4 | 8.3 | 10.3 | 8.9 | 5.1 | 3.0 | 4.1 | 5.2 | 4.1 | |
| 75–84 | 15.2 | 15.6 | 21.0 | 9.0 | 15.4 | 13.1 | 16.3 | 8.4 | 5.6 | 6.8 | 8.6 | 6.8 | |
| 85+ | 16.5 | 15.8 | 29.4 | 9.8 | 17.2 | 10.4 | 20.6 | 9.1 | 7.4 | 7.3 | 9.3 | 7.4 | |
| Total | 1.9 | 2.4 | 2.3 | 1.1 | 1.9 | 1.9 | 2.1 | 1.0 | 1.0 | 0.8 | 1.1 | 0.8 | |
Abbreviations: AB, Alberta; BC, British Columbia; CA, Canada; MB, Manitoba; NB, New Brunswick; NL, Newfoundland and Labrador; NS, Nova Scotia; ON, Ontario; PE, Prince Edward Island; QC, Quebec; SK, Saskatchewan; TC, All Territories (Yukon, Northwest Territories and Nunavut).
Figure 4.5.1 shows that the ASIRs of liver cancer are predicted to increase and eventually plateau in both sexes in all regions except in the Atlantic region for females, where it will stay unchanged. Male incidence rates in Ontario and Quebec are expected to reach a peak after 20 years and then decrease marginally. Female rates are projected to peak in Quebec after 10 years and in the Prairies and for Canada as a whole 5 years later. The rates in Atlantic Canada are predicted to be between 1.5 and 2.3 times lower than in the other regions for both males and females from 2008–2012 to 2028–2032, a result of the increased divergence in the rates over the observed periods. British Columbia is projected to experience the highest incidence rates across the country.
FIGURE 4.5.1. Age-standardized incidence rates (ASIRs) by region, liver cancer, 1983–2032.

Rates for Canadian men in the 45–54 age group are predicted to have reached a peak already and to decrease until 2028–2032 (Figure 4.5.2). The gap in rates between the sexes will widen over time for those aged 55 or older, peaking in 2013–2017 and 2023–2027 for the 55–64 and 65–74 age groups, respectively.
FIGURE 4.5.2. Age-standardized incidence rates (ASIRs) for liver cancer by age group (– males, – females), Canada, 1983–2032.

From 2003–2007 to 2028–2032, the Canadian ASIRs for liver cancer are projected to increase by 43% in males, from 5.7 to 8.2 per 100 000, and by 15% in females, from 1.6 to 1.9 per 100 000 (Tables 4.5.3 and 4.5.4). The annual number of new cases in males is projected to increase by 178%, from 1025 to 2845, and the number of new cases in females is projected to increase by 117%, from 350 to 760 (Tables 4.5.1 and 4.5.2).
Comments
Chronic infection with HBV or hepatitis C virus (HCV) is the primary risk factor for the development of most liver cancers worldwide.47,86,96,97 A recent report from the Mayo Clinic based on a US cohort suggests the main cause of the increase in liver cancer has been the rise in chronic HCV infection.97 HCV is much more common than HBV in Canada, with incidence rates in 2000 of 61.0 and 3.2 per 100 000 people, respectively.98 The incidence rates of HCV for both Canadian males and females increased sharply beginning in 1992, the start of widespread testing for HCV, reached their peaks in 1995, and have since decreased but remained high.98,99 Given a latency period of approximately 20 years between the time of infection with HCV and the onset of liver cancer,100,101 HCV is likely responsible for a substantial proportion of the observed and projected increases in liver cancer incidence. The higher rates of liver cancer in British Columbia may be in part explained by the higher HCV rates in this province.99
Although HCV is the leading risk factor for liver cancer in Western countries—especially in Canada—HBV is implicated in over two-thirds of liver cancers in the developing countries.86 HBV infection accounts for 23% of all hepatocellular carcinoma in developed countries.1 HBV vaccination in early childhood greatly reduces the likelihood of hepatitis B.76 Currently, all provinces and territories have a childhood hepatitis B immunization program.102,103 The ongoing increasing trends of liver cancer incidence in Canada, especially in British Columbia, are possibly linked to the increasing immigration from endemic areas of HBV.75–78,104 The number of immigrants in Canada reached 6.2 million, or 20% of the total population, in 2006, with Asia and the Middle East accounting for 41% of the immigrant population.105,106 In British Columbia, the proportion of immigrants was 27% of the total provincial population in 2006, with 54% of the immigrant population coming from Asia and the Middle East, and 28% from Eastern Asia, mainly China. East Asia is one of the areas with high HBV prevalence.76–78 Significantly higher incidence rates of liver cancer have been found in immigrants from South-East Asia and North-East Asia.104
Other risk factors include increased rates of alcohol abuse, which increases the risk of liver cirrhosis and therefore the risk of liver cancer, tobacco smoking, diabetes, obesity and non-alcoholic fatty liver disease.86,107–109 Recent Canadian data suggest that the prevalence rates of obesity have nearly doubled in adults from 1978/79 to 2012.51,72,73 This increase may have contributed to the increased incidence trends of liver cancer.51,72,73,110
6. Pancreas cancer
Cancer of the pancreas is the second most common digestive system cancer after colorectal cancer. One in 71 males and 1 in 69 females can expect to be diagnosed with pancreas cancer in their lifetime, and 1 in 72 males and 1 in 71 females can expect to die from it.1 The average annual number of new cases in 2003–2007 was 1810 in males and 1900 in females (Tables 4.6.1 and 4.6.2), approximately 2.2% and 2.6% of all male and female cancer cases, respectively. Pancreas cancer is the fourth leading cause of cancer death in Canada and has the lowest 5-year relative survival rate, at just 8% in 2006–2008.1 This poor prognosis results from 80% of the cancers being diagnosed at a late stage.111
TABLE 4.6.1.
Observed (2003–2007) and projected average annual new cases by age and province/territories combined (TC), pancreas cancer, males, Canada, 2003–2032
| Period | Age | New cases | |||||||||||
|---|---|---|---|---|---|---|---|---|---|---|---|---|---|
| CA | BC | AB | SK | MB | ON | QC | NB | NS | PE | NL | TC | ||
| 2003–07 | <45 | 50 | 5 | 5 | 5 | 5 | 20 | 10 | 0 | 0 | 0 | 0 | 0 |
| 45–54 | 195 | 25 | 20 | 5 | 5 | 65 | 60 | 5 | 5 | 0 | 5 | 0 | |
| 55–64 | 415 | 55 | 35 | 10 | 15 | 145 | 120 | 15 | 15 | 0 | 5 | 0 | |
| 65–74 | 540 | 70 | 50 | 15 | 20 | 185 | 155 | 20 | 15 | 5 | 5 | 0 | |
| 75–84 | 465 | 65 | 40 | 15 | 20 | 155 | 135 | 15 | 15 | 0 | 5 | 0 | |
| 85+ | 150 | 25 | 20 | 5 | 5 | 40 | 35 | 5 | 5 | 0 | 0 | 0 | |
| Total | 1810 | 245 | 165 | 60 | 70 | 610 | 520 | 60 | 60 | 10 | 20 | 5 | |
| 2008–12 | <45 | 60 | 5 | 5 | 0 | 0 | 20 | 10 | 0 | 0 | 0 | 0 | 0 |
| 45–54 | 210 | 25 | 20 | 5 | 5 | 70 | 60 | 5 | 10 | 0 | 0 | 0 | |
| 55–64 | 495 | 65 | 45 | 15 | 15 | 175 | 135 | 15 | 15 | 5 | 5 | 0 | |
| 65–74 | 615 | 75 | 50 | 20 | 25 | 205 | 175 | 25 | 20 | 5 | 10 | 0 | |
| 75–84 | 520 | 75 | 45 | 15 | 20 | 165 | 150 | 20 | 15 | 5 | 5 | 0 | |
| 85+ | 205 | 30 | 25 | 10 | 10 | 60 | 55 | 10 | 5 | 0 | 0 | 0 | |
| Total | 2100 | 280 | 190 | 65 | 75 | 700 | 590 | 70 | 70 | 10 | 25 | 5 | |
| 2013–17 | <45 | 60 | 5 | 5 | 0 | 0 | 20 | 10 | 0 | 0 | 0 | 0 | 0 |
| 45–54 | 215 | 20 | 20 | 5 | 5 | 75 | 55 | 5 | 10 | 0 | 0 | 0 | |
| 55–64 | 575 | 80 | 50 | 15 | 15 | 200 | 160 | 15 | 15 | 5 | 10 | 0 | |
| 65–74 | 755 | 95 | 65 | 20 | 30 | 255 | 210 | 35 | 25 | 5 | 15 | 0 | |
| 75–84 | 570 | 80 | 50 | 15 | 20 | 185 | 160 | 25 | 20 | 5 | 5 | 0 | |
| 85+ | 255 | 40 | 30 | 10 | 10 | 75 | 70 | 10 | 10 | 0 | 0 | 0 | |
| Total | 2430 | 320 | 220 | 70 | 80 | 805 | 660 | 85 | 75 | 10 | 35 | 5 | |
| 2018–22 | <45 | 60 | 5 | 5 | 0 | 0 | 20 | 10 | 0 | 0 | 0 | 0 | 0 |
| 45–54 | 235 | 20 | 20 | 5 | 5 | 75 | 50 | 5 | 5 | 0 | 0 | 0 | |
| 55–64 | 625 | 85 | 55 | 20 | 15 | 215 | 165 | 15 | 15 | 5 | 10 | 0 | |
| 65–74 | 915 | 125 | 85 | 25 | 30 | 310 | 245 | 35 | 25 | 5 | 20 | 0 | |
| 75–84 | 675 | 90 | 55 | 20 | 25 | 220 | 190 | 30 | 20 | 5 | 10 | 0 | |
| 85+ | 295 | 45 | 35 | 10 | 10 | 90 | 80 | 15 | 10 | 0 | 0 | 0 | |
| Total | 2805 | 370 | 255 | 80 | 90 | 935 | 735 | 100 | 80 | 15 | 40 | 5 | |
| 2023–27 | <45 | 65 | 5 | 5 | 0 | 0 | 20 | 10 | 0 | 0 | 0 | 0 | 0 |
| 45–54 | 245 | 20 | 20 | 5 | 5 | 70 | 50 | 5 | 5 | 0 | 0 | 0 | |
| 55–64 | 640 | 80 | 55 | 20 | 15 | 230 | 150 | 15 | 15 | 5 | 10 | 0 | |
| 65–74 | 1065 | 150 | 100 | 30 | 35 | 360 | 285 | 35 | 25 | 5 | 20 | 0 | |
| 75–84 | 855 | 120 | 75 | 25 | 30 | 285 | 230 | 45 | 25 | 5 | 15 | 0 | |
| 85+ | 340 | 50 | 40 | 10 | 10 | 110 | 90 | 15 | 10 | 0 | 0 | 0 | |
| Total | 3210 | 425 | 295 | 90 | 100 | 1070 | 815 | 110 | 85 | 15 | 45 | 5 | |
| 2028–32 | <45 | 65 | 5 | 5 | 0 | 0 | 20 | 10 | 0 | 0 | 0 | 0 | 0 |
| 45–54 | 245 | 20 | 20 | 5 | 5 | 70 | 50 | 5 | 5 | 0 | 0 | 0 | |
| 55–64 | 675 | 75 | 55 | 15 | 15 | 235 | 135 | 15 | 15 | 5 | 10 | 0 | |
| 65–74 | 1170 | 160 | 105 | 35 | 35 | 395 | 300 | 35 | 30 | 5 | 25 | 0 | |
| 75–84 | 1055 | 160 | 105 | 30 | 35 | 350 | 275 | 45 | 25 | 5 | 15 | 0 | |
| 85+ | 430 | 65 | 50 | 10 | 15 | 135 | 110 | 20 | 10 | 0 | 5 | 0 | |
| Total | 3635 | 485 | 340 | 105 | 110 | 1210 | 885 | 120 | 90 | 20 | 50 | 5 | |
Abbreviations: AB, Alberta; BC, British Columbia; CA, Canada; MB, Manitoba; NB, New Brunswick; NL, Newfoundland and Labrador; NS, Nova Scotia; ON, Ontario; PE, Prince Edward Island; QC, Quebec; SK, Saskatchewan; TC, All Territories (Yukon, Northwest Territories and Nunavut).
Note: Totals may not add up due to rounding.
TABLE 4.6.2.
Observed (2003–2007) and projected average annual new cases by age and province/territories combined (TC), pancreas cancer, females, Canada, 2003–2032
| Period | Age | New cases | |||||||||||
|---|---|---|---|---|---|---|---|---|---|---|---|---|---|
| CA | BC | AB | SK | MB | ON | QC | NB | NS | PE | NL | TC | ||
| 2003–07 | <45 | 45 | 5 | 5 | 0 | 0 | 20 | 15 | 0 | 0 | 0 | 0 | 0 |
| 45–54 | 140 | 15 | 15 | 5 | 5 | 50 | 45 | 0 | 5 | 0 | 0 | 0 | |
| 55–64 | 290 | 45 | 25 | 10 | 10 | 95 | 80 | 10 | 10 | 0 | 5 | 0 | |
| 65–74 | 465 | 60 | 45 | 15 | 15 | 155 | 140 | 15 | 15 | 0 | 5 | 0 | |
| 75–84 | 625 | 85 | 50 | 25 | 20 | 215 | 180 | 20 | 25 | 5 | 0 | 0 | |
| 85+ | 335 | 45 | 30 | 15 | 15 | 105 | 100 | 15 | 15 | 0 | 0 | 0 | |
| Total | 1900 | 250 | 170 | 70 | 70 | 640 | 555 | 55 | 65 | 10 | 10 | 0 | |
| 2008–12 | <45 | 50 | 5 | 5 | 0 | 0 | 20 | 15 | 0 | 0 | 0 | 0 | 0 |
| 45–54 | 150 | 15 | 15 | 5 | 5 | 55 | 50 | 5 | 5 | 0 | 0 | 0 | |
| 55–64 | 355 | 50 | 35 | 15 | 10 | 120 | 100 | 10 | 10 | 0 | 5 | 0 | |
| 65–74 | 530 | 75 | 50 | 15 | 15 | 175 | 155 | 15 | 20 | 0 | 5 | 0 | |
| 75–84 | 630 | 85 | 55 | 25 | 20 | 210 | 190 | 20 | 20 | 5 | 5 | 0 | |
| 85+ | 425 | 65 | 40 | 15 | 20 | 135 | 120 | 15 | 15 | 0 | 0 | 0 | |
| Total | 2140 | 290 | 200 | 75 | 70 | 715 | 635 | 65 | 70 | 10 | 15 | 5 | |
| 2013–17 | <45 | 60 | 5 | 5 | 0 | 0 | 30 | 15 | 0 | 0 | 0 | 0 | 0 |
| 45–54 | 150 | 10 | 15 | 5 | 5 | 50 | 50 | 5 | 5 | 0 | 0 | 0 | |
| 55–64 | 410 | 55 | 50 | 20 | 10 | 135 | 110 | 10 | 15 | 0 | 5 | 0 | |
| 65–74 | 655 | 95 | 60 | 15 | 20 | 220 | 195 | 20 | 20 | 5 | 10 | 0 | |
| 75–84 | 660 | 90 | 60 | 20 | 20 | 220 | 200 | 20 | 20 | 5 | 5 | 0 | |
| 85+ | 490 | 75 | 50 | 20 | 15 | 155 | 145 | 15 | 15 | 0 | 0 | 0 | |
| Total | 2425 | 330 | 240 | 85 | 75 | 810 | 715 | 70 | 80 | 10 | 20 | 5 | |
| 2018–22 | <45 | 65 | 5 | 5 | 0 | 0 | 30 | 20 | 0 | 0 | 0 | 0 | 0 |
| 45–54 | 160 | 10 | 15 | 5 | 5 | 60 | 50 | 5 | 5 | 0 | 0 | 0 | |
| 55–64 | 455 | 55 | 55 | 20 | 15 | 155 | 125 | 15 | 10 | 0 | 5 | 0 | |
| 65–74 | 800 | 115 | 85 | 25 | 25 | 270 | 220 | 25 | 25 | 5 | 10 | 0 | |
| 75–84 | 770 | 115 | 70 | 25 | 25 | 245 | 225 | 25 | 25 | 5 | 5 | 0 | |
| 85+ | 535 | 80 | 55 | 15 | 20 | 170 | 160 | 20 | 15 | 0 | 5 | 0 | |
| Total | 2785 | 380 | 285 | 90 | 90 | 930 | 800 | 80 | 85 | 10 | 25 | 5 | |
| 2023–27 | <45 | 65 | 5 | 5 | 0 | 0 | 30 | 20 | 0 | 0 | 0 | 0 | 0 |
| 45–54 | 190 | 10 | 15 | 5 | 5 | 80 | 50 | 0 | 5 | 0 | 0 | 0 | |
| 55–64 | 455 | 45 | 55 | 20 | 10 | 150 | 125 | 10 | 10 | 0 | 5 | 0 | |
| 65–74 | 940 | 135 | 110 | 35 | 30 | 315 | 240 | 25 | 25 | 5 | 15 | 0 | |
| 75–84 | 985 | 155 | 90 | 25 | 30 | 315 | 280 | 30 | 30 | 5 | 10 | 0 | |
| 85+ | 600 | 95 | 65 | 20 | 20 | 185 | 170 | 20 | 20 | 5 | 5 | 0 | |
| Total | 3230 | 440 | 340 | 105 | 100 | 1075 | 880 | 90 | 90 | 15 | 35 | 5 | |
| 2028–32 | <45 | 70 | 5 | 5 | 0 | 0 | 35 | 20 | 0 | 0 | 0 | 0 | 0 |
| 45–54 | 205 | 10 | 20 | 5 | 5 | 85 | 55 | 0 | 5 | 0 | 0 | 0 | |
| 55–64 | 475 | 40 | 50 | 20 | 10 | 175 | 120 | 10 | 10 | 0 | 5 | 0 | |
| 65–74 | 1045 | 130 | 120 | 40 | 30 | 355 | 265 | 30 | 25 | 5 | 15 | 0 | |
| 75–84 | 1215 | 190 | 125 | 40 | 40 | 390 | 315 | 40 | 40 | 5 | 15 | 0 | |
| 85+ | 725 | 120 | 75 | 20 | 25 | 215 | 205 | 25 | 25 | 5 | 5 | 0 | |
| Total | 3730 | 500 | 400 | 120 | 115 | 1250 | 975 | 105 | 100 | 15 | 40 | 5 | |
Abbreviations: AB, Alberta; BC, British Columbia; CA, Canada; MB, Manitoba; NB, New Brunswick; NL, Newfoundland and Labrador; NS, Nova Scotia; ON, Ontario; PE, Prince Edward Island; QC, Quebec; SK, Saskatchewan; TC, All Territories (Yukon, Northwest Territories and Nunavut).
Note: Totals may not add up due to rounding.
Between 2003 and 2007, the incidence rates of pancreas cancer increased steadily with age, to 97.1 per 100 000 in males aged 85 or older and 97.8 per 100 000 in females of the same age (Tables 4.6.3 and 4.6.4). Overall, males were 21% more likely to be diagnosed than were females (ASIR of 10.3 and 8.5, respectively). The disease was rarely seen before age 45, with only 3% and 2% of all male and female pancreas cancer cases diagnosed in that age group, respectively (Tables 4.6.1 and 4.6.2). Approximately 64% of the new pancreas cancers in males occurred in those aged 65 or older; the corresponding percentage for females was 75%. Figure 4.6.2 shows the ASIRs decreasing and then stabilizing over time for both sexes. The male-to-female ratio of ASIRs decreased over time also, becoming stable or uniform in the last observation period (2003–2007) in each age group.
TABLE 4.6.3.
Observed (2003–2007) and projected age-standardized incidence rates (ASIRs) by age and province/territories combined (TC), pancreas cancer, males, Canada, 2003–2032
| Period | Age | ASIRs | |||||||||||
|---|---|---|---|---|---|---|---|---|---|---|---|---|---|
| CA | BC | AB | SK | MB | ON | QC | NB | NS | PE | NL | TC | ||
| 2003–07 | <45 | 0.5 | 0.3 | 0.4 | 0.9 | 0.7 | 0.4 | 0.5 | 0.8 | 0.5 | 0.4 | 0.4 | 0.6 |
| 45–54 | 7.7 | 7.4 | 7.0 | 6.0 | 5.7 | 7.2 | 9.6 | 6.4 | 8.7 | 11.2 | 8.4 | 7.6 | |
| 55–64 | 24.5 | 23.8 | 23.2 | 23.9 | 23.7 | 22.6 | 27.7 | 30.3 | 27.3 | 26.7 | 17.5 | 20.0 | |
| 65–74 | 50.1 | 44.3 | 53.4 | 48.1 | 54.1 | 45.1 | 58.4 | 76.3 | 49.0 | 73.7 | 28.8 | 34.4 | |
| 75–84 | 74.7 | 73.6 | 76.3 | 72.1 | 83.5 | 64.1 | 92.4 | 90.8 | 78.5 | 74.0 | 33.5 | 57.5 | |
| 85+ | 97.1 | 100.1 | 136.0 | 95.8 | 102.9 | 73.6 | 115.3 | 136.0 | 137.9 | 26.6 | 17.9 | 0.0 | |
| Total | 10.3 | 9.7 | 10.8 | 10.2 | 10.9 | 9.1 | 12.2 | 13.7 | 11.2 | 11.7 | 6.0 | 7.3 | |
| 2008–12 | <45 | 0.5 | 0.3 | 0.4 | 0.7 | 0.6 | 0.5 | 0.5 | 0.7 | 0.4 | 0.6 | 0.4 | 0.4 |
| 45–54 | 7.6 | 6.9 | 6.2 | 7.4 | 6.0 | 6.4 | 9.2 | 6.7 | 9.9 | 8.6 | 5.4 | 6.5 | |
| 55–64 | 24.1 | 23.2 | 23.5 | 23.4 | 19.6 | 22.7 | 26.9 | 28.9 | 22.8 | 27.5 | 17.8 | 20.6 | |
| 65–74 | 49.5 | 43.5 | 46.7 | 48.3 | 57.6 | 44.5 | 56.4 | 79.2 | 49.0 | 56.5 | 50.6 | 37.9 | |
| 75–84 | 74.6 | 71.2 | 78.3 | 73.7 | 80.4 | 62.2 | 89.7 | 113.3 | 84.0 | 85.1 | 35.3 | 48.4 | |
| 85+ | 96.7 | 95.8 | 134.7 | 91.9 | 90.9 | 76.4 | 114.3 | 144.5 | 116.6 | 110.4 | 18.4 | 46.7 | |
| Total | 10.3 | 9.5 | 10.3 | 10.1 | 10.5 | 9.0 | 11.9 | 14.6 | 10.8 | 11.8 | 7.3 | 7.5 | |
| 2013–17 | <45 | 0.6 | 0.3 | 0.4 | 0.7 | 0.6 | 0.4 | 0.5 | 0.7 | 0.4 | 0.7 | 0.4 | 0.4 |
| 45–54 | 7.8 | 5.9 | 6.4 | 7.5 | 5.9 | 6.8 | 8.4 | 7.0 | 10.1 | 8.9 | 5.4 | 6.4 | |
| 55–64 | 24.4 | 24.6 | 21.8 | 23.7 | 18.0 | 22.5 | 27.8 | 23.4 | 19.2 | 27.9 | 20.4 | 20.2 | |
| 65–74 | 48.6 | 43.1 | 46.8 | 51.2 | 53.3 | 43.7 | 53.8 | 83.6 | 49.9 | 55.5 | 58.7 | 37.1 | |
| 75–84 | 73.8 | 68.4 | 73.3 | 72.2 | 82.4 | 62.9 | 86.4 | 128.2 | 74.3 | 84.2 | 44.3 | 47.7 | |
| 85+ | 94.7 | 94.8 | 124.8 | 79.8 | 98.8 | 72.5 | 113.6 | 154.8 | 113.1 | 108.0 | 26.6 | 46.0 | |
| Total | 10.3 | 9.3 | 9.9 | 10.2 | 10.2 | 8.9 | 11.6 | 15.1 | 10.2 | 11.7 | 8.5 | 7.4 | |
| 2018–22 | <45 | 0.6 | 0.3 | 0.4 | 0.7 | 0.6 | 0.4 | 0.5 | 0.7 | 0.4 | 0.6 | 0.4 | 0.3 |
| 45–54 | 9.1 | 5.8 | 6.3 | 7.5 | 5.7 | 7.3 | 8.4 | 7.2 | 10.2 | 10.4 | 5.4 | 6.3 | |
| 55–64 | 24.1 | 23.5 | 20.1 | 26.9 | 18.3 | 21.3 | 27.2 | 24.3 | 22.9 | 27.4 | 22.2 | 19.7 | |
| 65–74 | 48.4 | 45.0 | 47.6 | 47.8 | 46.5 | 43.8 | 53.4 | 75.2 | 41.6 | 55.2 | 57.6 | 36.3 | |
| 75–84 | 72.8 | 67.6 | 68.9 | 74.2 | 84.3 | 63.0 | 83.0 | 134.1 | 71.7 | 83.1 | 59.5 | 46.7 | |
| 85+ | 93.9 | 92.9 | 129.3 | 88.5 | 92.9 | 72.5 | 107.5 | 185.2 | 102.8 | 107.1 | 34.8 | 45.4 | |
| Total | 10.3 | 9.3 | 9.7 | 10.4 | 9.7 | 8.9 | 11.3 | 15.2 | 9.8 | 11.7 | 9.2 | 7.2 | |
| 2023–27 | <45 | 0.6 | 0.3 | 0.4 | 0.7 | 0.6 | 0.4 | 0.5 | 0.7 | 0.4 | 0.6 | 0.4 | 0.3 |
| 45–54 | 9.5 | 5.7 | 6.2 | 7.5 | 5.7 | 6.8 | 8.4 | 7.3 | 10.2 | 10.8 | 5.4 | 6.2 | |
| 55–64 | 24.7 | 21.4 | 20.9 | 26.9 | 18.1 | 22.4 | 25.4 | 24.7 | 23.0 | 28.2 | 23.2 | 19.4 | |
| 65–74 | 48.8 | 47.9 | 44.5 | 49.4 | 44.1 | 43.4 | 55.3 | 63.7 | 39.1 | 55.7 | 59.7 | 35.5 | |
| 75–84 | 71.3 | 68.0 | 70.0 | 77.3 | 78.0 | 62.1 | 79.6 | 137.1 | 72.1 | 81.3 | 60.9 | 45.7 | |
| 85+ | 92.3 | 90.0 | 115.2 | 80.0 | 101.8 | 74.1 | 105.3 | 193.0 | 89.2 | 105.3 | 39.1 | 44.5 | |
| Total | 10.3 | 9.3 | 9.5 | 10.5 | 9.4 | 8.9 | 11.1 | 14.6 | 9.5 | 11.8 | 9.5 | 7.1 | |
| 2028–32 | <45 | 0.6 | 0.3 | 0.4 | 0.7 | 0.6 | 0.4 | 0.5 | 0.7 | 0.4 | 0.6 | 0.4 | 0.3 |
| 45–54 | 8.9 | 5.6 | 6.1 | 7.5 | 5.6 | 6.8 | 8.4 | 7.4 | 10.3 | 10.2 | 5.4 | 6.1 | |
| 55–64 | 27.8 | 21.2 | 20.7 | 27.0 | 18.0 | 23.7 | 25.5 | 25.2 | 23.0 | 31.7 | 24.2 | 19.1 | |
| 65–74 | 47.8 | 45.8 | 42.5 | 54.4 | 44.9 | 41.5 | 53.6 | 64.7 | 43.8 | 54.6 | 61.8 | 34.8 | |
| 75–84 | 71.0 | 71.8 | 71.5 | 71.5 | 69.2 | 62.6 | 79.5 | 118.5 | 59.1 | 81.1 | 58.8 | 44.6 | |
| 85+ | 91.2 | 91.6 | 115.0 | 88.8 | 100.7 | 73.6 | 100.0 | 197.1 | 92.6 | 104.1 | 55.0 | 43.5 | |
| Total | 10.5 | 9.3 | 9.4 | 10.8 | 9.1 | 8.9 | 10.9 | 14.1 | 9.4 | 12.0 | 9.8 | 6.9 | |
Abbreviations: AB, Alberta; BC, British Columbia; CA, Canada; MB, Manitoba; NB, New Brunswick; NL, Newfoundland and Labrador; NS, Nova Scotia; ON, Ontario; PE, Prince Edward Island; QC, Quebec; SK, Saskatchewan; TC, All Territories (Yukon, Northwest Territories and Nunavut).
TABLE 4.6.4.
Observed (2003–2007) and projected age-standardized incidence rates (ASIRs) by age and province/territories combined (TC), pancreas cancer, females, Canada, 2003–2032
| Period | Age | ASIRs | |||||||||||
|---|---|---|---|---|---|---|---|---|---|---|---|---|---|
| CA | BC | AB | SK | MB | ON | QC | NB | NS | PE | NL | TC | ||
| 2003–07 | <45 | 0.4 | 0.2 | 0.3 | 0.3 | 0.2 | 0.4 | 0.5 | 0.6 | 0.5 | 0.4 | 0.5 | 1.2 |
| 45–54 | 5.6 | 4.7 | 6.5 | 4.9 | 5.7 | 5.3 | 6.9 | 3.9 | 5.4 | 3.5 | 3.5 | 5.8 | |
| 55–64 | 16.5 | 18.2 | 17.1 | 18.1 | 17.7 | 14.6 | 17.8 | 18.0 | 20.0 | 20.9 | 10.6 | 0.0 | |
| 65–74 | 38.8 | 37.5 | 45.0 | 41.3 | 40.1 | 33.9 | 45.8 | 44.0 | 37.0 | 22.0 | 15.3 | 40.7 | |
| 75–84 | 71.2 | 71.5 | 75.7 | 82.5 | 55.4 | 62.9 | 83.7 | 84.5 | 84.7 | 71.5 | 15.1 | 60.8 | |
| 85+ | 97.8 | 95.7 | 113.8 | 86.7 | 86.1 | 82.7 | 120.7 | 142.5 | 100.6 | 118.0 | 15.7 | 0.0 | |
| Total | 8.5 | 8.3 | 9.3 | 9.0 | 7.9 | 7.5 | 10.0 | 9.9 | 9.2 | 7.7 | 3.4 | 6.4 | |
| 2008–12 | <45 | 0.5 | 0.2 | 0.3 | 0.4 | 0.3 | 0.5 | 0.7 | 0.5 | 0.5 | 0.4 | 0.4 | 0.5 |
| 45–54 | 5.5 | 4.0 | 6.1 | 7.0 | 4.6 | 5.0 | 7.3 | 4.7 | 5.1 | 5.0 | 2.9 | 5.4 | |
| 55–64 | 16.7 | 16.8 | 18.8 | 21.4 | 15.8 | 14.8 | 19.1 | 20.6 | 17.5 | 15.0 | 8.4 | 15.4 | |
| 65–74 | 39.0 | 39.6 | 44.5 | 42.9 | 37.9 | 34.0 | 45.2 | 44.3 | 41.0 | 35.1 | 20.3 | 37.4 | |
| 75–84 | 68.4 | 69.1 | 74.2 | 72.6 | 62.3 | 59.3 | 82.6 | 83.4 | 75.6 | 61.6 | 23.6 | 64.0 | |
| 85+ | 97.4 | 105.4 | 111.3 | 95.1 | 93.7 | 82.4 | 115.2 | 131.6 | 99.9 | 87.7 | 25.4 | 78.3 | |
| Total | 8.5 | 8.3 | 9.3 | 9.4 | 7.9 | 7.5 | 10.1 | 10.0 | 8.9 | 7.6 | 3.8 | 7.9 | |
| 2013–17 | <45 | 0.6 | 0.2 | 0.3 | 0.4 | 0.3 | 0.7 | 0.7 | 0.5 | 0.5 | 0.5 | 0.4 | 0.5 |
| 45–54 | 5.5 | 2.8 | 6.0 | 7.1 | 4.1 | 4.7 | 8.3 | 4.7 | 5.1 | 4.9 | 2.9 | 5.0 | |
| 55–64 | 16.9 | 16.3 | 21.0 | 28.1 | 15.1 | 14.8 | 19.0 | 20.4 | 17.0 | 15.2 | 8.4 | 14.8 | |
| 65–74 | 38.9 | 40.9 | 41.7 | 38.1 | 38.5 | 34.1 | 45.5 | 44.0 | 38.7 | 35.0 | 25.6 | 35.5 | |
| 75–84 | 68.1 | 70.2 | 75.5 | 74.6 | 63.6 | 58.4 | 81.0 | 82.7 | 73.0 | 61.3 | 29.6 | 65.4 | |
| 85+ | 95.7 | 103.0 | 116.9 | 96.8 | 77.4 | 78.5 | 115.0 | 138.8 | 112.1 | 86.1 | 31.8 | 87.2 | |
| Total | 8.5 | 8.2 | 9.4 | 9.7 | 7.7 | 7.5 | 10.2 | 10.0 | 8.7 | 7.7 | 4.4 | 7.8 | |
| 2018–22 | <45 | 0.6 | 0.2 | 0.3 | 0.4 | 0.3 | 0.7 | 0.8 | 0.5 | 0.5 | 0.5 | 0.4 | 0.4 |
| 45–54 | 6.3 | 2.8 | 6.0 | 7.1 | 3.8 | 6.0 | 9.2 | 4.7 | 5.1 | 5.7 | 2.9 | 4.6 | |
| 55–64 | 17.2 | 14.7 | 20.6 | 28.4 | 14.4 | 15.0 | 20.1 | 20.3 | 14.6 | 15.4 | 8.4 | 14.0 | |
| 65–74 | 39.1 | 40.1 | 44.6 | 42.7 | 38.7 | 34.5 | 44.1 | 46.4 | 37.8 | 35.2 | 31.0 | 34.1 | |
| 75–84 | 68.2 | 74.3 | 75.2 | 78.8 | 63.7 | 56.8 | 79.4 | 80.7 | 75.3 | 61.4 | 35.6 | 62.9 | |
| 85+ | 94.7 | 99.8 | 111.3 | 83.2 | 95.5 | 77.7 | 114.4 | 130.3 | 95.0 | 85.2 | 38.2 | 92.2 | |
| Total | 8.6 | 8.1 | 9.5 | 10.1 | 7.8 | 7.6 | 10.3 | 10.0 | 8.4 | 7.8 | 5.1 | 7.5 | |
| 2023–27 | <45 | 0.6 | 0.2 | 0.3 | 0.4 | 0.3 | 0.7 | 0.8 | 0.5 | 0.5 | 0.5 | 0.4 | 0.4 |
| 45–54 | 7.3 | 2.8 | 6.0 | 7.2 | 3.6 | 7.6 | 9.3 | 4.7 | 5.1 | 6.6 | 2.9 | 4.2 | |
| 55–64 | 17.3 | 11.6 | 20.5 | 28.6 | 13.9 | 14.4 | 21.7 | 20.3 | 14.6 | 15.6 | 8.4 | 13.0 | |
| 65–74 | 40.0 | 40.0 | 48.5 | 53.6 | 39.0 | 35.1 | 43.3 | 46.3 | 35.6 | 36.0 | 36.2 | 32.8 | |
| 75–84 | 68.8 | 77.2 | 71.2 | 69.3 | 67.5 | 57.7 | 78.4 | 81.5 | 70.5 | 61.9 | 41.4 | 59.3 | |
| 85+ | 95.7 | 106.3 | 119.1 | 97.9 | 90.6 | 77.1 | 108.6 | 136.3 | 100.5 | 86.1 | 44.3 | 89.9 | |
| Total | 8.9 | 8.0 | 9.7 | 10.6 | 7.8 | 7.8 | 10.3 | 10.0 | 8.1 | 8.0 | 5.7 | 7.1 | |
| 2028–32 | <45 | 0.6 | 0.2 | 0.3 | 0.4 | 0.3 | 0.7 | 0.8 | 0.5 | 0.5 | 0.5 | 0.4 | 0.4 |
| 45–54 | 7.5 | 2.7 | 5.9 | 7.2 | 3.5 | 7.6 | 9.4 | 4.7 | 5.1 | 6.8 | 2.9 | 3.8 | |
| 55–64 | 19.4 | 11.5 | 20.5 | 28.7 | 13.5 | 17.4 | 23.3 | 20.3 | 14.6 | 17.4 | 8.4 | 11.9 | |
| 65–74 | 40.6 | 35.6 | 47.7 | 53.9 | 38.5 | 35.2 | 45.0 | 46.2 | 32.0 | 36.5 | 42.0 | 30.9 | |
| 75–84 | 69.3 | 75.9 | 77.4 | 80.0 | 69.2 | 58.1 | 75.0 | 85.0 | 70.4 | 62.3 | 47.9 | 57.0 | |
| 85+ | 95.9 | 112.4 | 113.0 | 93.7 | 98.0 | 74.4 | 107.5 | 126.0 | 101.6 | 86.3 | 51.2 | 83.3 | |
| Total | 9.1 | 7.7 | 9.8 | 11.0 | 7.9 | 8.0 | 10.4 | 10.1 | 7.9 | 8.2 | 6.4 | 6.7 | |
Abbreviations: AB, Alberta; BC, British Columbia; CA, Canada; MB, Manitoba; NB, New Brunswick; NL, Newfoundland and Labrador; NS, Nova Scotia; ON, Ontario; PE, Prince Edward Island; QC, Quebec; SK, Saskatchewan; TC, All Territories (Yukon, Northwest Territories and Nunavut).
FIGURE 4.6.2. Age-standardized incidence rates (ASIRs) for pancreas cancer by age group (– males, – females), Canada, 1983–2032.

Figure 4.6.1 shows that the downward trend in overall male ASIRs had levelled off in the last 2 observation periods, while the rates in females had changed little throughout the entire observation period. During 1998–2007, ASIRs remained relatively constant, although they decreased non-significantly in males by 0.3% per year and increased non-significantly by 0.4% per year in females (Figures 3.1 and 3.2).
FIGURE 4.6.1. Age-standardized incidence rates (ASIRs) by region, pancreas cancer, 1983–2032.

The projections of male pancreas cancer incidence show stability in the predicted rates for Canada and its regions except in Quebec and the Atlantic region (Figure 4.6.1). The male rates in Quebec are expected to decrease by 10%, from 12.2 per 100 000 in 2003–2007 to 10.9 per 100 000 in 2028–2032, whereas incidence rates in the Atlantic region will rise by 16%, from 10.9 to 12.7 per 100 000 over the same period. For females, the analysis shows predicted stability in the Canadian and regional rates. The Atlantic region, which used to have relatively low incidence, is predicted to experience the highest rates, while Ontario will continue to have the lowest incidence in males. For females, Quebec and Ontario will remain in their respective highest and lowest ranking in the rates.
The overall age-specific incidence rates in Canada are expected to stabilize in each age group (Figure 4.6.2). The difference in ASIRs between sexes appears to narrow with advancing age, starting from age 45.
From 2003–2007 to 2028–2032, the pancreas cancer ASIRs in Canada are projected to remain stable in males, at 10.3 to 10.5 per 100 000, and to increase by 7% in females, from 8.5 to 9.1 per 100 000 (Tables 4.6.3 and 4.6.4). The annual number of male cases is projected to increase by 101%, from 1810 to 3635, and the number of female cases, by 96%, from 1900 to 3730 (Tables 4.6.1 and 4.6.2).
Comments
Lower incidence rates for cancer of the pancreas occurred in Newfoundland and Labrador, especially in females. These low rates are likely artefactual, given that death certificate information for Newfoundland and Labrador was not available for the data used in this study (see details in Chapter 5).
The International Agency for Research on Cancer (IARC) stated that tobacco smoking is the most important modifiable risk factor for pancreas cancer.47,86 Smoking doubles the risk of developing pancreas cancer compared with not smoking,86 and about 27% to 33% of pancreas cancers are caused by tobacco smoking.52,112 The latency time between starting smoking and developing pancreas cancer is approximately 20 years.113,114 The evidence also suggests that between 5% and 10% of all cases of pancreas cancer have a hereditary component,115 and having a family history of pancreas cancer significantly increases the risk (odds ratio = 3.2, 95% CI: 1.8 –5.6).115 Certain hereditary conditions such as hereditary pancreatitis also increase the risk.53,111,116
The role of dietary factors in the etiology of pancreas cancer is inconclusive. The 2012 World Cancer Research Fund/American Institute for Cancer Research (WCRF/AICR) report stated that there is limited and inconclusive evidence that foods containing folate protect against pancreas cancer, but suggests that diets high in fruits decrease risk and diets high in red meats increase risk.117 A recent large pooled analysis of 14 prospective cohort studies published during 1994–2010 concluded that dietary folate intake is not associated with the risk.118 Moderate consumption of coffee and alcohol do not appear to increase risk, but heavy alcohol drinking and alcohol bingeing may increase risk.86
The 2012 summary of 23 prospective studies indicates an increase in pancreas cancer risk with increasing BMI.119 The 2 systematic reviews report that occupational physical activity is protective, while recreational activity exposures are not significantly associated with the risk for pancreas cancer.120,121 Recent meta- and pooled analyses show that diabetes is associated with 40% to 94% increased risk of pancreas cancer.122,123 However it remains unclear whether diabetes is an early manifestation or an etiological factor of pancreas cancer.122
Similar trends in pancreas cancer incidence rates are observed in Great Britain.124 The observed changes in the ASIRs of pancreas cancer for males and females partly reflects the change patterns of smoking in Canadian population,42,43 given the latency period.
7. Larynx cancer
During 2003–2007, the average annual number of new cases of laryngeal cancer in Canada was 900 in males and 195 in females, approximately 1.1% and 0.3% of all new male and female cancer cases, respectively (Tables 4.7.1 and 4.7.2). Cancer of the larynx was much more common in males than in females. The male-to-female ratio of ASIRs was 5.1:1 (Tables 4.7.3 and 4.7.4). The lifetime risk of developing laryngeal cancer in Canada is 1 in 170 for males and 1 in 743 for females.1 The lifetime probability of dying from the disease is 1 in 407 for males1 and 1 in 1760 for females (estimate based on the same data used for the related reference). The 5-year relative survival rate for larynx cancer in Canada was 63% for both sexes combined between 2006 and 2008.1
TABLE 4.7.1.
Observed (2003–2007) and projected average annual new cases by age and province/territories combined (TC), larynx cancer, males, Canada, 2003–2032
| Period | Age | New cases | |||||||||||
|---|---|---|---|---|---|---|---|---|---|---|---|---|---|
| CA | BC | AB | SK | MB | ON | QC | NB | NS | PE | NL | TC | ||
| 2003–07 | <45 | 20 | 0 | 0 | 0 | 0 | 5 | 5 | 0 | 0 | 0 | 0 | 0 |
| 45–54 | 110 | 10 | 10 | 5 | 0 | 40 | 35 | 0 | 5 | 0 | 0 | 0 | |
| 55–64 | 260 | 25 | 20 | 5 | 5 | 90 | 90 | 5 | 10 | 0 | 5 | 0 | |
| 65–74 | 295 | 25 | 15 | 10 | 10 | 105 | 100 | 10 | 10 | 0 | 5 | 0 | |
| 75–84 | 185 | 20 | 10 | 5 | 5 | 65 | 60 | 5 | 5 | 0 | 5 | 0 | |
| 85+ | 35 | 5 | 0 | 0 | 0 | 15 | 10 | 0 | 0 | 0 | 0 | 0 | |
| Total | 900 | 90 | 55 | 25 | 25 | 320 | 305 | 25 | 30 | 5 | 20 | 0 | |
| 2008–12 | <45 | 15 | 0 | 0 | 0 | 0 | 5 | 5 | 0 | 0 | 0 | 0 | 0 |
| 45–54 | 105 | 10 | 10 | 5 | 5 | 40 | 30 | 5 | 5 | 0 | 5 | 0 | |
| 55–64 | 255 | 25 | 20 | 10 | 5 | 95 | 80 | 5 | 10 | 0 | 5 | 0 | |
| 65–74 | 270 | 30 | 15 | 5 | 5 | 95 | 90 | 10 | 10 | 0 | 5 | 0 | |
| 75–84 | 185 | 20 | 10 | 5 | 5 | 65 | 65 | 5 | 5 | 0 | 5 | 0 | |
| 85+ | 45 | 5 | 5 | 0 | 0 | 15 | 15 | 0 | 0 | 0 | 0 | 0 | |
| Total | 870 | 90 | 60 | 25 | 20 | 315 | 285 | 25 | 30 | 5 | 20 | 0 | |
| 2013–17 | <45 | 10 | 0 | 0 | 0 | 0 | 5 | 5 | 0 | 0 | 0 | 0 | 0 |
| 45–54 | 85 | 10 | 10 | 5 | 0 | 35 | 25 | 5 | 5 | 0 | 0 | 0 | |
| 55–64 | 260 | 25 | 25 | 10 | 5 | 105 | 75 | 5 | 10 | 0 | 5 | 0 | |
| 65–74 | 275 | 30 | 15 | 5 | 5 | 100 | 90 | 10 | 10 | 5 | 10 | 0 | |
| 75–84 | 175 | 20 | 10 | 5 | 5 | 60 | 60 | 5 | 5 | 0 | 5 | 0 | |
| 85+ | 50 | 5 | 5 | 0 | 0 | 20 | 15 | 0 | 0 | 0 | 0 | 0 | |
| Total | 860 | 95 | 65 | 25 | 20 | 325 | 270 | 25 | 30 | 10 | 20 | 0 | |
| 2018–22 | <45 | 10 | 0 | 0 | 0 | 0 | 5 | 5 | 0 | 0 | 0 | 0 | 0 |
| 45–54 | 70 | 10 | 5 | 5 | 0 | 30 | 20 | 0 | 5 | 0 | 0 | 0 | |
| 55–64 | 260 | 30 | 30 | 15 | 5 | 105 | 70 | 5 | 10 | 0 | 5 | 0 | |
| 65–74 | 290 | 30 | 20 | 10 | 10 | 115 | 90 | 5 | 10 | 5 | 10 | 0 | |
| 75–84 | 180 | 20 | 10 | 5 | 5 | 65 | 60 | 10 | 5 | 0 | 5 | 0 | |
| 85+ | 55 | 5 | 5 | 0 | 0 | 20 | 20 | 0 | 0 | 0 | 0 | 0 | |
| Total | 865 | 100 | 75 | 30 | 20 | 340 | 260 | 25 | 30 | 10 | 25 | 0 | |
| 2023–27 | <45 | 10 | 5 | 0 | 0 | 0 | 5 | 5 | 0 | 0 | 0 | 0 | 0 |
| 45–54 | 65 | 10 | 5 | 5 | 0 | 30 | 15 | 0 | 5 | 0 | 0 | 0 | |
| 55–64 | 235 | 30 | 25 | 10 | 5 | 100 | 65 | 5 | 10 | 0 | 5 | 0 | |
| 65–74 | 320 | 40 | 30 | 15 | 10 | 135 | 90 | 10 | 10 | 5 | 10 | 0 | |
| 75–84 | 200 | 25 | 15 | 5 | 5 | 70 | 65 | 10 | 5 | 0 | 5 | 0 | |
| 85+ | 55 | 5 | 5 | 0 | 0 | 20 | 20 | 0 | 0 | 0 | 0 | 0 | |
| Total | 890 | 115 | 80 | 35 | 25 | 360 | 260 | 25 | 35 | 10 | 25 | 0 | |
| 2028–32 | <45 | 10 | 5 | 0 | 0 | 0 | 5 | 5 | 0 | 0 | 0 | 0 | 0 |
| 45–54 | 65 | 5 | 5 | 5 | 0 | 30 | 20 | 0 | 5 | 0 | 0 | 0 | |
| 55–64 | 205 | 25 | 25 | 10 | 5 | 95 | 55 | 5 | 10 | 0 | 5 | 0 | |
| 65–74 | 335 | 50 | 30 | 15 | 10 | 140 | 90 | 10 | 15 | 5 | 10 | 0 | |
| 75–84 | 225 | 30 | 20 | 5 | 5 | 85 | 70 | 10 | 5 | 0 | 10 | 0 | |
| 85+ | 60 | 10 | 5 | 0 | 0 | 25 | 20 | 0 | 0 | 0 | 0 | 0 | |
| Total | 900 | 125 | 90 | 35 | 25 | 380 | 260 | 25 | 35 | 10 | 25 | 0 | |
Abbreviations: AB, Alberta; BC, British Columbia; CA, Canada; MB, Manitoba; NB, New Brunswick; NL, Newfoundland and Labrador; NS, Nova Scotia; ON, Ontario; PE, Prince Edward Island; QC, Quebec; SK, Saskatchewan; TC, All Territories (Yukon, Northwest Territories and Nunavut).
Note: Totals may not add up due to rounding.
TABLE 4.7.2.
Observed (2003–2007) and projected average annual new cases by age and province/territories combined (TC), larynx cancer, females, Canada, 2003–2032
| Period | Age | New cases | |||||||||||
|---|---|---|---|---|---|---|---|---|---|---|---|---|---|
| CA | BC | AB | SK | MB | ON | QC | NB | NS | PE | NL | TC | ||
| 2003–07 | <45 | 5 | 0 | 0 | 0 | 0 | 0 | 0 | 0 | 0 | 0 | 0 | 0 |
| 45–54 | 25 | 0 | 0 | 0 | 0 | 10 | 10 | 0 | 0 | 0 | 0 | 0 | |
| 55–64 | 50 | 5 | 5 | 0 | 0 | 20 | 15 | 0 | 0 | 0 | 0 | 0 | |
| 65–74 | 65 | 5 | 5 | 0 | 0 | 25 | 25 | 0 | 0 | 0 | 0 | 0 | |
| 75–84 | 40 | 5 | 5 | 0 | 0 | 15 | 15 | 0 | 0 | 0 | 0 | 0 | |
| 85+ | 15 | 0 | 0 | 0 | 0 | 5 | 5 | 0 | 0 | 0 | 0 | 0 | |
| Total | 195 | 15 | 15 | 5 | 5 | 70 | 70 | 5 | 5 | 0 | 5 | 0 | |
| 2008–12 | <45 | 5 | 0 | 0 | 0 | 0 | 0 | 0 | 0 | 0 | 0 | 0 | 0 |
| 45–54 | 20 | 0 | 0 | 0 | 0 | 10 | 5 | 0 | 0 | 0 | 0 | 0 | |
| 55–64 | 50 | 5 | 5 | 0 | 0 | 20 | 15 | 0 | 0 | 0 | 0 | 0 | |
| 65–74 | 55 | 5 | 5 | 0 | 0 | 20 | 20 | 0 | 0 | 0 | 0 | 0 | |
| 75–84 | 45 | 5 | 5 | 0 | 0 | 15 | 15 | 0 | 0 | 0 | 0 | 0 | |
| 85+ | 15 | 0 | 0 | 0 | 0 | 5 | 5 | 0 | 0 | 0 | 0 | 0 | |
| Total | 185 | 20 | 15 | 5 | 5 | 70 | 65 | 5 | 5 | 0 | 5 | 0 | |
| 2013–17 | <45 | 5 | 0 | 0 | 0 | 0 | 0 | 0 | 0 | 0 | 0 | 0 | 0 |
| 45–54 | 15 | 0 | 0 | 0 | 0 | 10 | 5 | 0 | 0 | 0 | 0 | 0 | |
| 55–64 | 45 | 5 | 5 | 0 | 0 | 20 | 15 | 0 | 0 | 0 | 0 | 0 | |
| 65–74 | 55 | 5 | 5 | 0 | 0 | 20 | 20 | 0 | 0 | 0 | 0 | 0 | |
| 75–84 | 45 | 5 | 5 | 0 | 0 | 15 | 15 | 0 | 0 | 0 | 0 | 0 | |
| 85+ | 15 | 0 | 0 | 0 | 0 | 5 | 5 | 0 | 0 | 0 | 0 | 0 | |
| Total | 175 | 20 | 15 | 5 | 5 | 70 | 60 | 5 | 5 | 0 | 0 | 0 | |
| 2018–22 | <45 | 5 | 0 | 0 | 0 | 0 | 5 | 0 | 0 | 0 | 0 | 0 | 0 |
| 45–54 | 10 | 0 | 0 | 0 | 0 | 5 | 5 | 0 | 0 | 0 | 0 | 0 | |
| 55–64 | 40 | 5 | 5 | 0 | 0 | 20 | 10 | 0 | 0 | 0 | 0 | 0 | |
| 65–74 | 55 | 10 | 5 | 0 | 0 | 25 | 20 | 0 | 0 | 0 | 0 | 0 | |
| 75–84 | 40 | 5 | 5 | 0 | 0 | 15 | 15 | 0 | 0 | 0 | 0 | 0 | |
| 85+ | 20 | 0 | 0 | 0 | 0 | 5 | 10 | 0 | 0 | 0 | 0 | 0 | |
| Total | 170 | 20 | 15 | 5 | 5 | 75 | 55 | 5 | 5 | 0 | 0 | 0 | |
| 2023–27 | <45 | 5 | 0 | 0 | 0 | 0 | 5 | 0 | 0 | 0 | 0 | 0 | 0 |
| 45–54 | 10 | 0 | 0 | 0 | 0 | 5 | 5 | 0 | 0 | 0 | 0 | 0 | |
| 55–64 | 30 | 5 | 5 | 0 | 0 | 20 | 10 | 0 | 0 | 0 | 0 | 0 | |
| 65–74 | 55 | 10 | 5 | 0 | 0 | 25 | 20 | 0 | 0 | 0 | 0 | 0 | |
| 75–84 | 40 | 5 | 5 | 0 | 0 | 15 | 15 | 0 | 0 | 0 | 0 | 0 | |
| 85+ | 20 | 0 | 0 | 0 | 0 | 5 | 10 | 0 | 0 | 0 | 0 | 0 | |
| Total | 155 | 25 | 15 | 5 | 5 | 80 | 55 | 5 | 5 | 0 | 0 | 0 | |
| 2028–32 | <45 | 5 | 0 | 0 | 0 | 0 | 5 | 0 | 0 | 0 | 0 | 0 | 0 |
| 45–54 | 10 | 0 | 0 | 0 | 0 | 5 | 5 | 0 | 0 | 0 | 0 | 0 | |
| 55–64 | 25 | 5 | 5 | 0 | 0 | 20 | 10 | 0 | 0 | 0 | 0 | 0 | |
| 65–74 | 50 | 10 | 5 | 0 | 0 | 30 | 15 | 0 | 0 | 0 | 0 | 0 | |
| 75–84 | 40 | 5 | 5 | 0 | 0 | 20 | 15 | 0 | 0 | 0 | 0 | 0 | |
| 85+ | 15 | 0 | 0 | 0 | 0 | 5 | 5 | 0 | 0 | 0 | 0 | 0 | |
| Total | 145 | 25 | 15 | 5 | 5 | 80 | 50 | 5 | 5 | 0 | 0 | 0 | |
Abbreviations: AB, Alberta; BC, British Columbia; CA, Canada; MB, Manitoba; NB, New Brunswick; NL, Newfoundland and Labrador; NS, Nova Scotia; ON, Ontario; PE, Prince Edward Island; QC, Quebec; SK, Saskatchewan; TC, All Territories (Yukon, Northwest Territories and Nunavut).
Note: Totals may not add up due to rounding.
TABLE 4.7.3.
Observed (2003–2007) and projected age-standardized incidence rates (ASIRs) by age and province/territories combined (TC), larynx cancer, males, Canada, 2003–2032
| Period | Age | ASIRs | |||||||||||
|---|---|---|---|---|---|---|---|---|---|---|---|---|---|
| CA | BC | AB | SK | MB | ON | QC | NB | NS | PE | NL | TC | ||
| 2003–07 | <45 | 0.2 | 0.1 | 0.1 | 0.4 | 0.2 | 0.2 | 0.2 | 0.1 | 0.1 | 0.0 | 0.1 | 1.0 |
| 45–54 | 4.5 | 3.5 | 3.2 | 3.7 | 2.7 | 4.4 | 6.0 | 3.9 | 4.8 | 9.4 | 4.6 | 0.0 | |
| 55–64 | 15.3 | 11.7 | 12.7 | 9.7 | 9.6 | 14.4 | 20.7 | 14.7 | 15.5 | 20.3 | 19.0 | 3.6 | |
| 65–74 | 27.3 | 18.0 | 17.3 | 27.8 | 21.8 | 25.3 | 38.0 | 32.4 | 32.9 | 35.3 | 35.2 | 12.6 | |
| 75–84 | 29.5 | 23.1 | 16.4 | 14.0 | 23.4 | 27.6 | 42.8 | 43.1 | 30.9 | 21.7 | 43.9 | 0.0 | |
| 85+ | 23.0 | 17.4 | 15.5 | 18.6 | 19.5 | 23.0 | 30.4 | 43.7 | 14.9 | 26.6 | 17.9 | 145.1 | |
| Total | 5.1 | 3.7 | 3.4 | 4.1 | 3.8 | 4.8 | 7.0 | 5.9 | 5.4 | 6.2 | 6.3 | 3.3 | |
| 2008–12 | <45 | 0.1 | 0.2 | 0.1 | 0.3 | 0.1 | 0.2 | 0.2 | 0.3 | 0.2 | 0.2 | 0.1 | 0.2 |
| 45–54 | 3.7 | 3.2 | 3.0 | 4.5 | 2.9 | 3.7 | 4.5 | 4.5 | 4.4 | 7.3 | 6.1 | 3.7 | |
| 55–64 | 12.3 | 8.3 | 9.9 | 13.1 | 8.0 | 12.4 | 16.0 | 11.2 | 14.0 | 25.2 | 16.5 | 13.4 | |
| 65–74 | 21.8 | 15.7 | 15.0 | 15.6 | 18.0 | 20.5 | 29.2 | 25.8 | 24.8 | 38.2 | 31.5 | 19.0 | |
| 75–84 | 26.6 | 20.7 | 16.6 | 19.9 | 17.3 | 23.9 | 38.2 | 44.3 | 28.1 | 37.0 | 43.3 | 22.5 | |
| 85+ | 21.2 | 15.2 | 16.8 | 12.1 | 19.2 | 20.7 | 31.2 | 25.0 | 21.4 | 23.7 | 11.5 | 19.5 | |
| Total | 4.2 | 3.1 | 3.1 | 3.7 | 3.1 | 4.0 | 5.6 | 5.2 | 4.7 | 7.3 | 6.0 | 4.0 | |
| 2013–17 | <45 | 0.1 | 0.2 | 0.1 | 0.3 | 0.1 | 0.1 | 0.1 | 0.3 | 0.2 | 0.2 | 0.1 | 0.1 |
| 45–54 | 3.1 | 2.6 | 2.6 | 4.6 | 2.6 | 3.1 | 3.6 | 4.2 | 4.3 | 6.7 | 5.9 | 3.1 | |
| 55–64 | 11.0 | 8.2 | 10.1 | 17.6 | 7.4 | 11.6 | 13.1 | 10.6 | 15.0 | 23.4 | 14.6 | 11.4 | |
| 65–74 | 17.6 | 13.6 | 12.1 | 13.3 | 13.1 | 17.3 | 23.2 | 18.6 | 18.3 | 36.1 | 29.8 | 16.1 | |
| 75–84 | 23.0 | 16.6 | 16.0 | 13.7 | 17.2 | 21.0 | 32.6 | 39.6 | 25.3 | 36.2 | 38.8 | 19.1 | |
| 85+ | 19.0 | 15.7 | 11.7 | 13.3 | 15.0 | 17.9 | 28.6 | 25.4 | 16.8 | 24.0 | 14.6 | 16.7 | |
| Total | 3.6 | 2.8 | 2.8 | 3.8 | 2.7 | 3.5 | 4.7 | 4.5 | 4.2 | 6.9 | 5.5 | 3.4 | |
| 2018–22 | <45 | 0.1 | 0.2 | 0.1 | 0.3 | 0.1 | 0.1 | 0.1 | 0.3 | 0.2 | 0.2 | 0.1 | 0.1 |
| 45–54 | 2.6 | 2.2 | 2.4 | 4.6 | 2.4 | 3.1 | 3.2 | 4.1 | 4.2 | 6.2 | 5.7 | 2.7 | |
| 55–64 | 10.0 | 8.4 | 10.2 | 17.8 | 6.6 | 10.4 | 11.5 | 10.0 | 14.6 | 21.6 | 14.0 | 10.0 | |
| 65–74 | 15.5 | 11.8 | 11.6 | 17.0 | 12.1 | 16.1 | 19.6 | 15.4 | 17.0 | 33.8 | 26.3 | 14.2 | |
| 75–84 | 19.4 | 16.5 | 13.8 | 9.8 | 15.7 | 17.9 | 26.5 | 32.1 | 20.9 | 34.7 | 37.3 | 16.8 | |
| 85+ | 17.7 | 12.8 | 13.5 | 11.9 | 12.4 | 16.5 | 27.9 | 26.7 | 15.1 | 23.8 | 13.6 | 14.5 | |
| Total | 3.1 | 2.6 | 2.7 | 3.9 | 2.4 | 3.2 | 4.0 | 4.0 | 3.9 | 6.4 | 5.2 | 3.0 | |
| 2023–27 | <45 | 0.1 | 0.2 | 0.1 | 0.3 | 0.1 | 0.1 | 0.1 | 0.3 | 0.2 | 0.2 | 0.1 | 0.1 |
| 45–54 | 2.5 | 2.0 | 2.3 | 4.7 | 2.3 | 3.0 | 3.1 | 4.0 | 4.1 | 5.7 | 5.7 | 2.6 | |
| 55–64 | 9.1 | 7.9 | 9.8 | 18.0 | 6.2 | 9.5 | 10.7 | 9.8 | 14.5 | 19.8 | 13.7 | 9.4 | |
| 65–74 | 14.8 | 13.3 | 12.8 | 21.3 | 12.1 | 16.0 | 17.7 | 15.4 | 18.4 | 31.3 | 24.6 | 13.4 | |
| 75–84 | 16.6 | 15.4 | 12.0 | 7.9 | 12.6 | 15.9 | 22.9 | 24.2 | 15.5 | 32.8 | 36.4 | 15.8 | |
| 85+ | 15.4 | 11.5 | 13.1 | 6.0 | 16.2 | 14.9 | 23.9 | 22.9 | 13.8 | 23.0 | 11.9 | 13.5 | |
| Total | 2.9 | 2.6 | 2.6 | 4.1 | 2.3 | 3.0 | 3.6 | 3.6 | 3.7 | 6.0 | 5.0 | 2.8 | |
| 2028–32 | <45 | 0.1 | 0.2 | 0.1 | 0.3 | 0.1 | 0.1 | 0.1 | 0.3 | 0.2 | 0.2 | 0.1 | 0.1 |
| 45–54 | 2.4 | 1.9 | 2.2 | 4.7 | 2.2 | 2.9 | 2.9 | 3.9 | 4.1 | 5.2 | 5.6 | 2.4 | |
| 55–64 | 8.4 | 7.4 | 9.5 | 18.1 | 5.8 | 9.7 | 10.2 | 9.5 | 14.3 | 18.2 | 13.5 | 8.7 | |
| 65–74 | 13.8 | 13.9 | 13.1 | 21.5 | 11.5 | 14.4 | 16.3 | 15.0 | 18.2 | 28.8 | 24.1 | 12.1 | |
| 75–84 | 15.1 | 14.6 | 12.3 | 11.3 | 12.2 | 15.4 | 20.2 | 21.9 | 15.4 | 30.7 | 32.8 | 14.5 | |
| 85+ | 13.2 | 13.2 | 11.1 | 5.2 | 12.2 | 12.6 | 19.8 | 18.0 | 10.5 | 22.0 | 12.6 | 12.4 | |
| Total | 2.7 | 2.6 | 2.6 | 4.2 | 2.2 | 2.9 | 3.3 | 3.4 | 3.7 | 5.5 | 4.8 | 2.5 | |
Abbreviations: AB, Alberta; BC, British Columbia; CA, Canada; MB, Manitoba; NB, New Brunswick; NL, Newfoundland and Labrador; NS, Nova Scotia; ON, Ontario; PE, Prince Edward Island; QC, Quebec; SK, Saskatchewan; TC, All Territories (Yukon, Northwest Territories and Nunavut).
TABLE 4.7.4.
Observed (2003–2007) and projected age-standardized incidence rates (ASIRs) by age and province/territories combined (TC), larynx cancer, females, Canada, 2003–2032
| Period | Age | ASIRs | |||||||||||
|---|---|---|---|---|---|---|---|---|---|---|---|---|---|
| CA | BC | AB | SK | MB | ON | QC | NB | NS | PE | NL | TC | ||
| 2003–07 | <45 | 0.0 | 0.0 | 0.0 | 0.1 | 0.0 | 0.0 | 0.1 | 0.1 | 0.0 | 0.0 | 0.0 | 0.0 |
| 45–54 | 0.9 | 0.1 | 0.6 | 0.6 | 0.9 | 0.9 | 1.5 | 1.3 | 1.6 | 0.0 | 0.5 | 2.9 | |
| 55–64 | 2.8 | 2.3 | 2.2 | 2.7 | 1.5 | 2.7 | 3.6 | 2.1 | 3.5 | 2.7 | 4.8 | 0.0 | |
| 65–74 | 5.5 | 3.8 | 4.1 | 3.7 | 4.4 | 5.2 | 8.2 | 2.7 | 3.7 | 7.3 | 3.1 | 14.3 | |
| 75–84 | 4.8 | 3.7 | 4.9 | 3.3 | 3.8 | 4.3 | 6.6 | 8.3 | 2.9 | 0.0 | 3.1 | 0.0 | |
| 85+ | 3.7 | 2.5 | 2.2 | 3.8 | 5.0 | 3.8 | 5.7 | 0.0 | 1.6 | 0.0 | 0.0 | 0.0 | |
| Total | 1.0 | 0.6 | 0.7 | 0.7 | 0.7 | 0.9 | 1.4 | 0.9 | 0.9 | 0.7 | 0.8 | 1.3 | |
| 2008–12 | <45 | 0.0 | 0.1 | 0.0 | 0.0 | 0.0 | 0.1 | 0.1 | 0.1 | 0.1 | 0.1 | 0.0 | 0.1 |
| 45–54 | 0.7 | 0.3 | 0.7 | 0.6 | 0.7 | 0.8 | 1.1 | 1.3 | 1.3 | 0.9 | 0.6 | 0.9 | |
| 55–64 | 2.3 | 1.8 | 1.7 | 2.2 | 2.2 | 2.3 | 3.0 | 3.2 | 3.1 | 2.8 | 1.8 | 2.9 | |
| 65–74 | 4.2 | 3.5 | 3.0 | 3.9 | 3.3 | 3.8 | 6.0 | 5.0 | 4.0 | 3.5 | 3.4 | 5.3 | |
| 75–84 | 5.0 | 3.8 | 4.6 | 3.7 | 2.9 | 5.0 | 6.9 | 4.8 | 3.2 | 3.8 | 4.1 | 6.4 | |
| 85+ | 3.0 | 1.8 | 2.8 | 2.9 | 2.2 | 2.6 | 5.2 | 3.5 | 1.7 | 2.7 | 2.4 | 3.8 | |
| Total | 0.8 | 0.6 | 0.6 | 0.7 | 0.7 | 0.8 | 1.1 | 1.0 | 0.9 | 0.8 | 0.7 | 1.0 | |
| 2013–17 | <45 | 0.0 | 0.1 | 0.0 | 0.0 | 0.0 | 0.1 | 0.1 | 0.1 | 0.1 | 0.1 | 0.0 | 0.1 |
| 45–54 | 0.5 | 0.3 | 0.7 | 0.5 | 0.6 | 0.7 | 0.8 | 1.1 | 1.1 | 0.8 | 0.4 | 0.7 | |
| 55–64 | 1.8 | 1.6 | 1.6 | 1.7 | 1.9 | 2.0 | 2.3 | 2.8 | 2.8 | 2.3 | 1.5 | 2.3 | |
| 65–74 | 3.3 | 3.2 | 2.1 | 3.3 | 2.9 | 3.2 | 4.7 | 4.4 | 3.6 | 3.0 | 2.7 | 4.2 | |
| 75–84 | 4.4 | 3.3 | 4.1 | 3.6 | 2.6 | 4.4 | 6.1 | 4.6 | 3.0 | 3.2 | 3.6 | 5.7 | |
| 85+ | 3.3 | 2.2 | 2.9 | 3.0 | 2.1 | 3.0 | 5.5 | 3.5 | 1.6 | 2.3 | 2.7 | 4.2 | |
| Total | 0.7 | 0.6 | 0.6 | 0.6 | 0.6 | 0.7 | 0.9 | 0.9 | 0.8 | 0.7 | 0.5 | 0.8 | |
| 2018–22 | <45 | 0.0 | 0.1 | 0.0 | 0.0 | 0.0 | 0.1 | 0.1 | 0.1 | 0.0 | 0.0 | 0.0 | 0.0 |
| 45–54 | 0.4 | 0.3 | 0.7 | 0.4 | 0.5 | 0.7 | 0.7 | 0.9 | 1.0 | 0.7 | 0.4 | 0.6 | |
| 55–64 | 1.5 | 1.5 | 1.6 | 1.4 | 1.7 | 2.0 | 1.9 | 2.4 | 2.4 | 2.0 | 1.3 | 2.0 | |
| 65–74 | 2.7 | 2.6 | 1.9 | 2.7 | 2.5 | 2.9 | 3.8 | 3.8 | 3.2 | 2.5 | 2.2 | 3.4 | |
| 75–84 | 3.4 | 3.3 | 2.8 | 3.2 | 2.3 | 3.4 | 4.7 | 4.2 | 2.8 | 2.7 | 2.8 | 4.4 | |
| 85+ | 3.3 | 2.2 | 3.0 | 3.0 | 1.9 | 3.3 | 5.7 | 3.5 | 1.5 | 1.9 | 2.7 | 4.2 | |
| Total | 0.5 | 0.5 | 0.5 | 0.5 | 0.5 | 0.6 | 0.8 | 0.8 | 0.7 | 0.6 | 0.4 | 0.7 | |
| 2023–27 | <45 | 0.0 | 0.1 | 0.0 | 0.0 | 0.0 | 0.1 | 0.1 | 0.1 | 0.0 | 0.0 | 0.0 | 0.0 |
| 45–54 | 0.4 | 0.3 | 0.7 | 0.3 | 0.5 | 0.7 | 0.7 | 0.8 | 0.9 | 0.6 | 0.4 | 0.6 | |
| 55–64 | 1.2 | 1.5 | 1.6 | 1.1 | 1.4 | 1.9 | 1.6 | 2.0 | 2.1 | 1.7 | 1.0 | 1.5 | |
| 65–74 | 2.3 | 2.5 | 1.9 | 2.2 | 2.1 | 2.7 | 3.2 | 3.3 | 2.9 | 2.1 | 1.9 | 2.9 | |
| 75–84 | 2.8 | 3.0 | 2.1 | 2.7 | 1.9 | 3.1 | 4.1 | 3.6 | 2.6 | 2.3 | 2.3 | 3.6 | |
| 85+ | 2.8 | 1.8 | 2.5 | 2.8 | 1.6 | 2.8 | 5.0 | 3.3 | 1.4 | 1.6 | 2.3 | 3.6 | |
| Total | 0.5 | 0.5 | 0.5 | 0.4 | 0.4 | 0.6 | 0.7 | 0.7 | 0.6 | 0.5 | 0.4 | 0.6 | |
| 2028–32 | <45 | 0.0 | 0.1 | 0.0 | 0.0 | 0.0 | 0.1 | 0.1 | 0.0 | 0.0 | 0.0 | 0.0 | 0.0 |
| 45–54 | 0.4 | 0.3 | 0.7 | 0.2 | 0.4 | 0.7 | 0.7 | 0.7 | 0.8 | 0.5 | 0.3 | 0.5 | |
| 55–64 | 1.1 | 1.4 | 1.5 | 0.9 | 1.2 | 1.9 | 1.5 | 1.7 | 1.9 | 1.4 | 0.9 | 1.3 | |
| 65–74 | 1.9 | 2.5 | 1.9 | 1.8 | 1.8 | 2.7 | 2.7 | 2.8 | 2.5 | 1.8 | 1.6 | 2.5 | |
| 75–84 | 2.2 | 2.6 | 1.9 | 2.2 | 1.7 | 2.9 | 3.2 | 3.2 | 2.3 | 2.0 | 1.8 | 2.9 | |
| 85+ | 2.0 | 2.2 | 1.4 | 2.5 | 1.4 | 2.0 | 3.7 | 2.9 | 1.3 | 1.4 | 1.6 | 2.5 | |
| Total | 0.4 | 0.5 | 0.4 | 0.3 | 0.4 | 0.6 | 0.6 | 0.6 | 0.5 | 0.4 | 0.3 | 0.5 | |
Abbreviations: AB, Alberta; BC, British Columbia; CA, Canada; MB, Manitoba; NB, New Brunswick; NL, Newfoundland and Labrador; NS, Nova Scotia; ON, Ontario; PE, Prince Edward Island; QC, Quebec; SK, Saskatchewan; TC, All Territories (Yukon, Northwest Territories and Nunavut).
Figure 4.7.1 shows the pattern by which ASIRs of laryngeal cancer changed with age between 2003 and 2007. In 2003–2007, laryngeal cancer was rare in males younger than 45 (0.2 per 100 000), but the incidence increased sharply with age, peaking at 29.5 per 100 000 in those aged 75 to 84. For females, the incidence increased gradually with age, from 0.0 in those under 45 to 5.5 per 100 000 in the 65–74 age range, and then decreased to 3.7 per 100 000 in those aged 85 or older. Approximately 86% of laryngeal cancer cases occurred in those aged 55 and over in both sexes.
FIGURE 4.7.1. Age-standardized incidence rates (ASIRs) for larynx cancer, Canada, 2003–2007.

The ASIRs of laryngeal cancer in Canada have decreased steadily from 1983–1987 to 2003–2007, by 43% (from 8.8 to 5.1 per 100 000) in males and by 33% (from 1.4 to 1.0 per 100 000) in females (Figure 4.7.2). During 1998–2007, the incidence rate of larynx cancer decreased the most rapidly of all cancers (3.8% per year in males and 3.4 per year in females) (Figures 3.1 and 3.2). When the rates are analyzed by age, significant decreases over time occurred in each age group in males. This finding compares with either very slowly decreasing or stable trends, in terms of absolute changes in rates, in females of each age group (Figure 4.7.3). Inter-regional comparison of incidence illustrates approximately parallel decreases for males. No geographical pattern was observed for females, except in Quebec, where the rates decreased consistently from the late 1980s and were higher in females as well as in males) than those in other regions over time (Figure 4.7.2). In 2003–2007, the ASIRs were higher in Quebec and lower in western Canada for both sexes.
FIGURE 4.7.2. Age-standardized incidence rates (ASIRs) by region, larynx cancer, 1983–2032.

FIGURE 4.7.3. Age-standardized incidence rates (ASIRs) for larynx cancer by age group (– males, – females), Canada, 1983–2032.

The ASIRs of laryngeal cancer in males are expected to decrease by 43% to 49% in age groups above 45. Similarly, the rates in females of the same age will decrease by 47% to 65%, but as the ASIRs are much lower in females the absolute changes in ASIRs will be much smaller (Figure 4.7.3). The long-term trends of the rates in males and females are projected to converge in each age group. The predictions in Figure 4.7.2 show that the rates of laryngeal cancer will continue to decrease in males and females, most markedly in Quebec. In general, the incidence rates are projected to be higher in eastern Canada than in the western regions, but the long-term trends indicate a regional convergence of rates.
From 2003–2007 to 2028–2032, national larynx cancer ASIRs are expected to decrease by 47% in males, from 5.1 to 2.7 per 100 000, and by 59% in females, from 1.0 to 0.4 per 100 000 (Tables 4.7.3 and 4.7.4). The annual number of male cases is projected to be unchanged at around 900, and the number of female cases, to drop by 26%, from 195 to 145 (Tables 4.7.1 and 4.7.2).
Comments
Avoiding smoking and alcohol consumption could prevent over 90% of laryngeal cancers.125–127 While most of the risk is linked to smoking, reducing drinking alone could still prevent one-quarter of the cancers. The strongly declining observed and projected rates in males likely reflect the role of decreased smoking since the 1960s.42,43 The higher prevalence of smoking in males is also reflected in the much higher males ASIRs compared with female ASIRs. It is likely that incidence rates in females will drop more sharply than shown in these projections, given the declining pattern of smoking prevalence and the long latency period between the smoking reduction and the decrease in cancer incidence rate as discussed in Section 1, about oral cancers.
8. Lung cancer
Lung cancer is the second most common cancer and the leading cause of cancer death in both males and females in Canada. One in 11 males and 1 in 15 females can expect to be diagnosed with lung cancer in their lifetime, and 1 in 13 males and 1 in 18 females can expect to die from it.1 The average annual number of new cases in 2003–2007 was 12 245 in males and 9865 in females (Tables 4.8.1 and 4.8.2), accounting for 15.2% and 13.3% of all male and female cancer cases, respectively (Figure 3.9). Lung cancer has a poor 5-year relative survival rate in Canada, at 14% in males and 20% in females for 2006–2008.1
TABLE 4.8.1.
Observed (2003–2007) and projected average annual new cases by age and province/territories combined (TC), lung cancer, males, Canada, 2003–2032
| Period | Age | New cases | |||||||||||
|---|---|---|---|---|---|---|---|---|---|---|---|---|---|
| CA | BC | AB | SK | MB | ON | QC | NB | NS | PE | NL | TC | ||
| 2003–07 | <45 | 165 | 15 | 10 | 0 | 5 | 70 | 50 | 5 | 5 | 0 | 0 | 0 |
| 45–54 | 935 | 95 | 70 | 20 | 30 | 300 | 340 | 25 | 30 | 5 | 15 | 0 | |
| 55–64 | 2660 | 280 | 190 | 65 | 80 | 865 | 915 | 90 | 105 | 15 | 50 | 5 | |
| 65–74 | 4135 | 455 | 300 | 120 | 145 | 1380 | 1340 | 130 | 160 | 20 | 70 | 10 | |
| 75–84 | 3520 | 435 | 260 | 120 | 125 | 1145 | 1125 | 105 | 135 | 20 | 45 | 5 | |
| 85+ | 830 | 115 | 60 | 35 | 35 | 245 | 270 | 30 | 30 | 5 | 5 | 0 | |
| Total | 12 245 | 1395 | 895 | 360 | 425 | 4000 | 4040 | 385 | 470 | 60 | 185 | 25 | |
| 2008–12 | <45 | 150 | 10 | 15 | 0 | 5 | 55 | 45 | 5 | 5 | 0 | 0 | 0 |
| 45–54 | 935 | 105 | 75 | 15 | 30 | 325 | 315 | 25 | 30 | 5 | 15 | 5 | |
| 55–64 | 2775 | 305 | 220 | 65 | 90 | 905 | 940 | 85 | 105 | 10 | 60 | 5 | |
| 65–74 | 4125 | 465 | 305 | 115 | 140 | 1330 | 1370 | 140 | 165 | 20 | 80 | 10 | |
| 75–84 | 3620 | 445 | 290 | 115 | 120 | 1140 | 1205 | 110 | 130 | 20 | 50 | 5 | |
| 85+ | 1095 | 150 | 75 | 40 | 40 | 345 | 350 | 35 | 35 | 5 | 5 | 0 | |
| Total | 12 695 | 1485 | 980 | 350 | 425 | 4100 | 4225 | 400 | 470 | 60 | 205 | 25 | |
| 2013–17 | <45 | 150 | 10 | 15 | 0 | 5 | 50 | 50 | 0 | 5 | 0 | 0 | 0 |
| 45–54 | 835 | 90 | 75 | 15 | 25 | 315 | 255 | 15 | 25 | 5 | 10 | 5 | |
| 55–64 | 2885 | 335 | 245 | 65 | 95 | 955 | 960 | 85 | 100 | 10 | 60 | 5 | |
| 65–74 | 4550 | 535 | 365 | 115 | 150 | 1475 | 1485 | 160 | 185 | 20 | 95 | 10 | |
| 75–84 | 3600 | 445 | 300 | 110 | 120 | 1120 | 1200 | 115 | 130 | 20 | 55 | 5 | |
| 85+ | 1330 | 180 | 100 | 40 | 45 | 420 | 435 | 45 | 40 | 5 | 5 | 0 | |
| Total | 13 350 | 1595 | 1100 | 350 | 445 | 4335 | 4385 | 425 | 480 | 65 | 230 | 25 | |
| 2018–22 | <45 | 180 | 10 | 15 | 0 | 5 | 50 | 60 | 0 | 5 | 0 | 0 | 0 |
| 45–54 | 715 | 65 | 70 | 10 | 25 | 280 | 210 | 15 | 20 | 5 | 10 | 5 | |
| 55–64 | 2995 | 365 | 260 | 65 | 95 | 1065 | 935 | 80 | 95 | 10 | 55 | 5 | |
| 65–74 | 4980 | 610 | 450 | 125 | 170 | 1635 | 1575 | 170 | 195 | 20 | 105 | 5 | |
| 75–84 | 3895 | 490 | 335 | 110 | 130 | 1210 | 1300 | 135 | 145 | 25 | 65 | 5 | |
| 85+ | 1455 | 200 | 115 | 45 | 45 | 460 | 475 | 45 | 40 | 5 | 5 | 0 | |
| Total | 14 225 | 1740 | 1245 | 355 | 475 | 4700 | 4555 | 450 | 500 | 65 | 245 | 25 | |
| 2023–27 | <45 | 215 | 10 | 15 | 0 | 5 | 50 | 65 | 0 | 5 | 0 | 0 | 0 |
| 45–54 | 730 | 65 | 70 | 10 | 25 | 275 | 235 | 15 | 20 | 5 | 10 | 5 | |
| 55–64 | 2820 | 335 | 270 | 55 | 95 | 1090 | 795 | 65 | 90 | 10 | 50 | 10 | |
| 65–74 | 5465 | 705 | 515 | 135 | 195 | 1865 | 1675 | 175 | 190 | 20 | 115 | 5 | |
| 75–84 | 4560 | 595 | 430 | 125 | 145 | 1445 | 1465 | 165 | 175 | 25 | 80 | 5 | |
| 85+ | 1540 | 210 | 130 | 45 | 50 | 490 | 505 | 50 | 40 | 5 | 10 | 0 | |
| Total | 15 335 | 1920 | 1425 | 375 | 515 | 5220 | 4740 | 475 | 520 | 65 | 260 | 30 | |
| 2028–32 | <45 | 215 | 10 | 15 | 0 | 5 | 50 | 60 | 0 | 5 | 0 | 0 | 0 |
| 45–54 | 905 | 70 | 75 | 10 | 25 | 285 | 290 | 15 | 20 | 5 | 10 | 5 | |
| 55–64 | 2525 | 275 | 265 | 50 | 90 | 1025 | 680 | 60 | 75 | 10 | 45 | 10 | |
| 65–74 | 5820 | 780 | 560 | 135 | 200 | 2140 | 1665 | 175 | 195 | 25 | 110 | 10 | |
| 75–84 | 5170 | 700 | 540 | 140 | 175 | 1670 | 1615 | 175 | 190 | 25 | 90 | 5 | |
| 85+ | 1785 | 250 | 150 | 50 | 55 | 570 | 580 | 65 | 50 | 10 | 10 | 0 | |
| Total | 16 420 | 2090 | 1610 | 390 | 555 | 5740 | 4885 | 490 | 535 | 70 | 265 | 35 | |
Abbreviations: AB, Alberta; BC, British Columbia; CA, Canada; MB, Manitoba; NB, New Brunswick; NL, Newfoundland and Labrador; NS, Nova Scotia; ON, Ontario; PE, Prince Edward Island; QC, Quebec; SK, Saskatchewan; TC, All Territories (Yukon, Northwest Territories and Nunavut).
Note: Totals may not add up due to rounding.
TABLE 4.8.2.
Observed (2003–2007) and projected average annual new cases by age and province/territories combined (TC), lung cancer, females, Canada, 2003–2032
| Period | Age | New cases | |||||||||||
|---|---|---|---|---|---|---|---|---|---|---|---|---|---|
| CA | BC | AB | SK | MB | ON | QC | NB | NS | PE | NL | TC | ||
| 2003–07 | <45 | 230 | 20 | 15 | 5 | 5 | 80 | 85 | 5 | 5 | 0 | 5 | 0 |
| 45–54 | 1110 | 120 | 80 | 25 | 35 | 345 | 415 | 25 | 40 | 5 | 15 | 5 | |
| 55–64 | 2220 | 255 | 185 | 70 | 80 | 720 | 715 | 65 | 80 | 10 | 35 | 5 | |
| 65–74 | 2980 | 395 | 240 | 95 | 115 | 1060 | 810 | 90 | 115 | 15 | 40 | 5 | |
| 75–84 | 2575 | 360 | 200 | 85 | 110 | 930 | 685 | 75 | 95 | 10 | 20 | 5 | |
| 85+ | 750 | 115 | 60 | 30 | 35 | 255 | 200 | 20 | 25 | 5 | 0 | 0 | |
| Total | 9865 | 1265 | 780 | 310 | 385 | 3390 | 2910 | 280 | 360 | 50 | 115 | 20 | |
| 2008–12 | <45 | 185 | 15 | 20 | 5 | 5 | 75 | 60 | 5 | 10 | 0 | 5 | 0 |
| 45–54 | 1170 | 120 | 95 | 25 | 35 | 360 | 460 | 30 | 40 | 5 | 20 | 5 | |
| 55–64 | 2620 | 305 | 205 | 75 | 95 | 790 | 910 | 75 | 85 | 15 | 40 | 5 | |
| 65–74 | 3460 | 445 | 290 | 115 | 125 | 1155 | 990 | 100 | 125 | 20 | 50 | 10 | |
| 75–84 | 2920 | 385 | 250 | 95 | 120 | 1025 | 815 | 90 | 110 | 15 | 25 | 5 | |
| 85+ | 1130 | 170 | 85 | 45 | 50 | 395 | 310 | 35 | 40 | 5 | 5 | 0 | |
| Total | 11 485 | 1450 | 940 | 360 | 430 | 3800 | 3545 | 335 | 410 | 60 | 145 | 25 | |
| 2013–17 | <45 | 185 | 15 | 20 | 5 | 10 | 80 | 60 | 5 | 10 | 0 | 5 | 0 |
| 45–54 | 960 | 100 | 85 | 20 | 35 | 315 | 355 | 25 | 40 | 5 | 25 | 5 | |
| 55–64 | 2990 | 335 | 245 | 80 | 95 | 885 | 1080 | 90 | 90 | 10 | 45 | 10 | |
| 65–74 | 4170 | 535 | 355 | 135 | 145 | 1295 | 1285 | 125 | 145 | 20 | 65 | 10 | |
| 75–84 | 3250 | 435 | 290 | 105 | 130 | 1100 | 920 | 100 | 115 | 15 | 35 | 5 | |
| 85+ | 1475 | 200 | 125 | 60 | 65 | 510 | 435 | 50 | 50 | 5 | 5 | 0 | |
| Total | 13 025 | 1620 | 1115 | 395 | 475 | 4190 | 4130 | 390 | 455 | 65 | 180 | 35 | |
| 2018–22 | <45 | 205 | 20 | 25 | 5 | 10 | 90 | 70 | 5 | 10 | 0 | 5 | 0 |
| 45–54 | 725 | 85 | 80 | 15 | 35 | 280 | 225 | 25 | 35 | 5 | 25 | 5 | |
| 55–64 | 3060 | 330 | 270 | 75 | 100 | 920 | 1095 | 85 | 100 | 15 | 50 | 10 | |
| 65–74 | 4815 | 620 | 400 | 140 | 155 | 1445 | 1555 | 145 | 160 | 20 | 75 | 15 | |
| 75–84 | 3805 | 510 | 355 | 125 | 140 | 1220 | 1110 | 115 | 130 | 20 | 45 | 10 | |
| 85+ | 1725 | 230 | 150 | 60 | 70 | 580 | 530 | 55 | 60 | 10 | 10 | 0 | |
| Total | 14 335 | 1790 | 1275 | 425 | 510 | 4535 | 4585 | 430 | 495 | 70 | 205 | 40 | |
| 2023–27 | <45 | 205 | 20 | 25 | 5 | 10 | 85 | 70 | 5 | 10 | 0 | 5 | 0 |
| 45–54 | 705 | 85 | 85 | 20 | 35 | 295 | 210 | 25 | 35 | 5 | 20 | 5 | |
| 55–64 | 2510 | 275 | 240 | 65 | 95 | 825 | 820 | 70 | 95 | 15 | 50 | 10 | |
| 65–74 | 5390 | 675 | 460 | 145 | 155 | 1610 | 1760 | 160 | 170 | 20 | 80 | 20 | |
| 75–84 | 4545 | 620 | 430 | 140 | 160 | 1375 | 1390 | 135 | 155 | 20 | 55 | 10 | |
| 85+ | 1940 | 270 | 180 | 70 | 75 | 635 | 585 | 60 | 60 | 10 | 10 | 5 | |
| Total | 15 300 | 1945 | 1420 | 445 | 535 | 4830 | 4840 | 455 | 525 | 70 | 220 | 45 | |
| 2028–32 | <45 | 220 | 20 | 25 | 5 | 10 | 90 | 75 | 5 | 10 | 0 | 5 | 0 |
| 45–54 | 755 | 95 | 95 | 20 | 40 | 325 | 235 | 25 | 35 | 5 | 20 | 5 | |
| 55–64 | 1970 | 240 | 225 | 60 | 95 | 740 | 545 | 65 | 85 | 15 | 50 | 10 | |
| 65–74 | 5465 | 665 | 500 | 140 | 165 | 1670 | 1740 | 155 | 180 | 20 | 90 | 20 | |
| 75–84 | 5250 | 720 | 485 | 150 | 170 | 1550 | 1665 | 155 | 170 | 20 | 60 | 15 | |
| 85+ | 2285 | 310 | 215 | 85 | 80 | 705 | 720 | 70 | 70 | 10 | 10 | 5 | |
| Total | 15 945 | 2050 | 1550 | 460 | 555 | 5075 | 4985 | 475 | 550 | 70 | 230 | 55 | |
Abbreviations: AB, Alberta; BC, British Columbia; CA, Canada; MB, Manitoba; NB, New Brunswick; NL, Newfoundland and Labrador; NS, Nova Scotia; ON, Ontario; PE, Prince Edward Island; QC, Quebec; SK, Saskatchewan; TC, All Territories (Yukon, Northwest Territories and Nunavut).
Note: Totals may not add up due to rounding.
In 2003–2007, the incidence rates increased with age to peak in the 75–84 age group, at 567.3 per 100 000 in males and 297.6 per 100 000 in females (Tables 4.8.3 and 4.8.4). The overall lung cancer rates were lower in males under age 55 than in females for 2003–2007, and the rates in males aged 55 or older were higher than the female rates in the whole observation period (Figure 4.8.2). The male-to-female ratio of incidence rates increased with age to 2.5:1 in people aged 85 or older in 2003–2007.
TABLE 4.8.3.
Observed (2003–2007) and projected age-standardized incidence rates (ASIRs) by age and province/territories combined (TC), lung cancer, males, Canada, 2003–2032
| Period | Age | ASIRs | |||||||||||
|---|---|---|---|---|---|---|---|---|---|---|---|---|---|
| CA | BC | AB | SK | MB | ON | QC | NB | NS | PE | NL | TC | ||
| 2003–07 | <45 | 1.5 | 1.0 | 1.0 | 0.8 | 1.2 | 1.6 | 1.9 | 1.4 | 1.8 | 0.8 | 0.6 | 2.5 |
| 45–54 | 37.3 | 29.1 | 26.4 | 27.5 | 36.6 | 31.9 | 55.8 | 40.2 | 40.4 | 30.2 | 33.7 | 22.9 | |
| 55–64 | 157.5 | 119.5 | 126.0 | 136.8 | 137.8 | 138.3 | 211.8 | 205.6 | 190.9 | 166.3 | 161.4 | 180.1 | |
| 65–74 | 384.1 | 299.3 | 332.1 | 353.8 | 393.1 | 337.6 | 500.5 | 487.7 | 471.4 | 409.3 | 385.1 | 583.9 | |
| 75–84 | 567.3 | 479.5 | 512.7 | 503.5 | 528.2 | 475.9 | 776.0 | 709.6 | 737.5 | 742.0 | 453.5 | 933.5 | |
| 85+ | 544.8 | 483.0 | 477.7 | 439.2 | 472.9 | 437.1 | 852.6 | 767.4 | 555.5 | 478.2 | 142.9 | 435.4 | |
| Total | 70.7 | 56.6 | 60.3 | 61.9 | 67.2 | 60.9 | 96.2 | 89.5 | 86.2 | 77.5 | 61.9 | 97.4 | |
| 2008–12 | <45 | 1.4 | 0.8 | 1.1 | 0.8 | 1.2 | 1.4 | 1.9 | 1.2 | 1.5 | 1.5 | 1.2 | 2.8 |
| 45–54 | 33.6 | 28.5 | 24.3 | 21.3 | 29.2 | 30.4 | 47.4 | 38.0 | 37.9 | 30.6 | 32.5 | 36.6 | |
| 55–64 | 135.3 | 106.7 | 113.4 | 111.8 | 127.1 | 118.9 | 185.7 | 163.9 | 163.3 | 106.7 | 153.0 | 107.3 | |
| 65–74 | 333.2 | 265.0 | 290.6 | 314.3 | 344.4 | 287.1 | 437.7 | 443.4 | 409.6 | 373.0 | 359.1 | 409.0 | |
| 75–84 | 518.8 | 434.2 | 494.4 | 477.5 | 489.8 | 424.0 | 716.5 | 688.2 | 641.1 | 663.9 | 454.0 | 716.8 | |
| 85+ | 521.7 | 457.0 | 441.3 | 455.9 | 462.6 | 425.3 | 757.0 | 700.3 | 542.7 | 522.4 | 161.7 | 577.7 | |
| Total | 62.9 | 51.1 | 55.2 | 55.7 | 60.7 | 53.6 | 85.7 | 81.1 | 75.6 | 68.0 | 59.9 | 74.6 | |
| 2013–17 | <45 | 1.4 | 0.7 | 1.0 | 0.8 | 1.1 | 1.2 | 2.1 | 1.1 | 1.4 | 1.5 | 1.2 | 2.8 |
| 45–54 | 29.7 | 23.7 | 24.2 | 18.1 | 28.6 | 28.0 | 39.6 | 28.4 | 34.4 | 28.4 | 27.4 | 45.5 | |
| 55–64 | 123.2 | 103.3 | 102.3 | 95.9 | 119.8 | 108.3 | 170.2 | 147.7 | 139.6 | 92.6 | 152.0 | 76.6 | |
| 65–74 | 292.3 | 239.6 | 264.8 | 267.8 | 288.1 | 253.5 | 382.0 | 397.2 | 364.9 | 303.2 | 333.0 | 287.5 | |
| 75–84 | 467.0 | 391.1 | 455.6 | 456.3 | 469.4 | 380.1 | 641.1 | 624.3 | 562.2 | 571.0 | 439.2 | 552.1 | |
| 85+ | 498.3 | 435.6 | 443.6 | 450.2 | 454.3 | 394.7 | 724.8 | 707.8 | 536.9 | 574.7 | 179.0 | 444.5 | |
| Total | 56.5 | 46.7 | 51.0 | 49.9 | 55.2 | 48.1 | 76.8 | 73.2 | 67.2 | 59.0 | 57.1 | 57.4 | |
| 2018–22 | <45 | 1.6 | 0.7 | 1.0 | 0.8 | 1.1 | 1.2 | 2.5 | 1.1 | 1.4 | 1.5 | 1.2 | 2.8 |
| 45–54 | 27.6 | 18.6 | 24.1 | 16.9 | 27.1 | 27.0 | 36.6 | 27.3 | 32.9 | 27.1 | 27.4 | 56.5 | |
| 55–64 | 115.4 | 102.7 | 96.2 | 85.3 | 109.0 | 105.8 | 153.9 | 139.9 | 126.7 | 86.6 | 141.1 | 102.2 | |
| 65–74 | 263.2 | 223.5 | 248.4 | 233.4 | 269.3 | 230.6 | 346.3 | 342.5 | 323.9 | 232.7 | 315.9 | 164.4 | |
| 75–84 | 419.7 | 358.8 | 417.9 | 420.6 | 429.1 | 343.5 | 566.1 | 575.2 | 510.4 | 533.1 | 413.7 | 411.9 | |
| 85+ | 459.5 | 408.8 | 413.3 | 434.3 | 436.4 | 364.6 | 657.3 | 665.7 | 455.1 | 526.9 | 192.3 | 432.1 | |
| Total | 51.7 | 43.6 | 47.7 | 45.1 | 51.2 | 44.6 | 69.5 | 66.5 | 60.4 | 51.7 | 54.2 | 47.2 | |
| 2023–27 | <45 | 1.8 | 0.6 | 1.0 | 0.7 | 1.0 | 1.1 | 2.4 | 1.1 | 1.4 | 1.5 | 1.2 | 2.8 |
| 45–54 | 28.6 | 18.1 | 23.6 | 16.4 | 26.4 | 27.0 | 41.5 | 26.7 | 32.1 | 26.5 | 27.4 | 69.8 | |
| 55–64 | 108.0 | 91.6 | 98.8 | 79.0 | 111.4 | 104.6 | 135.4 | 115.9 | 121.3 | 83.8 | 125.5 | 132.9 | |
| 65–74 | 250.0 | 225.2 | 232.4 | 213.6 | 260.0 | 224.5 | 324.9 | 329.7 | 292.5 | 219.8 | 313.9 | 134.4 | |
| 75–84 | 379.2 | 334.5 | 393.4 | 374.4 | 372.2 | 318.3 | 504.0 | 527.1 | 469.4 | 449.2 | 381.6 | 269.5 | |
| 85+ | 418.7 | 370.7 | 387.6 | 431.7 | 434.5 | 337.3 | 590.0 | 607.0 | 417.7 | 455.8 | 174.5 | 274.7 | |
| Total | 48.6 | 41.4 | 45.6 | 41.5 | 48.6 | 42.8 | 64.0 | 61.2 | 55.9 | 46.8 | 51.4 | 42.5 | |
| 2028–32 | <45 | 1.8 | 0.6 | 0.9 | 0.7 | 1.0 | 1.0 | 2.4 | 1.1 | 1.3 | 1.5 | 1.2 | 2.8 |
| 45–54 | 33.4 | 17.7 | 23.2 | 15.9 | 25.7 | 26.6 | 47.3 | 26.2 | 31.4 | 25.8 | 27.4 | 86.2 | |
| 55–64 | 103.7 | 77.9 | 99.9 | 77.1 | 109.1 | 104.6 | 128.3 | 114.1 | 119.3 | 81.0 | 125.5 | 170.7 | |
| 65–74 | 238.5 | 226.0 | 226.0 | 196.7 | 248.0 | 224.4 | 297.3 | 307.5 | 274.0 | 213.7 | 288.5 | 172.6 | |
| 75–84 | 348.8 | 319.8 | 374.7 | 336.1 | 362.2 | 297.2 | 463.8 | 461.5 | 423.0 | 368.4 | 367.3 | 150.3 | |
| 85+ | 379.4 | 350.4 | 355.3 | 387.0 | 383.3 | 309.9 | 518.9 | 574.3 | 381.9 | 468.3 | 164.7 | 211.1 | |
| Total | 46.4 | 39.5 | 44.2 | 38.3 | 46.7 | 41.7 | 60.0 | 56.7 | 52.3 | 43.3 | 49.1 | 45.3 | |
Abbreviations: AB, Alberta; BC, British Columbia; CA, Canada; MB, Manitoba; NB, New Brunswick; NL, Newfoundland and Labrador; NS, Nova Scotia; ON, Ontario; PE, Prince Edward Island; QC, Quebec; SK, Saskatchewan; TC, All Territories (Yukon, Northwest Territories and Nunavut).
TABLE 4.8.4.
Observed (2003–2007) and projected age-standardized incidence rates (ASIRs) by age and province/territories combined (TC), lung cancer, females, Canada, 2003–2032
| Period | Age | ASIRs | |||||||||||
|---|---|---|---|---|---|---|---|---|---|---|---|---|---|
| CA | BC | AB | SK | MB | ON | QC | NB | NS | PE | NL | TC | ||
| 2003–07 | <45 | 2.0 | 1.3 | 1.5 | 1.6 | 1.6 | 1.8 | 3.2 | 2.1 | 2.0 | 2.3 | 1.8 | 0.0 |
| 45–54 | 44.1 | 35.0 | 32.9 | 32.0 | 39.6 | 36.6 | 67.3 | 42.7 | 49.9 | 44.5 | 34.3 | 47.5 | |
| 55–64 | 127.2 | 108.5 | 124.4 | 146.4 | 136.1 | 110.2 | 157.0 | 141.0 | 144.9 | 148.3 | 103.2 | 178.2 | |
| 65–74 | 250.2 | 251.5 | 246.1 | 251.0 | 270.9 | 231.0 | 266.5 | 300.4 | 304.6 | 311.5 | 194.3 | 508.3 | |
| 75–84 | 297.6 | 310.5 | 298.2 | 282.3 | 320.7 | 276.8 | 316.9 | 342.8 | 345.3 | 302.3 | 178.7 | 646.9 | |
| 85+ | 218.6 | 235.9 | 218.9 | 191.3 | 227.0 | 203.1 | 245.6 | 234.7 | 209.1 | 246.6 | 47.0 | 193.1 | |
| Total | 47.1 | 44.7 | 45.0 | 46.4 | 49.4 | 42.4 | 55.0 | 53.3 | 54.5 | 53.8 | 34.0 | 80.2 | |
| 2008–12 | <45 | 1.8 | 1.2 | 1.6 | 1.5 | 2.1 | 1.8 | 2.5 | 2.2 | 2.9 | 2.4 | 2.0 | 0.6 |
| 45–54 | 42.1 | 32.3 | 33.1 | 28.3 | 36.9 | 33.4 | 70.0 | 45.2 | 48.6 | 50.3 | 47.4 | 46.9 | |
| 55–64 | 123.0 | 103.4 | 107.2 | 124.3 | 128.2 | 98.8 | 171.9 | 140.3 | 127.8 | 125.9 | 104.1 | 116.9 | |
| 65–74 | 255.7 | 240.5 | 258.2 | 297.3 | 277.4 | 223.6 | 285.1 | 300.4 | 288.4 | 301.1 | 215.2 | 502.7 | |
| 75–84 | 323.0 | 321.6 | 340.3 | 322.2 | 364.4 | 291.4 | 355.3 | 403.9 | 396.7 | 353.1 | 208.1 | 616.5 | |
| 85+ | 260.2 | 279.6 | 246.6 | 267.5 | 266.1 | 240.9 | 297.2 | 304.9 | 283.8 | 231.3 | 66.8 | 367.7 | |
| Total | 48.0 | 44.0 | 46.2 | 49.3 | 51.2 | 41.5 | 59.3 | 56.6 | 55.0 | 53.4 | 38.2 | 75.6 | |
| 2013–17 | <45 | 1.8 | 1.2 | 1.7 | 1.6 | 2.3 | 1.9 | 2.5 | 2.5 | 3.0 | 2.4 | 2.0 | 0.6 |
| 45–54 | 34.3 | 25.7 | 30.0 | 25.3 | 38.2 | 28.7 | 55.8 | 41.3 | 50.7 | 54.6 | 54.3 | 47.0 | |
| 55–64 | 123.2 | 98.6 | 102.4 | 112.6 | 117.1 | 96.6 | 184.5 | 146.9 | 123.9 | 108.7 | 110.0 | 157.5 | |
| 65–74 | 247.0 | 226.4 | 244.7 | 289.3 | 258.4 | 202.9 | 300.7 | 289.7 | 268.8 | 262.5 | 218.8 | 346.8 | |
| 75–84 | 338.5 | 335.6 | 361.8 | 359.4 | 390.8 | 294.7 | 381.3 | 417.9 | 388.8 | 389.3 | 226.9 | 585.5 | |
| 85+ | 289.5 | 284.3 | 293.9 | 316.6 | 302.5 | 261.8 | 344.2 | 388.8 | 340.5 | 278.9 | 87.0 | 449.3 | |
| Total | 47.5 | 42.5 | 45.9 | 49.4 | 50.5 | 39.8 | 61.3 | 57.5 | 53.9 | 51.6 | 40.6 | 68.2 | |
| 2018–22 | <45 | 1.9 | 1.2 | 1.8 | 1.7 | 2.4 | 2.1 | 2.8 | 2.7 | 3.1 | 2.4 | 2.0 | 0.6 |
| 45–54 | 28.4 | 23.2 | 29.8 | 26.6 | 40.2 | 26.9 | 41.3 | 44.4 | 51.8 | 57.7 | 59.4 | 47.1 | |
| 55–64 | 115.7 | 88.8 | 101.0 | 103.2 | 114.5 | 89.6 | 177.9 | 138.6 | 123.0 | 118.0 | 121.8 | 157.7 | |
| 65–74 | 235.6 | 212.7 | 213.5 | 245.4 | 227.0 | 185.9 | 314.3 | 276.3 | 247.7 | 210.9 | 205.7 | 282.3 | |
| 75–84 | 338.5 | 329.0 | 369.7 | 397.1 | 381.6 | 282.4 | 390.5 | 409.6 | 369.9 | 343.6 | 231.4 | 603.6 | |
| 85+ | 305.8 | 297.4 | 308.1 | 335.3 | 330.7 | 267.3 | 374.3 | 398.8 | 362.8 | 289.2 | 116.5 | 362.7 | |
| Total | 45.6 | 40.3 | 44.1 | 47.3 | 48.4 | 37.5 | 60.9 | 56.1 | 52.1 | 47.6 | 41.7 | 63.6 | |
| 2023–27 | <45 | 1.8 | 1.3 | 1.8 | 1.7 | 2.4 | 1.8 | 2.9 | 2.8 | 3.1 | 2.4 | 2.0 | 0.6 |
| 45–54 | 27.7 | 23.3 | 30.4 | 27.3 | 41.2 | 28.8 | 38.7 | 46.1 | 52.4 | 59.3 | 62.1 | 47.1 | |
| 55–64 | 95.1 | 73.0 | 90.8 | 90.8 | 112.8 | 77.7 | 140.2 | 120.5 | 125.1 | 122.9 | 126.6 | 157.8 | |
| 65–74 | 230.8 | 202.8 | 203.1 | 221.6 | 204.4 | 180.2 | 319.6 | 274.8 | 237.2 | 183.4 | 205.2 | 344.1 | |
| 75–84 | 318.6 | 308.0 | 339.1 | 368.5 | 344.0 | 252.7 | 394.1 | 376.0 | 337.2 | 283.6 | 215.9 | 373.5 | |
| 85+ | 309.9 | 307.1 | 321.1 | 370.9 | 336.7 | 264.6 | 376.7 | 390.0 | 331.4 | 304.2 | 108.8 | 372.6 | |
| Total | 42.7 | 37.7 | 41.6 | 44.0 | 45.5 | 35.1 | 58.0 | 53.4 | 50.2 | 44.4 | 41.8 | 59.7 | |
| 2028–32 | <45 | 1.8 | 1.3 | 1.9 | 1.7 | 2.5 | 1.8 | 3.0 | 2.8 | 3.1 | 2.4 | 2.0 | 0.6 |
| 45–54 | 27.6 | 23.5 | 30.9 | 28.0 | 42.3 | 29.2 | 40.0 | 47.8 | 53.0 | 61.0 | 64.9 | 47.2 | |
| 55–64 | 80.1 | 66.5 | 88.9 | 92.6 | 115.2 | 73.1 | 106.0 | 124.1 | 126.2 | 128.0 | 131.5 | 158.0 | |
| 65–74 | 212.7 | 181.4 | 195.3 | 198.0 | 196.7 | 165.4 | 298.7 | 248.8 | 234.9 | 190.3 | 216.2 | 344.3 | |
| 75–84 | 302.6 | 289.6 | 294.8 | 310.6 | 298.2 | 233.2 | 402.7 | 353.1 | 312.4 | 217.6 | 196.5 | 365.1 | |
| 85+ | 301.6 | 289.1 | 318.1 | 400.3 | 310.9 | 245.6 | 376.7 | 367.6 | 318.6 | 225.6 | 109.5 | 386.1 | |
| Total | 39.6 | 34.8 | 39.4 | 40.9 | 43.5 | 32.8 | 54.2 | 51.2 | 49.2 | 42.3 | 42.6 | 59.6 | |
Abbreviations: AB, Alberta; BC, British Columbia; CA, Canada; MB, Manitoba; NB, New Brunswick; NL, Newfoundland and Labrador; NS, Nova Scotia; ON, Ontario; PE, Prince Edward Island; QC, Quebec; SK, Saskatchewan; TC, All Territories (Yukon, Northwest Territories and Nunavut).
FIGURE 4.8.2. Age-standardized incidence rates (ASIRs) for lung cancer by age group (– males, – females), Canada, 1983–2032.

Lung cancer incidence rates for males have dropped over the entire observation period and showed a slowing increase for females (Figure 4.8.1). Between 1998 and 2007, the lung cancer incidence rates decreased significantly in males by 1.8% per year but increased significantly in females by 1.1% per year (Figures 3.1 and 3.2). All the regions have had a consistent decrease over the whole observed period for males. Rates for females have increased in each region although they have stabilized in British Columbia since 1993–1997 and in Ontario 5 years later (Figure 4.8.1).
FIGURE 4.8.1. Age-standardized incidence rates (ASIRs) by region, lung cancer, 1983–2032.

The analysis predicts a steeper decrease in rates for males in the east (Ontario, Quebec and the Atlantic region) than in the west (Figure 4.8.1). For females, the rates will decrease in Ontario and British Columbia, and increase until 2013–2017 in Quebec and until 2008–2012 in other regions, followed by a gradual decrease. This projected future downturn of the rates is because of a decrease in rates in later birth cohorts. Quebec is predicted to continue to have the highest rates of lung cancer in both sexes. The differences in ASIRs in females between Quebec and the other regions will increase from between 10% and 30% in 2003–2007 to between 33% and 65% in 2028–2032. These increased differences are not evident in males.
The male-to-female ratio of ASIRs for lung cancer in Canada has decreased from 3.1:1 to 1.5:1 over the observed period (1983–2007), and is projected to further decrease to 1.2:1 in 2028–2032 (Figures 4.8.1 and 4.8.2).
From 2003–2007 to 2028–2032, the ASIRs of lung cancer for Canada are projected to decrease in males by 34%, from 70.7 to 46.4 per 100 000, and to peak and then also decrease in females by 16%, from 47.1 to 39.6 per 100 000. Because of the aging and growth of the population, the annual number of new cases is projected to increase by 34% in males (from 12 245 to 16 420) and by 62% in females (from 9865 to 15 945).
Comments
Smoking causes about 90% of lung cancer deaths in males and between 75% and 80% in females in the US.128,129 The trends in lung cancer incidence rates in Canada have closely mirrored historical patterns of smoking prevalence,42,43 after accounting for a latency period of 20 years or more. Because smoking prevalence began to decrease in the mid-1960s in males and in the mid-1980s in females,42,43 lung cancer incidence rates decreased for males over the whole observation period and showed the slowing of increase for females. The rates of lung cancer decreased from 1993–1997 to 2003–2007 in females aged less than 45, were relatively stable in women aged 45 to 54, showed a slowing increase in those aged between 55 and 64, and increased in those aged 65 or older. These trends are in agreement with the fact that the onset of cigarette smoking starts at younger ages and then follows the birth cohort as it ages, and lung cancer rates increase as the birth cohort ages.
Figure 4.8.3 shows the different results for projected lung cancer incidence in males and the similar results for females based on age–period–cohort models that include and exclude adjustment for available smoking prevalence data in Canada. In males, for the models with the same parameter settings (cut trend and using recent 10-year slope), the models incorporating smoking rates predict lower lung cancer incidence rates as compared with the models without adjustment for smoking, echoing the decreased pattern of tobacco consumption. In the absence of incorporating smoking information into the model, we projected the current trend in a larger extent (model M1T) than the default gradual damping of the impact of the current trend in future periods (model M0T), on the assumption that the current trend will continue into the future. The projected lung cancer pattern in males follows the forecast derived from the default Nordpred drift reduction model (M0T) with adjustment for smoking. The different reactions of the projection models to smoking factors for males and females are related to the different historical patterns of tobacco consumption42,43 and the lag of at least 20 years between a drop in smoking rates and subsequent decrease in cancer incidence rates.
FIGURE 4.8.3. Age-standardized incidence rates (ASIRs) with and without adjustments for smoking prevalence rates, lung cancer, Canada, 1983–2032.

Note: M0T is the Nordpred model with default drift reduction and using the recent trend for projection. M1T projects the current trend in a larger extent than M0T.
9. Melanoma
Cutaneous malignant melanoma (referred to as melanoma) is the eighth most common cancer in Canadian males and the seventh most common in Canadian females.1 One in 63 males and 1 in 79 females can expect to be diagnosed with melanoma in their lifetime, and 1 in 287 males and 1 in 420 females can expect to die from it.1 In 2003–2007, the average annual number of new cases of melanoma was 2320 for males and 2055 for females, or 2.9% and 2.8% of all male and female cases, respectively (Tables 4.9.1 and 4.9.2). During 1998–2007, melanoma ASIRs increased significantly in both sexes by 1.4% per year (Figures 3.1 and 3.2). The 5-year relative survival rates for melanoma diagnosed between 2006 and 2008 were 85% for males and 92% for females.1
TABLE 4.9.1.
Observed (2003–2007) and projected average annual new cases by age and province/territories combined (TC), melanoma, males, Canada, 2003–2032
| Period | Age | New cases | |||||||||||
|---|---|---|---|---|---|---|---|---|---|---|---|---|---|
| CA | BC | AB | SK | MB | ON | QC | NB | NS | PE | NL | TC | ||
| 2003–07 | <45 | 350 | 55 | 35 | 10 | 10 | 155 | 50 | 10 | 15 | 0 | 5 | 0 |
| 45–54 | 420 | 60 | 50 | 15 | 15 | 180 | 55 | 15 | 20 | 5 | 5 | 0 | |
| 55–64 | 510 | 90 | 50 | 15 | 15 | 230 | 65 | 15 | 25 | 5 | 10 | 0 | |
| 65–74 | 515 | 80 | 50 | 15 | 15 | 240 | 70 | 15 | 25 | 5 | 5 | 0 | |
| 75–84 | 400 | 65 | 30 | 10 | 10 | 200 | 45 | 10 | 15 | 5 | 5 | 0 | |
| 85+ | 120 | 25 | 10 | 5 | 5 | 55 | 15 | 0 | 5 | 0 | 0 | 0 | |
| Total | 2320 | 375 | 225 | 65 | 70 | 1070 | 300 | 65 | 105 | 15 | 35 | 5 | |
| 2008–12 | <45 | 335 | 55 | 35 | 10 | 5 | 160 | 45 | 10 | 10 | 0 | 5 | 0 |
| 45–54 | 435 | 65 | 45 | 10 | 15 | 195 | 60 | 10 | 20 | 5 | 5 | 0 | |
| 55–64 | 640 | 110 | 65 | 20 | 20 | 295 | 70 | 20 | 30 | 5 | 10 | 0 | |
| 65–74 | 645 | 110 | 55 | 15 | 15 | 295 | 85 | 20 | 30 | 5 | 10 | 0 | |
| 75–84 | 525 | 85 | 45 | 15 | 10 | 265 | 60 | 15 | 20 | 5 | 10 | 0 | |
| 85+ | 200 | 35 | 15 | 5 | 5 | 95 | 20 | 5 | 10 | 0 | 5 | 0 | |
| Total | 2785 | 460 | 260 | 75 | 75 | 1305 | 335 | 80 | 120 | 20 | 45 | 5 | |
| 2013–17 | <45 | 330 | 50 | 35 | 5 | 5 | 170 | 40 | 10 | 10 | 5 | 5 | 0 |
| 45–54 | 410 | 65 | 40 | 10 | 10 | 185 | 50 | 10 | 20 | 5 | 10 | 0 | |
| 55–64 | 710 | 120 | 75 | 20 | 20 | 330 | 75 | 20 | 30 | 5 | 10 | 0 | |
| 65–74 | 850 | 150 | 75 | 20 | 25 | 395 | 95 | 30 | 40 | 5 | 15 | 0 | |
| 75–84 | 630 | 105 | 50 | 15 | 15 | 315 | 70 | 15 | 25 | 5 | 15 | 0 | |
| 85+ | 290 | 50 | 25 | 5 | 10 | 145 | 35 | 5 | 10 | 5 | 5 | 0 | |
| Total | 3215 | 540 | 295 | 80 | 80 | 1540 | 365 | 90 | 135 | 25 | 55 | 5 | |
| 2018–22 | <45 | 325 | 50 | 30 | 10 | 5 | 170 | 40 | 10 | 10 | 5 | 5 | 0 |
| 45–54 | 360 | 60 | 35 | 10 | 5 | 170 | 40 | 10 | 15 | 5 | 10 | 0 | |
| 55–64 | 725 | 115 | 75 | 15 | 20 | 350 | 80 | 20 | 30 | 5 | 10 | 0 | |
| 65–74 | 1010 | 185 | 90 | 25 | 25 | 475 | 100 | 30 | 45 | 10 | 15 | 0 | |
| 75–84 | 785 | 135 | 65 | 20 | 15 | 390 | 85 | 25 | 35 | 5 | 15 | 0 | |
| 85+ | 370 | 60 | 35 | 10 | 10 | 185 | 40 | 10 | 10 | 5 | 5 | 0 | |
| Total | 3570 | 605 | 330 | 85 | 85 | 1735 | 390 | 100 | 145 | 25 | 60 | 5 | |
| 2023–27 | <45 | 315 | 55 | 30 | 10 | 5 | 165 | 40 | 10 | 10 | 5 | 5 | 0 |
| 45–54 | 325 | 50 | 30 | 5 | 5 | 160 | 40 | 10 | 15 | 5 | 15 | 0 | |
| 55–64 | 650 | 115 | 70 | 15 | 15 | 315 | 65 | 15 | 30 | 5 | 10 | 0 | |
| 65–74 | 1085 | 185 | 105 | 25 | 25 | 520 | 110 | 30 | 50 | 5 | 10 | 0 | |
| 75–84 | 1015 | 175 | 90 | 20 | 25 | 510 | 100 | 30 | 40 | 5 | 15 | 0 | |
| 85+ | 445 | 80 | 35 | 10 | 10 | 220 | 50 | 10 | 15 | 5 | 5 | 0 | |
| Total | 3835 | 660 | 365 | 90 | 90 | 1885 | 415 | 105 | 160 | 25 | 55 | 5 | |
| 2028–32 | <45 | 300 | 60 | 30 | 10 | 5 | 150 | 40 | 10 | 10 | 5 | 5 | 0 |
| 45–54 | 320 | 45 | 30 | 10 | 5 | 170 | 40 | 10 | 10 | 5 | 15 | 0 | |
| 55–64 | 565 | 100 | 60 | 10 | 10 | 285 | 55 | 10 | 25 | 0 | 10 | 0 | |
| 65–74 | 1100 | 185 | 110 | 20 | 30 | 540 | 120 | 30 | 50 | 5 | 5 | 0 | |
| 75–84 | 1210 | 210 | 115 | 30 | 30 | 605 | 110 | 35 | 50 | 5 | 15 | 0 | |
| 85+ | 570 | 100 | 55 | 10 | 15 | 275 | 65 | 20 | 20 | 5 | 5 | 0 | |
| Total | 4065 | 700 | 400 | 90 | 90 | 2025 | 430 | 110 | 170 | 25 | 55 | 5 | |
Abbreviations: AB, Alberta; BC, British Columbia; CA, Canada; MB, Manitoba; NB, New Brunswick; NL, Newfoundland and Labrador; NS, Nova Scotia; ON, Ontario; PE, Prince Edward Island; QC, Quebec; SK, Saskatchewan; TC, All Territories (Yukon, Northwest Territories and Nunavut).
Note: Totals may not add up due to rounding.
TABLE 4.9.2.
Observed (2003–2007) and projected average annual new cases by age and province/territories combined (TC), melanoma, females, Canada, 2003–2032
| Period | Age | New cases | |||||||||||
|---|---|---|---|---|---|---|---|---|---|---|---|---|---|
| CA | BC | AB | SK | MB | ON | QC | NB | NS | PE | NL | TC | ||
| 2003–07 | <45 | 530 | 85 | 65 | 10 | 10 | 245 | 65 | 15 | 20 | 5 | 10 | 0 |
| 45–54 | 430 | 65 | 55 | 15 | 10 | 195 | 50 | 15 | 20 | 0 | 10 | 0 | |
| 55–64 | 370 | 60 | 30 | 10 | 10 | 160 | 55 | 10 | 25 | 5 | 5 | 0 | |
| 65–74 | 315 | 45 | 25 | 5 | 10 | 150 | 45 | 10 | 15 | 0 | 5 | 0 | |
| 75–84 | 285 | 40 | 20 | 10 | 10 | 140 | 35 | 10 | 15 | 0 | 5 | 0 | |
| 85+ | 125 | 20 | 10 | 5 | 5 | 60 | 10 | 5 | 5 | 0 | 0 | 0 | |
| Total | 2055 | 320 | 210 | 55 | 55 | 950 | 260 | 60 | 100 | 15 | 30 | 5 | |
| 2008–12 | <45 | 530 | 85 | 55 | 10 | 10 | 255 | 60 | 15 | 20 | 0 | 10 | 0 |
| 45–54 | 460 | 75 | 55 | 10 | 10 | 210 | 50 | 15 | 20 | 0 | 10 | 0 | |
| 55–64 | 490 | 85 | 40 | 10 | 10 | 220 | 60 | 15 | 25 | 0 | 10 | 0 | |
| 65–74 | 385 | 60 | 30 | 10 | 10 | 180 | 50 | 15 | 20 | 5 | 10 | 0 | |
| 75–84 | 335 | 50 | 25 | 10 | 10 | 165 | 40 | 10 | 15 | 0 | 5 | 0 | |
| 85+ | 185 | 30 | 15 | 5 | 5 | 90 | 15 | 5 | 5 | 0 | 0 | 0 | |
| Total | 2390 | 385 | 225 | 55 | 55 | 1115 | 270 | 70 | 110 | 15 | 40 | 0 | |
| 2013–17 | <45 | 550 | 90 | 50 | 10 | 15 | 270 | 60 | 15 | 20 | 5 | 10 | 0 |
| 45–54 | 450 | 75 | 50 | 10 | 5 | 210 | 45 | 10 | 20 | 0 | 5 | 0 | |
| 55–64 | 550 | 95 | 45 | 15 | 15 | 240 | 60 | 20 | 30 | 0 | 10 | 0 | |
| 65–74 | 530 | 85 | 40 | 10 | 10 | 245 | 60 | 20 | 30 | 5 | 10 | 0 | |
| 75–84 | 380 | 60 | 30 | 10 | 10 | 190 | 40 | 10 | 20 | 5 | 5 | 0 | |
| 85+ | 235 | 40 | 20 | 5 | 10 | 115 | 20 | 5 | 10 | 0 | 5 | 0 | |
| Total | 2700 | 445 | 235 | 55 | 60 | 1270 | 285 | 80 | 125 | 15 | 45 | 5 | |
| 2018–22 | <45 | 555 | 95 | 40 | 10 | 15 | 285 | 60 | 15 | 20 | 5 | 10 | 0 |
| 45–54 | 430 | 75 | 45 | 5 | 5 | 200 | 40 | 10 | 15 | 0 | 5 | 0 | |
| 55–64 | 585 | 95 | 50 | 10 | 10 | 260 | 55 | 20 | 30 | 0 | 10 | 0 | |
| 65–74 | 670 | 110 | 50 | 15 | 15 | 300 | 70 | 25 | 35 | 5 | 10 | 0 | |
| 75–84 | 465 | 75 | 35 | 10 | 10 | 225 | 50 | 15 | 25 | 5 | 10 | 0 | |
| 85+ | 280 | 45 | 25 | 5 | 10 | 135 | 20 | 5 | 10 | 0 | 0 | 0 | |
| Total | 2980 | 495 | 245 | 60 | 60 | 1405 | 295 | 85 | 135 | 15 | 50 | 5 | |
| 2023–27 | <45 | 550 | 100 | 35 | 10 | 15 | 295 | 60 | 10 | 20 | 5 | 15 | 0 |
| 45–54 | 425 | 70 | 45 | 5 | 5 | 195 | 40 | 10 | 15 | 0 | 5 | 0 | |
| 55–64 | 560 | 95 | 45 | 10 | 10 | 255 | 50 | 15 | 25 | 0 | 5 | 0 | |
| 65–74 | 735 | 115 | 55 | 15 | 15 | 320 | 70 | 25 | 40 | 5 | 10 | 0 | |
| 75–84 | 635 | 100 | 50 | 10 | 10 | 295 | 60 | 20 | 35 | 5 | 10 | 0 | |
| 85+ | 320 | 50 | 30 | 5 | 10 | 155 | 25 | 10 | 10 | 5 | 5 | 0 | |
| Total | 3225 | 530 | 265 | 65 | 60 | 1515 | 305 | 95 | 150 | 15 | 45 | 5 | |
| 2028–32 | <45 | 520 | 100 | 25 | 10 | 15 | 285 | 60 | 10 | 20 | 5 | 15 | 0 |
| 45–54 | 455 | 75 | 45 | 10 | 5 | 215 | 40 | 10 | 15 | 0 | 5 | 0 | |
| 55–64 | 530 | 90 | 45 | 5 | 10 | 240 | 45 | 15 | 25 | 0 | 5 | 0 | |
| 65–74 | 775 | 115 | 65 | 15 | 15 | 340 | 70 | 30 | 40 | 5 | 10 | 0 | |
| 75–84 | 790 | 125 | 65 | 15 | 10 | 360 | 70 | 20 | 45 | 5 | 10 | 0 | |
| 85+ | 400 | 65 | 35 | 10 | 10 | 185 | 30 | 10 | 15 | 5 | 5 | 0 | |
| Total | 3465 | 570 | 275 | 70 | 65 | 1625 | 315 | 100 | 165 | 15 | 45 | 5 | |
Abbreviations: AB, Alberta; BC, British Columbia; CA, Canada; MB, Manitoba; NB, New Brunswick; NL, Newfoundland and Labrador; NS, Nova Scotia; ON, Ontario; PE, Prince Edward Island; QC, Quebec; SK, Saskatchewan; TC, All Territories (Yukon, Northwest Territories and Nunavut).
Note: Totals may not add up due to rounding.
Melanoma is one of the most frequently diagnosed cancers in young adults. The ASIRs in 2003–2007 increased with age to 79.8 per 100 000 in men aged 85 or older and to 37.1 per 100 000 in women of the same age, with the increase being steeper in men than in women for those aged 55 or older (Tables 4.9.3 and 4.9.4). The rates were up to 1.6 times higher in females than in males in those under age 45, approximately equal in the 45–54 age group, and up to 2.1 times higher in men than in women above 55. The observed differences between sexes increased with time in each age group except in the 45–54 age group (Figure 4.9.2).
TABLE 4.9.3.
Observed (2003–2007) and projected age-standardized incidence rates (ASIRs) by age and province/territories combined (TC), melanoma, males, Canada, 2003–2032
| Period | Age | ASIRs | |||||||||||
|---|---|---|---|---|---|---|---|---|---|---|---|---|---|
| CA | BC | AB | SK | MB | ON | QC | NB | NS | PE | NL | TC | ||
| 2003–07 | <45 | 3.4 | 4.3 | 3.2 | 3.2 | 2.5 | 3.9 | 2.0 | 3.9 | 5.6 | 4.5 | 3.4 | 0.6 |
| 45–54 | 17.0 | 18.9 | 18.9 | 18.9 | 16.0 | 19.6 | 9.4 | 21.8 | 26.7 | 33.0 | 12.4 | 18.1 | |
| 55–64 | 29.7 | 37.2 | 32.0 | 26.2 | 27.4 | 36.0 | 15.2 | 30.0 | 42.0 | 35.0 | 26.3 | 14.7 | |
| 65–74 | 48.2 | 52.8 | 53.8 | 41.3 | 40.0 | 59.1 | 25.5 | 61.8 | 69.0 | 74.4 | 37.1 | 21.9 | |
| 75–84 | 64.1 | 72.9 | 59.6 | 40.2 | 33.7 | 84.2 | 30.6 | 79.6 | 82.9 | 102.3 | 72.6 | 28.8 | |
| 85+ | 79.8 | 93.5 | 77.3 | 53.2 | 80.7 | 99.8 | 44.1 | 58.3 | 78.3 | 159.4 | 53.6 | 0.0 | |
| Total | 13.1 | 15.4 | 13.6 | 11.3 | 10.6 | 16.0 | 7.0 | 15.3 | 18.9 | 20.0 | 11.6 | 6.1 | |
| 2008–12 | <45 | 3.4 | 4.1 | 2.9 | 2.8 | 1.9 | 4.2 | 1.9 | 4.2 | 4.6 | 6.1 | 2.9 | 1.6 |
| 45–54 | 16.0 | 18.0 | 15.6 | 15.1 | 14.0 | 18.3 | 9.4 | 18.9 | 25.8 | 29.8 | 14.7 | 7.6 | |
| 55–64 | 31.1 | 38.8 | 32.4 | 30.4 | 25.8 | 38.4 | 13.4 | 35.9 | 43.6 | 52.5 | 32.2 | 14.8 | |
| 65–74 | 52.2 | 63.2 | 52.1 | 44.0 | 40.5 | 63.8 | 26.3 | 67.5 | 78.0 | 74.8 | 45.4 | 24.9 | |
| 75–84 | 74.9 | 81.6 | 73.5 | 59.0 | 48.8 | 98.1 | 35.4 | 82.2 | 95.8 | 118.8 | 86.4 | 35.6 | |
| 85+ | 94.3 | 109.2 | 88.0 | 64.4 | 73.0 | 116.3 | 47.9 | 101.4 | 119.9 | 259.7 | 125.5 | 44.9 | |
| Total | 13.9 | 16.4 | 13.6 | 11.9 | 10.3 | 17.2 | 7.0 | 16.6 | 19.7 | 23.9 | 13.8 | 6.6 | |
| 2013–17 | <45 | 3.2 | 3.8 | 2.5 | 2.6 | 1.8 | 4.2 | 1.8 | 4.4 | 4.6 | 8.9 | 2.9 | 1.5 |
| 45–54 | 15.0 | 18.3 | 14.0 | 14.6 | 10.8 | 16.8 | 8.1 | 17.4 | 24.7 | 27.5 | 25.2 | 7.2 | |
| 55–64 | 30.1 | 36.4 | 30.6 | 28.7 | 22.1 | 37.4 | 13.1 | 35.5 | 41.9 | 53.3 | 27.8 | 14.3 | |
| 65–74 | 54.4 | 67.2 | 53.5 | 47.7 | 43.1 | 67.9 | 24.5 | 67.8 | 78.0 | 77.8 | 44.7 | 25.9 | |
| 75–84 | 81.5 | 90.6 | 76.4 | 66.0 | 51.6 | 106.8 | 37.8 | 93.4 | 107.2 | 105.2 | 104.4 | 38.8 | |
| 85+ | 108.4 | 126.6 | 99.5 | 67.8 | 78.4 | 135.6 | 55.2 | 116.7 | 133.0 | 295.0 | 137.4 | 51.6 | |
| Total | 14.2 | 16.8 | 13.3 | 12.2 | 9.9 | 17.8 | 6.8 | 17.1 | 20.0 | 25.8 | 15.3 | 6.7 | |
| 2018–22 | <45 | 3.0 | 3.6 | 2.4 | 2.8 | 1.8 | 4.0 | 1.7 | 4.7 | 4.4 | 11.5 | 2.9 | 1.4 |
| 45–54 | 14.2 | 17.3 | 12.0 | 13.1 | 7.6 | 16.8 | 7.6 | 16.1 | 22.8 | 28.9 | 35.1 | 6.7 | |
| 55–64 | 27.8 | 32.7 | 27.7 | 22.1 | 20.2 | 34.5 | 12.9 | 31.1 | 41.1 | 36.6 | 20.5 | 13.2 | |
| 65–74 | 53.3 | 66.7 | 51.1 | 49.3 | 41.7 | 66.9 | 22.4 | 63.3 | 78.5 | 85.4 | 39.0 | 25.4 | |
| 75–84 | 84.8 | 98.1 | 80.3 | 66.9 | 54.2 | 110.1 | 38.0 | 101.8 | 113.8 | 97.6 | 102.3 | 40.4 | |
| 85+ | 116.8 | 125.4 | 118.0 | 90.1 | 80.2 | 147.6 | 57.8 | 140.3 | 137.9 | 212.4 | 156.5 | 55.6 | |
| Total | 13.9 | 16.5 | 12.9 | 11.9 | 9.4 | 17.5 | 6.6 | 17.0 | 19.9 | 25.7 | 15.4 | 6.6 | |
| 2023–27 | <45 | 2.8 | 3.5 | 2.4 | 2.9 | 1.7 | 3.7 | 1.6 | 4.8 | 4.4 | 13.0 | 2.9 | 1.3 |
| 45–54 | 12.9 | 14.2 | 9.9 | 10.9 | 6.8 | 16.2 | 7.3 | 15.7 | 22.2 | 33.5 | 41.1 | 6.1 | |
| 55–64 | 25.1 | 31.2 | 25.4 | 19.5 | 16.7 | 30.2 | 11.3 | 27.1 | 40.6 | 25.6 | 24.4 | 11.9 | |
| 65–74 | 49.6 | 59.6 | 48.5 | 43.1 | 36.7 | 62.5 | 21.8 | 59.4 | 74.3 | 60.8 | 23.9 | 23.6 | |
| 75–84 | 84.5 | 98.9 | 82.1 | 68.1 | 58.0 | 111.6 | 35.1 | 94.2 | 113.2 | 79.7 | 77.4 | 40.2 | |
| 85+ | 120.6 | 139.8 | 111.5 | 82.8 | 86.9 | 150.4 | 61.2 | 143.9 | 159.2 | 173.6 | 137.1 | 57.4 | |
| Total | 13.1 | 15.7 | 12.3 | 11.1 | 8.8 | 16.7 | 6.2 | 16.2 | 19.7 | 23.6 | 14.3 | 6.3 | |
| 2028–32 | <45 | 2.7 | 3.7 | 2.4 | 3.0 | 1.7 | 3.3 | 1.6 | 4.9 | 4.5 | 14.7 | 2.9 | 1.3 |
| 45–54 | 11.8 | 11.6 | 9.1 | 11.4 | 6.7 | 16.1 | 6.3 | 16.2 | 20.6 | 38.8 | 47.9 | 5.6 | |
| 55–64 | 23.2 | 29.0 | 22.3 | 17.5 | 11.8 | 29.3 | 10.3 | 24.6 | 36.6 | 21.5 | 28.9 | 11.0 | |
| 65–74 | 45.1 | 53.0 | 44.5 | 32.8 | 34.2 | 56.2 | 21.4 | 51.4 | 74.6 | 39.0 | 14.8 | 21.5 | |
| 75–84 | 81.2 | 95.6 | 79.2 | 68.3 | 56.2 | 107.1 | 32.1 | 88.6 | 113.6 | 76.2 | 59.6 | 38.6 | |
| 85+ | 121.7 | 141.8 | 126.9 | 86.1 | 89.0 | 150.6 | 58.9 | 155.3 | 157.7 | 149.2 | 117.9 | 57.9 | |
| Total | 12.4 | 14.8 | 11.7 | 10.4 | 8.2 | 15.7 | 5.9 | 15.5 | 19.2 | 23.1 | 14.0 | 5.9 | |
Abbreviations: AB, Alberta; BC, British Columbia; CA, Canada; MB, Manitoba; NB, New Brunswick; NL, Newfoundland and Labrador; NS, Nova Scotia; ON, Ontario; PE, Prince Edward Island; QC, Quebec; SK, Saskatchewan; TC, All Territories (Yukon, Northwest Territories and Nunavut).
TABLE 4.9.4.
Observed (2003–2007) and projected age-standardized incidence rates (ASIRs) by age and province/territories combined (TC), melanoma, females, Canada, 2003–2032
| Period | Age | ASIRs | |||||||||||
|---|---|---|---|---|---|---|---|---|---|---|---|---|---|
| CA | BC | AB | SK | MB | ON | QC | NB | NS | PE | NL | TC | ||
| 2003–07 | <45 | 5.3 | 6.4 | 6.1 | 3.6 | 3.6 | 6.2 | 3.0 | 6.1 | 7.5 | 7.4 | 4.6 | 3.0 |
| 45–54 | 17.4 | 19.9 | 22.2 | 18.9 | 13.5 | 20.6 | 8.0 | 21.9 | 23.9 | 19.4 | 19.7 | 11.5 | |
| 55–64 | 20.6 | 24.7 | 20.2 | 16.4 | 15.6 | 24.2 | 11.5 | 22.0 | 40.6 | 39.9 | 19.3 | 17.7 | |
| 65–74 | 26.4 | 29.7 | 25.2 | 18.2 | 20.6 | 32.5 | 15.4 | 34.8 | 39.7 | 45.4 | 21.3 | 0.0 | |
| 75–84 | 32.6 | 35.4 | 32.8 | 30.8 | 24.5 | 41.4 | 15.3 | 38.9 | 57.7 | 63.0 | 25.8 | 0.0 | |
| 85+ | 37.1 | 42.4 | 44.5 | 28.1 | 43.7 | 47.8 | 15.3 | 35.6 | 39.9 | 64.3 | 27.4 | 0.0 | |
| Total | 10.7 | 12.4 | 11.7 | 8.5 | 8.0 | 12.8 | 5.7 | 12.6 | 16.5 | 16.7 | 9.6 | 4.9 | |
| 2008–12 | <45 | 5.4 | 6.6 | 5.1 | 3.7 | 3.6 | 6.5 | 2.9 | 6.3 | 7.3 | 6.5 | 5.6 | 2.5 |
| 45–54 | 17.1 | 20.2 | 20.1 | 14.2 | 10.6 | 19.8 | 7.6 | 21.6 | 26.7 | 18.3 | 18.8 | 7.8 | |
| 55–64 | 22.9 | 28.5 | 21.3 | 18.5 | 15.6 | 27.2 | 10.8 | 28.1 | 39.6 | 24.3 | 23.4 | 10.5 | |
| 65–74 | 28.5 | 31.9 | 25.0 | 21.3 | 19.0 | 34.9 | 14.7 | 38.9 | 46.2 | 53.0 | 34.5 | 13.0 | |
| 75–84 | 36.9 | 41.8 | 36.6 | 26.0 | 25.3 | 47.0 | 16.8 | 39.1 | 62.0 | 53.6 | 35.9 | 16.8 | |
| 85+ | 42.3 | 51.5 | 45.4 | 32.3 | 35.7 | 54.9 | 14.3 | 47.2 | 51.3 | 63.9 | 36.3 | 19.3 | |
| Total | 11.3 | 13.4 | 11.0 | 8.4 | 7.6 | 13.6 | 5.5 | 13.6 | 17.2 | 14.7 | 11.9 | 5.1 | |
| 2013–17 | <45 | 5.4 | 6.6 | 4.3 | 3.7 | 3.6 | 6.7 | 2.7 | 6.4 | 7.4 | 6.8 | 7.6 | 2.5 |
| 45–54 | 17.1 | 20.8 | 18.0 | 11.7 | 8.1 | 19.9 | 7.5 | 21.3 | 25.6 | 11.7 | 15.1 | 7.8 | |
| 55–64 | 22.6 | 28.2 | 19.4 | 18.9 | 15.7 | 26.0 | 9.8 | 30.3 | 38.7 | 18.2 | 23.4 | 10.3 | |
| 65–74 | 31.4 | 36.5 | 26.2 | 21.5 | 17.9 | 38.0 | 14.5 | 43.8 | 53.1 | 40.3 | 36.4 | 14.3 | |
| 75–84 | 39.6 | 44.7 | 36.8 | 26.6 | 24.3 | 50.4 | 16.9 | 42.2 | 64.4 | 70.4 | 40.8 | 18.1 | |
| 85+ | 46.3 | 55.9 | 50.8 | 33.9 | 40.3 | 58.5 | 14.7 | 56.0 | 60.7 | 86.1 | 45.2 | 21.1 | |
| Total | 11.6 | 13.9 | 10.2 | 8.2 | 7.2 | 14.0 | 5.3 | 14.4 | 17.8 | 13.7 | 13.3 | 5.3 | |
| 2018–22 | <45 | 5.2 | 6.5 | 3.4 | 3.9 | 3.6 | 6.7 | 2.6 | 6.4 | 7.5 | 7.0 | 9.4 | 2.4 |
| 45–54 | 17.4 | 21.4 | 16.7 | 9.3 | 7.6 | 20.0 | 7.5 | 21.2 | 25.0 | 10.3 | 13.3 | 8.0 | |
| 55–64 | 22.0 | 26.3 | 19.3 | 16.4 | 14.0 | 25.0 | 9.1 | 31.6 | 37.1 | 20.2 | 19.9 | 10.1 | |
| 65–74 | 32.7 | 37.6 | 26.7 | 25.2 | 18.6 | 38.7 | 14.1 | 45.7 | 56.2 | 29.3 | 33.0 | 14.9 | |
| 75–84 | 41.4 | 47.6 | 35.4 | 28.7 | 21.1 | 51.8 | 16.7 | 45.3 | 70.5 | 75.8 | 46.4 | 18.9 | |
| 85+ | 49.5 | 59.7 | 52.6 | 30.7 | 43.7 | 63.3 | 15.8 | 51.9 | 62.6 | 54.3 | 32.4 | 22.6 | |
| Total | 11.6 | 13.9 | 9.4 | 8.2 | 7.0 | 14.0 | 5.1 | 14.7 | 18.1 | 12.9 | 13.9 | 5.3 | |
| 2023–27 | <45 | 5.0 | 6.5 | 2.6 | 3.9 | 3.7 | 6.6 | 2.6 | 6.1 | 7.5 | 6.7 | 10.5 | 2.3 |
| 45–54 | 16.9 | 18.7 | 17.0 | 10.6 | 7.0 | 18.9 | 7.1 | 21.4 | 25.5 | 14.8 | 14.4 | 7.7 | |
| 55–64 | 21.5 | 25.3 | 17.9 | 14.2 | 11.0 | 24.1 | 9.2 | 30.0 | 35.5 | 15.6 | 12.9 | 9.8 | |
| 65–74 | 31.5 | 35.2 | 25.3 | 26.2 | 18.8 | 35.9 | 13.1 | 47.8 | 54.7 | 23.5 | 26.7 | 14.4 | |
| 75–84 | 44.5 | 51.1 | 38.8 | 29.9 | 20.1 | 54.7 | 16.9 | 49.0 | 79.9 | 62.9 | 39.1 | 20.3 | |
| 85+ | 51.5 | 59.2 | 53.5 | 35.5 | 39.2 | 64.5 | 15.6 | 59.5 | 65.1 | 114.5 | 38.3 | 23.5 | |
| Total | 11.4 | 13.5 | 8.8 | 8.3 | 6.7 | 13.7 | 5.0 | 14.8 | 18.3 | 12.6 | 13.5 | 5.2 | |
| 2028–32 | <45 | 4.7 | 6.2 | 2.0 | 3.8 | 3.7 | 6.2 | 2.6 | 6.3 | 7.6 | 6.5 | 11.6 | 2.1 |
| 45–54 | 17.0 | 18.8 | 14.9 | 12.5 | 7.0 | 19.9 | 6.9 | 19.9 | 26.0 | 16.1 | 16.3 | 7.7 | |
| 55–64 | 21.6 | 25.3 | 16.7 | 11.5 | 10.0 | 23.7 | 9.3 | 29.3 | 34.7 | 12.7 | 9.2 | 9.8 | |
| 65–74 | 30.4 | 31.8 | 25.5 | 23.4 | 16.5 | 33.9 | 12.4 | 48.2 | 52.6 | 26.8 | 20.3 | 13.9 | |
| 75–84 | 45.3 | 50.7 | 39.0 | 35.7 | 21.1 | 54.1 | 16.6 | 50.2 | 83.3 | 47.3 | 32.4 | 20.7 | |
| 85+ | 52.8 | 62.9 | 50.8 | 37.6 | 34.2 | 64.9 | 15.7 | 58.9 | 73.5 | 90.1 | 36.5 | 24.1 | |
| Total | 11.2 | 13.1 | 8.1 | 8.2 | 6.4 | 13.4 | 4.9 | 14.7 | 18.3 | 11.8 | 13.5 | 5.1 | |
Abbreviations: AB, Alberta; BC, British Columbia; CA, Canada; MB, Manitoba; NB, New Brunswick; NL, Newfoundland and Labrador; NS, Nova Scotia; ON, Ontario; PE, Prince Edward Island; QC, Quebec; SK, Saskatchewan; TC, All Territories (Yukon, Northwest Territories and Nunavut).
FIGURE 4.9.2. Age-standardized incidence rates (ASIRs) for melanoma by age group (– males, – females), Canada, 1983–2032.

From 1983–1987 to 2003–2007, melanoma ASIRs in males increased steadily in all regions, with the most pronounced increase in Atlantic Canada (Figure 4.9.1). The increase was not evident in the Prairies and less steep in Quebec in the last observation period (2003–2007). For females, the ASIRs in the Atlantic region, the Prairies and Quebec increased to their peaks in 1998–2002 and then displayed a downward trend at different levels, while the observed rates in Ontario continued to increase. In contrast, British Columbia rates decreased steadily until 1998–2002 and then turned into an upward trend.
FIGURE 4.9.1. Age-standardized incidence rates (ASIRs) by region, melanoma, 1983–2032.

The ASIRs of melanoma in males are projected to peak after 5 years in the Prairies and Quebec, and after 10 years in the Atlantic region, Ontario, British Columbia and Canada as a whole (Figure 4.9.1). The rates for females are predicted to peak after 15 years in Ontario, British Columbia and Canada as a whole, and after 20 years in the Atlantic provinces; whereas the rates in the Prairies and Quebec will continue their most recently observed downward trends. There are regional differences in ASIR levels, but the internal ranking of the regions is similar for males and females. When Quebec is excluded from assessing regional variation because of underreporting in the numbers of cases,42,43 the lowest incidence rates of melanoma are forecast to be in the Prairies and the most elevated rates, in the Atlantic region and in males only in Ontario.
From 2003–2007 to 2028–2032, melanoma ASIRs in Canada are projected to peak and then decrease by 6% in males, from 13.1 to 12.4 per 100 000, and to increase by 5% in females from 10.7 to 11.2 per 100 000 (Tables 4.9.3 and 4.9.4). The annual number of male cases is projected to rise by 75%, from 2320 to 4065, and the number of female cases is projected to rise by 69%, from 2055 to 3465 (Tables 4.9.1 and 4.9.2).
In Quebec, because of the registry's dependence on hospital data before 2008, the numbers of melanoma cases are believed to be underreported.130 Allowing for the expected number of Quebec cases after adjustment for underreporting, the annual increase in melanoma incidence for Canada from 2003–2007 to 2028–2032 would be approximately from 2480 to 4295 cases in males and from 2195 to 3640 cases in females. The adjusted annual number of cases in Quebec would increase over this period from approximately 460 to 660 in males and 405 to 490 in females. The corresponding prediction for the adjusted age-standardized rates in Quebec would be a decrease from 10.7 to 9.1 per 100 000 in males and a decrease from 8.8 to 7.6 per 100 000 in females.
Comments
According to IARC, about 80% of melanoma is caused by exposure to ultraviolet (UV) radiation86 (from the sun and sunbeds). The risks associated with intense and intermittent exposure tend to be greater than those associated with chronic exposure, especially for younger people.131 A history of sunburn doubles the risk.132,133 People with fair complexions, light eyes, red hair colour, or multiple benign or dysplastic nevi are at higher risk.52,134–137 The presence of a family history of melanoma doubles the risk of developing the disease.138,139 Around 10% of melanoma cases are attributable to inherited risk.111,140
Based on an assumption that risk of melanoma will continue to decrease in the more recent birth cohorts (data not shown),141 our analysis shows that the increase in melanoma incidence rates is projected to slow down appreciably in both sexes, and that rates are expected to decrease after 10 or 15 years. The statistical model demonstrates that in male melanoma in Canada, the last 3 estimated cohort coefficients are negative and the earlier cohort coefficients positive, so moving and applying these cohort values to older age groups could decrease the rates. In terms of risk factor, this is likely due to reduced exposure to carcinogenic ultraviolet rays through primary prevention programs aimed at reducing sun exposure and enhancing public awareness. Data to enable the monitoring of trends in sun exposure and sun behaviour of Canadians are lacking and are urgently needed. The projected downturn of melanoma incidence rates in Canada, especially in British Columbia and Ontario, is also possibly linked to the increasing immigration from rare areas of melanoma (such as Asia).105,106,141
10. Breast cancer (in females)
Breast cancer is the most frequently diagnosed cancer and the second leading cause of cancer death in females in Canada. The lifetime risk of developing breast cancer is estimated to be 1 in 9, and the lifetime probability of dying from the disease is 1 in 29.1 The average annual number of new cases of breast cancer in females in 2003–2007 was 20 110 (Table 4.10.1), accounting for 13.0% of all new cancer cases in Canada and 27.1% of the cancer cases in females (Figure 3.9). Breast cancer risk is strongly connected to age, with 88% of cases occurring in women 45 or older in the same period and 67% of cases diagnosed in the age groups between 45 and 74. The incidence rate increased steeply with age up to age 65, followed by a less marked increase to a plateau at age 75–84 (Table 4.10.2). The 5-year relative survival rate was 88% in 2006–2008.1
TABLE 4.10.1.
Observed (2003–2007) and projected average annual new cases by age and province/territories combined (TC), breast cancer, females, Canada, 2003–2032
| Period | Age | New cases | |||||||||||
|---|---|---|---|---|---|---|---|---|---|---|---|---|---|
| CA | BC | AB | SK | MB | ON | QC | NB | NS | PE | NL | TC | ||
| 2003–07 | <45 | 2360 | 310 | 240 | 55 | 70 | 975 | 555 | 45 | 65 | 10 | 30 | 5 |
| 45–54 | 4540 | 575 | 435 | 125 | 155 | 1745 | 1175 | 105 | 130 | 20 | 70 | 10 | |
| 55–64 | 4950 | 620 | 400 | 140 | 180 | 1865 | 1360 | 125 | 150 | 25 | 85 | 10 | |
| 65–74 | 4005 | 500 | 345 | 135 | 135 | 1555 | 1015 | 95 | 135 | 20 | 60 | 5 | |
| 75–84 | 3060 | 395 | 255 | 105 | 125 | 1155 | 765 | 85 | 115 | 15 | 40 | 5 | |
| 85+ | 1195 | 155 | 95 | 55 | 60 | 410 | 310 | 35 | 55 | 5 | 15 | 0 | |
| Total | 20 110 | 2555 | 1770 | 615 | 730 | 7705 | 5175 | 490 | 645 | 90 | 300 | 40 | |
| 2008–12 | <45 | 2135 | 285 | 225 | 45 | 70 | 935 | 445 | 40 | 50 | 5 | 25 | 5 |
| 45–54 | 4805 | 635 | 475 | 125 | 150 | 1910 | 1160 | 110 | 145 | 20 | 65 | 15 | |
| 55–64 | 5850 | 750 | 495 | 165 | 210 | 2175 | 1575 | 150 | 180 | 30 | 95 | 15 | |
| 65–74 | 4735 | 600 | 400 | 145 | 155 | 1805 | 1255 | 115 | 155 | 25 | 85 | 5 | |
| 75–84 | 3050 | 375 | 260 | 105 | 110 | 1170 | 785 | 80 | 110 | 15 | 45 | 5 | |
| 85+ | 1360 | 180 | 110 | 60 | 60 | 505 | 335 | 45 | 55 | 5 | 15 | 0 | |
| Total | 21 930 | 2825 | 1970 | 645 | 755 | 8500 | 5550 | 535 | 695 | 100 | 325 | 45 | |
| 2013–17 | <45 | 2210 | 290 | 235 | 55 | 75 | 970 | 445 | 40 | 50 | 5 | 20 | 5 |
| 45–54 | 4720 | 665 | 475 | 100 | 145 | 1965 | 1055 | 95 | 135 | 20 | 60 | 15 | |
| 55–64 | 6405 | 830 | 580 | 190 | 225 | 2405 | 1665 | 155 | 190 | 35 | 105 | 15 | |
| 65–74 | 5945 | 780 | 500 | 165 | 190 | 2245 | 1580 | 155 | 195 | 30 | 110 | 10 | |
| 75–84 | 3265 | 400 | 295 | 110 | 110 | 1250 | 845 | 85 | 115 | 20 | 55 | 5 | |
| 85+ | 1555 | 195 | 135 | 60 | 60 | 580 | 400 | 45 | 65 | 10 | 15 | 0 | |
| Total | 24 100 | 3160 | 2220 | 685 | 805 | 9415 | 5985 | 585 | 750 | 115 | 370 | 55 | |
| 2018–22 | <45 | 2490 | 325 | 255 | 65 | 85 | 1085 | 485 | 35 | 50 | 5 | 20 | 5 |
| 45–54 | 4350 | 635 | 455 | 85 | 145 | 1915 | 880 | 90 | 115 | 15 | 50 | 15 | |
| 55–64 | 6950 | 945 | 645 | 195 | 225 | 2695 | 1720 | 170 | 210 | 35 | 105 | 20 | |
| 65–74 | 6935 | 930 | 615 | 200 | 220 | 2605 | 1805 | 180 | 225 | 40 | 135 | 15 | |
| 75–84 | 3965 | 500 | 365 | 125 | 130 | 1490 | 1050 | 105 | 140 | 25 | 80 | 5 | |
| 85+ | 1680 | 210 | 150 | 60 | 65 | 630 | 440 | 50 | 65 | 10 | 20 | 0 | |
| Total | 26 375 | 3545 | 2480 | 730 | 865 | 10 420 | 6390 | 630 | 805 | 130 | 410 | 60 | |
| 2023–27 | <45 | 2855 | 375 | 265 | 70 | 90 | 1245 | 525 | 35 | 50 | 5 | 20 | 10 |
| 45–54 | 4425 | 645 | 480 | 105 | 155 | 1955 | 875 | 85 | 110 | 15 | 40 | 10 | |
| 55–64 | 6855 | 995 | 650 | 160 | 220 | 2800 | 1580 | 150 | 200 | 30 | 95 | 20 | |
| 65–74 | 7680 | 1050 | 725 | 230 | 240 | 2935 | 1935 | 190 | 245 | 45 | 150 | 20 | |
| 75–84 | 5075 | 665 | 465 | 145 | 160 | 1895 | 1350 | 150 | 180 | 30 | 110 | 10 | |
| 85+ | 1945 | 235 | 185 | 70 | 65 | 730 | 520 | 55 | 75 | 15 | 30 | 0 | |
| Total | 28 835 | 3970 | 2770 | 780 | 935 | 11 565 | 6785 | 670 | 865 | 145 | 445 | 70 | |
| 2028–32 | <45 | 3090 | 390 | 265 | 65 | 95 | 1295 | 525 | 35 | 50 | 5 | 15 | 10 |
| 45–54 | 4990 | 745 | 525 | 125 | 175 | 2240 | 975 | 80 | 115 | 15 | 40 | 15 | |
| 55–64 | 6385 | 965 | 625 | 140 | 220 | 2755 | 1340 | 135 | 170 | 25 | 80 | 15 | |
| 65–74 | 8385 | 1200 | 810 | 240 | 240 | 3310 | 2015 | 205 | 270 | 50 | 150 | 20 | |
| 75–84 | 5970 | 795 | 575 | 175 | 190 | 2230 | 1565 | 170 | 210 | 40 | 135 | 15 | |
| 85+ | 2435 | 310 | 230 | 80 | 80 | 900 | 670 | 75 | 90 | 20 | 40 | 5 | |
| Total | 31 255 | 4405 | 3035 | 825 | 1000 | 12 730 | 7095 | 700 | 910 | 155 | 470 | 75 | |
Abbreviations: AB, Alberta; BC, British Columbia; CA, Canada; MB, Manitoba; NB, New Brunswick; NL, Newfoundland and Labrador; NS, Nova Scotia; ON, Ontario; PE, Prince Edward Island; QC, Quebec; SK, Saskatchewan; TC, All Territories (Yukon, Northwest Territories and Nunavut).
Note: Totals may not add up due to rounding.
TABLE 4.10.2.
Observed (2003–2007) and projected age-standardized incidence rates (ASIRs) by age and province/territories combined (TC), breast cancer, females, Canada, 2003–2032
| Period | Age | ASIRs | |||||||||||
|---|---|---|---|---|---|---|---|---|---|---|---|---|---|
| CA | BC | AB | SK | MB | ON | QC | NB | NS | PE | NL | TC | ||
| 2003–07 | <45 | 21.8 | 21.7 | 21.3 | 18.2 | 19.3 | 22.7 | 22.3 | 18.3 | 20.3 | 17.5 | 16.3 | 16.2 |
| 45–54 | 182.2 | 171.0 | 177.1 | 170.1 | 182.4 | 185.7 | 191.2 | 170.4 | 171.6 | 161.1 | 156.4 | 170.1 | |
| 55–64 | 278.7 | 256.0 | 264.2 | 284.8 | 296.0 | 279.9 | 295.2 | 275.0 | 256.4 | 286.0 | 256.4 | 294.1 | |
| 65–74 | 338.4 | 318.0 | 357.9 | 363.6 | 328.9 | 341.4 | 336.4 | 321.2 | 361.2 | 357.6 | 316.7 | 318.1 | |
| 75–84 | 352.7 | 340.5 | 377.4 | 344.7 | 365.6 | 342.8 | 354.6 | 391.0 | 419.8 | 406.1 | 329.8 | 426.8 | |
| 85+ | 348.0 | 322.9 | 347.3 | 341.8 | 374.2 | 327.6 | 379.7 | 387.7 | 424.7 | 353.9 | 246.9 | 579.2 | |
| Total | 97.9 | 92.7 | 98.0 | 96.1 | 97.8 | 98.7 | 100.9 | 94.5 | 98.5 | 96.6 | 86.1 | 97.7 | |
| 2008–12 | <45 | 20.9 | 20.6 | 19.8 | 17.4 | 20.7 | 22.8 | 19.8 | 17.6 | 18.7 | 14.4 | 14.5 | 21.1 |
| 45–54 | 177.2 | 174.2 | 171.5 | 159.7 | 161.7 | 181.4 | 180.7 | 172.0 | 181.3 | 167.0 | 151.7 | 178.5 | |
| 55–64 | 273.1 | 250.3 | 252.4 | 274.8 | 286.8 | 270.6 | 296.4 | 276.1 | 263.6 | 280.3 | 242.9 | 275.0 | |
| 65–74 | 349.8 | 324.0 | 360.1 | 367.5 | 342.3 | 350.5 | 359.9 | 335.1 | 358.8 | 395.8 | 354.2 | 352.2 | |
| 75–84 | 337.5 | 313.4 | 358.2 | 358.9 | 340.6 | 333.4 | 342.0 | 371.0 | 391.9 | 418.6 | 335.8 | 339.8 | |
| 85+ | 312.7 | 295.6 | 323.0 | 343.7 | 311.7 | 307.1 | 318.5 | 391.9 | 386.3 | 295.0 | 233.3 | 314.9 | |
| Total | 96.2 | 90.9 | 94.5 | 94.3 | 95.1 | 97.6 | 98.7 | 94.6 | 97.6 | 97.0 | 85.9 | 96.8 | |
| 2013–17 | <45 | 21.4 | 20.4 | 19.8 | 19.9 | 21.2 | 23.4 | 19.7 | 18.7 | 18.5 | 14.1 | 13.3 | 21.6 |
| 45–54 | 176.9 | 182.7 | 172.2 | 138.6 | 164.2 | 184.0 | 175.2 | 161.3 | 180.8 | 157.6 | 144.0 | 178.1 | |
| 55–64 | 262.7 | 243.2 | 242.6 | 269.6 | 274.3 | 260.0 | 283.7 | 261.6 | 256.6 | 300.8 | 246.7 | 264.5 | |
| 65–74 | 351.8 | 330.9 | 345.3 | 361.6 | 337.3 | 350.8 | 369.8 | 360.1 | 354.6 | 376.3 | 361.3 | 354.2 | |
| 75–84 | 342.3 | 310.4 | 370.7 | 381.2 | 343.6 | 336.1 | 352.0 | 369.8 | 396.7 | 455.7 | 385.0 | 344.6 | |
| 85+ | 304.9 | 276.9 | 315.9 | 339.8 | 289.0 | 298.2 | 317.7 | 378.1 | 415.3 | 350.8 | 254.9 | 307.0 | |
| Total | 95.8 | 91.2 | 93.1 | 93.7 | 94.3 | 97.4 | 98.0 | 94.5 | 97.0 | 98.2 | 87.0 | 96.5 | |
| 2018–22 | <45 | 22.8 | 21.3 | 19.9 | 21.9 | 22.7 | 24.7 | 20.2 | 16.9 | 18.6 | 14.0 | 13.1 | 23.0 |
| 45–54 | 174.5 | 180.8 | 169.8 | 134.9 | 170.9 | 188.0 | 165.3 | 166.3 | 174.2 | 147.3 | 131.2 | 175.7 | |
| 55–64 | 262.3 | 254.9 | 242.2 | 261.9 | 255.7 | 260.3 | 280.5 | 269.8 | 265.1 | 298.1 | 243.7 | 264.1 | |
| 65–74 | 340.2 | 320.4 | 329.2 | 350.1 | 328.0 | 336.8 | 365.6 | 342.4 | 345.9 | 384.4 | 364.1 | 342.6 | |
| 75–84 | 354.4 | 324.1 | 383.2 | 390.8 | 352.9 | 346.3 | 371.0 | 382.6 | 400.2 | 494.1 | 437.3 | 356.8 | |
| 85+ | 297.7 | 268.2 | 305.6 | 335.7 | 295.8 | 291.9 | 313.2 | 390.4 | 384.8 | 365.1 | 279.0 | 299.8 | |
| Total | 96.1 | 92.3 | 92.1 | 93.5 | 94.1 | 98.1 | 97.3 | 93.9 | 96.3 | 98.8 | 87.5 | 96.7 | |
| 2023–27 | <45 | 24.8 | 22.7 | 19.7 | 21.9 | 22.6 | 26.4 | 21.4 | 16.9 | 18.6 | 13.9 | 12.9 | 24.9 |
| 45–54 | 175.7 | 179.1 | 172.3 | 158.6 | 179.8 | 191.4 | 161.7 | 168.8 | 174.5 | 146.4 | 123.3 | 176.9 | |
| 55–64 | 263.2 | 269.5 | 246.1 | 231.6 | 260.3 | 266.5 | 275.4 | 254.9 | 266.9 | 286.3 | 235.7 | 265.0 | |
| 65–74 | 330.3 | 316.2 | 319.1 | 346.9 | 314.0 | 329.7 | 352.4 | 331.3 | 340.2 | 410.9 | 372.1 | 332.6 | |
| 75–84 | 356.9 | 331.8 | 368.2 | 386.1 | 347.4 | 349.5 | 382.9 | 410.4 | 398.2 | 463.5 | 446.8 | 359.3 | |
| 85+ | 310.7 | 271.7 | 332.7 | 373.3 | 298.3 | 303.9 | 333.9 | 381.0 | 413.5 | 412.9 | 336.3 | 312.8 | |
| Total | 97.2 | 94.4 | 91.7 | 93.4 | 94.3 | 99.9 | 97.1 | 93.0 | 96.3 | 98.8 | 87.3 | 97.8 | |
| 2028–32 | <45 | 26.0 | 22.6 | 19.6 | 21.8 | 22.5 | 26.2 | 21.3 | 16.9 | 18.5 | 13.8 | 12.8 | 26.2 |
| 45–54 | 186.1 | 191.0 | 173.8 | 172.9 | 191.4 | 207.0 | 169.5 | 156.1 | 175.6 | 145.6 | 122.4 | 187.3 | |
| 55–64 | 260.5 | 268.6 | 243.6 | 224.6 | 271.2 | 273.9 | 261.6 | 260.4 | 258.0 | 270.9 | 218.2 | 262.3 | |
| 65–74 | 331.4 | 333.6 | 322.2 | 335.2 | 294.6 | 331.7 | 352.2 | 338.8 | 352.7 | 410.0 | 369.9 | 333.6 | |
| 75–84 | 344.9 | 321.0 | 354.1 | 373.3 | 339.9 | 336.1 | 378.7 | 384.7 | 387.7 | 492.5 | 455.1 | 347.3 | |
| 85+ | 321.8 | 290.7 | 336.6 | 366.8 | 311.3 | 314.5 | 352.0 | 407.9 | 402.7 | 443.3 | 376.6 | 324.0 | |
| Total | 98.7 | 96.5 | 91.3 | 93.0 | 94.9 | 101.8 | 96.7 | 92.0 | 96.0 | 98.6 | 86.2 | 99.3 | |
Abbreviations: AB, Alberta; BC, British Columbia; CA, Canada; MB, Manitoba; NB, New Brunswick; NL, Newfoundland and Labrador; NS, Nova Scotia; ON, Ontario; PE, Prince Edward Island; QC, Quebec; SK, Saskatchewan; TC, All Territories (Yukon, Northwest Territories and Nunavut).
Breast cancer incidence in Canada increased through the 1980s and 1990s and has decreased since then (Figure 4.10.1). Similar patterns occurred in women aged 45 to 74, despite fluctuation in the 65–74 age group (Figure 4.10.2). The rise in overall breast cancer incidence rates until 1998–2002 was seen primarily in women aged 55 to 74 and was more evident in women aged 55 to 64, who are in the targeted age group (50–69 years) of the provincial/territorial organized breast cancer screening programs. While incidence rates have remained steady over time in the youngest females, the rates have decreased in the oldest age group. During the last 10 observation years, breast cancer ASIRs decreased significantly by 0.7% per year (Figure 3.2). Inter-regional comparison illustrates that female breast cancer incidence rates appear to be fairly consistent across the country (Figure 4.10.1).
FIGURE 4.10.1. Age-standardized incidence rates (ASIRs) by region, female breast cancer, 1983–2032.

FIGURE 4.10.2. Age-standardized incidence rates (ASIRs) for female breast cancer by age group, Canada, 1983–2032.

Extending the current 10 years trend into the future gives predicted relatively stable rates in Canada (Figure 4.10.1). The ASIRs are projected to increase slightly in British Columbia and Ontario but decrease slightly in other regions. The generally consistent regional rates of breast cancer in females are expected to continue.
The age-specific comparison indicates that the primary trend of cancer incidence in Canada in each age group is expected to be static (Figure 4.10.2). From 2003–2007 to 2028–2032, the ASIRs for breast cancer are projected to be stable and will be 98.7 per 100 000 by the end of that period (Table 4.10.2). Over the same period, the annual number of new cases is predicted to increase by 55%, from 20 110 to 31 255.
Comments
Breast cancer incidence in Canada rose steadily during the 1980s and 1990s and has since decreased. The most prominent increases until the early 1990s may reflect the introduction of organized provincial screening programs and increasing uptake of breast cancer screening, leading to a transient additional increase in incidence due to the detection of a prevalent pool of undiagnosed cancers.1 Screening may have resulted in the more recent decrease because of the exhaustion of undiagnosed prevalent cases. In 2008, 72% of Canadian women aged between 50 and 69 reported having had a screening mammogram in the preceding 2 years, an increase from 40% in 1990.142 The increase occurred from 1990 to 2000/2001, and mammography utilization rates have since stabilized.
In 2011, the Canadian Task Force on Preventive Health Care released its recommendations on breast cancer screening for women aged 40 to 74 at average risk of breast cancer.143 The Task Force recommends that women aged 50 to 74 be routinely screened with mammography every 2 to 3 years (where previously it was 1 to 2 years), and that women aged 40 to 49 not be routinely screened with mammography. The Task Force notes a gap in knowledge exists about the benefits and harms of screening using mammography for females aged less than 40 and more than 74. In 2013, the Canadian Association of Radiologists (CAR) published new practice guidelines which differ from the Task Force's recommendations.144 The CAR recommends annual screening of women aged 40 to 49 and annual or biennial screening of women aged 50 to 74.144
Some of screen-detected breast cancers are indolent and would never present clinically; this is referred to as over-diagnosis. In other research, in cohorts screened for breast cancer, there was an increase in the incidence of early-stage disease without a subsequent decrease in late-stage tumours, which is evidence of over-diagnosis in this disease.145 Miller et al.146 reported that 22% of screen-detected breast cancers were over-diagnosed in the most recent Canadian study with up to 25-year follow-up of women aged 40 to 59. The extent of over-diagnosis might be underestimated, as ductal carcinoma in situ was not included in the study. Miller et al.146 also observed that mammography does not reduce breast cancer mortality. While the screening can detect small cancers, it is associated with exposure to x-rays, false positive results, complications of extra breast cancer diagnosis (such as biopsy), and treatment for breast cancer that would not have caused any problem in a woman's lifetime. Mammography screening for average-risk women should be considered based on a discussion between a woman and her physician weighing the benefits and risks.
The trend in breast cancer incidence rates is likely linked to changes in hormonal factors. Studies indicate that early menarche, late menopause, delayed first full-term pregnancy and no full-term pregnancy are associated with increased risks of breast cancer.147 A larger number of births and breastfeeding have protective effects.147 The long-term decrease in fertility rates in Canada would be expected to result in an increase in breast cancer rates, but fertility rates have stabilized.148,149 Both oral contraceptives and hormone replacement therapy increase the incidence of breast cancer.147,150,151 Following a 2002 Women's Health Initiative trial report about increased breast cancer risk associated with hormone replacement therapy, its use fell dramatically in Canada and elsewhere, which appears to have contributed to a temporary decrease in breast cancer incidence rates.152,153 Obesity increases breast cancer risk in postmeno-pausal women, but may be protective in premenopausal women.85,147 Breast density is strongly and independently associated with risk of breast cancer, with approximately 4-fold increased risk for highest (≥75%) versus lowest density (<10%).154 Breast density is mainly influenced by genetic factors, and is also inversely associated with age, menopausal status and parity.154–156 Breast density makes detecting cancer by mammography difficult and increases risk of advanced tumour stage at diagnosis.157,158 IARC classified ‘'shift work that involves circadian disruption’’ as a probable human carcinogen for breast cancer.47
Approximately 27% of breast cancer cases diagnosed in the United Kingdom (UK) in 2010 are attributable to mostly modifiable lifestyle and environmental factors.159 A systematic analysis of 48 studies shows a modest (15%–20%) risk reduction for physically active females, with a stronger link for postmenopausal women (20%–80%).160 The analysis also indicated a 6% reduction in breast cancer risk for each additional hour of physical activity per week. In the Canadian context, light intensity activity did not reduce breast cancer risk.161 The occurrence of breast cancer is causally related to the consumption of alcoholic beverages.47,162 According to the IARC, the evidence that tobacco smoking causes breast cancer is limited.163 However, considerable evidence has suggested a potentially casual role for active smoking and early smoking initiation.164,165 The association between passive smoking and breast cancer is still a topic of some debate, although there has been a suggestion for an elevated risk for premenopausal breast cancer.147,165 X-radiation and gamma-radiation are associated with increased risk of breast cancer.47 The younger the age of exposure, the greater the excess risk.151 Changes in the modifiable factors may have also influenced the trend of breast cancer.
11. Cervix cancer
Cervix cancer was responsible for 0.9% of all new Canadian cases of cancer and 1.8% of cancer cases in females, with an average of 1345 new cases annually in 2003–2007 (Table 4.11.1). One in 145 females can expect to develop the disease in her lifetime, and 1 in 443 females are likely to die from it.1 During 1998–2007, the ASIRs for cervix cancer decreased significantly by 1.4% per year (Figure 3.2). The 5-year relative survival rate for cervix cancer was 74% in Canada between 2006 and 2008.1
TABLE 4.11.1.
Observed (2003–2007) and projected average annual new cases by age and province/territories combined (TC), cervix Cancer, Canada, 2003–2032
| Period | Age | New cases | |||||||||||
|---|---|---|---|---|---|---|---|---|---|---|---|---|---|
| CA | BC | AB | SK | MB | ON | QC | NB | NS | PE | NL | TC | ||
| 2003–07 | <45 | 580 | 70 | 75 | 15 | 20 | 230 | 115 | 15 | 25 | 5 | 10 | 0 |
| 45–54 | 305 | 30 | 35 | 10 | 10 | 120 | 70 | 10 | 10 | 0 | 5 | 0 | |
| 55–64 | 195 | 25 | 15 | 5 | 10 | 80 | 45 | 5 | 5 | 0 | 5 | 0 | |
| 65–74 | 120 | 10 | 10 | 5 | 5 | 50 | 30 | 5 | 5 | 0 | 0 | 0 | |
| 75–84 | 110 | 10 | 10 | 5 | 5 | 40 | 30 | 5 | 5 | 0 | 0 | 0 | |
| 85+ | 35 | 5 | 5 | 0 | 0 | 15 | 10 | 0 | 0 | 0 | 0 | 0 | |
| Total | 1345 | 155 | 150 | 40 | 45 | 530 | 300 | 35 | 50 | 10 | 25 | 5 | |
| 2008–12 | <45 | 520 | 60 | 85 | 15 | 15 | 210 | 95 | 15 | 20 | 5 | 10 | 0 |
| 45–54 | 300 | 30 | 30 | 10 | 10 | 120 | 75 | 5 | 10 | 0 | 5 | 0 | |
| 55–64 | 225 | 25 | 20 | 5 | 10 | 90 | 50 | 5 | 5 | 0 | 5 | 0 | |
| 65–74 | 130 | 15 | 15 | 5 | 5 | 55 | 30 | 5 | 5 | 0 | 0 | 0 | |
| 75–84 | 85 | 10 | 5 | 0 | 5 | 30 | 25 | 5 | 0 | 0 | 0 | 0 | |
| 85+ | 40 | 5 | 5 | 0 | 0 | 15 | 10 | 0 | 0 | 0 | 0 | 0 | |
| Total | 1295 | 145 | 160 | 40 | 45 | 520 | 285 | 30 | 45 | 5 | 20 | 5 | |
| 2013–17 | <45 | 505 | 55 | 85 | 20 | 15 | 210 | 85 | 10 | 20 | 5 | 10 | 0 |
| 45–54 | 280 | 30 | 35 | 10 | 10 | 115 | 65 | 5 | 10 | 0 | 5 | 0 | |
| 55–64 | 245 | 25 | 25 | 5 | 10 | 100 | 60 | 5 | 10 | 0 | 5 | 0 | |
| 65–74 | 150 | 15 | 15 | 5 | 5 | 60 | 35 | 5 | 5 | 0 | 0 | 0 | |
| 75–84 | 80 | 10 | 5 | 0 | 5 | 30 | 20 | 5 | 0 | 0 | 0 | 0 | |
| 85+ | 35 | 5 | 5 | 0 | 0 | 10 | 10 | 0 | 0 | 0 | 0 | 0 | |
| Total | 1290 | 140 | 165 | 40 | 40 | 525 | 280 | 30 | 45 | 5 | 20 | 5 | |
| 2018–22 | <45 | 495 | 50 | 80 | 15 | 15 | 215 | 80 | 10 | 20 | 5 | 10 | 0 |
| 45–54 | 270 | 30 | 35 | 10 | 5 | 115 | 60 | 5 | 10 | 0 | 0 | 0 | |
| 55–64 | 260 | 30 | 25 | 10 | 10 | 105 | 65 | 5 | 10 | 0 | 5 | 0 | |
| 65–74 | 175 | 20 | 20 | 5 | 5 | 70 | 45 | 5 | 5 | 0 | 0 | 0 | |
| 75–84 | 85 | 10 | 10 | 5 | 5 | 30 | 25 | 5 | 0 | 0 | 0 | 0 | |
| 85+ | 35 | 5 | 5 | 0 | 0 | 10 | 10 | 0 | 0 | 0 | 0 | 0 | |
| Total | 1320 | 140 | 175 | 45 | 40 | 550 | 280 | 30 | 45 | 5 | 15 | 5 | |
| 2023–27 | <45 | 500 | 50 | 65 | 15 | 15 | 230 | 75 | 10 | 20 | 5 | 10 | 0 |
| 45–54 | 280 | 30 | 50 | 10 | 5 | 115 | 60 | 5 | 10 | 0 | 5 | 0 | |
| 55–64 | 255 | 30 | 30 | 10 | 10 | 105 | 60 | 5 | 10 | 0 | 0 | 0 | |
| 65–74 | 210 | 20 | 25 | 5 | 5 | 85 | 55 | 5 | 5 | 0 | 0 | 0 | |
| 75–84 | 105 | 10 | 10 | 5 | 5 | 40 | 30 | 5 | 0 | 0 | 0 | 0 | |
| 85+ | 35 | 5 | 5 | 0 | 0 | 10 | 10 | 0 | 0 | 0 | 0 | 0 | |
| Total | 1385 | 145 | 180 | 45 | 45 | 580 | 290 | 35 | 50 | 10 | 15 | 5 | |
| 2028–32 | <45 | 490 | 50 | 65 | 15 | 15 | 230 | 75 | 10 | 20 | 0 | 10 | 0 |
| 45–54 | 290 | 25 | 45 | 10 | 5 | 120 | 55 | 5 | 10 | 0 | 5 | 0 | |
| 55–64 | 260 | 30 | 35 | 10 | 5 | 105 | 55 | 5 | 10 | 0 | 0 | 0 | |
| 65–74 | 225 | 25 | 25 | 5 | 5 | 90 | 65 | 5 | 5 | 0 | 0 | 0 | |
| 75–84 | 130 | 15 | 15 | 5 | 5 | 50 | 40 | 5 | 5 | 0 | 0 | 0 | |
| 85+ | 40 | 5 | 5 | 0 | 0 | 15 | 15 | 0 | 0 | 0 | 0 | 0 | |
| Total | 1435 | 150 | 185 | 50 | 45 | 610 | 300 | 35 | 50 | 10 | 15 | 5 | |
Abbreviations: AB, Alberta; BC, British Columbia; CA, Canada; MB, Manitoba; NB, New Brunswick; NL, Newfoundland and Labrador; NS, Nova Scotia; ON, Ontario; PE, Prince Edward Island; QC, Quebec; SK, Saskatchewan; TC, All Territories (Yukon, Northwest Territories and Nunavut).
Note: Totals may not add up due to rounding.
The pattern of age-specific rates of cervix cancer differs from those of most others cancers. Women aged 45 or older experienced almost double the incidence rate of their younger counterparts in 2003–2007 (Table 4.11.2). However, the number of cases decreased significantly with age (Table 4.11.1). The observed incidence rates decreased in all age groups, at approximately similar levels for age groups 45 and over (Figure 4.11.2). The predictions indicate that the incidence rates will decrease with time and then level off in each age group. The rates are projected to decrease with age in each period for women aged 45 and over (Figure 4.11.2). Women aged 85 or older will eventually experience rates as low as those in the youngest age group.
TABLE 4.11.2.
Observed (2003–2007) and projected age-standardized incidence rates (ASIRs) by age and province/territories combined (TC), cervix cancer, Canada, 2003–2032
| Period | Age | ASIRs | |||||||||||
|---|---|---|---|---|---|---|---|---|---|---|---|---|---|
| CA | BC | AB | SK | MB | ON | QC | NB | NS | PE | NL | TC | ||
| 2003–07 | <45 | 5.9 | 5.4 | 7.5 | 6.5 | 5.5 | 5.9 | 5.0 | 6.3 | 9.1 | 8.1 | 7.6 | 4.0 |
| 45–54 | 12.3 | 9.5 | 13.3 | 17.3 | 12.5 | 13.1 | 11.8 | 12.8 | 12.9 | 11.5 | 9.7 | 19.6 | |
| 55–64 | 10.8 | 10.8 | 10.8 | 8.7 | 12.6 | 11.8 | 9.3 | 7.5 | 12.3 | 17.2 | 11.6 | 29.3 | |
| 65–74 | 10.2 | 6.9 | 12.9 | 7.7 | 12.8 | 10.5 | 9.5 | 14.1 | 14.0 | 14.7 | 11.2 | 0.0 | |
| 75–84 | 12.3 | 10.2 | 13.1 | 9.8 | 10.1 | 11.4 | 14.6 | 19.2 | 14.1 | 14.5 | 11.2 | 0.0 | |
| 85+ | 10.8 | 7.5 | 13.1 | 8.9 | 6.2 | 10.0 | 13.7 | 10.5 | 11.2 | 32.2 | 11.8 | 96.5 | |
| Total | 7.6 | 6.6 | 9.1 | 8.1 | 7.5 | 7.7 | 6.8 | 8.1 | 10.3 | 10.1 | 8.6 | 8.4 | |
| 2008–12 | <45 | 5.4 | 4.5 | 7.7 | 6.6 | 4.8 | 5.4 | 4.3 | 6.4 | 8.7 | 7.2 | 6.8 | 6.0 |
| 45–54 | 11.3 | 8.8 | 11.8 | 13.3 | 10.3 | 11.7 | 11.9 | 8.5 | 13.7 | 15.0 | 9.5 | 12.6 | |
| 55–64 | 10.3 | 8.8 | 11.0 | 11.1 | 10.9 | 11.2 | 9.4 | 11.2 | 10.8 | 13.7 | 7.7 | 11.4 | |
| 65–74 | 9.5 | 7.5 | 11.9 | 10.5 | 11.3 | 10.3 | 8.9 | 9.0 | 9.1 | 12.6 | 8.4 | 10.5 | |
| 75–84 | 9.3 | 7.1 | 8.6 | 7.8 | 13.7 | 9.0 | 10.1 | 15.6 | 8.8 | 12.3 | 12.8 | 10.3 | |
| 85+ | 8.7 | 8.4 | 10.9 | 8.1 | 6.5 | 7.7 | 11.3 | 9.7 | 5.7 | 11.6 | 9.3 | 9.7 | |
| Total | 6.9 | 5.7 | 8.8 | 8.0 | 6.7 | 7.1 | 6.2 | 7.6 | 9.4 | 9.2 | 7.5 | 7.7 | |
| 2013–17 | <45 | 5.0 | 3.9 | 7.0 | 6.4 | 4.4 | 5.2 | 3.9 | 5.9 | 8.6 | 6.7 | 6.7 | 5.6 |
| 45–54 | 10.8 | 8.4 | 12.4 | 13.7 | 9.3 | 11.0 | 11.3 | 9.2 | 12.5 | 14.3 | 7.9 | 11.9 | |
| 55–64 | 10.0 | 8.0 | 10.6 | 10.7 | 9.8 | 10.7 | 10.2 | 10.1 | 10.1 | 13.3 | 6.9 | 11.1 | |
| 65–74 | 8.7 | 7.0 | 10.7 | 10.2 | 10.2 | 9.5 | 8.4 | 7.7 | 6.8 | 11.6 | 5.3 | 9.7 | |
| 75–84 | 8.1 | 6.1 | 8.7 | 8.4 | 12.5 | 7.8 | 8.8 | 12.6 | 7.1 | 10.8 | 8.5 | 9.0 | |
| 85+ | 6.7 | 6.4 | 7.2 | 4.8 | 5.9 | 6.4 | 8.5 | 9.1 | 4.5 | 8.9 | 7.0 | 7.5 | |
| Total | 6.5 | 5.0 | 8.2 | 7.8 | 6.1 | 6.7 | 5.7 | 7.0 | 8.9 | 8.6 | 6.8 | 7.2 | |
| 2018–22 | <45 | 4.7 | 3.3 | 6.4 | 5.9 | 4.1 | 5.0 | 3.5 | 5.2 | 8.2 | 6.2 | 6.9 | 5.2 |
| 45–54 | 11.3 | 8.8 | 13.8 | 15.9 | 8.7 | 11.8 | 11.3 | 12.0 | 14.1 | 14.9 | 6.4 | 12.5 | |
| 55–64 | 9.7 | 7.8 | 10.3 | 10.7 | 9.2 | 10.0 | 10.6 | 8.8 | 10.5 | 12.9 | 6.0 | 10.8 | |
| 65–74 | 8.7 | 6.6 | 10.3 | 9.8 | 9.6 | 9.4 | 8.9 | 9.8 | 7.2 | 11.6 | 4.2 | 9.7 | |
| 75–84 | 7.5 | 5.7 | 8.7 | 11.8 | 11.7 | 7.4 | 8.3 | 9.8 | 5.2 | 10.0 | 5.5 | 8.4 | |
| 85+ | 5.8 | 4.7 | 8.2 | 5.1 | 5.4 | 5.3 | 7.1 | 6.9 | 2.9 | 7.7 | 8.4 | 6.4 | |
| Total | 6.2 | 4.6 | 7.9 | 7.8 | 5.7 | 6.6 | 5.5 | 6.8 | 8.8 | 8.3 | 6.5 | 6.9 | |
| 2023–27 | <45 | 4.6 | 3.1 | 5.2 | 5.7 | 4.0 | 5.1 | 3.3 | 5.0 | 7.8 | 6.0 | 6.6 | 5.1 |
| 45–54 | 11.3 | 7.9 | 17.5 | 16.2 | 8.4 | 11.3 | 10.8 | 13.0 | 17.9 | 15.0 | 8.2 | 12.5 | |
| 55–64 | 9.8 | 8.1 | 11.3 | 11.7 | 8.9 | 9.9 | 10.6 | 10.5 | 10.9 | 13.0 | 5.3 | 10.9 | |
| 65–74 | 9.0 | 6.5 | 10.4 | 9.7 | 9.3 | 9.4 | 10.4 | 9.8 | 7.7 | 12.0 | 4.1 | 10.0 | |
| 75–84 | 7.4 | 5.8 | 8.3 | 11.4 | 11.3 | 7.2 | 8.4 | 9.7 | 4.7 | 9.9 | 3.6 | 8.2 | |
| 85+ | 5.5 | 5.0 | 8.4 | 6.0 | 5.2 | 4.9 | 6.9 | 6.5 | 3.0 | 7.3 | 4.6 | 6.1 | |
| Total | 6.2 | 4.4 | 7.5 | 7.8 | 5.5 | 6.5 | 5.4 | 6.8 | 9.0 | 8.2 | 6.4 | 6.8 | |
| 2028–32 | <45 | 4.4 | 3.0 | 5.0 | 5.6 | 3.9 | 5.0 | 3.2 | 4.7 | 7.3 | 5.8 | 6.4 | 4.9 |
| 45–54 | 10.9 | 6.6 | 14.6 | 15.1 | 8.1 | 11.4 | 9.8 | 11.8 | 18.7 | 14.4 | 9.3 | 12.1 | |
| 55–64 | 10.6 | 8.8 | 13.0 | 13.7 | 8.6 | 10.7 | 10.9 | 14.3 | 12.9 | 14.0 | 4.4 | 11.7 | |
| 65–74 | 9.0 | 6.6 | 10.3 | 10.3 | 8.9 | 9.0 | 10.9 | 9.0 | 8.5 | 11.9 | 3.6 | 10.0 | |
| 75–84 | 7.7 | 5.6 | 8.2 | 11.6 | 11.0 | 7.4 | 9.2 | 12.9 | 5.4 | 10.2 | 3.1 | 8.5 | |
| 85+ | 5.3 | 4.6 | 8.7 | 9.6 | 5.1 | 5.0 | 6.6 | 4.5 | 1.9 | 7.1 | 3.3 | 5.9 | |
| Total | 6.1 | 4.2 | 7.3 | 7.9 | 5.3 | 6.5 | 5.3 | 6.9 | 9.0 | 8.1 | 6.2 | 6.7 | |
Abbreviations: AB, Alberta; BC, British Columbia; CA, Canada; MB, Manitoba; NB, New Brunswick; NL, Newfoundland and Labrador; NS, Nova Scotia; ON, Ontario; PE, Prince Edward Island; QC, Quebec; SK, Saskatchewan; TC, All Territories (Yukon, Northwest Territories and Nunavut).
FIGURE 4.11.2. Age-standardized incidence rates (ASIRs) for cervix cancer by age group, Canada, 1983–2032.

In all regions, the incidence rates have decreased with time, at similar degrees (Figure 4.11.1). The projections show that British Columbia will continue to have the lowest rates, while the Prairies will experience the highest incidence after 2008–2012.
FIGURE 4.11.1. Age-standardized incidence rates (ASIRs) by region, cervix cancers, 1983–2032.

From 2003–2007 to 2028–2032, the ASIRs of cervix cancer for Canada are expected to decrease by 20%, from 7.6 to 6.1 per 100 000 (Table 4.11.2). With the projected Canada population growth and aging, however, the annual number of new cases is predicted to increase by 7%, from 1345 to 1435 (Table 4.11.1).
Comments
The 2013 IARC summary concludes that there is sufficient evidence for the human carcinogenicity of HPV types 16, 18, 31, 33, 35, 39, 45, 51, 52, 56, 58 and 59 in the cervix.47 Virtually all cervical cancers are causally linked to HPV.166 HPV types 16 and 18 cause approximately 70% of all cervical cancers.167,168 The overall HPV prevalence was estimated at 16.8% in females in British Columbia, with the prevalence of high-risk HPV at 13.9%.169 HPV DNA point prevalence is thought to underestimate cumulative incidence of infection as many infections resolve spontaneously. People with immunosuppression caused by human immunodeficiency virus (HIV) infection or organ transplantation are also at increased risk.170 Cigarette smoking generally doubles the risk of developing the disease, with dose-response trends for both smoking frequency and duration.52 About 7% of cervical cancer cases were attributed to smoking in the UK in 2010.171
Cervical cancer incidence rate has dropped significantly due to general population screening with the Papanicolaou (Pap) test that allows early detection and treatment of precancerous lesions. The 2013 Annual Report to the Nation on the Status of Cancer56 shows that the prevalence of the Pap test is negatively associated with cervical cancer incidence rates in the US but positively associated with vaccination coverage levels. Information on cervical cancer screening has not been included in the statistical projections in this report, but cervical cancer screening has been widespread in Canada for many decades and therefore its impact on future trends of cervical cancer incidence has been taken into account to some extent through observed incidence rates. Cervical cancer rates should fall even faster, as the effects of HPV vaccinations come into play. A recently introduced vaccine has been shown to reduce the risk of infection with HPV types 16 and 18. The reduction in incidence rates that might be expected for newly vaccinated cohorts depends on the eligibility and coverage as well as the percentage of cancers prevented by the vaccine.172 The primary age group recommended for HPV vaccination is females aged 9 to 13. The vaccination is also recommended for females aged 14 to 26 as there still is the potential for benefit regardless of previous history of sexual activity.173 Women aged 20 to 24 would be included in the lower risk cohorts by 2020 and those aged 30 to 34, by 2030. If the vaccine prevents 70% of new cervical cancers173 and population coverage is 60%,60 the reduction in the incidence rate for all ages combined will be minimal by 2020, but the incidence rate is estimated to be reduced by about an additional 7% by 2030, from 6.1 to 5.5 per 100 000.
12. Cancer of the body of the uterus
Uterine cancer, or endometrial cancer specifically, which arises in the body of the uterus, is the fourth most common cancer in Canadian females and the most frequently diagnosed gynecological malignancy. The likelihood of developing uterine cancer is 1 in 39, and the lifetime probability of dying from the disease is 1 in 173.1 In 2003–2007, the average annual number of new uterine cancer cases was 4105, or 5.5% of all cancer cases in females (Table 4.12.1). Uterine cancer is rarely seen before age 45 (2.0 per 100 000), but the incidence increased sharply with age, peaked at 82.0 per 100 000 in the 65–74 age group, and subsequently decreased gradually (Table 4.12.2). Approximately 57% of the new cases were diagnosed in women aged 55 to 74. Uterine cancer has the highest 5-year relative survival rate among all main gynecological cancers (including cervix, ovarian, vaginal and vulvar) in Canada, at 85% for 2006–2008.1
TABLE 4.12.1.
Observed (2003–2007) and projected average annual new cases by age and province/territories combined (TC), cancer of body of uterus, Canada, 2003–2032
| Period | Age | New cases | |||||||||||
|---|---|---|---|---|---|---|---|---|---|---|---|---|---|
| CA | BC | AB | SK | MB | ON | QC | NB | NS | PE | NL | TC | ||
| 2003–07 | <45 | 220 | 25 | 25 | 5 | 10 | 90 | 40 | 5 | 5 | 0 | 5 | 0 |
| 45–54 | 730 | 100 | 75 | 20 | 35 | 275 | 170 | 15 | 20 | 5 | 15 | 0 | |
| 55–64 | 1355 | 170 | 135 | 40 | 55 | 530 | 320 | 30 | 45 | 5 | 20 | 0 | |
| 65–74 | 970 | 120 | 85 | 30 | 40 | 400 | 225 | 25 | 30 | 5 | 15 | 0 | |
| 75–84 | 630 | 80 | 45 | 20 | 30 | 255 | 165 | 15 | 20 | 0 | 10 | 0 | |
| 85+ | 205 | 25 | 15 | 10 | 5 | 70 | 60 | 5 | 5 | 0 | 0 | 0 | |
| Total | 4105 | 520 | 380 | 130 | 175 | 1620 | 980 | 95 | 125 | 20 | 60 | 5 | |
| 2008–12 | <45 | 230 | 35 | 25 | 5 | 10 | 95 | 40 | 5 | 5 | 0 | 5 | 0 |
| 45–54 | 810 | 110 | 85 | 25 | 35 | 320 | 180 | 20 | 20 | 5 | 15 | 0 | |
| 55–64 | 1685 | 220 | 160 | 50 | 70 | 675 | 380 | 35 | 50 | 5 | 25 | 5 | |
| 65–74 | 1200 | 165 | 105 | 35 | 45 | 480 | 285 | 30 | 35 | 5 | 15 | 0 | |
| 75–84 | 640 | 80 | 50 | 20 | 25 | 265 | 165 | 15 | 20 | 5 | 10 | 0 | |
| 85+ | 250 | 35 | 15 | 5 | 10 | 90 | 75 | 5 | 10 | 0 | 0 | 0 | |
| Total | 4815 | 640 | 445 | 145 | 195 | 1925 | 1125 | 105 | 140 | 20 | 70 | 10 | |
| 2013–17 | <45 | 245 | 35 | 20 | 5 | 10 | 100 | 40 | 5 | 5 | 0 | 5 | 0 |
| 45–54 | 840 | 120 | 95 | 20 | 35 | 350 | 170 | 10 | 20 | 5 | 15 | 0 | |
| 55–64 | 1915 | 255 | 190 | 55 | 75 | 785 | 420 | 45 | 45 | 5 | 25 | 5 | |
| 65–74 | 1610 | 225 | 140 | 50 | 60 | 645 | 375 | 35 | 50 | 5 | 20 | 5 | |
| 75–84 | 715 | 90 | 55 | 25 | 30 | 295 | 180 | 15 | 20 | 5 | 10 | 0 | |
| 85+ | 260 | 35 | 20 | 5 | 10 | 100 | 75 | 5 | 10 | 0 | 0 | 0 | |
| Total | 5590 | 760 | 520 | 160 | 215 | 2275 | 1260 | 120 | 150 | 20 | 80 | 10 | |
| 2018–22 | <45 | 275 | 35 | 20 | 5 | 10 | 110 | 45 | 5 | 5 | 0 | 5 | 0 |
| 45–54 | 835 | 135 | 85 | 20 | 35 | 355 | 155 | 10 | 20 | 5 | 15 | 0 | |
| 55–64 | 2105 | 275 | 225 | 55 | 80 | 900 | 435 | 40 | 45 | 10 | 25 | 5 | |
| 65–74 | 1975 | 280 | 175 | 60 | 70 | 800 | 440 | 45 | 55 | 10 | 30 | 5 | |
| 75–84 | 885 | 115 | 70 | 30 | 35 | 360 | 225 | 20 | 30 | 5 | 15 | 0 | |
| 85+ | 290 | 40 | 20 | 10 | 10 | 115 | 85 | 5 | 10 | 0 | 0 | 0 | |
| Total | 6370 | 885 | 595 | 175 | 240 | 2640 | 1385 | 130 | 165 | 25 | 90 | 10 | |
| 2023–27 | <45 | 285 | 40 | 25 | 5 | 10 | 120 | 45 | 5 | 5 | 0 | 5 | 0 |
| 45–54 | 860 | 130 | 75 | 20 | 35 | 360 | 155 | 10 | 20 | 5 | 15 | 0 | |
| 55–64 | 2145 | 300 | 240 | 50 | 85 | 950 | 400 | 30 | 55 | 5 | 30 | 5 | |
| 65–74 | 2235 | 315 | 205 | 65 | 80 | 930 | 485 | 60 | 50 | 10 | 25 | 5 | |
| 75–84 | 1205 | 155 | 100 | 35 | 45 | 490 | 295 | 25 | 40 | 5 | 20 | 0 | |
| 85+ | 340 | 50 | 25 | 10 | 10 | 135 | 100 | 10 | 10 | 0 | 5 | 0 | |
| Total | 7065 | 985 | 665 | 190 | 265 | 2980 | 1485 | 140 | 180 | 25 | 95 | 15 | |
| 2028–32 | <45 | 295 | 45 | 25 | 5 | 15 | 125 | 45 | 5 | 5 | 0 | 5 | 0 |
| 45–54 | 970 | 140 | 80 | 25 | 40 | 395 | 170 | 10 | 20 | 5 | 15 | 0 | |
| 55–64 | 2105 | 310 | 220 | 45 | 85 | 950 | 375 | 25 | 45 | 5 | 25 | 5 | |
| 65–74 | 2440 | 335 | 245 | 65 | 85 | 1055 | 500 | 55 | 60 | 10 | 30 | 5 | |
| 75–84 | 1465 | 190 | 120 | 45 | 50 | 605 | 345 | 35 | 45 | 5 | 25 | 5 | |
| 85+ | 430 | 60 | 35 | 10 | 15 | 165 | 125 | 10 | 15 | 5 | 5 | 0 | |
| Total | 7700 | 1080 | 720 | 200 | 285 | 3295 | 1560 | 140 | 190 | 30 | 100 | 15 | |
Abbreviations: AB, Alberta; BC, British Columbia; CA, Canada; MB, Manitoba; NB, New Brunswick; NL, Newfoundland and Labrador; NS, Nova Scotia; ON, Ontario; PE, Prince Edward Island; QC, Quebec; SK, Saskatchewan; TC, All Territories (Yukon, Northwest Territories and Nunavut).
Note: Totals may not add up due to rounding.
TABLE 4.12.2.
Observed (2003–2007) and projected age-standardized incidence rates (ASIRs) by age and province/territories combined (TC), cancer of body of uterus, Canada, 2003–2032
| Period | Age | ASIRs | |||||||||||
|---|---|---|---|---|---|---|---|---|---|---|---|---|---|
| CA | BC | AB | SK | MB | ON | QC | NB | NS | PE | NL | TC | ||
| 2003–07 | <45 | 2.0 | 1.9 | 2.1 | 2.4 | 3.1 | 2.1 | 1.7 | 1.6 | 2.1 | 2.8 | 3.1 | 2.5 |
| 45–54 | 28.8 | 28.6 | 30.1 | 30.4 | 39.8 | 29.0 | 27.2 | 27.8 | 22.7 | 27.6 | 30.1 | 34.0 | |
| 55–64 | 76.1 | 71.2 | 89.7 | 82.6 | 90.7 | 79.7 | 68.9 | 60.9 | 76.4 | 77.5 | 66.7 | 50.7 | |
| 65–74 | 82.0 | 76.5 | 86.3 | 85.5 | 91.7 | 87.9 | 74.1 | 79.7 | 82.9 | 74.8 | 64.8 | 83.7 | |
| 75–84 | 73.1 | 66.9 | 70.5 | 60.8 | 83.1 | 75.6 | 75.8 | 73.9 | 64.7 | 52.8 | 60.7 | 0.0 | |
| 85+ | 59.5 | 54.5 | 53.3 | 54.8 | 42.4 | 56.9 | 75.5 | 58.7 | 55.9 | 75.1 | 19.6 | 96.5 | |
| Total | 19.9 | 18.7 | 21.4 | 20.6 | 23.9 | 20.7 | 18.6 | 18.1 | 19.0 | 19.3 | 17.9 | 16.4 | |
| 2008–12 | <45 | 2.3 | 2.4 | 2.2 | 1.9 | 3.2 | 2.3 | 1.8 | 1.4 | 2.2 | 2.3 | 3.2 | 1.8 |
| 45–54 | 29.1 | 29.0 | 30.2 | 30.9 | 35.4 | 30.0 | 27.1 | 26.4 | 22.2 | 25.7 | 30.1 | 23.7 | |
| 55–64 | 78.8 | 73.4 | 83.2 | 80.5 | 92.6 | 84.0 | 71.4 | 62.3 | 71.0 | 64.4 | 67.2 | 64.3 | |
| 65–74 | 88.6 | 88.9 | 92.6 | 96.7 | 101.8 | 93.2 | 82.2 | 90.1 | 83.7 | 78.3 | 68.1 | 72.2 | |
| 75–84 | 71.7 | 65.6 | 69.5 | 72.6 | 79.1 | 75.6 | 71.7 | 63.9 | 72.7 | 67.0 | 67.8 | 58.4 | |
| 85+ | 57.1 | 57.4 | 49.1 | 41.0 | 49.3 | 55.8 | 70.7 | 61.8 | 66.9 | 80.0 | 29.0 | 46.6 | |
| Total | 20.7 | 20.1 | 21.2 | 21.2 | 24.3 | 21.7 | 19.2 | 18.2 | 19.0 | 18.4 | 18.6 | 16.9 | |
| 2013–17 | <45 | 2.4 | 2.3 | 1.7 | 1.9 | 3.2 | 2.4 | 1.8 | 1.4 | 2.2 | 2.3 | 3.3 | 1.9 |
| 45–54 | 30.5 | 32.8 | 32.6 | 30.1 | 38.1 | 31.6 | 27.0 | 18.8 | 27.7 | 25.7 | 36.8 | 24.9 | |
| 55–64 | 78.7 | 74.4 | 79.6 | 75.3 | 90.1 | 85.1 | 71.4 | 73.4 | 57.8 | 64.5 | 63.3 | 64.1 | |
| 65–74 | 95.3 | 95.6 | 96.2 | 105.2 | 104.1 | 100.8 | 88.1 | 86.4 | 92.3 | 82.4 | 71.0 | 77.7 | |
| 75–84 | 75.4 | 70.7 | 70.6 | 86.7 | 87.3 | 80.1 | 75.6 | 70.6 | 73.5 | 67.6 | 67.1 | 61.5 | |
| 85+ | 50.8 | 51.5 | 48.8 | 41.2 | 39.5 | 50.4 | 61.3 | 54.1 | 60.9 | 64.0 | 30.9 | 41.4 | |
| Total | 21.4 | 21.1 | 21.1 | 21.8 | 24.7 | 22.7 | 19.7 | 18.3 | 19.1 | 18.6 | 19.2 | 17.5 | |
| 2018–22 | <45 | 2.5 | 2.4 | 1.7 | 1.9 | 3.1 | 2.5 | 1.9 | 1.4 | 2.2 | 2.3 | 3.3 | 2.1 |
| 45–54 | 32.5 | 37.2 | 30.6 | 30.5 | 41.8 | 33.8 | 28.6 | 18.9 | 27.8 | 25.7 | 37.5 | 26.5 | |
| 55–64 | 79.5 | 74.3 | 84.5 | 74.5 | 89.6 | 86.8 | 70.7 | 66.0 | 59.3 | 64.5 | 64.2 | 64.8 | |
| 65–74 | 96.9 | 96.3 | 92.1 | 103.2 | 105.8 | 103.7 | 89.4 | 89.9 | 87.0 | 82.5 | 74.7 | 79.0 | |
| 75–84 | 79.5 | 75.1 | 74.9 | 90.5 | 88.9 | 84.3 | 79.0 | 77.4 | 78.2 | 76.1 | 71.9 | 64.8 | |
| 85+ | 51.1 | 52.9 | 44.4 | 46.2 | 44.0 | 52.3 | 59.1 | 47.9 | 66.4 | 59.0 | 31.2 | 41.6 | |
| Total | 22.1 | 21.9 | 21.2 | 21.8 | 25.2 | 23.5 | 20.0 | 18.1 | 19.1 | 18.8 | 19.8 | 18.0 | |
| 2023–27 | <45 | 2.5 | 2.5 | 1.7 | 2.0 | 3.1 | 2.5 | 1.9 | 1.4 | 2.2 | 2.3 | 3.3 | 2.0 |
| 45–54 | 33.5 | 34.6 | 25.4 | 30.7 | 41.7 | 34.4 | 28.3 | 18.9 | 27.8 | 25.7 | 37.9 | 27.3 | |
| 55–64 | 82.4 | 81.2 | 90.9 | 72.2 | 97.0 | 90.2 | 70.4 | 51.9 | 70.3 | 64.5 | 73.8 | 67.2 | |
| 65–74 | 96.2 | 95.0 | 90.8 | 97.8 | 103.8 | 104.6 | 88.9 | 104.6 | 70.7 | 82.5 | 67.6 | 78.4 | |
| 75–84 | 85.0 | 78.2 | 78.6 | 99.0 | 92.5 | 90.7 | 84.0 | 73.2 | 86.1 | 79.4 | 72.7 | 69.2 | |
| 85+ | 54.5 | 56.0 | 48.5 | 57.3 | 49.8 | 55.6 | 64.4 | 60.0 | 64.2 | 62.0 | 29.7 | 44.4 | |
| Total | 22.6 | 22.3 | 21.2 | 21.7 | 25.9 | 24.2 | 20.1 | 17.8 | 19.2 | 19.0 | 20.3 | 18.4 | |
| 2028–32 | <45 | 2.5 | 2.6 | 1.7 | 2.0 | 3.1 | 2.6 | 1.9 | 1.4 | 2.2 | 2.3 | 3.4 | 2.0 |
| 45–54 | 35.2 | 35.3 | 25.2 | 31.0 | 41.5 | 35.8 | 28.6 | 18.9 | 27.8 | 25.7 | 38.2 | 28.7 | |
| 55–64 | 85.7 | 86.7 | 85.2 | 72.6 | 104.0 | 94.2 | 72.7 | 51.9 | 70.4 | 64.5 | 74.5 | 69.9 | |
| 65–74 | 96.4 | 92.7 | 97.1 | 95.3 | 103.9 | 105.6 | 86.5 | 91.0 | 77.6 | 82.5 | 70.3 | 78.6 | |
| 75–84 | 85.0 | 76.8 | 74.6 | 94.1 | 93.6 | 91.9 | 83.8 | 77.7 | 79.9 | 79.4 | 76.8 | 69.3 | |
| 85+ | 56.9 | 58.3 | 51.5 | 55.1 | 48.7 | 57.9 | 65.2 | 61.8 | 72.1 | 71.9 | 33.9 | 46.4 | |
| Total | 23.1 | 22.7 | 21.0 | 21.4 | 26.5 | 24.8 | 20.2 | 17.1 | 19.5 | 19.1 | 20.7 | 18.8 | |
Abbreviations: AB, Alberta; BC, British Columbia; CA, Canada; MB, Manitoba; NB, New Brunswick; NL, Newfoundland and Labrador; NS, Nova Scotia; ON, Ontario; PE, Prince Edward Island; QC, Quebec; SK, Saskatchewan; TC, All Territories (Yukon, Northwest Territories and Nunavut).
Overall rates of uterine cancer decreased marginally in the 1980s and have gradually risen slightly (Figure 4.12.1). During 1998–2007, the ASIRs increased significantly by 0.7% per year (Figure 3.2). Uterus cancer incidence in females younger than 45 has stabilized (Figure 4.12.2). The rates in women aged 45 to 64 have risen steadily since 1988–1992, being less evident in the 45–54 age range. Incidence in women aged 65 to 74 fell substantially until 1998–2002 and then increased slightly. The rates in women aged 75 or older have decreased since 1998–2002, with relatively pronounced decreases in women aged 75 to 84. Figure 4.12.1 indicates that Quebec used to have the highest rates of uterus cancer, but the rates have decreased substantially and approached the lowest level of the regions in 2003–2007. The rates in other regions have been relatively stable through the observation periods.
FIGURE 4.12.1. Age-standardized incidence rates (ASIRs) by region, cancer of body of uterus, 1983–2032.

FIGURE 4.12.2. Age-standardized incidence rates (ASIRs) for cancer of body of uterus by age group, Canada, 1983–2032.

Figure 4.12.2 shows that the increase in the overall rates of uterine cancer will be less evident in younger females (<55) and substantial in women aged between 55 and 74. Incidence in women aged 75 to 84 will fall slightly in the first period and then increase markedly. The rates in the oldest women will decrease in the first 2 periods and then increase gradually. Figure 4.12.1 shows that the rates are predicted to increase slightly in each region and that geographical variation in rates is not considerable.
From 2003–2007 to 2028–2032, the ASIRs for uterine cancer in Canadian females are projected to increase by 16%, from 19.9 to 23.1 per 100 000 (Table 4.12.2). The annual number of new cases is projected to increase by 88%, from 4105 to 7700 (Table 4.12.1).
Comments
Excessive exposure to estrogen unopposed by progesterone is the most widely accepted hypothesis on the etiology of uterine cancer. Such exposure to estrogen can explain the related risk factors: early menarche, late menopause, nulliparity, hormone replacement therapy and obesity.86 Combined oestrogen–progestagen oral contraceptives appear to have a protective effect.174
Convincing epidemiological evidence links excess body mass and lack of sufficient physical activity to increased risk of uterine cancer. Excess weight accounts for approximately 50% of uterine cancer cases in Europe and the US,70,175 and obesity accounts for 40% of uterine cancer incidence worldwide.86 A meta-analysis of 18 studies published between 1989 and 2011 suggests that overweight and obese females have 32% and 154% higher risk of uterine cancer, respectively.176 Postmenopausal obese women have higher levels of estradiol than postmenopausal normal-weight women.175 In Canada, the prevalence rates of obesity have nearly doubled in adults from 1978/79 to 2012.51,72,73 In addition, there is considerable evidence that a lack of sufficient physical activity, independent of BMI, is associated with an increased risk of uterine cancer.177,178
Changes in prevalence of overweight and obesity may partially account for the observed and predicted increase in uterine cancer incidence.179,180 Stable prevalence rate of oral contraceptive use181 could explain why incidence rates of uterine cancer have stabilized in females younger than 45.182
Maintaining a healthy weight and being physically active may represent opportunities for modifying the risk of uterine cancer in Canada.
13. Ovarian cancer
Ovarian cancer was the seventh most common cancer in Canadian females and the second most frequently diagnosed gynecological malignancy in 2003–2007. One in 68 females can expect to be diagnosed with ovarian cancer in their lifetime, and 1 in 95 females are estimated to die from it.1 The average annual number of new ovarian cancer cases in this period was 2385, equivalent to 3.2% of all cancer cases in females (Table 4.13.1). In 2003–2007, incidence of ovarian cancer increased sharply with advancing age to a plateau in those aged 75 or older (Table 4.13.2). About 70% of the new cases were diagnosed in women aged 55 or older (Table 4.13.1). Ovarian cancer is the most lethal gynecological cancer. The 5-year relative survival rate was 45% in 2006–2008.1
TABLE 4.13.1.
Observed (2003–2007) and projected average annual new cases by age and province/territories combined (TC), ovarian cancer, Canada, 2003–2032
| Period | Age | New cases | |||||||||||
|---|---|---|---|---|---|---|---|---|---|---|---|---|---|
| CA | BC | AB | SK | MB | ON | QC | NB | NS | PE | NL | TC | ||
| 2003–07 | <45 | 290 | 30 | 20 | 5 | 10 | 150 | 55 | 5 | 5 | 0 | 5 | 0 |
| 45–54 | 445 | 50 | 40 | 10 | 20 | 185 | 110 | 10 | 10 | 5 | 5 | 0 | |
| 55–64 | 525 | 60 | 35 | 15 | 20 | 210 | 145 | 15 | 15 | 0 | 10 | 0 | |
| 65–74 | 490 | 60 | 35 | 15 | 20 | 200 | 125 | 10 | 15 | 0 | 5 | 0 | |
| 75–84 | 450 | 55 | 30 | 20 | 20 | 165 | 130 | 15 | 15 | 0 | 0 | 0 | |
| 85+ | 185 | 25 | 15 | 5 | 10 | 65 | 55 | 5 | 5 | 0 | 0 | 0 | |
| Total | 2385 | 285 | 175 | 75 | 90 | 980 | 615 | 65 | 65 | 10 | 25 | 0 | |
| 2008–12 | <45 | 260 | 30 | 20 | 5 | 10 | 150 | 45 | 5 | 5 | 0 | 5 | 0 |
| 45–54 | 475 | 60 | 40 | 10 | 20 | 220 | 110 | 15 | 15 | 0 | 5 | 0 | |
| 55–64 | 615 | 65 | 50 | 20 | 20 | 250 | 155 | 15 | 15 | 0 | 10 | 0 | |
| 65–74 | 540 | 65 | 40 | 15 | 20 | 220 | 140 | 15 | 15 | 0 | 5 | 0 | |
| 75–84 | 460 | 50 | 30 | 15 | 20 | 180 | 130 | 15 | 15 | 0 | 5 | 0 | |
| 85+ | 235 | 35 | 20 | 10 | 10 | 80 | 65 | 5 | 5 | 0 | 0 | 0 | |
| Total | 2590 | 300 | 195 | 75 | 95 | 1095 | 645 | 70 | 70 | 10 | 25 | 5 | |
| 2013–17 | <45 | 275 | 30 | 20 | 5 | 10 | 160 | 45 | 5 | 5 | 0 | 5 | 0 |
| 45–54 | 455 | 60 | 35 | 10 | 15 | 240 | 90 | 10 | 15 | 0 | 5 | 0 | |
| 55–64 | 690 | 70 | 60 | 20 | 25 | 285 | 155 | 20 | 20 | 0 | 10 | 0 | |
| 65–74 | 665 | 75 | 50 | 15 | 20 | 260 | 170 | 20 | 20 | 0 | 10 | 0 | |
| 75–84 | 475 | 50 | 35 | 15 | 20 | 180 | 130 | 15 | 15 | 0 | 5 | 0 | |
| 85+ | 275 | 30 | 25 | 10 | 10 | 95 | 80 | 5 | 10 | 0 | 0 | 0 | |
| Total | 2830 | 320 | 220 | 75 | 100 | 1220 | 675 | 80 | 80 | 10 | 30 | 5 | |
| 2018–22 | <45 | 305 | 35 | 20 | 5 | 10 | 180 | 45 | 5 | 5 | 0 | 5 | 0 |
| 45–54 | 410 | 55 | 30 | 10 | 15 | 240 | 70 | 10 | 10 | 0 | 5 | 0 | |
| 55–64 | 745 | 80 | 60 | 20 | 25 | 330 | 155 | 20 | 20 | 5 | 10 | 0 | |
| 65–74 | 780 | 85 | 65 | 20 | 25 | 305 | 185 | 20 | 25 | 5 | 10 | 0 | |
| 75–84 | 545 | 60 | 40 | 15 | 15 | 195 | 150 | 20 | 15 | 0 | 5 | 0 | |
| 85+ | 290 | 35 | 25 | 10 | 15 | 100 | 85 | 10 | 10 | 0 | 0 | 0 | |
| Total | 3080 | 345 | 245 | 80 | 105 | 1355 | 695 | 85 | 85 | 10 | 30 | 5 | |
| 2023–27 | <45 | 330 | 40 | 25 | 10 | 10 | 190 | 40 | 5 | 5 | 0 | 5 | 0 |
| 45–54 | 430 | 60 | 30 | 10 | 15 | 255 | 70 | 10 | 10 | 0 | 5 | 0 | |
| 55–64 | 715 | 80 | 55 | 15 | 25 | 355 | 135 | 20 | 20 | 0 | 10 | 0 | |
| 65–74 | 885 | 90 | 80 | 25 | 30 | 355 | 190 | 30 | 30 | 5 | 10 | 0 | |
| 75–84 | 680 | 70 | 55 | 15 | 20 | 240 | 190 | 25 | 20 | 5 | 5 | 0 | |
| 85+ | 320 | 35 | 30 | 10 | 10 | 105 | 90 | 10 | 10 | 0 | 0 | 0 | |
| Total | 3360 | 380 | 270 | 85 | 110 | 1500 | 715 | 95 | 95 | 10 | 30 | 5 | |
| 2028–32 | <45 | 345 | 40 | 25 | 5 | 10 | 200 | 35 | 5 | 5 | 0 | 5 | 0 |
| 45–54 | 495 | 70 | 30 | 10 | 15 | 295 | 80 | 10 | 10 | 0 | 5 | 0 | |
| 55–64 | 655 | 75 | 55 | 15 | 20 | 360 | 105 | 15 | 20 | 0 | 10 | 0 | |
| 65–74 | 965 | 105 | 85 | 25 | 30 | 405 | 190 | 30 | 35 | 5 | 10 | 0 | |
| 75–84 | 810 | 80 | 70 | 20 | 25 | 285 | 205 | 30 | 25 | 5 | 5 | 0 | |
| 85+ | 380 | 40 | 35 | 10 | 10 | 120 | 110 | 10 | 10 | 0 | 0 | 0 | |
| Total | 3650 | 415 | 300 | 90 | 115 | 1665 | 730 | 100 | 105 | 10 | 30 | 5 | |
Abbreviations: AB, Alberta; BC, British Columbia; CA, Canada; MB, Manitoba; NB, New Brunswick; NL, Newfoundland and Labrador; NS, Nova Scotia; ON, Ontario; PE, Prince Edward Island; QC, Quebec; SK, Saskatchewan; TC, All Territories (Yukon, Northwest Territories and Nunavut).
Note: Totals may not add up due to rounding.
TABLE 4.13.2.
Observed (2003–2007) and projected age-standardized incidence rates (ASIRs) by age and province/territories combined (TC), ovarian cancer, Canada, 2003–2032
| Period | Age | ASIRs | |||||||||||
|---|---|---|---|---|---|---|---|---|---|---|---|---|---|
| CA | BC | AB | SK | MB | ON | QC | NB | NS | PE | NL | TC | ||
| 2003–07 | <45 | 2.8 | 2.4 | 1.9 | 2.3 | 2.7 | 3.7 | 2.3 | 2.1 | 1.3 | 0.0 | 1.6 | 2.8 |
| 45–54 | 17.8 | 15.0 | 16.4 | 16.4 | 20.5 | 19.6 | 17.5 | 20.0 | 14.6 | 27.9 | 9.9 | 8.5 | |
| 55–64 | 29.5 | 25.3 | 24.4 | 28.3 | 29.9 | 31.9 | 31.3 | 31.4 | 25.8 | 9.1 | 23.3 | 16.0 | |
| 65–74 | 41.2 | 39.5 | 36.0 | 41.9 | 45.6 | 43.4 | 40.9 | 40.5 | 37.7 | 44.0 | 30.9 | 13.2 | |
| 75–84 | 51.8 | 47.5 | 44.7 | 57.1 | 53.2 | 49.5 | 59.2 | 71.8 | 51.9 | 52.8 | 14.9 | 0.0 | |
| 85+ | 53.2 | 49.5 | 50.3 | 43.4 | 51.1 | 52.9 | 66.7 | 35.6 | 44.7 | 10.7 | 7.8 | 0.0 | |
| Total | 11.6 | 10.3 | 9.7 | 11.1 | 12.2 | 12.7 | 11.7 | 12.0 | 9.6 | 8.8 | 6.9 | 5.1 | |
| 2008–12 | <45 | 2.6 | 2.2 | 1.8 | 2.4 | 2.7 | 3.8 | 2.1 | 2.3 | 1.8 | 2.0 | 2.2 | 1.6 |
| 45–54 | 17.5 | 15.8 | 13.3 | 14.8 | 19.9 | 20.7 | 16.6 | 20.0 | 15.9 | 13.2 | 9.8 | 8.1 | |
| 55–64 | 28.7 | 22.0 | 24.9 | 30.1 | 30.1 | 31.0 | 29.0 | 29.8 | 25.2 | 21.7 | 22.0 | 15.0 | |
| 65–74 | 40.1 | 34.6 | 35.7 | 34.6 | 40.7 | 42.2 | 40.2 | 47.0 | 36.0 | 30.3 | 28.0 | 23.7 | |
| 75–84 | 50.5 | 42.6 | 42.6 | 50.1 | 55.5 | 50.2 | 56.6 | 65.7 | 47.6 | 38.2 | 19.6 | 35.6 | |
| 85+ | 54.0 | 54.5 | 51.8 | 58.0 | 55.9 | 49.1 | 62.8 | 53.8 | 47.8 | 40.8 | 2.2 | 48.7 | |
| Total | 11.3 | 9.6 | 9.3 | 10.6 | 11.9 | 12.7 | 11.2 | 12.4 | 9.8 | 8.5 | 7.1 | 6.7 | |
| 2013–17 | <45 | 2.7 | 2.3 | 1.7 | 2.5 | 2.7 | 3.9 | 1.9 | 2.3 | 1.8 | 2.0 | 2.2 | 1.4 |
| 45–54 | 17.0 | 15.5 | 11.8 | 14.0 | 17.7 | 22.4 | 15.1 | 17.5 | 16.6 | 12.8 | 10.4 | 6.9 | |
| 55–64 | 28.2 | 20.7 | 25.1 | 27.6 | 31.1 | 30.8 | 26.7 | 34.1 | 26.3 | 21.3 | 21.1 | 12.8 | |
| 65–74 | 39.4 | 32.2 | 35.0 | 35.8 | 37.3 | 41.1 | 39.8 | 41.8 | 36.9 | 29.8 | 25.6 | 20.2 | |
| 75–84 | 49.2 | 40.1 | 42.1 | 46.3 | 54.6 | 47.6 | 54.4 | 75.3 | 43.2 | 37.1 | 26.2 | 30.5 | |
| 85+ | 53.5 | 45.1 | 54.0 | 54.7 | 53.3 | 48.3 | 63.4 | 59.1 | 58.1 | 40.4 | 2.2 | 41.8 | |
| Total | 11.1 | 9.2 | 9.0 | 10.3 | 11.5 | 12.8 | 10.6 | 12.6 | 9.9 | 8.4 | 7.2 | 5.7 | |
| 2018–22 | <45 | 2.9 | 2.4 | 1.6 | 2.5 | 2.7 | 4.2 | 2.0 | 2.3 | 1.8 | 2.2 | 2.2 | 1.2 |
| 45–54 | 16.3 | 15.2 | 11.5 | 14.8 | 16.8 | 23.7 | 12.6 | 17.4 | 16.4 | 12.3 | 10.3 | 5.9 | |
| 55–64 | 28.2 | 22.1 | 23.0 | 25.9 | 30.2 | 31.7 | 25.6 | 35.4 | 28.3 | 21.3 | 20.2 | 11.0 | |
| 65–74 | 38.3 | 28.4 | 35.4 | 36.9 | 38.0 | 39.6 | 37.1 | 42.0 | 38.1 | 28.9 | 27.0 | 17.2 | |
| 75–84 | 48.3 | 38.4 | 43.3 | 42.6 | 45.6 | 45.4 | 53.4 | 72.4 | 44.2 | 36.5 | 23.3 | 26.0 | |
| 85+ | 51.8 | 43.4 | 49.8 | 51.6 | 60.1 | 46.5 | 60.4 | 59.2 | 48.7 | 39.1 | 2.7 | 35.7 | |
| Total | 11.0 | 9.0 | 8.8 | 10.1 | 11.1 | 13.0 | 10.0 | 12.6 | 10.1 | 8.3 | 7.1 | 4.8 | |
| 2023–27 | <45 | 3.0 | 2.4 | 1.8 | 2.5 | 2.7 | 4.2 | 1.7 | 2.3 | 1.8 | 2.2 | 2.2 | 1.0 |
| 45–54 | 17.0 | 16.8 | 9.9 | 16.0 | 16.8 | 25.2 | 12.6 | 17.4 | 16.3 | 12.8 | 10.2 | 5.0 | |
| 55–64 | 27.5 | 21.6 | 20.9 | 24.8 | 27.1 | 34.0 | 23.6 | 31.8 | 29.9 | 20.8 | 21.9 | 9.4 | |
| 65–74 | 38.0 | 27.3 | 36.0 | 34.2 | 39.3 | 39.6 | 34.6 | 47.8 | 40.2 | 28.7 | 25.6 | 14.7 | |
| 75–84 | 47.7 | 35.9 | 43.0 | 45.0 | 41.7 | 44.2 | 53.1 | 66.7 | 45.7 | 36.1 | 23.4 | 22.1 | |
| 85+ | 50.9 | 40.6 | 52.7 | 47.4 | 53.1 | 43.6 | 58.5 | 74.3 | 47.8 | 38.4 | 4.5 | 30.5 | |
| Total | 11.1 | 8.9 | 8.7 | 10.0 | 10.7 | 13.3 | 9.4 | 12.6 | 10.4 | 8.4 | 7.1 | 4.1 | |
| 2028–32 | <45 | 3.0 | 2.4 | 1.8 | 2.5 | 2.7 | 4.2 | 1.6 | 2.3 | 1.8 | 2.3 | 2.2 | 0.8 |
| 45–54 | 18.3 | 17.7 | 10.1 | 16.0 | 16.9 | 27.1 | 13.5 | 17.3 | 16.1 | 13.9 | 10.1 | 4.3 | |
| 55–64 | 26.7 | 21.5 | 20.5 | 26.4 | 25.8 | 35.9 | 20.0 | 31.7 | 29.7 | 20.2 | 21.7 | 8.0 | |
| 65–74 | 38.0 | 29.1 | 33.0 | 32.2 | 37.6 | 40.6 | 33.3 | 49.4 | 43.4 | 28.7 | 25.6 | 12.6 | |
| 75–84 | 46.5 | 31.8 | 44.0 | 45.6 | 42.4 | 42.6 | 49.3 | 67.0 | 47.6 | 35.1 | 24.6 | 18.8 | |
| 85+ | 50.2 | 39.8 | 53.6 | 43.8 | 42.2 | 42.0 | 58.1 | 59.7 | 50.6 | 37.9 | 3.2 | 25.9 | |
| Total | 11.1 | 9.0 | 8.5 | 10.0 | 10.4 | 13.6 | 8.9 | 12.6 | 10.7 | 8.4 | 7.1 | 3.5 | |
Abbreviations: AB, Alberta; BC, British Columbia; CA, Canada; MB, Manitoba; NB, New Brunswick; NL, Newfoundland and Labrador; NS, Nova Scotia; ON, Ontario; PE, Prince Edward Island; QC, Quebec; SK, Saskatchewan; TC, All Territories (Yukon, Northwest Territories and Nunavut).
Incidence rates of ovarian cancer in Canada have decreased very slightly since 1983–1987 (Figure 4.13.1). During 1998–2007 ASIRs for ovarian cancer were relative stable, declining non-significantly by 0.2% per year (Figure 3.2). The trends in age-specific ASIRs shown in Figure 4.13.2 illustrate relatively stable rates over time. Regional comparison of incidence does not reveal any geographical patterns before 1998–2002 but does show that rates diverge during 2003–2007 (Figure 4.13.1). Elevated incidence rates of ovary cancer were seen in Ontario, whereas the lowest rates appeared in the Atlantic region.
FIGURE 4.13.1. Age-standardized incidence rates (ASIRs) by region, ovarian cancer, 1983–2032.

FIGURE 4.13.2. Age-standardized incidence rates (ASIRs) for ovarian cancer by age group, Canada, 1983–2032.

The overall Canadian incidence rates of ovarian cancer are projected to stabilize in the next 25 years (Figure 4.13.1). While Quebec will experience a substantial fall in rates, the rates in other regions will be stable or decrease marginally. The age-specific incidence rates show that the predicted reduction of ASIRs in each age group is less pronounced (Figure 4.13.2).
From 2003–2007 to 2028–2032, the ASIRs for ovarian cancer for Canada are expected to decrease by 4%, from 11.6 to 11.1 per 100 000 (Table 4.13.2), but the annual number of cases is projected to increase by 53%, from 2385 to 3650 (Table 4.13.1) as the Canadian population grows and ages.
Comments
The etiology of ovarian cancer is poorly understood;183 however, numerous risk factors are associated with either an increased or decreased likelihood of developing the disease. The known risk factors for the disease include reproductive and genetic components.184,185 Uninterrupted and prolonged ovulary cycles increase ovarian cancer risk.186,187 Long-term (≥5 years) use of hormone replacement therapy increases the risk.187–189 Oral contraceptive use and increases in the number of full-term pregnancies may have protective effects.52,86,190 Fertility rate in Canada has recently stabilized after a long-term decrease.149 The stable prevalence in both oral contraceptive use181 and fertility may partly explain the recent relatively stability of ovarian cancer incidence rate in females younger than 55.
A family history of ovarian cancer confers a 3- to 5-fold increased risk of the disease in most studies,191–193 with 5% to 10% of ovarian cancers due to heritable risk.187,191,192 The known susceptibility genes (e.g. BRCA1 and BRCA2) explain less than 40% of the excess risk of hereditary ovarian cancer.191
Potential links between ovarian cancer and lifestyle exist. IARC stated in 2009 that there is sufficient evidence that smoking causes ovarian cancer.194 Overweight and obesity are moderately associated with ovarian cancer risk.86 Vegetables and fruit appear to be inversely related to the risk.86
14. Prostate cancer
Prostate cancer is the most common form of cancer and the third leading cause of cancer death in Canadian males. One in 7 can expect to be diagnosed with prostate cancer in their lifetime, and 1 in 28 males to die from it.1 The annual number of new cases was 21 460 in 2003–2007, constituting 13.8% of all new Canadian cases of cancer and 26.6% of those in males (Table 4.14.1, Figure 3.9). During 2001–2007, the ASIRs for prostate cancer were stable (Figure 3.1). The risk of developing the disease increases with age more than for any other cancer (Table 4.14.2). Between 2003 and 2007, 66% of the overall cases were in men aged 55 to 74, while only 8% were in males younger than 55. A high 5-year relative survival rate of 96% was reported for 2006–2008.1
TABLE 4.14.1.
Observed (2003–2007) and projected average annual new cases by age and province/territories combined (TC), prostate cancer, Canada, 2003–2032
| Period | Age | New cases | |||||||||||
|---|---|---|---|---|---|---|---|---|---|---|---|---|---|
| CA | BC | AB | SK | MB | ON | QC | NB | NS | PE | NL | TC | ||
| 2003–07 | <45 | 75 | 5 | 10 | 5 | 0 | 35 | 10 | 0 | 5 | 0 | 0 | 0 |
| 45–54 | 1570 | 170 | 190 | 50 | 45 | 670 | 295 | 45 | 65 | 10 | 30 | 5 | |
| 55–64 | 6170 | 745 | 620 | 200 | 165 | 2560 | 1305 | 190 | 230 | 40 | 105 | 10 | |
| 65–74 | 7935 | 1060 | 740 | 325 | 245 | 3385 | 1435 | 250 | 300 | 55 | 135 | 10 | |
| 75–84 | 4515 | 700 | 395 | 215 | 160 | 1835 | 840 | 130 | 160 | 25 | 55 | 5 | |
| 85+ | 1195 | 175 | 105 | 60 | 50 | 390 | 340 | 25 | 35 | 5 | 10 | 0 | |
| Total | 21 460 | 2860 | 2055 | 850 | 665 | 8875 | 4225 | 645 | 790 | 135 | 335 | 25 | |
| 2008–12 | <45 | 100 | 5 | 10 | 0 | 0 | 35 | 10 | 0 | 0 | 0 | 0 | 0 |
| 45–54 | 2160 | 170 | 245 | 65 | 50 | 1025 | 405 | 55 | 85 | 15 | 30 | 5 | |
| 55–64 | 8275 | 875 | 755 | 295 | 195 | 3650 | 1680 | 285 | 340 | 60 | 160 | 15 | |
| 65–74 | 9130 | 1200 | 660 | 345 | 230 | 4070 | 1695 | 325 | 370 | 65 | 165 | 10 | |
| 75–84 | 4460 | 710 | 330 | 175 | 115 | 1900 | 850 | 130 | 160 | 25 | 55 | 5 | |
| 85+ | 1370 | 205 | 105 | 45 | 40 | 475 | 430 | 25 | 35 | 5 | 10 | 0 | |
| Total | 25 495 | 3170 | 2100 | 930 | 630 | 11 155 | 5065 | 825 | 990 | 170 | 420 | 35 | |
| 2013–17 | <45 | 95 | 5 | 10 | 0 | 0 | 35 | 10 | 0 | 0 | 0 | 0 | 0 |
| 45–54 | 2205 | 175 | 245 | 65 | 50 | 1085 | 400 | 55 | 85 | 15 | 25 | 5 | |
| 55–64 | 9455 | 990 | 915 | 340 | 225 | 4225 | 1875 | 305 | 365 | 65 | 170 | 15 | |
| 65–74 | 11 510 | 1525 | 880 | 415 | 285 | 5130 | 2080 | 415 | 465 | 85 | 210 | 20 | |
| 75–84 | 4920 | 785 | 365 | 175 | 120 | 2085 | 950 | 155 | 185 | 25 | 65 | 10 | |
| 85+ | 1740 | 260 | 140 | 50 | 45 | 625 | 560 | 30 | 40 | 5 | 10 | 0 | |
| Total | 29 930 | 3740 | 2560 | 1050 | 730 | 13 180 | 5870 | 960 | 1140 | 200 | 480 | 45 | |
| 2018–22 | <45 | 100 | 5 | 10 | 5 | 0 | 35 | 10 | 0 | 0 | 0 | 0 | 0 |
| 45–54 | 2025 | 165 | 235 | 55 | 45 | 1005 | 350 | 50 | 70 | 10 | 25 | 5 | |
| 55–64 | 10 465 | 1085 | 1020 | 365 | 245 | 4830 | 2020 | 320 | 390 | 70 | 170 | 15 | |
| 65–74 | 13 830 | 1855 | 1135 | 515 | 350 | 6190 | 2410 | 490 | 540 | 100 | 245 | 25 | |
| 75–84 | 5975 | 950 | 450 | 200 | 140 | 2510 | 1155 | 195 | 225 | 35 | 85 | 10 | |
| 85+ | 2065 | 305 | 170 | 55 | 50 | 740 | 675 | 35 | 45 | 5 | 15 | 0 | |
| Total | 34 460 | 4375 | 3025 | 1190 | 830 | 15 310 | 6620 | 1085 | 1280 | 225 | 535 | 55 | |
| 2023–27 | <45 | 110 | 10 | 10 | 5 | 0 | 35 | 10 | 0 | 0 | 0 | 0 | 0 |
| 45–54 | 2000 | 165 | 245 | 55 | 45 | 980 | 350 | 45 | 70 | 10 | 20 | 5 | |
| 55–64 | 10 480 | 1120 | 1020 | 350 | 240 | 4980 | 1945 | 305 | 375 | 70 | 165 | 15 | |
| 65–74 | 15 960 | 2120 | 1380 | 595 | 405 | 7250 | 2720 | 530 | 600 | 110 | 255 | 30 | |
| 75–84 | 7735 | 1240 | 615 | 250 | 185 | 3250 | 1470 | 260 | 295 | 45 | 110 | 15 | |
| 85+ | 2400 | 355 | 200 | 60 | 55 | 855 | 800 | 40 | 55 | 10 | 15 | 0 | |
| Total | 38 690 | 5010 | 3465 | 1315 | 930 | 17 350 | 7290 | 1180 | 1395 | 245 | 570 | 65 | |
| 2028–32 | <45 | 115 | 10 | 10 | 5 | 0 | 40 | 10 | 0 | 0 | 0 | 0 | 0 |
| 45–54 | 2110 | 180 | 260 | 60 | 50 | 1025 | 375 | 45 | 65 | 10 | 20 | 5 | |
| 55–64 | 9810 | 1080 | 995 | 315 | 225 | 4690 | 1760 | 275 | 335 | 65 | 145 | 15 | |
| 65–74 | 17 645 | 2340 | 1530 | 635 | 435 | 8285 | 2910 | 550 | 640 | 120 | 265 | 30 | |
| 75–84 | 9475 | 1520 | 810 | 315 | 225 | 3970 | 1760 | 305 | 350 | 50 | 135 | 25 | |
| 85+ | 3065 | 450 | 260 | 70 | 70 | 1075 | 1040 | 55 | 70 | 10 | 20 | 5 | |
| Total | 42 225 | 5580 | 3865 | 1400 | 1010 | 19 085 | 7855 | 1230 | 1465 | 260 | 585 | 75 | |
Abbreviations: AB, Alberta; BC, British Columbia; CA, Canada; MB, Manitoba; NB, New Brunswick; NL, Newfoundland and Labrador; NS, Nova Scotia; ON, Ontario; PE, Prince Edward Island; QC, Quebec; SK, Saskatchewan; TC, All Territories (Yukon, Northwest Territories and Nunavut).
Note: Totals may not add up due to rounding.
TABLE 4.14.2.
Observed (2003–2007) and projected age-standardized incidence rates (ASIRs) by age and province/territories combined (TC), prostate cancer, Canada, 2003–2032
| Period | Age | ASIRs | |||||||||||
|---|---|---|---|---|---|---|---|---|---|---|---|---|---|
| CA | BC | AB | SK | MB | ON | QC | NB | NS | PE | NL | TC | ||
| 2003–07 | <45 | 0.6 | 0.5 | 0.7 | 0.9 | 0.3 | 0.8 | 0.4 | 0.3 | 0.8 | 2.0 | 0.8 | 0.6 |
| 45–54 | 62.2 | 50.1 | 73.3 | 67.8 | 51.0 | 70.9 | 47.6 | 76.3 | 82.8 | 108.5 | 63.1 | 34.9 | |
| 55–64 | 365.2 | 321.5 | 412.1 | 419.6 | 287.8 | 408.1 | 301.5 | 436.3 | 420.0 | 525.9 | 331.7 | 225.9 | |
| 65–74 | 741.6 | 700.8 | 818.2 | 947.9 | 655.0 | 834.9 | 541.2 | 945.8 | 875.5 | 1041.4 | 719.0 | 529.2 | |
| 75–84 | 728.5 | 780.1 | 773.4 | 919.9 | 667.0 | 764.1 | 580.0 | 872.2 | 858.3 | 902.1 | 581.0 | 753.3 | |
| 85+ | 781.8 | 728.6 | 797.7 | 787.9 | 681.6 | 693.4 | 1067.4 | 592.6 | 667.3 | 717.3 | 402.0 | 725.7 | |
| Total | 123.3 | 116.6 | 135.6 | 149.7 | 106.0 | 134.7 | 100.0 | 147.8 | 142.9 | 169.1 | 109.9 | 94.1 | |
| 2008–12 | <45 | 0.9 | 0.5 | 0.7 | 0.9 | 0.3 | 0.8 | 0.4 | 0.3 | 0.8 | 2.0 | 0.8 | 0.6 |
| 45–54 | 76.6 | 45.8 | 79.6 | 80.1 | 51.6 | 94.6 | 60.1 | 87.8 | 104.7 | 108.5 | 63.1 | 34.9 | |
| 55–64 | 402.7 | 305.7 | 376.1 | 496.1 | 276.7 | 478.7 | 332.0 | 542.5 | 522.0 | 638.1 | 423.4 | 225.9 | |
| 65–74 | 734.0 | 680.4 | 625.8 | 947.5 | 545.7 | 876.2 | 533.2 | 1009.2 | 918.4 | 1110.4 | 723.2 | 529.2 | |
| 75–84 | 643.7 | 700.9 | 561.0 | 763.6 | 465.6 | 714.5 | 503.5 | 826.0 | 785.7 | 746.6 | 542.9 | 753.3 | |
| 85+ | 652.1 | 628.4 | 607.3 | 547.1 | 469.8 | 588.3 | 933.3 | 466.5 | 554.1 | 582.5 | 344.1 | 725.7 | |
| Total | 123.3 | 109.5 | 110.5 | 149.6 | 88.3 | 143.3 | 99.3 | 159.6 | 153.3 | 176.5 | 116.1 | 94.1 | |
| 2013–17 | <45 | 0.9 | 0.5 | 0.7 | 0.9 | 0.3 | 0.8 | 0.4 | 0.3 | 0.8 | 2.0 | 0.8 | 0.6 |
| 45–54 | 76.6 | 45.8 | 79.6 | 80.1 | 51.6 | 94.6 | 60.1 | 87.8 | 104.7 | 108.5 | 63.1 | 34.9 | |
| 55–64 | 402.7 | 305.7 | 376.1 | 496.1 | 276.7 | 478.7 | 332.0 | 542.5 | 522.0 | 638.1 | 423.4 | 225.9 | |
| 65–74 | 734.0 | 680.4 | 625.8 | 947.5 | 545.7 | 876.2 | 533.2 | 1009.2 | 918.4 | 1110.4 | 723.2 | 529.2 | |
| 75–84 | 643.7 | 700.9 | 561.0 | 763.6 | 465.6 | 714.5 | 503.5 | 826.0 | 785.7 | 746.6 | 542.9 | 753.3 | |
| 85+ | 652.1 | 628.4 | 607.3 | 547.1 | 469.8 | 588.3 | 933.3 | 466.5 | 554.1 | 582.5 | 344.1 | 725.7 | |
| Total | 123.3 | 109.5 | 110.5 | 149.6 | 88.3 | 143.3 | 99.3 | 159.6 | 153.3 | 176.5 | 116.1 | 94.1 | |
| 2018–22 | <45 | 0.9 | 0.5 | 0.7 | 0.9 | 0.3 | 0.8 | 0.4 | 0.3 | 0.8 | 2.0 | 0.8 | 0.6 |
| 45–54 | 76.6 | 45.8 | 79.6 | 80.1 | 51.6 | 94.6 | 60.1 | 87.8 | 104.7 | 108.5 | 63.1 | 34.9 | |
| 55–64 | 402.7 | 305.7 | 376.1 | 496.1 | 276.7 | 478.7 | 332.0 | 542.5 | 522.0 | 638.1 | 423.4 | 225.9 | |
| 65–74 | 734.0 | 680.4 | 625.8 | 947.5 | 545.7 | 876.2 | 533.2 | 1009.2 | 918.4 | 1110.4 | 723.2 | 529.2 | |
| 75–84 | 643.7 | 700.9 | 561.0 | 763.6 | 465.6 | 714.5 | 503.5 | 826.0 | 785.7 | 746.6 | 542.9 | 753.3 | |
| 85+ | 652.1 | 628.4 | 607.3 | 547.1 | 469.8 | 588.3 | 933.3 | 466.5 | 554.1 | 582.5 | 344.1 | 725.7 | |
| Total | 123.3 | 109.5 | 110.5 | 149.6 | 88.3 | 143.3 | 99.3 | 159.6 | 153.3 | 176.5 | 116.1 | 94.1 | |
| 2023–27 | <45 | 0.9 | 0.5 | 0.7 | 0.9 | 0.3 | 0.8 | 0.4 | 0.3 | 0.8 | 2.0 | 0.8 | 0.6 |
| 45–54 | 76.6 | 45.8 | 79.6 | 80.1 | 51.6 | 94.6 | 60.1 | 87.8 | 104.7 | 108.5 | 63.1 | 34.9 | |
| 55–64 | 402.7 | 305.7 | 376.1 | 496.1 | 276.7 | 478.7 | 332.0 | 542.5 | 522.0 | 638.1 | 423.4 | 225.9 | |
| 65–74 | 734.0 | 680.4 | 625.8 | 947.5 | 545.7 | 876.2 | 533.2 | 1009.2 | 918.4 | 1110.4 | 723.2 | 529.2 | |
| 75–84 | 643.7 | 700.9 | 561.0 | 763.6 | 465.6 | 714.5 | 503.5 | 826.0 | 785.7 | 746.6 | 542.9 | 753.3 | |
| 85+ | 652.1 | 628.4 | 607.3 | 547.1 | 469.8 | 588.3 | 933.3 | 466.5 | 554.1 | 582.5 | 344.1 | 725.7 | |
| Total | 123.3 | 109.5 | 110.5 | 149.6 | 88.3 | 143.3 | 99.3 | 159.6 | 153.3 | 176.5 | 116.1 | 94.1 | |
| 2028–32 | <45 | 0.9 | 0.5 | 0.7 | 0.9 | 0.3 | 0.8 | 0.4 | 0.3 | 0.8 | 2.0 | 0.8 | 0.6 |
| 45–54 | 76.6 | 45.8 | 79.6 | 80.1 | 51.6 | 94.6 | 60.1 | 87.8 | 104.7 | 108.5 | 63.1 | 34.9 | |
| 55–64 | 402.7 | 305.7 | 376.1 | 496.1 | 276.7 | 478.7 | 332.0 | 542.5 | 522.0 | 638.1 | 423.4 | 225.9 | |
| 65–74 | 734.0 | 680.4 | 625.8 | 947.5 | 545.7 | 876.2 | 533.2 | 1009.2 | 918.4 | 1110.4 | 723.2 | 529.2 | |
| 75–84 | 643.7 | 700.9 | 561.0 | 763.6 | 465.6 | 714.5 | 503.5 | 826.0 | 785.7 | 746.6 | 542.9 | 753.3 | |
| 85+ | 652.1 | 628.4 | 607.3 | 547.1 | 469.8 | 588.3 | 933.3 | 466.5 | 554.1 | 582.5 | 344.1 | 725.7 | |
| Total | 123.3 | 109.5 | 110.5 | 149.6 | 88.3 | 143.3 | 99.3 | 159.6 | 153.3 | 176.5 | 116.1 | 94.1 | |
Abbreviations: AB, Alberta; BC, British Columbia; CA, Canada; MB, Manitoba; NB, New Brunswick; NL, Newfoundland and Labrador; NS, Nova Scotia; ON, Ontario; PE, Prince Edward Island; QC, Quebec; SK, Saskatchewan; TC, All Territories (Yukon, Northwest Territories and Nunavut).
Overall incidence rates of prostate cancer increased steadily until 1993–1997, showed additional but smaller increases to 1998–2002 and then levelled off (Figure 4.14.1). This pattern was observed in the Prairies, the Atlantic region and Ontario. The rates in British Columbia reached their first peak one period sooner than in other regions, then gradually levelled off and decreased thereafter. Quebec experienced much lower rates in the last 10 observation years than other regions. The trends of age-specific ASIRs show that recent incidence rates of prostate cancer in Canada increased in the younger age groups (<75 years) and decreased in the older age groups (75+) (Figure 4.14.2).
FIGURE 4.14.1. Age-standardized incidence rates (ASIRs) by region, prostate cancer, 1983–2032.

FIGURE 4.14.2. Age-standardized incidence rates (ASIRs) for prostate cancer by age group, Canada, 1983–2032.

The Nordpred method produces extreme increases in prostate cancer incidence rates and counts, so we used a two-step approach of the short-term modelling projection followed by the long-term constant-rates projection (method ADa + AVG, see Chapter 2 for the definition). Consequently, British Columbia and the Prairies are likely to have a drop in prostate cancer incidence rates, Ontario and the Atlantic region will experience an increase, and Quebec and Canada will remain stable in the first 5 prediction years (Figure 4.14.1). The rates for each region will remain unchanged thereafter.
From 2003–2007 to 2028–2032, the ASIRs for prostate cancer in Canada are expected to be stable at about 123.3 per 100 000 (Table 4.14.2). Despite this trend in ASIRs, the aging and growth of the population mean that the annual number of new cases is projected to increase by 97%, from 21 460 to 42 225 (Table 4.14.1).
Comments
The lower prostate cancer incidence rates observed in Quebec are likely artefactual, as a result of possible underreporting of cases (see details in Chapter 5: Data quality issues).
A range of medical investigations, including digital rectal examination, transrectal ultrasonography, PSA level, fine-needle aspiration biopsy (FNAB), and magnetic resonance imaging have been considered for the early detection of prostate cancer.195 Part of the rise in incidence in the 2 decades prior to 1990 has been attributed to detection of cancers following transurethral resection of the prostate for benign prostatic hypertrophy.196 The 1993 and 2001 peaks in incidence mirror the 2 waves of increased PSA screening activity.1 In 2003, the percentage of men reporting a screening PSA test in the past 12 months was highest in the 60–69 age group at just over 35%.197
When a slowly developing cancer is detected through screening, over-diagnosis may occur. This is concurrent with the fact that these cancers are most frequent at older ages when competing causes of death are more frequent.198 The observed increase in prostate cancer incidence rates may be biased by such over-diagnosis from PSA screening. The benefits and harms of prostate cancer screening by PSA test is still being debated,199 and it is important that men know the arguments in order to decide whether to screen for the disease.
Similar to England, recent incidence rates of prostate cancer in Canada increased in the younger age groups (<75 years) because of increasing uptake of the PSA test, and decreased in the older age groups (75+) from increasing pharmacological treatment for obstructive uropathy caused by benign prostatic hypertrophy and the resulting decrease in use of transurethral resection, which had previously led to detection of many prostate cancers (Figure 4.14.2).28,200 This pattern resulted in relatively stable crude rates in the last 2 observation periods. Therefore, the recent trends could be used for a model of short-term projections. However, such a model is less suitable for long-term projections because it would be expected that the prevalence of screening would plateau in the future. Figure 4.14.3 shows the projected ASIRs in the first 10 projection years derived from using the current 2-step approach (ADa + AVG), and using the age-specific trend model (ADa) only to project for all the 10 years. There appears to be no substantial advantage to a 10-year projection for using model ADa only. Similarity of the estimated national ASIRs between using ADa + AVG and ADa may be because the decreases in rates in older age groups were partly cancelled out by the increases in younger ages, and may also be a result of offsetting provincial differences. The projected increases in the 10-year incidence rates in the Atlantic region and Ontario, from using ADa only, seem less likely. Thus current trends were only extended to the first 5 projection years through ADa based on yearly data. The age-specific average rates of the predicted 5-year incidence data were then assumed to remain constant in the future years. Current projections of prostate cancer rates will be an overestimate if recent decreases in the rates (based on the more recent observed data, which were not available when present study was undertaken) continue.1
FIGURE 4.14.3. Comparison of projected age-standardized incidence rates (ASIRs) derived from the two modelsa by region, prostate cancer, 2008–2017.

Note: Abbreviations: CA=Canada, BC=British Columbia, PR=the Prairies, ON=Ontario, QC=Quebec, AT=the Atlantic region.
aModel ADa: Using ADa (see Methods) to project for the first 10 future years (2008–2017).
Model ADa +AVG: Using ADa to project for the first five projection years (2008–2012), and then using the age-specific average rates of the predicted 5-year data to estimate counts for the future years (2013–2017).
The established risk factors, which are all non-modifiable, are age, family history and ethnicity. Having a first-degree relative with prostate cancer more than doubles a man's risk of developing this tumour.201–204 Risks to sons appeared to be lower than in brothers. Risk is further increased by early age at onset in relatives and multiple relatives with the disease.201 A number of studies may suggest an overall contribution of inherited genes or a shared environment in the development of this disease.201–204 Genes and family history account for about 5% to 9% of all prostate cancers.205 White males have a lower risk of prostate cancer than Black males worldwide but have a higher risk than males of Asian ethnicity.56,206,207 However, the risk for Asian Americans is higher than that for males of a similar background living in Asia.208 Ethnicity may be a surrogate for genetic, environmental or socioeconomic factors.208
Although a definite modifiable risk factor has not been identified, a number have been implicated in prostate cancer initiation. Potential preventative factors include physical activity and frequent intake of soy and foods containing lycopene.209 Lycopene may reduce prostate cancer risk by preventing oxidative DNA damage in prostate tissue by mitigating exposure to cellular free radicals.209,210 A meta-analysis shows that high soy consumption reduces the risk by 26%; however, this inverse association appears to be confined to the Asian population.211 Possible explanations for this observation include different types or amounts of soy products consumed in Asian and Western societies.
Factors that may increase prostate cancer risk include high intakes of dairy products and meat.209 Higher intake of calcium has been associated with a 39% increased risk,212 possibly because of the suppression of 1,25-dihydrovitamin D, which may inhibit cancer cell invasion.213 IARC stated that evidence of an increased risk of prostate cancer in relation to exposure to thorium-232 and its decay products is limited, as is exposure to X-radiation and gamma-radiation, use of anabolic androgenic steroids, exposure to cadmium and cadmium compounds, or exposure to arsenic and inorganic arsenic compounds and the rubber production industry.47
15. Testis cancer
Testis cancer was responsible for 1.0% of all new cancer cases in Canadian males, with an average of 825 new cases annually in 2003–2007 (Table 4.15.1). It was mainly diagnosed in young and middle-aged males, with just over 80% of cases found in those younger than 45. Testis cancer was the most common cancer in males under 45, representing 14.1% of the male cancer cases in that age group during 2003–2007 (Figure 3.9, Figure 4.15.1). In this period, the incidence rate rose steeply from age 10 to 14, peaked at age 25 to 34, and then decreased quickly (Figure 4.15.1).The 5-year relative survival rate is high, at 97% in 2006–2008.1
TABLE 4.15.1.
Observed (2003–2007) and projected average annual new cases by age and province/territories combined (TC), testis cancer, Canada, 2003–2032
| Period | Age | New cases | |||||||||||
|---|---|---|---|---|---|---|---|---|---|---|---|---|---|
| CA | BC | AB | SK | MB | ON | QC | NB | NS | PE | NL | TC | ||
| 2003–07 | <45 | 665 | 85 | 80 | 20 | 25 | 260 | 145 | 10 | 25 | 0 | 10 | 0 |
| 45–54 | 110 | 15 | 15 | 5 | 5 | 45 | 20 | 5 | 5 | 0 | 0 | 0 | |
| 55–64 | 30 | 5 | 5 | 0 | 0 | 10 | 5 | 0 | 0 | 0 | 0 | 0 | |
| 65–74 | 10 | 0 | 0 | 0 | 0 | 5 | 0 | 0 | 0 | 0 | 0 | 0 | |
| 75–84 | 5 | 0 | 0 | 0 | 0 | 5 | 0 | 0 | 0 | 0 | 0 | 0 | |
| 85+ | 5 | 0 | 0 | 0 | 0 | 0 | 0 | 0 | 0 | 0 | 0 | 0 | |
| Total | 825 | 105 | 100 | 25 | 30 | 325 | 175 | 15 | 25 | 5 | 10 | 0 | |
| 2008–12 | <45 | 710 | 95 | 100 | 20 | 25 | 270 | 155 | 10 | 20 | 5 | 10 | 0 |
| 45–54 | 135 | 15 | 20 | 5 | 5 | 55 | 30 | 5 | 5 | 0 | 0 | 0 | |
| 55–64 | 40 | 5 | 5 | 0 | 0 | 15 | 10 | 0 | 0 | 0 | 0 | 0 | |
| 65–74 | 10 | 0 | 0 | 0 | 0 | 5 | 0 | 0 | 0 | 0 | 0 | 0 | |
| 75–84 | 5 | 0 | 0 | 0 | 0 | 5 | 0 | 0 | 0 | 0 | 0 | 0 | |
| 85+ | 5 | 0 | 0 | 0 | 0 | 0 | 0 | 0 | 0 | 0 | 0 | 0 | |
| Total | 905 | 120 | 125 | 25 | 35 | 350 | 195 | 15 | 30 | 5 | 10 | 0 | |
| 2013–17 | <45 | 770 | 110 | 105 | 20 | 25 | 295 | 165 | 10 | 25 | 5 | 10 | 0 |
| 45–54 | 130 | 15 | 15 | 5 | 5 | 55 | 30 | 5 | 5 | 0 | 0 | 0 | |
| 55–64 | 55 | 10 | 5 | 0 | 5 | 20 | 10 | 0 | 0 | 0 | 0 | 0 | |
| 65–74 | 15 | 0 | 0 | 0 | 0 | 10 | 5 | 0 | 0 | 0 | 0 | 0 | |
| 75–84 | 5 | 0 | 0 | 0 | 0 | 5 | 0 | 0 | 0 | 0 | 0 | 0 | |
| 85+ | 5 | 0 | 0 | 0 | 0 | 0 | 0 | 0 | 0 | 0 | 0 | 0 | |
| Total | 985 | 135 | 130 | 30 | 35 | 385 | 210 | 15 | 35 | 5 | 10 | 0 | |
| 2018–22 | <45 | 805 | 125 | 100 | 20 | 30 | 315 | 170 | 15 | 25 | 5 | 10 | 0 |
| 45–54 | 135 | 15 | 15 | 5 | 5 | 55 | 30 | 5 | 5 | 0 | 0 | 0 | |
| 55–64 | 65 | 10 | 5 | 0 | 5 | 25 | 15 | 0 | 0 | 0 | 0 | 0 | |
| 65–74 | 20 | 0 | 0 | 0 | 0 | 10 | 5 | 0 | 0 | 0 | 0 | 0 | |
| 75–84 | 10 | 0 | 0 | 0 | 0 | 5 | 0 | 0 | 0 | 0 | 0 | 0 | |
| 85+ | 5 | 0 | 0 | 0 | 0 | 0 | 0 | 0 | 0 | 0 | 0 | 0 | |
| Total | 1040 | 150 | 125 | 25 | 40 | 415 | 225 | 20 | 35 | 5 | 10 | 0 | |
| 2023–27 | <45 | 795 | 135 | 95 | 20 | 30 | 320 | 170 | 15 | 25 | 5 | 10 | 0 |
| 45–54 | 155 | 20 | 15 | 5 | 5 | 65 | 35 | 5 | 5 | 0 | 0 | 0 | |
| 55–64 | 65 | 10 | 5 | 0 | 5 | 30 | 15 | 0 | 0 | 0 | 0 | 0 | |
| 65–74 | 30 | 5 | 0 | 0 | 0 | 15 | 5 | 0 | 0 | 0 | 0 | 0 | |
| 75–84 | 10 | 0 | 0 | 0 | 0 | 5 | 0 | 0 | 0 | 0 | 0 | 0 | |
| 85+ | 5 | 0 | 0 | 0 | 0 | 0 | 0 | 0 | 0 | 0 | 0 | 0 | |
| Total | 1065 | 165 | 120 | 25 | 40 | 435 | 230 | 20 | 35 | 5 | 10 | 0 | |
| 2028–32 | <45 | 760 | 140 | 100 | 20 | 30 | 320 | 165 | 15 | 30 | 5 | 5 | 0 |
| 45–54 | 185 | 25 | 15 | 5 | 5 | 70 | 40 | 5 | 5 | 0 | 0 | 0 | |
| 55–64 | 70 | 10 | 5 | 0 | 5 | 30 | 20 | 0 | 0 | 0 | 0 | 0 | |
| 65–74 | 40 | 5 | 0 | 0 | 0 | 20 | 10 | 0 | 5 | 0 | 0 | 0 | |
| 75–84 | 15 | 0 | 0 | 0 | 0 | 5 | 5 | 0 | 0 | 0 | 0 | 0 | |
| 85+ | 5 | 0 | 0 | 0 | 0 | 0 | 0 | 0 | 0 | 0 | 0 | 0 | |
| Total | 1070 | 175 | 125 | 25 | 40 | 450 | 240 | 20 | 40 | 5 | 10 | 0 | |
Abbreviations: AB, Alberta; BC, British Columbia; CA, Canada; MB, Manitoba; NB, New Brunswick; NL, Newfoundland and Labrador; NS, Nova Scotia; ON, Ontario; PE, Prince Edward Island; QC, Quebec; SK, Saskatchewan; TC, All Territories (Yukon, Northwest Territories and Nunavut).
Note: Totals may not add up due to rounding.
FIGURE 4.15.1. Age-specific incidence rates of testis cancer, Canada, 2003–2007 (from average annual counts).

The overall incidence rate of testis cancer in Canada increased steadily by 39%, from 4.0 per 100 000 in 1983–1987 to 5.6 in 2003–2007 (Figure 4.15.2). However, the rate of increase has slowed slightly since 1993–1997. Between 1998 and 2007, the ASIRs for testis cancer increased significantly at 1.4% per year (Figure 3.1). The primary trends of the ASIRs in each region demonstrate increases. The ASIRs were higher in western Canada and lower in the east. The age-specific analysis indicates that ASIRs in Canada increased steadily for males under 55 and showed opposite trends for those above this age (Figure 4.15.3).
FIGURE 4.15.2. Age-standardized incidence rates (ASIRs) by region, testis cancer, 1983–2032.

FIGURE 4.15.3. Age-standardized incidence rates (ASIRs) for testis cancer by age group, Canada, 1983–2032.

Overall incidence rates of testis cancer are projected to increase gradually until 2018–2022 and then level off (Figure 4.15.2). A similar pattern is predicted for Ontario and the Atlantic region but the turn point is 5 years later. Rates for the Prairies are expected to reach a peak 5 years sooner than the rest of the country, then decrease gradually, presenting the lowest incidence in the last 2 projected periods. In contrast, the rates in British Columbia and Quebec will rise persistently through the whole prediction period. British Columbia is predicted to experience the highest incidence rates from 2018–2022. Figure 4.15.3 illustrates that rates in all age groups under 75 are expected to increase, but at different levels. Rates in the youngest age group will approach a peak in 2018–2022 and then display a downward trend. The rates in men aged 75 or older are projected to stabilize or decrease slightly.
From 2003–2007 to 2028–2032, the ASIRs for testis cancer are expected to increase by 8%, from 5.6 to 6.0 per 100 000 (Table 4.15.2). The annual number of new cases is projected to rise by 30%, from 825 to 1070 (Table 4.15.1).
TABLE 4.15.2.
Observed (2003–2007) and projected age-standardized incidence rates (ASIRs) by age and province/territories combined (TC), testis cancer, Canada, 2003–2032
| Period | Age | ASIRs | |||||||||||
|---|---|---|---|---|---|---|---|---|---|---|---|---|---|
| CA | BC | AB | SK | MB | ON | QC | NB | NS | PE | NL | TC | ||
| 2003–07 | <45 | 6.9 | 6.9 | 7.3 | 7.3 | 6.9 | 7.0 | 6.6 | 5.7 | 8.8 | 6.5 | 6.2 | 4.6 |
| 45–54 | 4.5 | 4.3 | 5.6 | 4.7 | 5.6 | 4.9 | 3.4 | 5.2 | 3.8 | 3.9 | 1.8 | 7.7 | |
| 55–64 | 1.7 | 2.3 | 2.3 | 1.6 | 1.0 | 1.7 | 1.3 | 0.8 | 0.6 | 2.8 | 1.2 | 0.0 | |
| 65–74 | 1.0 | 0.9 | 1.1 | 0.0 | 2.7 | 1.1 | 0.6 | 0.0 | 1.8 | 4.0 | 2.1 | 0.0 | |
| 75–84 | 1.1 | 1.1 | 1.2 | 0.8 | 0.9 | 1.2 | 0.8 | 0.0 | 1.1 | 7.6 | 4.2 | 0.0 | |
| 85+ | 1.8 | 0.8 | 0.0 | 2.7 | 8.3 | 1.1 | 1.3 | 9.7 | 7.5 | 0.0 | 0.0 | 0.0 | |
| Total | 5.6 | 5.6 | 6.0 | 5.8 | 5.8 | 5.7 | 5.2 | 4.7 | 6.8 | 5.7 | 4.9 | 4.0 | |
| 2008–12 | <45 | 7.3 | 7.4 | 8.0 | 7.4 | 7.1 | 7.2 | 6.9 | 5.9 | 9.2 | 7.6 | 6.4 | 5.3 |
| 45–54 | 5.0 | 4.9 | 6.2 | 5.7 | 5.1 | 5.3 | 4.7 | 5.5 | 5.2 | 5.3 | 4.4 | 3.7 | |
| 55–64 | 1.9 | 2.2 | 2.2 | 1.7 | 3.2 | 2.1 | 1.6 | 0.9 | 2.1 | 2.0 | 1.7 | 1.4 | |
| 65–74 | 1.0 | 0.6 | 1.3 | 0.7 | 1.9 | 1.4 | 0.6 | 1.3 | 2.8 | 1.0 | 0.9 | 0.7 | |
| 75–84 | 1.0 | 1.0 | 1.3 | 0.8 | 2.1 | 1.0 | 0.7 | 0.0 | 0.8 | 1.0 | 0.9 | 0.7 | |
| 85+ | 1.5 | 1.0 | 3.0 | 2.3 | 3.4 | 1.1 | 1.4 | 5.2 | 6.1 | 1.6 | 1.3 | 1.1 | |
| Total | 5.9 | 5.9 | 6.6 | 6.0 | 6.0 | 5.9 | 5.5 | 4.9 | 7.4 | 6.1 | 5.1 | 4.3 | |
| 2013–17 | <45 | 7.6 | 8.0 | 8.2 | 7.4 | 7.3 | 7.5 | 7.3 | 6.3 | 10.0 | 7.9 | 6.7 | 5.6 |
| 45–54 | 5.1 | 4.7 | 5.4 | 5.7 | 5.3 | 5.4 | 5.3 | 6.0 | 5.8 | 5.4 | 4.5 | 3.8 | |
| 55–64 | 2.2 | 2.4 | 2.4 | 1.8 | 3.4 | 2.4 | 1.9 | 1.0 | 2.4 | 2.3 | 1.9 | 1.6 | |
| 65–74 | 1.0 | 0.7 | 1.1 | 0.6 | 2.0 | 1.5 | 0.7 | 1.4 | 3.2 | 1.1 | 0.9 | 0.8 | |
| 75–84 | 0.9 | 0.7 | 1.6 | 0.5 | 2.2 | 0.9 | 0.7 | 0.0 | 1.0 | 0.9 | 0.8 | 0.7 | |
| 85+ | 1.3 | 0.7 | 1.8 | 1.5 | 3.5 | 1.1 | 0.9 | 5.6 | 6.9 | 1.3 | 1.1 | 0.9 | |
| Total | 6.1 | 6.4 | 6.6 | 6.0 | 6.2 | 6.1 | 5.8 | 5.2 | 8.1 | 6.4 | 5.4 | 4.5 | |
| 2018–22 | <45 | 7.7 | 8.6 | 8.0 | 7.3 | 7.5 | 7.6 | 7.4 | 6.5 | 10.6 | 8.0 | 6.7 | 5.6 |
| 45–54 | 5.6 | 4.9 | 5.7 | 4.9 | 5.4 | 5.6 | 6.0 | 6.3 | 6.3 | 5.9 | 4.9 | 4.1 | |
| 55–64 | 2.5 | 2.4 | 2.5 | 2.1 | 3.4 | 2.7 | 2.6 | 1.1 | 2.6 | 2.6 | 2.2 | 1.8 | |
| 65–74 | 1.2 | 0.8 | 1.1 | 0.5 | 2.1 | 1.7 | 0.9 | 1.5 | 3.5 | 1.2 | 1.0 | 0.9 | |
| 75–84 | 0.8 | 0.5 | 1.4 | 0.4 | 2.3 | 1.0 | 0.6 | 0.0 | 1.1 | 0.9 | 0.7 | 0.6 | |
| 85+ | 1.2 | 0.9 | 1.8 | 1.2 | 3.6 | 0.9 | 0.8 | 5.9 | 7.4 | 1.2 | 1.0 | 0.9 | |
| Total | 6.3 | 6.8 | 6.5 | 5.8 | 6.3 | 6.3 | 6.1 | 5.4 | 8.6 | 6.6 | 5.5 | 4.6 | |
| 2023–27 | <45 | 7.5 | 9.0 | 7.7 | 7.1 | 7.5 | 7.6 | 7.5 | 6.6 | 11.0 | 7.8 | 6.6 | 5.5 |
| 45–54 | 6.4 | 5.5 | 5.7 | 4.5 | 5.5 | 6.6 | 6.6 | 6.4 | 6.5 | 6.7 | 5.6 | 4.7 | |
| 55–64 | 2.6 | 2.4 | 1.8 | 1.9 | 3.5 | 2.8 | 3.0 | 1.1 | 2.7 | 2.7 | 2.3 | 1.9 | |
| 65–74 | 1.4 | 0.9 | 1.0 | 0.4 | 2.1 | 1.9 | 1.2 | 1.6 | 3.6 | 1.5 | 1.2 | 1.0 | |
| 75–84 | 0.9 | 0.7 | 1.1 | 0.3 | 2.3 | 1.1 | 0.6 | 0.0 | 1.1 | 0.9 | 0.8 | 0.7 | |
| 85+ | 1.1 | 0.4 | 2.0 | 0.6 | 3.7 | 0.9 | 0.8 | 6.0 | 7.6 | 1.2 | 1.0 | 0.8 | |
| Total | 6.2 | 7.1 | 6.2 | 5.6 | 6.4 | 6.4 | 6.3 | 5.5 | 8.9 | 6.5 | 5.5 | 4.6 | |
| 2028–32 | <45 | 7.0 | 9.1 | 7.8 | 7.1 | 7.6 | 7.3 | 7.4 | 6.7 | 11.3 | 7.4 | 6.2 | 5.2 |
| 45–54 | 7.0 | 6.6 | 5.1 | 4.6 | 5.5 | 6.9 | 7.2 | 6.6 | 6.8 | 7.3 | 6.2 | 5.1 | |
| 55–64 | 2.9 | 2.5 | 1.7 | 1.5 | 3.5 | 2.9 | 3.5 | 1.2 | 2.8 | 3.0 | 2.5 | 2.1 | |
| 65–74 | 1.6 | 0.9 | 0.9 | 0.5 | 2.2 | 2.2 | 1.6 | 1.6 | 3.8 | 1.7 | 1.4 | 1.2 | |
| 75–84 | 1.0 | 0.8 | 0.9 | 0.2 | 2.3 | 1.3 | 0.8 | 0.0 | 1.2 | 1.1 | 0.9 | 0.8 | |
| 85+ | 1.1 | 0.5 | 1.2 | 0.5 | 3.7 | 1.0 | 0.6 | 6.2 | 7.9 | 1.1 | 0.9 | 0.8 | |
| Total | 6.0 | 7.3 | 6.2 | 5.6 | 6.4 | 6.3 | 6.3 | 5.6 | 9.2 | 6.3 | 5.3 | 4.4 | |
Abbreviations: AB, Alberta; BC, British Columbia; CA, Canada; MB, Manitoba; NB, New Brunswick; NL, Newfoundland and Labrador; NS, Nova Scotia; ON, Ontario; PE, Prince Edward Island; QC, Quebec; SK, Saskatchewan; TC, All Territories (Yukon, Northwest Territories and Nunavut).
Comments
Similar to the trends we observed in Canada, large increases in incidence of testis cancer have been reported over the last 4 decades in many countries, including the US,214 European countries,215,216 and Australia.217 The increases are also predicted in Ireland,2 England218 and Nordic countries.3,35 No explanation for the increasing trends has been accepted.
The rate of testis cancer in males younger than 45 is increasing, but the longer-term trend shows a downturn. This result may be considered as a limitation of the Nordpred method in predicting rare cancers, especially for a site such as testis where rates are higher at relatively young ages. For testis cancer in Canada, the model indicates the coefficients for more recently born cohorts were positive so that assuming later birth cohorts have a zero value can result in a longer-term projection of lower rates.
The etiology of testis cancer remains unclear, possibly due to small sample sizes in the majority of studies. The major risk factor for testis cancer could hypothetically be due to an excessive exposure to certain hormones. Prenatal exposure to excess estrogens, adolescent exposure to high levels of male sex hormones and exposure to environmental hormone disruptors have been linked to elevated risk.86 Syndromes noted for abnormal testis and urogenital development are known to increase risk. Germ cell tumours account for 95% of all testis neoplasms. Cryptorchidism causes about 5% to 10% of germ cell tumours cases and increases the relative risk by 2.5- to 15-fold.52,53,219 A lower ratio of sex hormones (estrogens/androgens) may be associated with a reduced risk of germ cell tumours.220 Population-wide increasing exposure to estrogenic or other hormonally active (e.g. antiandrogenic) compounds may be in part responsible for the observed increase in testis cancer incidence.221,222
About 2% of testis cancer cases may be explained by inherited genetic factors.86 Males with a father diagnosed with testis cancer have a 3.8-fold increase in risk, and those with a brother diagnosed with the disease have a 7.6-fold increase in risk.223
16. Kidney cancer
Kidney cancer was the sixth most common type of new cancer diagnosed in Canadian males and the twelfth most common type in females in 2003–2007. The average annual number of kidney cancer cases in this period was 2580 for males and 1665 for females, accounting for 3.2% and 2.2% of all male and female cases, respectively (Tables 4.16.1 and 4.16.2). One in 56 males and 1 in 82 females can expect to be diagnosed with kidney cancer in their lifetime, and 1 in 149 males and 1 in 252 females can expect to die from it.1 The 5-year relative survival rate for kidney cancer was 68% for both sexes combined in Canada between 2006 and 2008.1
TABLE 4.16.1.
Observed (2003–2007) and projected average annual new cases by age and province/territories combined (TC), cancer of kidney, males, Canada, 2003–2032
| Period | Age | New cases | |||||||||||
|---|---|---|---|---|---|---|---|---|---|---|---|---|---|
| CA | BC | AB | SK | MB | ON | QC | NB | NS | PE | NL | TC | ||
| 2003–07 | <45 | 200 | 20 | 20 | 5 | 10 | 80 | 50 | 5 | 10 | 0 | 5 | 0 |
| 45–54 | 435 | 35 | 45 | 10 | 20 | 165 | 115 | 15 | 20 | 5 | 5 | 0 | |
| 55–64 | 690 | 70 | 65 | 20 | 25 | 250 | 190 | 25 | 30 | 5 | 15 | 0 | |
| 65–74 | 650 | 70 | 60 | 25 | 35 | 210 | 185 | 25 | 30 | 5 | 10 | 0 | |
| 75–84 | 475 | 50 | 45 | 20 | 25 | 155 | 140 | 15 | 20 | 0 | 5 | 0 | |
| 85+ | 125 | 20 | 15 | 5 | 5 | 35 | 35 | 5 | 5 | 0 | 0 | 0 | |
| Total | 2580 | 260 | 245 | 85 | 120 | 895 | 715 | 90 | 110 | 15 | 45 | 0 | |
| 2008–12 | <45 | 215 | 15 | 20 | 5 | 10 | 95 | 50 | 5 | 10 | 0 | 5 | 0 |
| 45–54 | 495 | 40 | 55 | 15 | 25 | 190 | 125 | 15 | 20 | 5 | 10 | 0 | |
| 55–64 | 835 | 80 | 80 | 20 | 30 | 295 | 230 | 35 | 35 | 5 | 20 | 0 | |
| 65–74 | 790 | 80 | 80 | 25 | 30 | 260 | 220 | 30 | 35 | 5 | 15 | 0 | |
| 75–84 | 550 | 60 | 50 | 20 | 30 | 175 | 170 | 15 | 20 | 5 | 10 | 0 | |
| 85+ | 170 | 20 | 20 | 5 | 10 | 50 | 55 | 5 | 5 | 0 | 0 | 0 | |
| Total | 3050 | 295 | 305 | 90 | 130 | 1070 | 845 | 110 | 130 | 20 | 55 | 5 | |
| 2013–17 | <45 | 225 | 15 | 25 | 5 | 10 | 100 | 55 | 5 | 10 | 0 | 0 | 0 |
| 45–54 | 510 | 40 | 50 | 10 | 20 | 215 | 125 | 15 | 20 | 5 | 10 | 0 | |
| 55–64 | 950 | 85 | 100 | 25 | 35 | 355 | 245 | 40 | 35 | 5 | 20 | 0 | |
| 65–74 | 1015 | 100 | 100 | 30 | 40 | 330 | 285 | 45 | 50 | 5 | 20 | 0 | |
| 75–84 | 610 | 65 | 60 | 20 | 30 | 195 | 185 | 20 | 25 | 5 | 10 | 0 | |
| 85+ | 220 | 25 | 25 | 5 | 10 | 70 | 70 | 5 | 5 | 0 | 0 | 0 | |
| Total | 3535 | 335 | 365 | 100 | 145 | 1260 | 960 | 130 | 145 | 25 | 60 | 5 | |
| 2018–22 | <45 | 235 | 15 | 25 | 5 | 10 | 105 | 60 | 5 | 10 | 0 | 0 | 0 |
| 45–54 | 505 | 35 | 55 | 10 | 20 | 225 | 115 | 15 | 20 | 5 | 10 | 0 | |
| 55–64 | 1065 | 95 | 110 | 30 | 40 | 415 | 265 | 40 | 40 | 5 | 20 | 0 | |
| 65–74 | 1225 | 120 | 130 | 35 | 45 | 400 | 335 | 55 | 55 | 10 | 25 | 0 | |
| 75–84 | 755 | 75 | 80 | 25 | 30 | 240 | 225 | 25 | 35 | 5 | 10 | 0 | |
| 85+ | 260 | 30 | 30 | 5 | 10 | 80 | 85 | 5 | 10 | 0 | 0 | 0 | |
| Total | 4040 | 375 | 425 | 110 | 155 | 1465 | 1085 | 150 | 165 | 25 | 70 | 5 | |
| 2023–27 | <45 | 220 | 15 | 20 | 5 | 10 | 105 | 55 | 5 | 10 | 0 | 0 | 0 |
| 45–54 | 535 | 35 | 55 | 10 | 20 | 235 | 125 | 15 | 20 | 5 | 5 | 0 | |
| 55–64 | 1085 | 95 | 105 | 25 | 35 | 455 | 260 | 40 | 40 | 5 | 20 | 0 | |
| 65–74 | 1405 | 135 | 170 | 45 | 50 | 480 | 360 | 60 | 55 | 10 | 30 | 0 | |
| 75–84 | 995 | 95 | 105 | 25 | 40 | 310 | 300 | 40 | 50 | 5 | 15 | 0 | |
| 85+ | 300 | 35 | 40 | 5 | 10 | 95 | 95 | 10 | 10 | 0 | 0 | 0 | |
| Total | 4545 | 415 | 490 | 120 | 170 | 1680 | 1200 | 170 | 185 | 30 | 75 | 5 | |
| 2028–32 | <45 | 215 | 15 | 15 | 5 | 10 | 100 | 50 | 5 | 10 | 0 | 0 | 0 |
| 45–54 | 555 | 35 | 55 | 15 | 25 | 250 | 140 | 15 | 20 | 5 | 5 | 0 | |
| 55–64 | 1070 | 85 | 105 | 20 | 35 | 470 | 240 | 40 | 35 | 5 | 15 | 0 | |
| 65–74 | 1575 | 155 | 185 | 45 | 55 | 560 | 400 | 65 | 65 | 10 | 30 | 0 | |
| 75–84 | 1210 | 120 | 135 | 35 | 45 | 385 | 350 | 50 | 55 | 10 | 20 | 0 | |
| 85+ | 395 | 45 | 50 | 10 | 15 | 120 | 125 | 10 | 15 | 0 | 0 | 0 | |
| Total | 5020 | 455 | 550 | 125 | 180 | 1885 | 1305 | 185 | 200 | 35 | 75 | 5 | |
Abbreviations: AB, Alberta; BC, British Columbia; CA, Canada; MB, Manitoba; NB, New Brunswick; NL, Newfoundland and Labrador; NS, Nova Scotia; ON, Ontario; PE, Prince Edward Island; QC, Quebec; SK, Saskatchewan; TC, All Territories (Yukon, Northwest Territories and Nunavut).
Note: Totals may not add up due to rounding.
TABLE 4.16.2.
Observed (2003–2007) and projected average annual new cases by age and province/territories combined (TC), cancer of kidney, females, Canada, 2003–2032
| Period | Age | New cases | |||||||||||
|---|---|---|---|---|---|---|---|---|---|---|---|---|---|
| CA | BC | AB | SK | MB | ON | QC | NB | NS | PE | NL | TC | ||
| 2003–07 | <45 | 140 | 10 | 15 | 5 | 5 | 60 | 35 | 5 | 5 | 0 | 0 | 0 |
| 45–54 | 235 | 20 | 25 | 5 | 10 | 90 | 60 | 10 | 10 | 0 | 5 | 0 | |
| 55–64 | 360 | 30 | 30 | 10 | 15 | 130 | 100 | 15 | 20 | 0 | 5 | 0 | |
| 65–74 | 405 | 40 | 35 | 10 | 15 | 150 | 110 | 15 | 20 | 5 | 5 | 0 | |
| 75–84 | 380 | 35 | 30 | 15 | 20 | 135 | 115 | 10 | 15 | 0 | 5 | 0 | |
| 85+ | 150 | 15 | 10 | 5 | 5 | 50 | 50 | 5 | 5 | 0 | 0 | 0 | |
| Total | 1665 | 150 | 145 | 55 | 70 | 615 | 465 | 55 | 75 | 10 | 25 | 5 | |
| 2008–12 | <45 | 140 | 10 | 15 | 5 | 5 | 65 | 35 | 5 | 5 | 0 | 0 | 0 |
| 45–54 | 270 | 20 | 25 | 10 | 15 | 105 | 70 | 10 | 10 | 0 | 5 | 0 | |
| 55–64 | 440 | 35 | 35 | 15 | 15 | 170 | 120 | 20 | 20 | 0 | 10 | 0 | |
| 65–74 | 465 | 45 | 40 | 10 | 20 | 175 | 125 | 15 | 25 | 0 | 10 | 0 | |
| 75–84 | 415 | 35 | 30 | 15 | 20 | 145 | 125 | 15 | 20 | 0 | 5 | 0 | |
| 85+ | 195 | 20 | 15 | 5 | 10 | 70 | 60 | 5 | 5 | 0 | 0 | 0 | |
| Total | 1935 | 170 | 165 | 60 | 75 | 725 | 535 | 65 | 85 | 10 | 30 | 5 | |
| 2013–17 | <45 | 155 | 10 | 20 | 5 | 5 | 80 | 35 | 5 | 5 | 0 | 0 | 0 |
| 45–54 | 270 | 15 | 25 | 10 | 15 | 110 | 70 | 10 | 10 | 0 | 5 | 0 | |
| 55–64 | 515 | 40 | 40 | 15 | 20 | 195 | 135 | 20 | 25 | 0 | 10 | 0 | |
| 65–74 | 580 | 55 | 45 | 15 | 20 | 215 | 155 | 20 | 30 | 5 | 10 | 0 | |
| 75–84 | 460 | 40 | 35 | 10 | 20 | 165 | 135 | 15 | 20 | 0 | 5 | 0 | |
| 85+ | 245 | 25 | 20 | 5 | 10 | 85 | 80 | 5 | 10 | 0 | 0 | 0 | |
| Total | 2220 | 185 | 185 | 65 | 85 | 850 | 615 | 75 | 100 | 10 | 35 | 5 | |
| 2018–22 | <45 | 160 | 10 | 20 | 5 | 5 | 90 | 35 | 5 | 5 | 0 | 0 | 0 |
| 45–54 | 260 | 15 | 25 | 10 | 10 | 110 | 65 | 10 | 10 | 0 | 5 | 0 | |
| 55–64 | 560 | 40 | 45 | 20 | 25 | 215 | 155 | 20 | 25 | 5 | 10 | 0 | |
| 65–74 | 715 | 65 | 55 | 20 | 25 | 275 | 185 | 25 | 35 | 5 | 15 | 0 | |
| 75–84 | 535 | 50 | 40 | 10 | 20 | 190 | 160 | 20 | 25 | 0 | 5 | 0 | |
| 85+ | 275 | 25 | 20 | 5 | 10 | 95 | 90 | 10 | 10 | 0 | 0 | 0 | |
| Total | 2505 | 205 | 210 | 70 | 95 | 980 | 685 | 85 | 110 | 10 | 40 | 5 | |
| 2023–27 | <45 | 170 | 10 | 25 | 5 | 5 | 100 | 35 | 5 | 5 | 0 | 0 | 0 |
| 45–54 | 270 | 15 | 25 | 10 | 10 | 130 | 60 | 10 | 10 | 0 | 5 | 0 | |
| 55–64 | 545 | 35 | 45 | 20 | 25 | 210 | 150 | 20 | 25 | 0 | 10 | 0 | |
| 65–74 | 820 | 70 | 60 | 25 | 30 | 315 | 210 | 30 | 40 | 5 | 15 | 0 | |
| 75–84 | 675 | 60 | 50 | 15 | 25 | 235 | 205 | 25 | 35 | 5 | 10 | 0 | |
| 85+ | 315 | 30 | 25 | 5 | 10 | 115 | 100 | 10 | 10 | 0 | 0 | 0 | |
| Total | 2795 | 225 | 230 | 75 | 105 | 1105 | 755 | 95 | 125 | 15 | 45 | 5 | |
| 2028–32 | <45 | 160 | 10 | 20 | 5 | 5 | 100 | 30 | 5 | 5 | 0 | 0 | 0 |
| 45–54 | 290 | 15 | 30 | 10 | 15 | 150 | 60 | 10 | 10 | 0 | 5 | 0 | |
| 55–64 | 525 | 35 | 45 | 15 | 20 | 215 | 135 | 20 | 20 | 0 | 10 | 0 | |
| 65–74 | 895 | 75 | 70 | 30 | 35 | 340 | 230 | 35 | 45 | 5 | 15 | 0 | |
| 75–84 | 825 | 70 | 60 | 20 | 30 | 300 | 240 | 30 | 40 | 5 | 10 | 0 | |
| 85+ | 370 | 40 | 30 | 5 | 10 | 130 | 120 | 10 | 15 | 0 | 0 | 0 | |
| Total | 3070 | 245 | 250 | 85 | 120 | 1235 | 810 | 105 | 135 | 15 | 45 | 5 | |
Abbreviations: AB, Alberta; BC, British Columbia; CA, Canada; MB, Manitoba; NB, New Brunswick; NL, Newfoundland and Labrador; NS, Nova Scotia; ON, Ontario; PE, Prince Edward Island; QC, Quebec; SK, Saskatchewan; TC, All Territories (Yukon, Northwest Territories and Nunavut).
Note: Totals may not add up due to rounding.
During 2003–2007, the ASIRs of kidney cancer increased with age to 83.1 per 100 000 in men and 43.4 per 100 000 in women for those aged 85 or older, but for those aged 55 or older the increase was less pronounced in women than in men (Tables 4.16.3 and 4.16.4). Overall, kidney cancer incidence occurred nearly twice as often in males as in females. The male-to-female ratio increased with age in each observation period up to the 65–74 age group and stabilized at almost 2:1 in older age groups (Figure 4.16.2). Tables 4.16.1 and 4.16.2 show that about 90% of cases were diagnosed in people aged 45 or older in 2003–2007.
TABLE 4.16.3.
Observed (2003–2007) and projected age-standardized incidence rates (ASIRs) by age and province/territories combined (TC), cancer of kidney, males, Canada, 2003–2032
| Period | Age | ASIRs | |||||||||||
|---|---|---|---|---|---|---|---|---|---|---|---|---|---|
| CA | BC | AB | SK | MB | ON | QC | NB | NS | PE | NL | TC | ||
| 2003–07 | <45 | 1.9 | 1.4 | 1.7 | 1.8 | 2.1 | 1.9 | 2.0 | 2.4 | 2.7 | 2.6 | 2.1 | 0.0 |
| 45–54 | 17.6 | 10.5 | 17.9 | 16.2 | 23.1 | 17.7 | 18.5 | 27.7 | 24.5 | 26.9 | 16.7 | 10.0 | |
| 55–64 | 40.4 | 29.2 | 41.9 | 38.3 | 43.3 | 39.1 | 43.7 | 54.8 | 53.1 | 58.0 | 49.5 | 20.2 | |
| 65–74 | 60.8 | 45.5 | 68.5 | 67.6 | 91.9 | 52.2 | 68.7 | 87.1 | 81.9 | 93.8 | 66.0 | 36.0 | |
| 75–84 | 76.3 | 56.3 | 86.2 | 88.4 | 93.3 | 64.0 | 96.1 | 94.8 | 105.9 | 58.9 | 69.1 | 28.8 | |
| 85+ | 83.1 | 76.1 | 97.4 | 66.5 | 102.9 | 63.0 | 116.7 | 87.4 | 104.4 | 132.8 | 26.8 | 0.0 | |
| Total | 14.4 | 10.5 | 15.5 | 14.7 | 18.3 | 13.1 | 16.4 | 19.6 | 19.5 | 19.6 | 14.8 | 6.3 | |
| 2008–12 | <45 | 2.1 | 1.1 | 1.8 | 1.8 | 2.3 | 2.4 | 2.2 | 2.4 | 3.4 | 2.7 | 1.8 | 0.9 |
| 45–54 | 18.1 | 11.3 | 18.4 | 17.7 | 24.2 | 18.1 | 19.2 | 26.4 | 24.5 | 30.4 | 20.0 | 8.1 | |
| 55–64 | 40.4 | 27.7 | 38.7 | 36.8 | 44.3 | 38.7 | 45.0 | 70.3 | 56.0 | 61.5 | 46.5 | 18.0 | |
| 65–74 | 63.5 | 45.9 | 75.6 | 72.5 | 77.5 | 56.0 | 70.3 | 92.8 | 90.3 | 93.1 | 75.7 | 28.3 | |
| 75–84 | 79.3 | 58.4 | 87.8 | 82.1 | 113.6 | 65.2 | 100.2 | 99.5 | 103.3 | 100.6 | 71.6 | 35.3 | |
| 85+ | 81.2 | 61.6 | 109.6 | 60.4 | 101.1 | 61.6 | 118.9 | 89.3 | 105.9 | 115.6 | 30.8 | 36.2 | |
| Total | 14.9 | 10.2 | 16.0 | 14.8 | 18.4 | 13.7 | 17.0 | 21.4 | 20.8 | 21.6 | 15.5 | 6.6 | |
| 2013–17 | <45 | 2.2 | 1.1 | 1.7 | 1.9 | 2.3 | 2.4 | 2.3 | 2.5 | 3.5 | 2.8 | 1.8 | 1.0 |
| 45–54 | 18.8 | 10.8 | 17.8 | 16.4 | 24.0 | 20.0 | 20.0 | 29.1 | 26.7 | 31.8 | 20.5 | 8.4 | |
| 55–64 | 40.3 | 26.9 | 41.2 | 39.1 | 43.4 | 39.7 | 43.0 | 69.6 | 50.3 | 63.9 | 47.9 | 18.0 | |
| 65–74 | 65.1 | 45.6 | 73.6 | 68.1 | 75.9 | 56.6 | 73.6 | 110.8 | 101.7 | 96.5 | 77.8 | 29.0 | |
| 75–84 | 79.8 | 55.6 | 94.6 | 89.8 | 108.4 | 66.5 | 99.2 | 99.3 | 104.9 | 104.2 | 73.6 | 35.5 | |
| 85+ | 81.6 | 65.7 | 104.8 | 63.6 | 92.6 | 64.4 | 113.4 | 93.9 | 102.8 | 119.6 | 31.8 | 36.4 | |
| Total | 15.1 | 10.0 | 16.1 | 14.9 | 17.9 | 14.2 | 17.2 | 22.9 | 21.3 | 22.4 | 15.9 | 6.7 | |
| 2018–22 | <45 | 2.1 | 1.0 | 1.6 | 1.9 | 2.4 | 2.5 | 2.4 | 2.5 | 3.5 | 2.9 | 1.8 | 0.9 |
| 45–54 | 20.0 | 10.0 | 18.4 | 16.9 | 24.4 | 22.3 | 20.4 | 29.9 | 28.8 | 32.7 | 20.8 | 8.9 | |
| 55–64 | 40.8 | 27.2 | 40.5 | 37.9 | 44.3 | 40.7 | 43.8 | 70.9 | 51.8 | 65.6 | 48.8 | 18.2 | |
| 65–74 | 64.7 | 44.6 | 72.8 | 66.4 | 71.1 | 56.8 | 73.5 | 118.2 | 95.3 | 98.8 | 79.2 | 28.8 | |
| 75–84 | 81.5 | 55.7 | 98.9 | 90.6 | 99.6 | 68.5 | 98.6 | 110.2 | 118.1 | 106.6 | 75.0 | 36.3 | |
| 85+ | 82.0 | 64.6 | 107.2 | 61.5 | 103.4 | 62.8 | 115.7 | 97.0 | 98.5 | 122.4 | 32.5 | 36.6 | |
| Total | 15.3 | 9.8 | 16.2 | 14.8 | 17.5 | 14.6 | 17.3 | 24.1 | 21.7 | 23.0 | 16.1 | 6.8 | |
| 2023–27 | <45 | 1.9 | 0.9 | 1.4 | 1.9 | 2.4 | 2.2 | 2.2 | 2.5 | 3.5 | 2.9 | 1.8 | 0.8 |
| 45–54 | 21.2 | 10.1 | 18.5 | 17.2 | 24.6 | 23.5 | 22.1 | 30.4 | 28.9 | 33.2 | 20.9 | 9.4 | |
| 55–64 | 41.9 | 26.6 | 39.0 | 34.4 | 43.3 | 44.0 | 44.9 | 74.9 | 55.4 | 66.5 | 49.3 | 18.7 | |
| 65–74 | 64.4 | 43.1 | 76.7 | 68.6 | 69.9 | 58.0 | 70.2 | 113.8 | 87.3 | 100.0 | 79.9 | 28.7 | |
| 75–84 | 82.7 | 54.9 | 95.3 | 82.9 | 96.4 | 68.6 | 102.7 | 127.6 | 130.6 | 107.9 | 75.7 | 36.9 | |
| 85+ | 82.0 | 60.6 | 117.7 | 69.7 | 87.3 | 65.3 | 111.3 | 92.1 | 103.1 | 123.8 | 32.8 | 36.5 | |
| Total | 15.4 | 9.6 | 16.1 | 14.5 | 17.1 | 14.9 | 17.4 | 24.7 | 22.0 | 23.3 | 16.3 | 6.9 | |
| 2028–32 | <45 | 1.8 | 1.0 | 1.2 | 2.0 | 2.4 | 2.0 | 2.0 | 2.6 | 3.5 | 2.9 | 1.8 | 0.8 |
| 45–54 | 20.5 | 8.4 | 17.6 | 17.5 | 24.8 | 23.5 | 23.4 | 30.9 | 29.1 | 33.7 | 21.1 | 9.2 | |
| 55–64 | 44.0 | 24.7 | 40.2 | 34.9 | 43.6 | 48.1 | 45.4 | 75.9 | 58.8 | 67.3 | 49.8 | 19.6 | |
| 65–74 | 65.0 | 44.3 | 74.3 | 64.2 | 69.9 | 59.0 | 71.5 | 116.5 | 89.4 | 101.1 | 80.6 | 29.0 | |
| 75–84 | 81.9 | 54.2 | 95.0 | 81.1 | 89.5 | 68.7 | 100.7 | 133.0 | 120.4 | 109.2 | 76.4 | 36.5 | |
| 85+ | 84.4 | 63.4 | 119.0 | 65.3 | 83.8 | 66.6 | 112.2 | 108.9 | 121.0 | 125.2 | 33.2 | 37.6 | |
| Total | 15.5 | 9.3 | 15.9 | 14.2 | 16.9 | 15.3 | 17.4 | 25.4 | 22.3 | 23.5 | 16.4 | 6.9 | |
Abbreviations: AB, Alberta; BC, British Columbia; CA, Canada; MB, Manitoba; NB, New Brunswick; NL, Newfoundland and Labrador; NS, Nova Scotia; ON, Ontario; PE, Prince Edward Island; QC, Quebec; SK, Saskatchewan; TC, All Territories (Yukon, Northwest Territories and Nunavut).
TABLE 4.16.4.
Observed (2003–2007) and projected age-standardized incidence rates (ASIRs) by age and province/territories combined (TC), cancer of kidney, females, Canada, 2003–2032
| Period | Age | ASIRs | |||||||||||
|---|---|---|---|---|---|---|---|---|---|---|---|---|---|
| CA | BC | AB | SK | MB | ON | QC | NB | NS | PE | NL | TC | ||
| 2003–07 | <45 | 1.4 | 0.7 | 1.5 | 1.3 | 1.4 | 1.5 | 1.4 | 1.8 | 1.8 | 1.9 | 1.4 | 1.5 |
| 45–54 | 9.4 | 5.5 | 9.5 | 10.0 | 12.7 | 9.6 | 9.4 | 15.4 | 13.4 | 5.5 | 12.7 | 2.9 | |
| 55–64 | 20.4 | 13.5 | 20.6 | 23.8 | 21.3 | 19.6 | 21.9 | 27.4 | 33.1 | 26.9 | 23.0 | 20.4 | |
| 65–74 | 33.9 | 24.6 | 37.2 | 28.3 | 37.1 | 32.7 | 35.7 | 55.3 | 48.8 | 47.0 | 26.7 | 68.2 | |
| 75–84 | 43.6 | 30.2 | 42.8 | 52.1 | 52.4 | 40.3 | 52.2 | 43.6 | 55.6 | 44.3 | 45.8 | 0.0 | |
| 85+ | 43.4 | 32.0 | 43.8 | 37.0 | 41.2 | 38.1 | 60.2 | 50.3 | 49.5 | 32.2 | 19.6 | 0.0 | |
| Total | 8.0 | 5.3 | 8.3 | 8.2 | 9.0 | 7.8 | 8.8 | 11.1 | 11.4 | 9.3 | 8.0 | 7.7 | |
| 2008–12 | <45 | 1.4 | 0.7 | 1.5 | 1.3 | 1.4 | 1.6 | 1.5 | 1.6 | 1.4 | 1.4 | 1.4 | 1.4 |
| 45–54 | 9.9 | 4.9 | 9.2 | 12.7 | 14.1 | 10.1 | 10.8 | 14.3 | 14.9 | 10.0 | 12.7 | 8.4 | |
| 55–64 | 20.6 | 11.9 | 18.7 | 22.3 | 20.5 | 20.9 | 22.6 | 32.3 | 29.8 | 20.9 | 23.3 | 22.0 | |
| 65–74 | 34.5 | 24.7 | 35.0 | 29.2 | 40.6 | 33.7 | 35.7 | 51.0 | 52.2 | 34.8 | 36.7 | 35.1 | |
| 75–84 | 45.6 | 30.6 | 44.3 | 44.8 | 52.5 | 41.3 | 54.4 | 58.8 | 70.0 | 44.7 | 36.2 | 30.0 | |
| 85+ | 45.3 | 36.7 | 47.9 | 34.2 | 41.4 | 41.1 | 58.8 | 48.2 | 50.9 | 45.4 | 18.7 | 24.1 | |
| Total | 8.3 | 5.2 | 8.1 | 8.1 | 9.3 | 8.2 | 9.2 | 11.5 | 11.7 | 8.3 | 8.4 | 7.5 | |
| 2013–17 | <45 | 1.5 | 0.8 | 1.7 | 1.3 | 1.4 | 1.9 | 1.5 | 1.6 | 1.4 | 1.5 | 1.4 | 1.6 |
| 45–54 | 9.9 | 4.1 | 8.8 | 12.1 | 14.3 | 9.9 | 11.6 | 14.7 | 15.4 | 10.2 | 12.9 | 8.4 | |
| 55–64 | 21.1 | 11.5 | 17.1 | 22.4 | 23.6 | 21.4 | 23.3 | 35.3 | 31.6 | 21.5 | 24.1 | 20.6 | |
| 65–74 | 34.4 | 23.1 | 31.7 | 35.1 | 37.3 | 33.9 | 36.6 | 48.4 | 53.9 | 35.6 | 37.9 | 33.6 | |
| 75–84 | 47.5 | 31.0 | 45.6 | 36.7 | 54.3 | 43.9 | 56.4 | 67.4 | 71.3 | 45.7 | 37.3 | 32.0 | |
| 85+ | 48.1 | 34.4 | 44.1 | 39.0 | 49.2 | 43.5 | 63.2 | 53.7 | 58.2 | 46.5 | 19.4 | 26.3 | |
| Total | 8.5 | 5.0 | 7.8 | 8.2 | 9.6 | 8.6 | 9.4 | 12.0 | 12.1 | 8.5 | 8.6 | 7.5 | |
| 2018–22 | <45 | 1.5 | 0.7 | 1.7 | 1.3 | 1.4 | 2.1 | 1.4 | 1.6 | 1.4 | 1.5 | 1.4 | 1.8 |
| 45–54 | 10.3 | 4.3 | 8.7 | 11.7 | 14.4 | 10.9 | 11.6 | 14.9 | 15.7 | 10.3 | 13.1 | 8.6 | |
| 55–64 | 21.2 | 10.7 | 17.6 | 25.6 | 26.7 | 20.7 | 25.0 | 34.8 | 31.8 | 21.7 | 24.7 | 19.9 | |
| 65–74 | 34.9 | 21.8 | 29.8 | 35.5 | 35.4 | 35.5 | 37.0 | 51.9 | 54.7 | 36.0 | 38.7 | 31.0 | |
| 75–84 | 47.7 | 31.2 | 42.5 | 37.6 | 57.2 | 44.1 | 56.7 | 67.5 | 76.3 | 46.2 | 38.1 | 32.6 | |
| 85+ | 48.6 | 35.4 | 46.2 | 34.3 | 41.6 | 44.8 | 62.0 | 64.5 | 61.5 | 46.9 | 19.8 | 28.7 | |
| Total | 8.6 | 4.8 | 7.6 | 8.5 | 9.7 | 8.9 | 9.6 | 12.4 | 12.5 | 8.6 | 8.7 | 7.4 | |
| 2023–27 | <45 | 1.5 | 0.8 | 1.7 | 1.3 | 1.4 | 2.2 | 1.4 | 1.6 | 1.4 | 1.5 | 1.4 | 2.0 |
| 45–54 | 10.5 | 4.2 | 8.6 | 11.5 | 14.4 | 12.5 | 10.7 | 15.0 | 15.8 | 10.4 | 13.2 | 9.2 | |
| 55–64 | 20.9 | 9.3 | 17.0 | 25.2 | 26.8 | 20.0 | 26.0 | 35.1 | 32.1 | 21.8 | 25.0 | 19.7 | |
| 65–74 | 35.2 | 21.2 | 27.4 | 37.8 | 39.9 | 35.3 | 37.8 | 55.1 | 56.7 | 36.2 | 39.1 | 28.7 | |
| 75–84 | 47.2 | 29.2 | 38.7 | 46.0 | 52.4 | 43.6 | 57.4 | 63.6 | 76.3 | 46.5 | 38.5 | 31.3 | |
| 85+ | 50.7 | 36.0 | 46.7 | 27.3 | 50.2 | 47.2 | 65.3 | 70.7 | 60.1 | 47.3 | 20.1 | 30.2 | |
| Total | 8.6 | 4.7 | 7.3 | 8.8 | 10.0 | 9.0 | 9.6 | 12.5 | 12.6 | 8.7 | 8.8 | 7.5 | |
| 2028–32 | <45 | 1.4 | 0.7 | 1.6 | 1.3 | 1.4 | 2.1 | 1.3 | 1.6 | 1.4 | 1.5 | 1.4 | 2.3 |
| 45–54 | 10.7 | 3.9 | 9.6 | 11.3 | 14.5 | 13.9 | 10.1 | 15.1 | 16.0 | 10.4 | 13.3 | 10.1 | |
| 55–64 | 21.5 | 9.8 | 16.6 | 24.8 | 26.9 | 21.3 | 25.8 | 35.3 | 32.3 | 21.8 | 25.2 | 20.3 | |
| 65–74 | 35.1 | 20.1 | 27.9 | 42.3 | 44.4 | 33.9 | 39.7 | 54.2 | 56.6 | 36.2 | 39.5 | 27.5 | |
| 75–84 | 47.5 | 28.1 | 36.4 | 45.3 | 50.1 | 45.3 | 57.1 | 68.6 | 77.8 | 46.5 | 39.0 | 28.8 | |
| 85+ | 49.1 | 36.2 | 41.1 | 33.6 | 47.6 | 45.1 | 62.7 | 65.8 | 67.4 | 47.4 | 20.3 | 30.0 | |
| Total | 8.6 | 4.5 | 7.2 | 9.1 | 10.2 | 9.2 | 9.6 | 12.6 | 12.8 | 8.7 | 8.9 | 7.7 | |
Abbreviations: AB, Alberta; BC, British Columbia; CA, Canada; MB, Manitoba; NB, New Brunswick; NL, Newfoundland and Labrador; NS, Nova Scotia; ON, Ontario; PE, Prince Edward Island; QC, Quebec; SK, Saskatchewan; TC, All Territories (Yukon, Northwest Territories and Nunavut).
FIGURE 4.16.2. Age-standardized incidence rates (ASIRs) for kidney cancer by age group (– males, – females), Canada, 1983–2032.

Figure 4.16.1 shows that incidence rates generally increased in both sexes during the 1980s, stabilized between 1988–1992 and 1993–1997, and rose again after that. In 2003–2007, kidney cancer ASIRs in males increased significantly by 2.6% per year (a changepoint in trend was detected from 2003, Figure 3.1). During 1998–2007, ASIRs rose significantly in females by 1.9% per year (Figure 3.2). Figure 4.16.2 reveals that incidence of kidney cancer increased over the observation periods across age groups in both sexes, with stronger increases in males in the 1980s and in those (except in the 75–84 age group) during the last 2 observation periods.
FIGURE 4.16.1. Age-standardized incidence rates (ASIRs) by region, kidney cancer, 1983–2032.

The current rising trends in the rates in Canada are projected to continue in each age group (Figure 4.16.2). Figure 4.16.1 shows that the rates of kidney cancer will increase in both sexes in all regions except in British Columbia, where a gradual decrease is predicted, and in the Prairies in females, for whom the rates are forecast to stabilize.
The most elevated rates are predicted for the Atlantic region, while significantly low rates are predicted in British Columbia.
From 2003–2007 to 2028–2032, the ASIRs of kidney cancer for Canada are projected to increase by roughly 7% in both sexes, from 14.4 to 15.5 per 100 000 in males and from 8.0 to 8.6 per 100 000 in females (Tables 4.16.3 and 4.16.4). The annual number of new cases is estimated to increase by 95% in males, from 2580 to 5020, and by 84% in females, from 1665 to 3070 (Tables 4.16.1 and 4.16.2).
Comments
Increases in kidney cancer incidence have been observed in the US, some European countries, Australia, New Zealand and some Asian countries.224–230 Although the increasing use of advanced diagnostic imaging systems has probably led to the incidental detection of asymptomatic kidney cancer,231 the incidence of cancer presenting at a later stage has not decreased.232 This finding suggests that a true increase in kidney cancer has occurred that cannot be solely attributed to changes in diagnostic practices.225
The upward trend in kidney cancer in Canada may be partly explained by changes in risk factors. The major risk factors for kidney cancer include smoking, obesity and some genetic and medical conditions. Smokers have a 50% increase in risk.86 Cigarette smoking is responsible for about 20% to 30% of kidney cancer cases in males and 10% to 24% of cases in females.111,233–235 Smoking prevalence began to decrease in the mid-1960s in males and in the mid-1980s in females.42,43 Smoking prior to these periods may have contributed to the earlier increases in kidney cancer rates around and immediately following these periods. The reductions in smoking are expected to curb the increase in kidney cancer incidence in the future.
Obesity is a significant risk factor for both sexes, and is responsible for about 20% of renal cell carcinoma cases, the predominant form of kidney cancer.233,235 The prevalence rates of obesity have nearly doubled in adults from 1978/79 to 2012.51,72,73 The rates of obesity and kidney cancer have been increasing comparably in Canada in recent decades.
Age-standardized smoking rates and overweight or obese rates have been lower in British Columbia than in other provinces.51,73 This may partly explain the low incidence rates of kidney cancer in British Columbia.
Hypertension has been linked to an excess risk of 20% to 300%,233,234 with a potential dose-response relationship.86 Preventing and controlling hypertension may reduce kidney cancer incidence.236 A meta-analysis of 24 studies suggests that diabetes is associated with an increased risk of kidney cancer, and is independent of alcohol use, obesity and smoking.237 An increased risk of kidney cancer also has been suggested in patients with acquired renal cystic disease.238 Hereditary predispositions, characterized as occurring at birth, are responsible for less than 5% of kidney cancer cases.224,239 There is sufficient evidence that trichloroethylene (used primarily for metal degreasing, especially in the aerospace/aircraft industry) causes kidney cancer, according to IARC.47 The US National Cancer Institute's recent meta-analysis of studies published from 1950 to 2011 indicates a 32% risk increase for occupational trichloroethylene exposure.240
17. Bladder cancer
Bladder cancer is the only site where we combine in situ and malignant cases. The provincial and territorial cancer registries, other than Ontario, have combined in situ and invasive bladder cancers when reporting to the Canadian Cancer Registry (CCR). Reasons for the reporting include the difficulty in identifying early invasion in pathology reports and the high rates of recurrence and progression of in situ tumours.241–243
Bladder cancer was the fourth most common type of new cancer diagnosis in Canadian males and the eleventh most common type in Canadian females in 2003–2007. One in 28 males and 1 in 78 females can expect to be diagnosed with bladder cancer in their lifetime, and 1 in 89 males and 1 in 213 females can expect to die from it.1 The average annual number of new bladder cancer cases in 2003–2007 was 4815 for males and 1705 for females, constituting 6.0% and 2.3% of all male and female cancer cases, respectively (Table 4.17.1 and 4.17.2). The incidence increased exponentially with age for males and linearly for females in the last observation period (2003–2007) (Tables 4.17.3 and 4.17.4). As such, the male-to-female ratio of the rates increased with age, from 2.0:1 in young adults (<45) to 3.9:1 in the oldest (85+) (Figure 4.17.2). About 71% of all bladder cancers were diagnosed in people aged 65 or older in the same period. The 5-year relative survival rate was 74% for bladder cancer diagnosed between 2006 and 2008.1
TABLE 4.17.1.
Observed (2003–2007) and projected average annual new cases by age and province/territories combined (TC), cancer of bladder, males, Canada, 2003–2032
| Period | Age | New cases | |||||||||||
|---|---|---|---|---|---|---|---|---|---|---|---|---|---|
| CA | BC | AB | SK | MB | ON | QC | NB | NS | PE | NL | TC | ||
| 2003–07 | <45 | 105 | 15 | 15 | 0 | 5 | 25 | 40 | 5 | 5 | 0 | 0 | 0 |
| 45–54 | 365 | 45 | 35 | 10 | 10 | 95 | 135 | 15 | 10 | 0 | 5 | 0 | |
| 55–64 | 910 | 120 | 90 | 25 | 35 | 235 | 330 | 25 | 40 | 5 | 10 | 0 | |
| 65–74 | 1470 | 210 | 135 | 45 | 50 | 420 | 480 | 40 | 55 | 10 | 25 | 0 | |
| 75–84 | 1495 | 220 | 125 | 50 | 65 | 440 | 465 | 40 | 55 | 5 | 25 | 0 | |
| 85+ | 465 | 80 | 40 | 20 | 20 | 130 | 120 | 15 | 20 | 5 | 10 | 0 | |
| Total | 4815 | 685 | 440 | 160 | 180 | 1345 | 1570 | 140 | 180 | 25 | 80 | 5 | |
| 2008–12 | <45 | 95 | 15 | 15 | 5 | 5 | 25 | 40 | 5 | 5 | 0 | 0 | 0 |
| 45–54 | 360 | 40 | 40 | 15 | 10 | 100 | 140 | 10 | 10 | 0 | 5 | 0 | |
| 55–64 | 1060 | 135 | 105 | 35 | 35 | 275 | 390 | 35 | 45 | 5 | 15 | 0 | |
| 65–74 | 1595 | 235 | 150 | 50 | 55 | 435 | 555 | 55 | 60 | 10 | 25 | 0 | |
| 75–84 | 1650 | 245 | 150 | 50 | 65 | 490 | 530 | 45 | 60 | 10 | 30 | 0 | |
| 85+ | 645 | 115 | 55 | 25 | 25 | 200 | 180 | 20 | 25 | 5 | 10 | 0 | |
| Total | 5405 | 775 | 520 | 170 | 195 | 1520 | 1835 | 160 | 210 | 25 | 85 | 5 | |
| 2013–17 | <45 | 95 | 15 | 15 | 5 | 5 | 20 | 40 | 0 | 5 | 0 | 0 | 0 |
| 45–54 | 340 | 40 | 40 | 15 | 10 | 95 | 140 | 10 | 10 | 0 | 5 | 0 | |
| 55–64 | 1150 | 140 | 125 | 45 | 40 | 315 | 415 | 35 | 50 | 5 | 15 | 0 | |
| 65–74 | 1935 | 270 | 195 | 55 | 65 | 515 | 705 | 65 | 80 | 5 | 30 | 0 | |
| 75–84 | 1760 | 265 | 170 | 55 | 65 | 515 | 580 | 50 | 70 | 15 | 30 | 0 | |
| 85+ | 825 | 135 | 75 | 25 | 35 | 270 | 240 | 20 | 30 | 5 | 10 | 0 | |
| Total | 6105 | 865 | 615 | 190 | 220 | 1725 | 2125 | 185 | 240 | 30 | 95 | 5 | |
| 2018–22 | <45 | 95 | 15 | 15 | 5 | 5 | 20 | 45 | 0 | 5 | 0 | 0 | 0 |
| 45–54 | 305 | 40 | 35 | 10 | 10 | 85 | 120 | 10 | 10 | 0 | 5 | 0 | |
| 55–64 | 1190 | 135 | 140 | 50 | 40 | 335 | 445 | 35 | 50 | 5 | 15 | 0 | |
| 65–74 | 2310 | 320 | 240 | 70 | 85 | 620 | 835 | 75 | 100 | 5 | 35 | 5 | |
| 75–84 | 2055 | 300 | 205 | 60 | 80 | 585 | 710 | 65 | 85 | 15 | 40 | 0 | |
| 85+ | 965 | 165 | 100 | 30 | 35 | 305 | 290 | 25 | 30 | 5 | 15 | 0 | |
| Total | 6920 | 970 | 730 | 225 | 250 | 1950 | 2445 | 210 | 280 | 30 | 110 | 10 | |
| 2023–27 | <45 | 105 | 15 | 15 | 5 | 5 | 25 | 45 | 5 | 5 | 0 | 0 | 0 |
| 45–54 | 295 | 35 | 35 | 10 | 10 | 80 | 130 | 10 | 10 | 0 | 5 | 0 | |
| 55–64 | 1160 | 135 | 135 | 45 | 40 | 335 | 440 | 30 | 50 | 5 | 15 | 0 | |
| 65–74 | 2590 | 340 | 290 | 95 | 100 | 720 | 905 | 85 | 105 | 5 | 40 | 5 | |
| 75–84 | 2615 | 365 | 275 | 75 | 100 | 730 | 925 | 80 | 115 | 10 | 50 | 5 | |
| 85+ | 1095 | 180 | 110 | 30 | 45 | 340 | 330 | 30 | 40 | 10 | 15 | 0 | |
| Total | 7860 | 1075 | 860 | 260 | 295 | 2225 | 2775 | 235 | 325 | 30 | 125 | 10 | |
| 2028–32 | <45 | 105 | 15 | 15 | 5 | 5 | 25 | 45 | 5 | 5 | 0 | 0 | 0 |
| 45–54 | 315 | 40 | 35 | 15 | 10 | 80 | 140 | 10 | 10 | 0 | 5 | 0 | |
| 55–64 | 1065 | 135 | 130 | 40 | 35 | 305 | 390 | 30 | 45 | 5 | 15 | 0 | |
| 65–74 | 2760 | 340 | 325 | 105 | 105 | 795 | 980 | 80 | 105 | 5 | 40 | 5 | |
| 75–84 | 3205 | 435 | 350 | 95 | 130 | 895 | 1110 | 95 | 145 | 10 | 60 | 5 | |
| 85+ | 1375 | 220 | 150 | 35 | 50 | 415 | 445 | 45 | 50 | 5 | 20 | 0 | |
| Total | 8825 | 1180 | 1000 | 295 | 335 | 2515 | 3110 | 260 | 360 | 30 | 140 | 10 | |
Abbreviations: AB, Alberta; BC, British Columbia; CA, Canada; MB, Manitoba; NB, New Brunswick; NL, Newfoundland and Labrador; NS, Nova Scotia; ON, Ontario; PE, Prince Edward Island; QC, Quebec; SK, Saskatchewan; TC, All Territories (Yukon, Northwest Territories and Nunavut).
Note: 1. Totals may not add up due to rounding.
2. Bladder cancer is the only site where in-situ and malignant cases are combined in this report. Ontario has not reported in situ bladder cancer.
TABLE 4.17.2.
Observed (2003–2007) and projected average annual new cases by age and province/territories combined (TC), cancer of bladder, females, Canada, 2003–2032
| Period | Age | New cases | |||||||||||
|---|---|---|---|---|---|---|---|---|---|---|---|---|---|
| CA | BC | AB | SK | MB | ON | QC | NB | NS | PE | NL | TC | ||
| 2003–07 | <45 | 50 | 5 | 5 | 0 | 0 | 15 | 20 | 0 | 0 | 0 | 0 | 0 |
| 45–54 | 135 | 20 | 10 | 5 | 5 | 35 | 50 | 5 | 5 | 0 | 0 | 0 | |
| 55–64 | 305 | 40 | 30 | 10 | 15 | 70 | 110 | 15 | 15 | 0 | 5 | 0 | |
| 65–74 | 420 | 60 | 40 | 15 | 15 | 115 | 140 | 15 | 15 | 5 | 10 | 0 | |
| 75–84 | 520 | 70 | 40 | 20 | 20 | 165 | 165 | 15 | 20 | 0 | 10 | 0 | |
| 85+ | 270 | 35 | 25 | 10 | 10 | 80 | 85 | 5 | 10 | 0 | 5 | 0 | |
| Total | 1705 | 230 | 150 | 60 | 65 | 485 | 565 | 50 | 65 | 10 | 30 | 5 | |
| 2008–12 | <45 | 50 | 5 | 5 | 0 | 0 | 15 | 20 | 0 | 0 | 0 | 0 | 0 |
| 45–54 | 155 | 20 | 15 | 5 | 5 | 40 | 55 | 5 | 5 | 0 | 0 | 0 | |
| 55–64 | 345 | 50 | 30 | 10 | 15 | 80 | 125 | 15 | 10 | 0 | 10 | 0 | |
| 65–74 | 465 | 65 | 50 | 15 | 15 | 115 | 160 | 15 | 20 | 0 | 10 | 0 | |
| 75–84 | 555 | 70 | 50 | 20 | 20 | 170 | 180 | 15 | 20 | 5 | 10 | 0 | |
| 85+ | 325 | 45 | 25 | 10 | 10 | 105 | 105 | 10 | 15 | 0 | 5 | 0 | |
| Total | 1900 | 255 | 175 | 65 | 70 | 525 | 650 | 60 | 70 | 10 | 35 | 5 | |
| 2013–17 | <45 | 50 | 5 | 5 | 0 | 0 | 20 | 20 | 0 | 0 | 0 | 0 | 0 |
| 45–54 | 150 | 20 | 15 | 5 | 5 | 40 | 55 | 5 | 5 | 0 | 0 | 0 | |
| 55–64 | 385 | 55 | 40 | 15 | 15 | 95 | 135 | 15 | 10 | 0 | 10 | 0 | |
| 65–74 | 580 | 80 | 60 | 15 | 20 | 135 | 215 | 20 | 25 | 5 | 15 | 0 | |
| 75–84 | 585 | 75 | 55 | 20 | 20 | 170 | 195 | 15 | 25 | 5 | 10 | 0 | |
| 85+ | 400 | 50 | 35 | 10 | 15 | 135 | 130 | 10 | 15 | 0 | 5 | 0 | |
| Total | 2145 | 290 | 210 | 65 | 80 | 590 | 750 | 70 | 75 | 10 | 40 | 5 | |
| 2018–22 | <45 | 45 | 5 | 5 | 0 | 0 | 20 | 20 | 0 | 0 | 0 | 0 | 0 |
| 45–54 | 135 | 15 | 15 | 5 | 5 | 40 | 50 | 5 | 5 | 0 | 0 | 0 | |
| 55–64 | 425 | 65 | 40 | 15 | 15 | 110 | 150 | 20 | 10 | 0 | 10 | 0 | |
| 65–74 | 675 | 100 | 65 | 20 | 25 | 160 | 250 | 25 | 20 | 5 | 15 | 0 | |
| 75–84 | 680 | 90 | 70 | 20 | 25 | 185 | 235 | 20 | 30 | 5 | 10 | 0 | |
| 85+ | 460 | 60 | 45 | 15 | 15 | 145 | 160 | 10 | 15 | 5 | 5 | 0 | |
| Total | 2420 | 330 | 245 | 70 | 85 | 660 | 865 | 80 | 80 | 15 | 45 | 5 | |
| 2023–27 | <45 | 45 | 5 | 5 | 0 | 0 | 20 | 20 | 0 | 0 | 0 | 0 | 0 |
| 45–54 | 130 | 15 | 15 | 5 | 5 | 50 | 50 | 5 | 5 | 0 | 0 | 0 | |
| 55–64 | 410 | 55 | 40 | 15 | 15 | 105 | 145 | 15 | 10 | 0 | 10 | 0 | |
| 65–74 | 760 | 120 | 80 | 25 | 30 | 185 | 270 | 30 | 20 | 5 | 20 | 0 | |
| 75–84 | 865 | 115 | 90 | 20 | 30 | 230 | 315 | 25 | 35 | 5 | 15 | 0 | |
| 85+ | 490 | 65 | 50 | 15 | 15 | 150 | 175 | 10 | 15 | 5 | 5 | 0 | |
| Total | 2710 | 375 | 285 | 75 | 100 | 745 | 975 | 85 | 85 | 15 | 50 | 5 | |
| 2028–32 | <45 | 50 | 5 | 5 | 0 | 0 | 20 | 20 | 0 | 0 | 0 | 0 | 0 |
| 45–54 | 130 | 20 | 15 | 5 | 5 | 50 | 55 | 5 | 5 | 0 | 0 | 0 | |
| 55–64 | 375 | 50 | 40 | 10 | 15 | 115 | 135 | 15 | 10 | 0 | 10 | 0 | |
| 65–74 | 845 | 130 | 90 | 25 | 30 | 215 | 295 | 30 | 20 | 5 | 20 | 0 | |
| 75–84 | 1020 | 135 | 105 | 25 | 40 | 275 | 365 | 30 | 35 | 5 | 20 | 0 | |
| 85+ | 610 | 75 | 70 | 15 | 20 | 180 | 220 | 15 | 20 | 5 | 5 | 0 | |
| Total | 3030 | 420 | 330 | 80 | 115 | 855 | 1095 | 95 | 90 | 15 | 55 | 5 | |
Abbreviations: AB, Alberta; BC, British Columbia; CA, Canada; MB, Manitoba; NB, New Brunswick; NL, Newfoundland and Labrador; NS, Nova Scotia; ON, Ontario; PE, Prince Edward Island; QC, Quebec; SK, Saskatchewan; TC, All Territories (Yukon, Northwest Territories and Nunavut).
Note: 1. Totals may not add up due to rounding.
2. Bladder cancer is the only site where in-situ and malignant cases are combined in this report. Ontario has not reported in situ bladder cancer.
TABLE 4.17.3.
Observed (2003–2007) and projected age-standardized incidence rates (ASIRs) by age and province/territories combined (TC), cancer of bladder, males, Canada, 2003–2032
| Period | Age | ASIRs | |||||||||||
|---|---|---|---|---|---|---|---|---|---|---|---|---|---|
| CA | BC | AB | SK | MB | ON | QC | NB | NS | PE | NL | TC | ||
| 2003–07 | <45 | 1.0 | 1.1 | 1.1 | 0.8 | 0.7 | 0.6 | 1.7 | 1.1 | 0.9 | 1.2 | 0.8 | 0.5 |
| 45–54 | 14.7 | 13.4 | 14.2 | 15.8 | 12.3 | 10.3 | 22.0 | 22.2 | 14.0 | 23.3 | 12.7 | 7.6 | |
| 55–64 | 53.9 | 50.7 | 59.7 | 55.8 | 55.5 | 37.6 | 75.4 | 62.3 | 71.2 | 43.9 | 37.4 | 14.7 | |
| 65–74 | 136.0 | 137.0 | 147.8 | 130.8 | 133.9 | 102.1 | 178.2 | 159.8 | 160.6 | 152.3 | 135.0 | 140.9 | |
| 75–84 | 240.4 | 241.6 | 248.2 | 221.8 | 270.0 | 183.4 | 321.0 | 254.5 | 289.6 | 250.3 | 258.3 | 93.9 | |
| 85+ | 305.6 | 340.7 | 312.3 | 276.8 | 289.3 | 233.6 | 384.4 | 398.3 | 354.2 | 478.2 | 410.9 | 0.0 | |
| Total | 27.9 | 28.0 | 29.6 | 26.8 | 28.3 | 20.6 | 37.6 | 32.6 | 33.2 | 31.4 | 27.8 | 15.4 | |
| 2008–12 | <45 | 0.9 | 1.0 | 1.1 | 1.1 | 0.8 | 0.6 | 1.7 | 1.2 | 1.2 | 1.0 | 0.8 | 0.5 |
| 45–54 | 13.1 | 10.8 | 13.9 | 17.8 | 11.7 | 9.2 | 21.3 | 18.2 | 13.9 | 19.6 | 13.4 | 7.2 | |
| 55–64 | 51.7 | 46.8 | 54.8 | 56.4 | 51.2 | 36.0 | 77.4 | 62.2 | 73.2 | 28.7 | 38.4 | 28.5 | |
| 65–74 | 128.8 | 132.1 | 143.8 | 132.7 | 136.0 | 93.5 | 176.3 | 165.5 | 155.8 | 159.3 | 120.1 | 71.1 | |
| 75–84 | 235.5 | 236.5 | 257.2 | 207.7 | 257.5 | 181.5 | 316.7 | 265.4 | 294.0 | 256.4 | 275.8 | 129.9 | |
| 85+ | 307.4 | 344.3 | 313.2 | 288.4 | 303.0 | 245.6 | 393.8 | 381.6 | 367.6 | 407.7 | 307.3 | 169.6 | |
| Total | 26.9 | 26.9 | 29.2 | 26.9 | 27.8 | 19.9 | 37.5 | 32.8 | 33.6 | 29.5 | 26.5 | 14.8 | |
| 2013–17 | <45 | 0.9 | 0.9 | 1.0 | 1.1 | 0.7 | 0.5 | 1.8 | 1.2 | 1.2 | 1.0 | 0.8 | 0.5 |
| 45–54 | 12.3 | 10.5 | 12.9 | 17.5 | 10.4 | 8.5 | 21.8 | 17.3 | 15.5 | 19.6 | 13.2 | 6.8 | |
| 55–64 | 49.2 | 43.7 | 51.9 | 61.6 | 49.7 | 35.6 | 74.0 | 64.5 | 68.2 | 27.2 | 39.4 | 27.2 | |
| 65–74 | 124.3 | 122.2 | 141.0 | 128.5 | 128.3 | 88.6 | 182.1 | 158.3 | 159.6 | 92.1 | 113.1 | 68.6 | |
| 75–84 | 227.8 | 232.7 | 256.9 | 226.2 | 262.0 | 172.7 | 308.4 | 266.7 | 299.4 | 355.0 | 260.1 | 125.7 | |
| 85+ | 308.9 | 327.2 | 328.0 | 257.4 | 345.4 | 253.1 | 401.2 | 368.2 | 398.7 | 318.2 | 349.3 | 170.4 | |
| Total | 26.0 | 25.5 | 28.7 | 27.4 | 27.6 | 19.2 | 37.5 | 32.3 | 34.1 | 27.4 | 26.0 | 14.3 | |
| 2018–22 | <45 | 0.9 | 0.9 | 1.0 | 1.1 | 0.7 | 0.5 | 1.8 | 1.2 | 1.2 | 1.0 | 0.8 | 0.5 |
| 45–54 | 11.8 | 10.7 | 12.5 | 17.4 | 9.7 | 8.2 | 21.5 | 17.4 | 15.3 | 19.6 | 13.1 | 6.5 | |
| 55–64 | 45.9 | 38.1 | 51.2 | 66.3 | 46.0 | 33.5 | 72.8 | 60.0 | 63.5 | 26.2 | 40.5 | 25.3 | |
| 65–74 | 121.8 | 116.0 | 133.7 | 134.2 | 133.3 | 87.0 | 183.1 | 154.3 | 168.3 | 68.6 | 105.6 | 67.2 | |
| 75–84 | 221.6 | 219.9 | 252.6 | 224.5 | 257.4 | 166.1 | 309.1 | 269.2 | 298.8 | 312.6 | 255.3 | 122.2 | |
| 85+ | 305.0 | 335.3 | 353.2 | 275.2 | 324.1 | 241.1 | 401.3 | 377.0 | 387.8 | 383.4 | 331.9 | 168.3 | |
| Total | 25.2 | 24.3 | 28.2 | 28.3 | 27.1 | 18.5 | 37.5 | 31.9 | 34.1 | 24.9 | 25.2 | 13.9 | |
| 2023–27 | <45 | 0.9 | 0.9 | 1.0 | 1.1 | 0.7 | 0.5 | 1.8 | 1.2 | 1.2 | 1.0 | 0.8 | 0.5 |
| 45–54 | 11.4 | 10.0 | 11.7 | 17.3 | 9.4 | 7.6 | 22.8 | 17.4 | 15.3 | 19.6 | 13.0 | 6.3 | |
| 55–64 | 44.5 | 37.0 | 49.1 | 66.1 | 44.1 | 32.0 | 74.4 | 56.9 | 69.2 | 25.7 | 40.4 | 24.6 | |
| 65–74 | 118.2 | 108.8 | 131.3 | 146.1 | 134.4 | 86.8 | 175.7 | 155.8 | 156.1 | 67.5 | 108.9 | 65.2 | |
| 75–84 | 217.6 | 205.3 | 251.1 | 221.9 | 257.0 | 159.9 | 318.1 | 254.0 | 309.6 | 203.5 | 241.6 | 120.0 | |
| 85+ | 297.0 | 321.7 | 340.2 | 303.1 | 362.2 | 233.5 | 384.6 | 371.7 | 409.8 | 566.0 | 314.5 | 163.9 | |
| Total | 24.6 | 22.9 | 27.6 | 29.3 | 27.4 | 18.0 | 37.4 | 31.1 | 34.4 | 22.7 | 24.7 | 13.6 | |
| 2028–32 | <45 | 0.9 | 0.9 | 0.9 | 1.1 | 0.7 | 0.5 | 1.8 | 1.2 | 1.2 | 1.0 | 0.8 | 0.5 |
| 45–54 | 11.6 | 9.9 | 11.6 | 17.2 | 9.1 | 7.6 | 23.0 | 17.5 | 15.2 | 19.6 | 12.9 | 6.4 | |
| 55–64 | 43.6 | 38.1 | 48.8 | 65.9 | 43.0 | 31.3 | 73.3 | 57.0 | 69.0 | 25.3 | 40.3 | 24.1 | |
| 65–74 | 112.7 | 97.5 | 129.4 | 154.6 | 128.6 | 82.7 | 175.6 | 145.9 | 152.3 | 66.5 | 111.3 | 62.2 | |
| 75–84 | 215.7 | 197.2 | 240.2 | 231.6 | 270.0 | 159.1 | 318.7 | 252.0 | 323.2 | 171.5 | 230.3 | 119.0 | |
| 85+ | 292.8 | 303.0 | 344.4 | 281.6 | 335.8 | 226.2 | 398.0 | 379.7 | 393.9 | 356.7 | 319.6 | 161.5 | |
| Total | 24.0 | 21.8 | 27.0 | 30.0 | 27.0 | 17.5 | 37.5 | 30.5 | 34.4 | 19.3 | 24.5 | 13.3 | |
Abbreviations: AB, Alberta; BC, British Columbia; CA, Canada; MB, Manitoba; NB, New Brunswick; NL, Newfoundland and Labrador; NS, Nova Scotia; ON, Ontario; PE, Prince Edward Island; QC, Quebec; SK, Saskatchewan; TC, All Territories (Yukon, Northwest Territories and Nunavut).
Note: Bladder cancer is the only site where in-situ and malignant cases are combined in this report. Ontario has not reported in situ bladder cancer.
TABLE 4.17.4.
Observed (2003–2007) and projected age-standardized incidence rates (ASIRs) by age and province/territories combined (TC), cancer of bladder, females, Canada, 2003–2032
| Period | Age | ASIRs | |||||||||||
|---|---|---|---|---|---|---|---|---|---|---|---|---|---|
| CA | BC | AB | SK | MB | ON | QC | NB | NS | PE | NL | TC | ||
| 2003–07 | <45 | 0.5 | 0.4 | 0.5 | 0.7 | 0.4 | 0.4 | 0.8 | 0.5 | 0.6 | 0.4 | 0.0 | 1.0 |
| 45–54 | 5.3 | 5.3 | 4.5 | 6.3 | 5.7 | 3.6 | 7.8 | 6.2 | 7.1 | 8.9 | 5.0 | 5.7 | |
| 55–64 | 17.5 | 16.3 | 19.9 | 17.8 | 20.7 | 10.9 | 24.3 | 28.3 | 22.1 | 16.7 | 19.9 | 50.7 | |
| 65–74 | 35.1 | 37.9 | 41.8 | 40.8 | 33.7 | 24.6 | 45.0 | 46.2 | 37.4 | 48.9 | 41.9 | 28.7 | |
| 75–84 | 59.4 | 58.0 | 57.3 | 57.1 | 59.5 | 48.4 | 75.7 | 69.2 | 72.0 | 45.1 | 67.9 | 0.0 | |
| 85+ | 78.0 | 76.6 | 86.1 | 63.8 | 57.4 | 65.5 | 106.5 | 48.2 | 81.4 | 96.5 | 54.9 | 0.0 | |
| Total | 7.7 | 7.7 | 8.3 | 8.2 | 7.7 | 5.7 | 10.3 | 9.6 | 9.0 | 8.6 | 8.1 | 7.6 | |
| 2008–12 | <45 | 0.5 | 0.4 | 0.6 | 0.7 | 0.3 | 0.4 | 0.9 | 0.7 | 0.6 | 0.5 | 0.5 | 0.5 |
| 45–54 | 5.6 | 5.8 | 4.9 | 6.4 | 6.1 | 3.7 | 8.6 | 6.5 | 5.8 | 6.2 | 5.1 | 5.5 | |
| 55–64 | 16.3 | 16.1 | 16.4 | 18.6 | 17.2 | 10.2 | 24.1 | 27.7 | 16.6 | 18.0 | 22.5 | 16.0 | |
| 65–74 | 34.2 | 35.0 | 42.9 | 40.0 | 38.4 | 21.9 | 46.2 | 48.1 | 43.0 | 37.7 | 43.1 | 33.5 | |
| 75–84 | 60.8 | 58.9 | 67.1 | 60.1 | 61.3 | 47.5 | 78.5 | 69.6 | 75.3 | 66.9 | 61.4 | 59.5 | |
| 85+ | 75.1 | 74.6 | 74.4 | 63.1 | 63.4 | 64.3 | 98.9 | 70.3 | 88.2 | 82.7 | 56.8 | 73.6 | |
| Total | 7.6 | 7.5 | 8.4 | 8.3 | 7.8 | 5.4 | 10.6 | 10.1 | 9.0 | 8.4 | 8.5 | 7.5 | |
| 2013–17 | <45 | 0.5 | 0.4 | 0.6 | 0.7 | 0.3 | 0.5 | 0.9 | 0.7 | 0.6 | 0.5 | 0.5 | 0.5 |
| 45–54 | 5.4 | 4.8 | 4.6 | 6.5 | 5.9 | 3.5 | 9.1 | 6.5 | 5.8 | 5.9 | 5.1 | 5.3 | |
| 55–64 | 15.8 | 16.6 | 15.9 | 19.7 | 18.7 | 10.2 | 23.1 | 28.2 | 12.3 | 17.4 | 22.9 | 15.5 | |
| 65–74 | 34.4 | 35.0 | 41.4 | 35.9 | 36.2 | 21.1 | 50.0 | 50.2 | 41.6 | 37.9 | 43.7 | 33.7 | |
| 75–84 | 60.3 | 57.7 | 70.7 | 60.1 | 62.9 | 44.8 | 80.5 | 68.1 | 78.6 | 66.4 | 62.2 | 59.1 | |
| 85+ | 78.3 | 73.0 | 82.5 | 64.6 | 71.5 | 68.4 | 103.7 | 67.2 | 87.3 | 86.2 | 57.6 | 76.7 | |
| Total | 7.6 | 7.4 | 8.4 | 8.2 | 7.9 | 5.3 | 10.9 | 10.2 | 8.7 | 8.3 | 8.7 | 7.4 | |
| 2018–22 | <45 | 0.4 | 0.4 | 0.6 | 0.7 | 0.3 | 0.5 | 0.8 | 0.7 | 0.6 | 0.5 | 0.5 | 0.4 |
| 45–54 | 5.2 | 4.4 | 5.0 | 6.6 | 5.7 | 4.0 | 9.6 | 6.5 | 5.8 | 5.8 | 5.1 | 5.1 | |
| 55–64 | 16.1 | 17.5 | 15.6 | 17.8 | 18.2 | 10.4 | 24.1 | 28.5 | 12.4 | 17.8 | 23.1 | 15.8 | |
| 65–74 | 33.0 | 33.8 | 36.0 | 35.3 | 36.0 | 20.4 | 50.2 | 49.4 | 33.8 | 36.3 | 44.1 | 32.3 | |
| 75–84 | 60.1 | 56.4 | 75.3 | 59.1 | 67.8 | 42.7 | 81.9 | 71.3 | 79.4 | 66.2 | 62.7 | 58.9 | |
| 85+ | 81.3 | 76.2 | 91.8 | 72.4 | 73.2 | 67.4 | 112.2 | 76.5 | 86.4 | 89.6 | 58.1 | 79.6 | |
| Total | 7.5 | 7.3 | 8.3 | 8.0 | 8.0 | 5.2 | 11.2 | 10.3 | 8.1 | 8.2 | 8.7 | 7.3 | |
| 2023–27 | <45 | 0.4 | 0.4 | 0.6 | 0.7 | 0.3 | 0.5 | 0.8 | 0.7 | 0.6 | 0.5 | 0.5 | 0.4 |
| 45–54 | 5.1 | 4.4 | 4.9 | 6.7 | 5.7 | 4.8 | 9.2 | 6.5 | 5.8 | 5.6 | 5.1 | 5.0 | |
| 55–64 | 15.6 | 15.0 | 14.9 | 17.9 | 17.9 | 10.1 | 25.3 | 28.7 | 12.4 | 17.1 | 23.2 | 15.3 | |
| 65–74 | 32.6 | 35.9 | 35.6 | 35.7 | 39.3 | 20.8 | 49.0 | 49.6 | 26.3 | 35.9 | 44.3 | 31.9 | |
| 75–84 | 60.6 | 56.6 | 72.0 | 51.7 | 64.4 | 41.8 | 88.7 | 72.5 | 76.9 | 66.7 | 63.0 | 59.4 | |
| 85+ | 78.7 | 71.7 | 93.4 | 66.6 | 77.5 | 62.8 | 110.9 | 67.6 | 92.8 | 86.7 | 58.4 | 77.1 | |
| Total | 7.4 | 7.2 | 8.2 | 7.7 | 8.1 | 5.3 | 11.4 | 10.3 | 7.6 | 8.1 | 8.8 | 7.2 | |
| 2028–32 | <45 | 0.4 | 0.4 | 0.6 | 0.7 | 0.3 | 0.4 | 0.8 | 0.7 | 0.6 | 0.5 | 0.5 | 0.4 |
| 45–54 | 4.8 | 4.4 | 4.9 | 6.7 | 5.6 | 4.7 | 9.2 | 6.5 | 5.8 | 5.3 | 5.1 | 4.7 | |
| 55–64 | 15.3 | 14.0 | 15.9 | 17.9 | 17.6 | 11.4 | 26.5 | 28.8 | 12.4 | 16.9 | 23.3 | 15.0 | |
| 65–74 | 33.0 | 36.1 | 34.6 | 32.9 | 38.8 | 21.2 | 50.8 | 49.9 | 26.3 | 36.3 | 44.5 | 32.3 | |
| 75–84 | 58.0 | 54.7 | 64.2 | 52.7 | 66.8 | 40.7 | 87.4 | 71.3 | 61.3 | 63.9 | 63.3 | 56.8 | |
| 85+ | 80.4 | 72.5 | 102.6 | 68.1 | 85.8 | 61.9 | 115.1 | 77.6 | 89.8 | 88.6 | 58.7 | 78.8 | |
| Total | 7.3 | 7.1 | 8.0 | 7.6 | 8.2 | 5.3 | 11.6 | 10.4 | 7.0 | 8.0 | 8.8 | 7.1 | |
Abbreviations: AB, Alberta; BC, British Columbia; CA, Canada; MB, Manitoba; NB, New Brunswick; NL, Newfoundland and Labrador; NS, Nova Scotia; ON, Ontario; PE, Prince Edward Island; QC, Quebec; SK, Saskatchewan; TC, All Territories (Yukon, Northwest Territories and Nunavut).
Note: Bladder cancer is the only site where in-situ and malignant cases are combined in this report. Ontario has not reported in situ bladder cancer.
FIGURE 4.17.2. Age-standardized incidence rates (ASIRs) for bladder cancera by age group (– males, – females), Canada, 1983–2032.

aBladder cancer is the only site where in-situ and malignant cases are combined in this report. Ontario has not reported in situ bladder cancer.
For males, the ASIRs in all regions were relatively stable between 1988 and 2002 but displayed a downward trend in the last 10 years (Figure 4.17.1). For females, the rates in all regions remained stable. However, in the last observed decade, the rates in females increased moderately in Quebec and the Atlantic region and decreased markedly in British Columbia. During 1998–2007, bladder cancer ASIRs decreased significantly in males by 0.7% per year, and the ASIRs in females were stable, with a non-significant decrease of only 0.1% per year (Figures 3.1 and 3.2).
FIGURE 4.17.1. Age-standardized incidence rates (ASIRs) by region, bladder cancera, 1983–2032.

aBladder cancer is the only site where in-situ and malignant cases are combined in this report. Ontario has not reported in situ bladder cancer.
The rates for males are anticipated to decrease, but at different levels, in all regions (Figure 4.17.1). Female rates are projected to increase slightly in Quebec, and stabilize in the other areas. Internal ranking of the ASIRs in geographical regions is predicted to be similar for both sexes, with the highest rates in Quebec and the lowest in British Columbia. From 2003–2007 to 2028–2032, the ASIRs of bladder cancer for Canada are projected to decrease by 14% in males, from 27.9 to 24.0 per 100 000, and to drop by 6% in females, from 7.7 to 7.3 per 100 000 (Tables 4.17.3 and 4.17.4). With the aging and growth of the population, however, the annual number of new cases in males will increase by 83%, from 4815 to 8825, and in females by 78%, from 1705 to 3030 (Tables 4.17.1 and 4.17.2).
Allowing for the expected number of Ontario in situ cases, the increase for Canada as a whole from 2003–2007 to 2028–2032 would be from approximately 5510 to 10 135 cases annually in males and from 2005 to 3560 cases in females. The annual number of new Ontario cases adjusted for in situ cases would rise over this period from about 2045 to 3825 in males and from 785 to 1385 in females. The corresponding prediction for the adjusted Ontario ASIRs would be a decrease from 31.1 to 26.4 per 100 000 in males and a decrease from 9.4 to 8.8 per 100 000 in females.
Comments
For the data used in this monograph, Ontario has not reported in situ bladder cancer, resulting in the lower bladder cancer rates observed for Ontario. Ontario will start including these cases in future data releases. Based on data collected for 2000–2002 (but not included in the Ontario Registry),1 it is expected that this reporting change in Ontario will result in observed bladder cancer rates close to those of the Prairie region and British Columbia, representing an increase in Ontario cases of 52% in males and 62% in females with a similar increase in rates.
Cigarette smoking is the major and preventable risk factor for bladder cancer.47,86 Smoking accounted for about 50% of male bladder cancer cases and 30% of female bladder cancer cases in Europe.244,245 Current smokers have up to 4-fold higher risk of bladder cancer than non-smokers,246,247 with dose-response relationships for both smoking frequency and duration.86,248 As previously mentioned, reductions in smoking prevalence occurred 20 years earlier in males than in females in Canada.42,43 The impact of the reduction in tobacco consumption has been presented in the observed incidence data for males, and accordingly contributed to the predicted declining incidence trends, but has largely not yet been seen in the female trends given the lag of 20 to 30 years between the drop in smoking rates and subsequent decrease in cancer incidence rates.249 Consequently, incidence rates of bladder cancer in females are likely to begin to decrease over the longer term.
Epidemiological studies have linked bladder cancer to occupational exposures for over 100 years.248 A case-control study in Montreal reported that 6.5% of bladder cancer incidence were attributed to occupational exposures (including motor vehicle drivers, textile dyers, motor transport and aromatic amines).250 Another Canadian study found statistically significant increased risks of bladder cancer in male primary metal workers and automechanics, and female general office clerks, with a duration-response effect.251
Two pooled analyses of epidemiological studies, conducted in Canada, the US, Finland, France and Italy, found a significant association between tap water consumption and risk of bladder cancer, particularly in males.252,253 The summarized dose-response relation suggests that carcinogenic chemicals (such as chloroform and other trihalomethanes) in tap water are responsible for the increased risk.
18. Central nervous system cancers
Cancers of the brain and nervous system are referred to collectively as central nervous system (CNS) cancers. During 2003–2007, the average annual number of CNS cancers was 1365 for males and 1055 for females in Canada, making up 1.7% and 1.4% of all new male and female cancer cases, respectively (Tables 4.18.1 and 4.18.2). One in 117 Canadian males and 1 in 150 females can expect to be diagnosed with CNS cancers in their lifetime, and 1 in 165 males and 1 in 220 females are likely to die from it.1
TABLE 4.18.1.
Observed (2003–2007) and projected average annual new cases by age and province/territories combined (TC), central nervous system cancers, males, Canada, 2003–2032
| Period | Age | New cases | |||||||||||
|---|---|---|---|---|---|---|---|---|---|---|---|---|---|
| CA | BC | AB | SK | MB | ON | QC | NB | NS | PE | NL | TC | ||
| 2003–07 | <45 | 350 | 40 | 40 | 10 | 10 | 140 | 90 | 5 | 10 | 0 | 5 | 0 |
| 45–54 | 225 | 30 | 25 | 5 | 5 | 85 | 65 | 5 | 5 | 0 | 5 | 0 | |
| 55–64 | 290 | 30 | 20 | 10 | 10 | 105 | 80 | 10 | 10 | 0 | 10 | 0 | |
| 65–74 | 280 | 30 | 20 | 5 | 5 | 115 | 75 | 5 | 10 | 0 | 5 | 0 | |
| 75–84 | 180 | 25 | 15 | 5 | 5 | 70 | 50 | 5 | 5 | 0 | 0 | 0 | |
| 85+ | 40 | 5 | 5 | 0 | 0 | 15 | 15 | 0 | 0 | 0 | 0 | 0 | |
| Total | 1365 | 165 | 120 | 35 | 40 | 525 | 375 | 35 | 40 | 5 | 25 | 0 | |
| 2008–12 | <45 | 355 | 35 | 40 | 10 | 10 | 140 | 95 | 5 | 10 | 0 | 5 | 0 |
| 45–54 | 245 | 30 | 25 | 5 | 5 | 90 | 65 | 5 | 5 | 0 | 5 | 0 | |
| 55–64 | 335 | 35 | 30 | 10 | 10 | 125 | 95 | 10 | 15 | 0 | 5 | 0 | |
| 65–74 | 305 | 35 | 25 | 10 | 10 | 115 | 90 | 10 | 10 | 0 | 5 | 0 | |
| 75–84 | 205 | 25 | 15 | 5 | 5 | 80 | 65 | 5 | 5 | 0 | 0 | 0 | |
| 85+ | 55 | 5 | 5 | 0 | 0 | 20 | 20 | 0 | 0 | 0 | 0 | 0 | |
| Total | 1495 | 175 | 140 | 40 | 40 | 565 | 420 | 35 | 45 | 10 | 25 | 0 | |
| 2013–17 | <45 | 360 | 35 | 45 | 10 | 10 | 140 | 100 | 5 | 10 | 0 | 5 | 0 |
| 45–54 | 235 | 30 | 30 | 5 | 5 | 90 | 55 | 5 | 5 | 0 | 5 | 0 | |
| 55–64 | 375 | 40 | 35 | 10 | 10 | 140 | 105 | 10 | 15 | 0 | 5 | 0 | |
| 65–74 | 365 | 45 | 30 | 10 | 10 | 135 | 110 | 10 | 15 | 0 | 10 | 0 | |
| 75–84 | 225 | 30 | 15 | 5 | 5 | 85 | 70 | 5 | 5 | 0 | 0 | 0 | |
| 85+ | 65 | 10 | 5 | 0 | 0 | 25 | 25 | 0 | 0 | 0 | 0 | 0 | |
| Total | 1630 | 190 | 160 | 40 | 45 | 615 | 460 | 40 | 50 | 10 | 30 | 0 | |
| 2018–22 | <45 | 375 | 35 | 45 | 10 | 10 | 150 | 100 | 10 | 10 | 0 | 5 | 0 |
| 45–54 | 210 | 25 | 25 | 5 | 5 | 80 | 55 | 5 | 5 | 0 | 5 | 0 | |
| 55–64 | 405 | 50 | 45 | 10 | 10 | 155 | 105 | 5 | 15 | 0 | 10 | 0 | |
| 65–74 | 425 | 45 | 40 | 10 | 10 | 160 | 125 | 10 | 15 | 0 | 10 | 0 | |
| 75–84 | 260 | 35 | 20 | 5 | 5 | 95 | 80 | 5 | 10 | 0 | 5 | 0 | |
| 85+ | 80 | 10 | 5 | 0 | 0 | 30 | 30 | 0 | 0 | 0 | 0 | 0 | |
| Total | 1760 | 205 | 175 | 45 | 50 | 665 | 495 | 35 | 55 | 10 | 30 | 0 | |
| 2023–27 | <45 | 385 | 40 | 45 | 10 | 10 | 155 | 105 | 10 | 10 | 0 | 5 | 0 |
| 45–54 | 200 | 25 | 25 | 5 | 5 | 75 | 50 | 5 | 5 | 0 | 5 | 0 | |
| 55–64 | 390 | 45 | 45 | 10 | 10 | 155 | 95 | 5 | 15 | 0 | 10 | 0 | |
| 65–74 | 480 | 55 | 50 | 10 | 15 | 180 | 135 | 5 | 15 | 5 | 5 | 0 | |
| 75–84 | 320 | 40 | 25 | 10 | 10 | 115 | 100 | 5 | 10 | 0 | 5 | 0 | |
| 85+ | 90 | 10 | 5 | 0 | 0 | 30 | 30 | 0 | 0 | 0 | 0 | 0 | |
| Total | 1870 | 215 | 195 | 45 | 50 | 720 | 515 | 35 | 60 | 10 | 30 | 0 | |
| 2028–32 | <45 | 390 | 40 | 45 | 10 | 10 | 160 | 110 | 10 | 10 | 0 | 5 | 0 |
| 45–54 | 205 | 25 | 25 | 5 | 5 | 85 | 50 | 5 | 5 | 0 | 5 | 0 | |
| 55–64 | 355 | 40 | 40 | 10 | 10 | 145 | 85 | 5 | 15 | 0 | 10 | 0 | |
| 65–74 | 525 | 65 | 60 | 10 | 15 | 200 | 140 | 5 | 20 | 5 | 10 | 0 | |
| 75–84 | 380 | 45 | 35 | 10 | 10 | 140 | 115 | 5 | 15 | 0 | 5 | 0 | |
| 85+ | 110 | 15 | 10 | 5 | 5 | 35 | 40 | 0 | 0 | 0 | 0 | 0 | |
| Total | 1965 | 225 | 210 | 50 | 55 | 765 | 535 | 30 | 65 | 10 | 30 | 0 | |
Abbreviations: AB, Alberta; BC, British Columbia; CA, Canada; MB, Manitoba; NB, New Brunswick; NL, Newfoundland and Labrador; NS, Nova Scotia; ON, Ontario; PE, Prince Edward Island; QC, Quebec; SK, Saskatchewan; TC, All Territories (Yukon, Northwest Territories and Nunavut).
Note: Totals may not add up due to rounding.
TABLE 4.18.2.
Observed (2003–2007) and projected average annual new cases by age and province/territories combined (TC), central nervous system cancers, females, Canada, 2003–2032
| Period | Age | New cases | |||||||||||
|---|---|---|---|---|---|---|---|---|---|---|---|---|---|
| CA | BC | AB | SK | MB | ON | QC | NB | NS | PE | NL | TC | ||
| 2003–07 | <45 | 270 | 30 | 25 | 10 | 10 | 110 | 65 | 5 | 5 | 0 | 5 | 0 |
| 45–54 | 145 | 15 | 15 | 5 | 5 | 60 | 40 | 5 | 5 | 0 | 5 | 0 | |
| 55–64 | 190 | 20 | 15 | 5 | 5 | 75 | 55 | 5 | 5 | 0 | 5 | 0 | |
| 65–74 | 195 | 20 | 15 | 5 | 5 | 75 | 60 | 5 | 5 | 0 | 0 | 0 | |
| 75–84 | 190 | 25 | 10 | 5 | 5 | 75 | 55 | 5 | 5 | 0 | 0 | 0 | |
| 85+ | 60 | 5 | 5 | 5 | 0 | 20 | 20 | 5 | 0 | 0 | 0 | 0 | |
| Total | 1055 | 120 | 85 | 30 | 30 | 415 | 295 | 30 | 30 | 5 | 15 | 0 | |
| 2008–12 | <45 | 280 | 30 | 30 | 10 | 10 | 115 | 70 | 5 | 10 | 0 | 5 | 0 |
| 45–54 | 160 | 15 | 15 | 5 | 5 | 65 | 45 | 5 | 5 | 0 | 5 | 0 | |
| 55–64 | 225 | 25 | 20 | 5 | 5 | 80 | 60 | 5 | 10 | 0 | 5 | 0 | |
| 65–74 | 210 | 25 | 15 | 5 | 5 | 75 | 70 | 5 | 5 | 0 | 5 | 0 | |
| 75–84 | 190 | 20 | 10 | 5 | 5 | 75 | 60 | 5 | 5 | 0 | 0 | 0 | |
| 85+ | 70 | 10 | 5 | 0 | 0 | 25 | 20 | 0 | 0 | 0 | 0 | 0 | |
| Total | 1135 | 130 | 95 | 35 | 35 | 435 | 325 | 30 | 35 | 5 | 15 | 0 | |
| 2013–17 | <45 | 290 | 30 | 30 | 10 | 10 | 115 | 80 | 5 | 10 | 0 | 5 | 0 |
| 45–54 | 150 | 15 | 15 | 5 | 5 | 60 | 40 | 5 | 5 | 0 | 5 | 0 | |
| 55–64 | 255 | 30 | 25 | 10 | 10 | 95 | 70 | 5 | 5 | 0 | 5 | 0 | |
| 65–74 | 250 | 30 | 20 | 5 | 10 | 85 | 80 | 10 | 10 | 0 | 5 | 0 | |
| 75–84 | 190 | 25 | 10 | 5 | 5 | 70 | 60 | 5 | 5 | 0 | 0 | 0 | |
| 85+ | 85 | 10 | 5 | 0 | 5 | 30 | 30 | 0 | 0 | 0 | 0 | 0 | |
| Total | 1225 | 140 | 105 | 35 | 35 | 465 | 355 | 35 | 35 | 5 | 15 | 0 | |
| 2018–22 | <45 | 305 | 35 | 30 | 10 | 10 | 125 | 80 | 5 | 10 | 0 | 5 | 0 |
| 45–54 | 145 | 15 | 15 | 5 | 5 | 60 | 35 | 5 | 5 | 0 | 0 | 0 | |
| 55–64 | 275 | 30 | 25 | 10 | 10 | 105 | 75 | 5 | 5 | 0 | 5 | 0 | |
| 65–74 | 295 | 35 | 30 | 10 | 10 | 100 | 85 | 10 | 10 | 0 | 5 | 0 | |
| 75–84 | 205 | 25 | 15 | 5 | 5 | 75 | 65 | 10 | 5 | 0 | 0 | 0 | |
| 85+ | 85 | 10 | 5 | 0 | 5 | 30 | 30 | 5 | 0 | 0 | 0 | 0 | |
| Total | 1310 | 150 | 115 | 35 | 40 | 495 | 375 | 35 | 40 | 5 | 15 | 0 | |
| 2023–27 | <45 | 315 | 35 | 30 | 10 | 10 | 130 | 85 | 5 | 10 | 0 | 5 | 0 |
| 45–54 | 145 | 15 | 15 | 5 | 5 | 60 | 40 | 5 | 5 | 0 | 0 | 0 | |
| 55–64 | 260 | 30 | 20 | 10 | 10 | 100 | 70 | 5 | 5 | 0 | 5 | 0 | |
| 65–74 | 335 | 35 | 35 | 10 | 10 | 115 | 100 | 10 | 10 | 0 | 5 | 0 | |
| 75–84 | 245 | 30 | 15 | 5 | 5 | 90 | 75 | 10 | 10 | 0 | 5 | 0 | |
| 85+ | 90 | 10 | 5 | 0 | 5 | 30 | 35 | 5 | 0 | 0 | 0 | 0 | |
| Total | 1395 | 160 | 125 | 40 | 45 | 525 | 395 | 40 | 40 | 5 | 20 | 0 | |
| 2028–32 | <45 | 320 | 35 | 30 | 10 | 10 | 130 | 85 | 5 | 10 | 0 | 5 | 0 |
| 45–54 | 155 | 15 | 15 | 5 | 5 | 65 | 40 | 5 | 5 | 0 | 0 | 0 | |
| 55–64 | 250 | 25 | 25 | 5 | 5 | 100 | 60 | 5 | 5 | 0 | 5 | 0 | |
| 65–74 | 355 | 40 | 35 | 10 | 10 | 130 | 105 | 15 | 10 | 0 | 5 | 0 | |
| 75–84 | 290 | 40 | 25 | 5 | 10 | 100 | 85 | 10 | 10 | 0 | 5 | 0 | |
| 85+ | 100 | 15 | 5 | 0 | 5 | 35 | 35 | 5 | 0 | 0 | 0 | 0 | |
| Total | 1470 | 170 | 135 | 40 | 45 | 560 | 410 | 45 | 40 | 5 | 20 | 0 | |
Abbreviations: AB, Alberta; BC, British Columbia; CA, Canada; MB, Manitoba; NB, New Brunswick; NL, Newfoundland and Labrador; NS, Nova Scotia; ON, Ontario; PE, Prince Edward Island; QC, Quebec; SK, Saskatchewan; TC, All Territories (Yukon, Northwest Territories and Nunavut).
Note: Totals may not add up due to rounding.
CNS cancers have a bimodal age distribution, with one peak in the pediatric population and another, much larger, in people in their 70s. In 2003–2007, the age-specific incidence was higher during early childhood (0–4 years) than young adulthood, increased gradually to peak at age 75 to 79, and then decreased (Figure 4.18.1). CNS cancer is the second most common childhood malignancy (after leukemia), representing 20% of all cancers diagnosed in 0 to 14 year olds.254 CNS cancers are the most common cause of cancer death in children. In 2003–2007, nearly 60% of CNS cancers were diagnosed in people aged 55 and over (Tables 4.18.1 and 4.18.2). Males and females had similar rates up to their late 30s, after which the rates were higher in males and the divergence increased consistently with age (Figure 4.18.1). The 5-year relative survival rates for CNS cancers diagnosed between 2006 and 2008 were 23% for males and 28% for females.1 Survival is significantly higher in children and younger adults.36,254
FIGURE 4.18.1. Age-specific incidence rates of central nervous system cancers, Canada, 2003–2007 (from average annual counts).

The overall incidence rates of CNS cancers in males have decreased consistently since 1988–1992, but to a very small degree, while the rates in females were relatively stable until 1998–2002 and then decreased slightly (Figure 4.18.2). During 1998–2007, ASIRs of CNS cancer were stable: decreased in males by 0.4% per year and by 0.8% in females (Figures 3.1 and 3.2). When the Atlantic region is excluded, an east–west gradient in ASIRs appears in both sexes starting from 1993–1997, with the highest rates in Quebec and the lowest rates in British Columbia (Figure 4.18.2). The ASIRs in the Atlantic region, which had been in the lower regional rates, approached the national level in the last observation period (2003–2007).
FIGURE 4.18.2. Age-standardized incidence rates (ASIRs) by region, central nervous system cancers, 1983–2032.

We based the CNS cancer projections on the trends in all the observation quinquennia. This produced downward trends in the predicted rates in males in Canada and its regions, decreasing by 4% in Quebec and 9% to 20% in the other regions from 2003–2007 to 2028–2032 (Figure 4.18.2). For females, the rates are expected to be stable in Quebec and the Atlantic region, and to decrease by 8% to 13% in the other regions. For both males and females, Quebec and British Columbia will remain in their respective highest and lowest ranking in the regional rates. The overall age-specific ASIRs are expected to stabilize in the youngest age group and decrease in each of the other age groups (Figure 4.18.3).
FIGURE 4.18.3. Age-standardized incidence rates (ASIRs) for central nervous system cancers by age group (– males, – females), Canada, 1983–2032.

From 2003–2007 to 2028–2032, the ASIRs of CNS cancers are expected to decrease by 10% in males, from 7.9 to 7.1 per 100 000, and decrease by 8% in females, from 5.6 to 5.2 per 100 000 (Tables 4.18.3 and 4.18.4). Nevertheless, the aging and growth of the population means that the annual number of male cases is projected to rise by 44%, from 1365 to 1965, and the number of female cases, by 40%, from 1055 to 1470 (Tables 4.18.1 and 4.18.2).
TABLE 4.18.3.
Observed (2003–2007) and projected age-standardized incidence rates (ASIRs) by age and province/territories combined (TC), central nervous system cancers, males, Canada, 2003–2032
| Period | Age | ASIRs | |||||||||||
|---|---|---|---|---|---|---|---|---|---|---|---|---|---|
| CA | BC | AB | SK | MB | ON | QC | NB | NS | PE | NL | TC | ||
| 2003–07 | <45 | 3.5 | 3.0 | 3.4 | 2.8 | 3.1 | 3.5 | 3.9 | 3.0 | 3.7 | 4.5 | 3.6 | 2.9 |
| 45–54 | 9.2 | 9.0 | 9.2 | 6.5 | 6.8 | 9.0 | 10.4 | 9.2 | 9.9 | 9.4 | 6.8 | 0.0 | |
| 55–64 | 16.7 | 13.6 | 14.3 | 18.1 | 13.4 | 16.5 | 18.4 | 18.4 | 20.0 | 19.7 | 26.8 | 7.3 | |
| 65–74 | 26.0 | 21.0 | 23.0 | 21.6 | 19.0 | 27.8 | 29.0 | 26.5 | 22.3 | 39.3 | 25.5 | 10.9 | |
| 75–84 | 29.1 | 27.9 | 24.6 | 24.5 | 23.8 | 29.9 | 34.1 | 29.5 | 21.5 | 22.2 | 14.5 | 0.0 | |
| 85+ | 27.7 | 25.6 | 23.2 | 16.0 | 22.3 | 23.0 | 44.2 | 43.7 | 14.9 | 26.6 | 17.9 | 0.0 | |
| Total | 7.9 | 6.9 | 7.3 | 6.7 | 6.4 | 8.0 | 9.0 | 7.9 | 7.8 | 9.6 | 8.0 | 3.4 | |
| 2008–12 | <45 | 3.6 | 2.9 | 3.4 | 3.0 | 3.0 | 3.6 | 4.2 | 3.2 | 3.8 | 4.3 | 3.6 | 1.6 |
| 45–54 | 9.0 | 9.0 | 9.5 | 8.0 | 7.3 | 8.5 | 9.7 | 7.2 | 9.2 | 10.9 | 14.1 | 3.9 | |
| 55–64 | 16.1 | 12.4 | 14.4 | 13.9 | 14.1 | 16.6 | 18.2 | 17.3 | 20.0 | 19.5 | 19.1 | 7.1 | |
| 65–74 | 24.6 | 21.2 | 23.1 | 21.5 | 18.3 | 24.3 | 28.2 | 29.3 | 25.1 | 29.8 | 28.1 | 10.8 | |
| 75–84 | 29.8 | 26.7 | 23.6 | 24.5 | 20.4 | 29.1 | 37.6 | 33.2 | 27.7 | 36.1 | 22.3 | 13.1 | |
| 85+ | 26.0 | 21.7 | 21.1 | 25.3 | 18.0 | 22.4 | 41.6 | 29.8 | 16.1 | 31.5 | 11.3 | 11.4 | |
| Total | 7.8 | 6.6 | 7.2 | 6.8 | 6.2 | 7.7 | 9.2 | 8.0 | 8.2 | 9.5 | 8.5 | 3.4 | |
| 2013–17 | <45 | 3.5 | 2.7 | 3.4 | 3.0 | 2.9 | 3.5 | 4.3 | 3.5 | 3.9 | 4.3 | 3.6 | 1.5 |
| 45–54 | 8.7 | 8.4 | 9.5 | 8.8 | 7.1 | 8.3 | 9.5 | 8.5 | 9.4 | 10.6 | 16.8 | 3.8 | |
| 55–64 | 15.8 | 12.9 | 14.4 | 12.3 | 13.7 | 16.0 | 18.1 | 13.6 | 20.4 | 19.2 | 18.7 | 6.9 | |
| 65–74 | 23.5 | 19.6 | 22.1 | 20.7 | 17.9 | 23.1 | 27.7 | 24.1 | 25.5 | 28.5 | 30.7 | 10.3 | |
| 75–84 | 29.5 | 24.7 | 25.2 | 24.3 | 19.9 | 28.8 | 37.1 | 34.3 | 28.2 | 35.8 | 19.5 | 13.0 | |
| 85+ | 25.1 | 22.3 | 20.1 | 17.8 | 17.5 | 21.6 | 39.7 | 29.5 | 16.4 | 30.5 | 11.2 | 11.0 | |
| Total | 7.7 | 6.3 | 7.2 | 6.6 | 6.0 | 7.5 | 9.2 | 7.7 | 8.4 | 9.3 | 8.8 | 3.4 | |
| 2018–22 | <45 | 3.5 | 2.6 | 3.3 | 3.0 | 2.8 | 3.5 | 4.3 | 3.8 | 3.9 | 4.2 | 3.6 | 1.5 |
| 45–54 | 8.5 | 7.4 | 8.8 | 8.7 | 6.9 | 8.0 | 9.8 | 10.5 | 9.6 | 10.3 | 19.0 | 3.7 | |
| 55–64 | 15.6 | 13.8 | 15.6 | 12.7 | 13.4 | 15.4 | 17.3 | 8.3 | 20.6 | 18.9 | 22.7 | 6.8 | |
| 65–74 | 22.6 | 17.1 | 22.1 | 18.3 | 17.5 | 22.7 | 27.3 | 21.0 | 25.8 | 27.4 | 22.8 | 9.9 | |
| 75–84 | 28.2 | 24.7 | 26.0 | 25.4 | 19.5 | 26.9 | 35.2 | 28.1 | 28.5 | 34.2 | 20.2 | 12.4 | |
| 85+ | 25.2 | 21.3 | 17.8 | 20.3 | 17.2 | 22.0 | 39.6 | 30.1 | 16.6 | 30.5 | 11.4 | 11.1 | |
| Total | 7.5 | 6.1 | 7.2 | 6.5 | 5.9 | 7.4 | 9.1 | 7.2 | 8.5 | 9.1 | 8.9 | 3.3 | |
| 2023–27 | <45 | 3.5 | 2.5 | 3.2 | 3.0 | 2.8 | 3.5 | 4.4 | 3.9 | 4.0 | 4.2 | 3.6 | 1.5 |
| 45–54 | 8.0 | 7.0 | 8.5 | 8.7 | 6.8 | 7.7 | 9.3 | 11.5 | 9.6 | 9.7 | 20.2 | 3.5 | |
| 55–64 | 15.1 | 13.0 | 15.7 | 13.9 | 13.3 | 15.1 | 16.3 | 8.0 | 20.8 | 18.3 | 24.9 | 6.6 | |
| 65–74 | 22.1 | 18.1 | 21.9 | 16.5 | 17.4 | 22.0 | 26.4 | 13.0 | 25.9 | 26.8 | 18.6 | 9.7 | |
| 75–84 | 26.8 | 22.3 | 24.7 | 24.1 | 19.4 | 25.7 | 33.8 | 19.4 | 28.7 | 32.5 | 17.1 | 11.8 | |
| 85+ | 24.5 | 19.2 | 21.4 | 18.7 | 17.0 | 21.5 | 37.6 | 25.1 | 16.7 | 29.7 | 6.6 | 10.7 | |
| Total | 7.3 | 5.8 | 7.1 | 6.4 | 5.8 | 7.2 | 8.8 | 6.5 | 8.5 | 8.8 | 8.7 | 3.2 | |
| 2028–32 | <45 | 3.5 | 2.5 | 3.2 | 3.0 | 2.7 | 3.4 | 4.5 | 4.1 | 4.0 | 4.2 | 3.6 | 1.5 |
| 45–54 | 7.6 | 6.1 | 7.8 | 8.7 | 6.8 | 8.1 | 8.1 | 12.7 | 9.7 | 9.3 | 21.5 | 3.4 | |
| 55–64 | 14.6 | 11.6 | 14.5 | 13.9 | 13.2 | 14.6 | 16.6 | 8.9 | 20.9 | 17.7 | 27.3 | 6.4 | |
| 65–74 | 21.7 | 18.9 | 23.7 | 17.3 | 17.2 | 21.3 | 24.9 | 7.6 | 26.1 | 26.3 | 20.5 | 9.5 | |
| 75–84 | 25.8 | 19.8 | 24.7 | 21.6 | 19.2 | 25.4 | 33.0 | 15.3 | 28.8 | 31.3 | 10.6 | 11.3 | |
| 85+ | 23.0 | 20.5 | 20.0 | 21.2 | 16.9 | 19.4 | 35.0 | 16.8 | 16.8 | 27.9 | 7.9 | 10.1 | |
| Total | 7.1 | 5.6 | 7.0 | 6.4 | 5.8 | 7.1 | 8.7 | 6.2 | 8.6 | 8.6 | 9.0 | 3.1 | |
Abbreviations: AB, Alberta; BC, British Columbia; CA, Canada; MB, Manitoba; NB, New Brunswick; NL, Newfoundland and Labrador; NS, Nova Scotia; ON, Ontario; PE, Prince Edward Island; QC, Quebec; SK, Saskatchewan; TC, All Territories (Yukon, Northwest Territories and Nunavut).
TABLE 4.18.4.
Observed (2003–2007) and projected age-standardized incidence rates (ASIRs) by age and province/territories combined (TC), central nervous system cancers, females, Canada, 2003–2032
| Period | Age | ASIRs | |||||||||||
|---|---|---|---|---|---|---|---|---|---|---|---|---|---|
| CA | BC | AB | SK | MB | ON | QC | NB | NS | PE | NL | TC | ||
| 2003–07 | <45 | 2.8 | 2.4 | 2.5 | 2.7 | 2.5 | 2.9 | 3.1 | 3.3 | 2.6 | 2.9 | 2.4 | 1.4 |
| 45–54 | 5.8 | 4.3 | 5.5 | 4.9 | 5.3 | 6.4 | 6.2 | 4.6 | 4.8 | 2.0 | 8.3 | 2.8 | |
| 55–64 | 10.8 | 9.2 | 9.0 | 11.5 | 8.9 | 11.1 | 11.9 | 11.8 | 10.2 | 15.1 | 12.0 | 7.1 | |
| 65–74 | 16.5 | 13.8 | 15.1 | 14.9 | 15.7 | 16.0 | 19.9 | 16.3 | 15.5 | 18.6 | 9.3 | 0.0 | |
| 75–84 | 22.1 | 19.9 | 15.6 | 20.0 | 14.7 | 22.3 | 26.3 | 24.6 | 22.4 | 29.8 | 17.7 | 0.0 | |
| 85+ | 17.9 | 12.9 | 15.3 | 16.6 | 12.5 | 17.7 | 23.1 | 31.4 | 19.2 | 10.7 | 0.0 | 0.0 | |
| Total | 5.6 | 4.7 | 4.9 | 5.3 | 4.8 | 5.7 | 6.4 | 6.1 | 5.3 | 6.0 | 4.9 | 1.9 | |
| 2008–12 | <45 | 2.9 | 2.4 | 2.5 | 2.9 | 2.4 | 3.0 | 3.4 | 3.3 | 3.2 | 3.1 | 2.5 | 1.0 |
| 45–54 | 5.8 | 4.5 | 4.9 | 5.4 | 5.1 | 6.1 | 6.7 | 5.1 | 3.7 | 6.2 | 6.3 | 2.0 | |
| 55–64 | 10.5 | 9.1 | 10.2 | 11.8 | 9.5 | 10.2 | 11.4 | 11.5 | 12.3 | 11.3 | 11.6 | 3.6 | |
| 65–74 | 15.7 | 13.7 | 14.1 | 15.9 | 14.6 | 14.6 | 19.8 | 19.7 | 14.5 | 16.9 | 13.5 | 5.5 | |
| 75–84 | 20.9 | 17.4 | 16.0 | 15.9 | 15.9 | 21.3 | 25.3 | 26.6 | 20.7 | 22.6 | 12.5 | 7.3 | |
| 85+ | 16.4 | 15.0 | 13.3 | 11.3 | 12.5 | 15.9 | 20.6 | 18.3 | 16.9 | 17.8 | 4.8 | 5.7 | |
| Total | 5.5 | 4.7 | 4.8 | 5.4 | 4.7 | 5.5 | 6.5 | 6.3 | 5.6 | 6.0 | 4.8 | 1.9 | |
| 2013–17 | <45 | 2.9 | 2.4 | 2.4 | 2.9 | 2.4 | 2.9 | 3.6 | 3.3 | 3.2 | 3.2 | 2.4 | 1.0 |
| 45–54 | 5.7 | 4.6 | 4.7 | 5.3 | 5.0 | 5.9 | 6.6 | 5.1 | 4.8 | 6.1 | 6.1 | 2.0 | |
| 55–64 | 10.5 | 8.4 | 10.7 | 11.7 | 9.4 | 10.2 | 12.0 | 11.7 | 9.2 | 11.4 | 11.2 | 3.7 | |
| 65–74 | 14.7 | 12.8 | 13.8 | 15.8 | 14.4 | 13.6 | 18.2 | 20.2 | 15.5 | 15.9 | 13.0 | 5.1 | |
| 75–84 | 19.8 | 18.1 | 15.0 | 15.7 | 15.8 | 19.1 | 24.8 | 27.2 | 21.6 | 21.4 | 12.1 | 6.9 | |
| 85+ | 17.0 | 12.9 | 13.2 | 11.1 | 12.3 | 15.9 | 25.3 | 18.7 | 11.6 | 18.4 | 4.6 | 5.9 | |
| Total | 5.4 | 4.6 | 4.7 | 5.3 | 4.7 | 5.3 | 6.6 | 6.4 | 5.5 | 5.9 | 4.6 | 1.9 | |
| 2018–22 | <45 | 2.9 | 2.4 | 2.4 | 2.9 | 2.4 | 2.9 | 3.6 | 3.3 | 3.2 | 3.2 | 2.3 | 1.0 |
| 45–54 | 5.8 | 4.3 | 5.1 | 5.3 | 4.9 | 5.9 | 6.7 | 5.1 | 4.8 | 6.2 | 6.0 | 2.0 | |
| 55–64 | 10.3 | 8.0 | 9.0 | 11.6 | 9.3 | 10.2 | 12.4 | 11.8 | 7.7 | 11.1 | 10.9 | 3.6 | |
| 65–74 | 14.4 | 12.2 | 15.2 | 15.7 | 14.3 | 12.8 | 17.6 | 20.5 | 17.9 | 15.5 | 12.8 | 5.0 | |
| 75–84 | 18.4 | 17.2 | 14.1 | 15.6 | 15.6 | 17.2 | 23.6 | 27.7 | 18.5 | 19.9 | 11.8 | 6.4 | |
| 85+ | 15.1 | 13.0 | 12.2 | 11.1 | 12.2 | 14.2 | 20.2 | 19.1 | 13.3 | 16.3 | 4.5 | 5.3 | |
| Total | 5.3 | 4.4 | 4.6 | 5.3 | 4.6 | 5.2 | 6.6 | 6.4 | 5.4 | 5.8 | 4.5 | 1.9 | |
| 2023–27 | <45 | 2.9 | 2.4 | 2.3 | 2.9 | 2.4 | 3.0 | 3.6 | 3.3 | 3.2 | 3.2 | 2.3 | 1.0 |
| 45–54 | 5.6 | 3.7 | 4.9 | 5.3 | 4.9 | 5.7 | 7.0 | 5.1 | 4.8 | 6.1 | 5.9 | 2.0 | |
| 55–64 | 10.0 | 8.1 | 8.6 | 11.6 | 9.3 | 9.7 | 11.9 | 11.9 | 9.4 | 10.9 | 10.8 | 3.5 | |
| 65–74 | 14.4 | 11.2 | 15.4 | 15.6 | 14.2 | 13.0 | 17.9 | 20.7 | 13.0 | 15.5 | 12.6 | 5.0 | |
| 75–84 | 17.3 | 16.1 | 13.7 | 15.5 | 15.6 | 16.3 | 21.3 | 27.9 | 20.4 | 18.7 | 11.7 | 6.0 | |
| 85+ | 14.7 | 13.6 | 11.2 | 11.0 | 12.2 | 12.7 | 21.7 | 19.2 | 13.1 | 15.8 | 4.4 | 5.1 | |
| Total | 5.2 | 4.2 | 4.5 | 5.3 | 4.6 | 5.1 | 6.5 | 6.4 | 5.3 | 5.7 | 4.5 | 1.8 | |
| 2028–32 | <45 | 2.9 | 2.4 | 2.2 | 2.9 | 2.4 | 2.9 | 3.7 | 3.3 | 3.2 | 3.1 | 2.2 | 1.0 |
| 45–54 | 5.7 | 3.8 | 4.9 | 5.3 | 4.9 | 6.0 | 6.7 | 5.1 | 4.9 | 6.2 | 5.8 | 2.0 | |
| 55–64 | 10.1 | 7.5 | 9.2 | 11.5 | 9.2 | 9.8 | 11.9 | 11.9 | 9.4 | 11.0 | 10.7 | 3.5 | |
| 65–74 | 13.9 | 10.6 | 13.1 | 15.6 | 14.2 | 12.8 | 18.3 | 20.9 | 11.6 | 15.0 | 12.5 | 4.8 | |
| 75–84 | 16.9 | 15.1 | 15.4 | 15.5 | 15.5 | 15.3 | 20.6 | 28.1 | 22.9 | 18.2 | 11.6 | 5.9 | |
| 85+ | 13.1 | 12.0 | 10.5 | 11.0 | 12.1 | 11.4 | 18.7 | 19.4 | 9.9 | 14.2 | 4.3 | 4.6 | |
| Total | 5.2 | 4.1 | 4.4 | 5.3 | 4.6 | 5.0 | 6.5 | 6.5 | 5.3 | 5.6 | 4.4 | 1.8 | |
Abbreviations: AB, Alberta; BC, British Columbia; CA, Canada; MB, Manitoba; NB, New Brunswick; NL, Newfoundland and Labrador; NS, Nova Scotia; ON, Ontario; PE, Prince Edward Island; QC, Quebec; SK, Saskatchewan; TC, All Territories (Yukon, Northwest Territories and Nunavut).
Comments
Investigators have suggested that the increase in CNS cancer rates in people aged 75 or older in the observed periods until 1998–2002 was due to improved diagnostic techniques.255 X-radiation and gamma-radiation are the only established risk factors for CNS cancers, according to IARC.47 This conclusion was mainly based on studies of atomic bomb survivors and of patients with radiation diagnosis and treatment. IARC classifies radiofrequency non-ionizing radiation from telecommunications as a possible cause of CNS cancers, with limited evidence.47,86 Genetic and hereditary conditions are also linked to an increased risk. Having a parent with the disease confers a 1.7-fold increased risk, and having an affected sibling doubles the risk.256
19. Thyroid cancer
The average annual number of thyroid cancer in 2003–2007 was 795 in males and 2810 in females, representing 1.0% and 3.8% of all new Canadian male and female cancer cases, respectively (Tables 4.19.1 and 4.19.2). Whereas incidence rates for all cancers combined and for most specific types of cancer in Canada are stable or decreasing, thyroid cancer rates are rising significantly in both sexes. Though relatively uncommon in Canada, thyroid cancer is the most rapidly increasing of all cancers in both sexes. This increase has been particularly rapid in females over the past 25 years, such that thyroid cancer was the sixth most common cancer in females in Canada during the last observation period (2003–2007) (Table 4.19.3 and 4.19.4). Over the entire observation period, Ontario experienced the fastest growth in rates, British Columbia had the slowest linear increase, and other regions had similar moderate increases in between (Figure 4.19.1).
TABLE 4.19.1.
Observed (2003–2007) and projected average annual new cases by age and province/territories combined (TC), cancer of thyroid, males, Canada, 2003–2032
| Period | Age | New cases | |||||||||||
|---|---|---|---|---|---|---|---|---|---|---|---|---|---|
| CA | BC | AB | SK | MB | ON | QC | NB | NS | PE | NL | TC | ||
| 2003–07 | <45 | 255 | 20 | 25 | 5 | 5 | 130 | 50 | 5 | 5 | 0 | 0 | 0 |
| 45–54 | 190 | 15 | 20 | 5 | 5 | 95 | 40 | 5 | 5 | 0 | 5 | 0 | |
| 55–64 | 175 | 15 | 15 | 5 | 5 | 80 | 45 | 5 | 5 | 0 | 5 | 0 | |
| 65–74 | 115 | 10 | 10 | 0 | 5 | 50 | 25 | 5 | 5 | 0 | 0 | 0 | |
| 75–84 | 50 | 5 | 5 | 0 | 0 | 20 | 10 | 0 | 5 | 0 | 0 | 0 | |
| 85+ | 5 | 0 | 0 | 0 | 0 | 5 | 0 | 0 | 0 | 0 | 0 | 0 | |
| Total | 795 | 60 | 75 | 15 | 20 | 380 | 180 | 20 | 25 | 5 | 10 | 0 | |
| 2008–12 | <45 | 295 | 20 | 30 | 5 | 5 | 150 | 60 | 5 | 5 | 0 | 0 | 0 |
| 45–54 | 245 | 15 | 25 | 5 | 5 | 125 | 50 | 5 | 5 | 0 | 5 | 0 | |
| 55–64 | 240 | 15 | 25 | 5 | 5 | 120 | 60 | 5 | 5 | 0 | 5 | 0 | |
| 65–74 | 170 | 15 | 15 | 5 | 5 | 80 | 45 | 5 | 5 | 0 | 5 | 0 | |
| 75–84 | 75 | 5 | 5 | 0 | 0 | 30 | 20 | 0 | 0 | 0 | 0 | 0 | |
| 85+ | 15 | 0 | 0 | 0 | 0 | 10 | 5 | 0 | 0 | 0 | 0 | 0 | |
| Total | 1035 | 75 | 100 | 15 | 20 | 515 | 240 | 30 | 30 | 5 | 15 | 0 | |
| 2013–17 | <45 | 320 | 20 | 25 | 5 | 5 | 175 | 70 | 10 | 5 | 0 | 0 | 0 |
| 45–54 | 275 | 15 | 30 | 5 | 5 | 145 | 60 | 5 | 5 | 0 | 5 | 0 | |
| 55–64 | 320 | 20 | 30 | 5 | 5 | 170 | 75 | 10 | 10 | 0 | 5 | 0 | |
| 65–74 | 255 | 15 | 20 | 5 | 5 | 125 | 65 | 10 | 10 | 0 | 5 | 0 | |
| 75–84 | 95 | 10 | 10 | 0 | 0 | 40 | 25 | 5 | 5 | 0 | 0 | 0 | |
| 85+ | 20 | 0 | 0 | 0 | 0 | 10 | 5 | 0 | 0 | 0 | 0 | 0 | |
| Total | 1290 | 85 | 120 | 15 | 25 | 665 | 300 | 35 | 35 | 5 | 15 | 0 | |
| 2018–22 | <45 | 335 | 25 | 25 | 5 | 5 | 190 | 70 | 10 | 10 | 0 | 0 | 0 |
| 45–54 | 290 | 20 | 30 | 5 | 5 | 145 | 70 | 10 | 5 | 0 | 0 | 0 | |
| 55–64 | 395 | 20 | 40 | 5 | 5 | 210 | 95 | 5 | 10 | 0 | 5 | 0 | |
| 65–74 | 340 | 20 | 35 | 5 | 5 | 175 | 85 | 10 | 10 | 0 | 5 | 0 | |
| 75–84 | 135 | 10 | 15 | 0 | 0 | 60 | 40 | 5 | 5 | 0 | 0 | 0 | |
| 85+ | 30 | 0 | 0 | 0 | 0 | 15 | 5 | 0 | 0 | 0 | 0 | 0 | |
| Total | 1525 | 95 | 145 | 15 | 25 | 800 | 365 | 40 | 40 | 5 | 15 | 0 | |
| 2023–27 | <45 | 325 | 25 | 25 | 5 | 10 | 190 | 65 | 10 | 10 | 0 | 0 | 0 |
| 45–54 | 305 | 15 | 25 | 5 | 5 | 160 | 75 | 10 | 5 | 0 | 0 | 0 | |
| 55–64 | 420 | 20 | 50 | 5 | 5 | 220 | 105 | 5 | 10 | 0 | 5 | 0 | |
| 65–74 | 425 | 20 | 45 | 5 | 5 | 230 | 105 | 10 | 15 | 0 | 5 | 0 | |
| 75–84 | 195 | 15 | 20 | 0 | 0 | 90 | 60 | 5 | 5 | 0 | 5 | 0 | |
| 85+ | 40 | 0 | 5 | 0 | 0 | 20 | 10 | 0 | 0 | 0 | 0 | 0 | |
| Total | 1710 | 100 | 170 | 15 | 25 | 905 | 425 | 40 | 45 | 5 | 10 | 0 | |
| 2028–32 | <45 | 330 | 25 | 25 | 5 | 10 | 205 | 65 | 15 | 10 | 0 | 0 | 0 |
| 45–54 | 310 | 15 | 25 | 5 | 5 | 160 | 75 | 10 | 5 | 0 | 0 | 0 | |
| 55–64 | 425 | 20 | 45 | 5 | 5 | 215 | 115 | 5 | 10 | 0 | 0 | 0 | |
| 65–74 | 510 | 25 | 55 | 5 | 5 | 275 | 135 | 5 | 15 | 0 | 5 | 0 | |
| 75–84 | 255 | 15 | 30 | 0 | 0 | 125 | 75 | 5 | 5 | 0 | 0 | 0 | |
| 85+ | 60 | 5 | 5 | 0 | 0 | 35 | 15 | 0 | 0 | 0 | 0 | 0 | |
| Total | 1895 | 105 | 190 | 20 | 25 | 1010 | 485 | 45 | 50 | 5 | 10 | 0 | |
Abbreviations: AB, Alberta; BC, British Columbia; CA, Canada; MB, Manitoba; NB, New Brunswick; NL, Newfoundland and Labrador; NS, Nova Scotia; ON, Ontario; PE, Prince Edward Island; QC, Quebec; SK, Saskatchewan; TC, All Territories (Yukon, Northwest Territories and Nunavut).
Note: Totals may not add up due to rounding.
TABLE 4.19.2.
Observed (2003–2007) and projected average annual new cases by age and province/territories combined (TC), cancer of thyroid, females, Canada, 2003–2032
| Period | Age | New cases | |||||||||||
|---|---|---|---|---|---|---|---|---|---|---|---|---|---|
| CA | BC | AB | SK | MB | ON | QC | NB | NS | PE | NL | TC | ||
| 2003–07 | <45 | 1225 | 80 | 125 | 15 | 30 | 670 | 240 | 30 | 25 | 0 | 10 | 0 |
| 45–54 | 695 | 45 | 65 | 10 | 15 | 360 | 155 | 20 | 15 | 0 | 10 | 0 | |
| 55–64 | 470 | 30 | 35 | 10 | 10 | 240 | 110 | 15 | 10 | 0 | 10 | 0 | |
| 65–74 | 250 | 15 | 20 | 5 | 5 | 125 | 70 | 5 | 5 | 0 | 5 | 0 | |
| 75–84 | 130 | 15 | 10 | 5 | 5 | 55 | 35 | 5 | 5 | 0 | 5 | 0 | |
| 85+ | 35 | 5 | 5 | 0 | 0 | 10 | 10 | 0 | 0 | 0 | 0 | 0 | |
| Total | 2810 | 185 | 260 | 45 | 60 | 1460 | 615 | 75 | 65 | 5 | 35 | 5 | |
| 2008–12 | <45 | 1440 | 90 | 150 | 20 | 30 | 785 | 285 | 35 | 35 | 0 | 15 | 5 |
| 45–54 | 985 | 55 | 90 | 10 | 20 | 550 | 210 | 35 | 20 | 0 | 10 | 0 | |
| 55–64 | 755 | 40 | 60 | 10 | 15 | 410 | 175 | 20 | 15 | 0 | 15 | 0 | |
| 65–74 | 385 | 20 | 30 | 5 | 5 | 195 | 100 | 10 | 10 | 0 | 5 | 0 | |
| 75–84 | 180 | 15 | 10 | 5 | 5 | 80 | 50 | 10 | 5 | 0 | 5 | 0 | |
| 85+ | 55 | 5 | 5 | 0 | 0 | 20 | 15 | 0 | 0 | 0 | 0 | 0 | |
| Total | 3805 | 230 | 345 | 50 | 75 | 2045 | 830 | 110 | 85 | 5 | 50 | 5 | |
| 2013–17 | <45 | 1570 | 100 | 155 | 20 | 40 | 860 | 310 | 45 | 40 | 0 | 15 | 5 |
| 45–54 | 1230 | 65 | 110 | 10 | 20 | 725 | 245 | 40 | 20 | 0 | 10 | 0 | |
| 55–64 | 1065 | 55 | 85 | 10 | 15 | 600 | 250 | 25 | 20 | 0 | 15 | 0 | |
| 65–74 | 610 | 30 | 45 | 5 | 10 | 325 | 155 | 20 | 15 | 0 | 10 | 0 | |
| 75–84 | 245 | 15 | 15 | 5 | 5 | 115 | 65 | 10 | 5 | 0 | 5 | 0 | |
| 85+ | 75 | 5 | 10 | 0 | 0 | 30 | 20 | 5 | 0 | 0 | 0 | 0 | |
| Total | 4800 | 270 | 420 | 55 | 90 | 2655 | 1045 | 150 | 105 | 5 | 60 | 5 | |
| 2018–22 | <45 | 1620 | 100 | 155 | 20 | 40 | 900 | 320 | 50 | 40 | 5 | 20 | 5 |
| 45–54 | 1320 | 70 | 120 | 10 | 20 | 780 | 260 | 50 | 20 | 0 | 15 | 0 | |
| 55–64 | 1385 | 65 | 110 | 15 | 20 | 815 | 315 | 40 | 25 | 0 | 15 | 0 | |
| 65–74 | 895 | 45 | 65 | 10 | 15 | 500 | 225 | 25 | 20 | 0 | 10 | 0 | |
| 75–84 | 345 | 20 | 25 | 5 | 5 | 170 | 90 | 20 | 10 | 0 | 5 | 0 | |
| 85+ | 100 | 5 | 10 | 0 | 0 | 45 | 30 | 5 | 0 | 0 | 0 | 0 | |
| Total | 5670 | 300 | 485 | 60 | 100 | 3205 | 1240 | 185 | 115 | 5 | 65 | 10 | |
| 2023–27 | <45 | 1570 | 90 | 145 | 20 | 45 | 890 | 295 | 55 | 45 | 5 | 20 | 5 |
| 45–54 | 1355 | 75 | 120 | 10 | 25 | 780 | 280 | 55 | 20 | 0 | 15 | 0 | |
| 55–64 | 1580 | 70 | 125 | 10 | 20 | 970 | 340 | 45 | 20 | 0 | 15 | 0 | |
| 65–74 | 1165 | 50 | 90 | 10 | 15 | 660 | 290 | 35 | 20 | 0 | 10 | 0 | |
| 75–84 | 510 | 25 | 30 | 5 | 10 | 260 | 135 | 25 | 10 | 0 | 10 | 0 | |
| 85+ | 135 | 5 | 15 | 0 | 0 | 60 | 40 | 5 | 5 | 0 | 0 | 0 | |
| Total | 6315 | 325 | 530 | 65 | 115 | 3620 | 1385 | 215 | 120 | 10 | 70 | 10 | |
| 2028–32 | <45 | 1520 | 80 | 130 | 20 | 45 | 875 | 290 | 55 | 50 | 5 | 20 | 5 |
| 45–54 | 1395 | 85 | 130 | 10 | 30 | 800 | 285 | 60 | 20 | 0 | 15 | 0 | |
| 55–64 | 1630 | 75 | 130 | 10 | 20 | 1000 | 345 | 50 | 20 | 0 | 15 | 0 | |
| 65–74 | 1455 | 60 | 110 | 10 | 15 | 860 | 360 | 45 | 20 | 0 | 10 | 0 | |
| 75–84 | 725 | 40 | 45 | 10 | 10 | 385 | 185 | 30 | 15 | 0 | 10 | 0 | |
| 85+ | 185 | 10 | 20 | 5 | 5 | 85 | 55 | 10 | 5 | 0 | 0 | 0 | |
| Total | 6910 | 345 | 565 | 65 | 125 | 4005 | 1515 | 250 | 125 | 10 | 70 | 10 | |
Abbreviations: AB, Alberta; BC, British Columbia; CA, Canada; MB, Manitoba; NB, New Brunswick; NL, Newfoundland and Labrador; NS, Nova Scotia; ON, Ontario; PE, Prince Edward Island; QC, Quebec; SK, Saskatchewan; TC, All Territories (Yukon, Northwest Territories and Nunavut).
Note: Totals may not add up due to rounding.
TABLE 4.19.3.
Observed (2003–2007) and projected age-standardized incidence rates (ASIRs) by age and province/territories combined (TC), cancer of thyroid, males, Canada, 2003–2032
| Period | Age | ASIRs | ||||||||||||||
|---|---|---|---|---|---|---|---|---|---|---|---|---|---|---|---|---|
| CA | BC | AB | SK | MB | ON | QC | NB | NS | PE | NL | TC | |||||
| 2003–07 | <45 | 2.5 | 1.4 | 2.3 | 1.4 | 1.8 | 3.3 | 2.2 | 2.1 | 2.1 | 5.5 | 1.2 | 2.1 | |||
| 45–54 | 7.7 | 4.3 | 7.0 | 4.6 | 4.9 | 10.2 | 6.8 | 10.7 | 7.7 | 6.4 | 6.4 | 0.0 | ||||
| 55–64 | 10.0 | 5.4 | 9.6 | 6.5 | 7.0 | 12.0 | 10.4 | 10.9 | 9.6 | 4.9 | 11.4 | 5.5 | ||||
| 65–74 | 10.9 | 7.2 | 12.6 | 6.3 | 7.1 | 12.5 | 10.3 | 17.4 | 12.3 | 24.1 | 8.5 | 0.0 | ||||
| 75–84 | 8.5 | 6.0 | 11.8 | 5.3 | 7.4 | 8.9 | 8.6 | 9.7 | 14.1 | 0.0 | 4.2 | 0.0 | ||||
| 85+ | 4.3 | 3.3 | 4.6 | 5.3 | 2.8 | 5.3 | 3.8 | 4.9 | 3.7 | 0.0 | 0.0 | 0.0 | ||||
| Total | 4.5 | 2.6 | 4.5 | 2.7 | 3.1 | 5.7 | 4.2 | 5.1 | 4.5 | 6.6 | 3.2 | 1.9 | ||||
| 2008–12 | <45 | 3.0 | 1.5 | 2.3 | 1.6 | 1.6 | 3.9 | 2.7 | 3.1 | 2.7 | 2.5 | 0.7 | 1.2 | |||
| 45–54 | 9.0 | 4.5 | 8.3 | 4.3 | 4.4 | 12.1 | 8.0 | 10.0 | 8.6 | 8.0 | 7.0 | 3.7 | ||||
| 55–64 | 11.5 | 5.3 | 11.7 | 5.4 | 8.1 | 15.3 | 11.4 | 13.3 | 10.9 | 11.4 | 12.2 | 4.8 | ||||
| 65–74 | 13.8 | 7.5 | 13.5 | 7.1 | 8.5 | 16.9 | 13.7 | 22.7 | 16.6 | 14.2 | 15.8 | 5.7 | ||||
| 75–84 | 10.6 | 7.0 | 12.8 | 5.5 | 5.7 | 12.0 | 11.7 | 13.9 | 11.9 | 10.5 | 6.0 | 4.4 | ||||
| 85+ | 7.4 | 3.9 | 6.3 | 5.2 | 4.0 | 10.3 | 6.3 | 9.0 | 9.0 | 8.3 | 18.1 | 3.1 | ||||
| Total | 5.4 | 2.8 | 4.9 | 2.8 | 3.1 | 7.0 | 5.2 | 6.5 | 5.4 | 5.0 | 3.7 | 2.2 | ||||
| 2013–17 | <45 | 3.1 | 1.6 | 2.1 | 1.6 | 1.8 | 4.3 | 3.0 | 4.0 | 3.1 | 2.9 | 0.8 | 1.3 | |||
| 45–54 | 10.4 | 4.6 | 10.3 | 4.3 | 3.8 | 13.5 | 10.0 | 11.6 | 9.8 | 9.1 | 6.3 | 4.3 | ||||
| 55–64 | 13.4 | 5.7 | 12.3 | 5.7 | 8.3 | 18.8 | 13.0 | 14.0 | 12.4 | 13.0 | 9.0 | 5.6 | ||||
| 65–74 | 16.3 | 7.6 | 15.7 | 6.2 | 7.9 | 21.3 | 16.9 | 23.8 | 18.7 | 16.1 | 18.8 | 6.8 | ||||
| 75–84 | 12.4 | 7.6 | 14.8 | 5.5 | 6.5 | 13.9 | 14.2 | 19.5 | 13.4 | 12.0 | 10.2 | 5.2 | ||||
| 85+ | 7.8 | 3.2 | 7.4 | 3.8 | 3.7 | 10.6 | 8.1 | 8.7 | 10.2 | 9.3 | 8.6 | 3.2 | ||||
| Total | 6.1 | 2.9 | 5.3 | 2.7 | 3.2 | 8.1 | 6.0 | 7.7 | 6.1 | 5.7 | 3.8 | 2.5 | ||||
| 2018–22 | <45 | 3.1 | 1.6 | 2.0 | 1.6 | 1.9 | 4.5 | 2.8 | 4.9 | 3.4 | 3.1 | 0.9 | 1.3 | |||
| 45–54 | 11.6 | 5.1 | 10.0 | 4.2 | 4.7 | 14.7 | 12.5 | 15.4 | 10.7 | 10.0 | 2.6 | 4.8 | ||||
| 55–64 | 15.1 | 5.8 | 14.6 | 5.6 | 6.1 | 20.6 | 15.5 | 10.4 | 13.5 | 14.2 | 9.0 | 6.3 | ||||
| 65–74 | 18.0 | 6.9 | 18.8 | 5.1 | 6.9 | 24.7 | 19.1 | 23.4 | 20.2 | 17.6 | 15.4 | 7.5 | ||||
| 75–84 | 14.8 | 8.0 | 15.8 | 6.2 | 5.8 | 17.5 | 17.1 | 23.7 | 14.6 | 13.1 | 13.0 | 6.2 | ||||
| 85+ | 9.7 | 4.4 | 8.3 | 4.5 | 4.1 | 13.5 | 10.3 | 7.8 | 11.2 | 10.3 | 6.6 | 4.0 | ||||
| Total | 6.6 | 2.9 | 5.7 | 2.7 | 3.1 | 8.9 | 6.7 | 8.4 | 6.7 | 6.2 | 3.3 | 2.7 | ||||
| 2023–27 | <45 | 3.0 | 1.6 | 2.0 | 1.6 | 2.0 | 4.3 | 2.8 | 5.3 | 3.5 | 3.3 | 1.0 | 1.2 | |||
| 45–54 | 12.2 | 4.8 | 8.8 | 4.2 | 5.2 | 16.1 | 13.6 | 17.3 | 11.2 | 10.5 | 2.9 | 5.1 | ||||
| 55–64 | 16.3 | 5.7 | 17.8 | 5.6 | 4.4 | 21.2 | 18.3 | 9.5 | 14.1 | 14.8 | 8.0 | 6.8 | ||||
| 65–74 | 19.6 | 7.3 | 19.5 | 5.6 | 5.8 | 27.5 | 20.9 | 19.6 | 20.9 | 18.3 | 9.6 | 8.2 | ||||
| 75–84 | 16.3 | 7.8 | 18.6 | 4.6 | 4.3 | 19.9 | 20.2 | 19.4 | 15.2 | 13.7 | 12.6 | 6.8 | ||||
| 85+ | 10.3 | 4.1 | 10.0 | 4.2 | 3.7 | 13.4 | 11.8 | 10.4 | 11.7 | 10.7 | 10.5 | 4.3 | ||||
| Total | 6.8 | 2.9 | 6.0 | 2.6 | 2.9 | 9.3 | 7.2 | 8.5 | 7.0 | 6.5 | 2.9 | 2.8 | ||||
| 2028–32 | <45 | 3.0 | 1.6 | 2.0 | 1.6 | 2.1 | 4.6 | 2.8 | 5.9 | 3.7 | 3.4 | 1.1 | 1.2 | |||
| 45–54 | 11.5 | 4.5 | 8.3 | 4.2 | 5.8 | 14.9 | 12.3 | 19.3 | 11.7 | 11.0 | 3.3 | 4.8 | ||||
| 55–64 | 17.6 | 6.2 | 17.4 | 5.6 | 4.9 | 21.9 | 21.9 | 11.4 | 14.7 | 15.6 | 2.6 | 7.3 | ||||
| 65–74 | 21.2 | 7.0 | 23.1 | 5.6 | 3.8 | 28.8 | 24.4 | 13.2 | 21.7 | 19.3 | 10.6 | 8.8 | ||||
| 75–84 | 17.5 | 6.9 | 21.8 | 4.4 | 3.3 | 22.4 | 22.3 | 17.7 | 15.8 | 14.4 | 8.3 | 7.3 | ||||
| 85+ | 12.5 | 4.5 | 10.0 | 5.1 | 2.7 | 17.8 | 14.5 | 10.8 | 12.2 | 11.2 | 11.8 | 5.2 | ||||
| Total | 7.0 | 2.9 | 6.3 | 2.6 | 2.9 | 9.6 | 7.8 | 8.8 | 7.3 | 6.8 | 2.5 | 2.9 | ||||
Abbreviations: AB, Alberta; BC, British Columbia; CA, Canada; MB, Manitoba; NB, New Brunswick; NL, Newfoundland and Labrador; NS, Nova Scotia; ON, Ontario; PE, Prince Edward Island; QC, Quebec; SK, Saskatchewan; TC, All Territories (Yukon, Northwest Territories and Nunavut).
TABLE 4.19.4.
Observed (2003–2007) and projected age-standardized incidence rates (ASIRs) by age and province/territories combined (TC), cancer of thyroid, females, Canada, 2003–2032
| Period | Age | ASIRs | |||||||||||
|---|---|---|---|---|---|---|---|---|---|---|---|---|---|
| CA | BC | AB | SK | MB | ON | QC | NB | NS | PE | NL | TC | ||
| 2003–07 | <45 | 12.6 | 6.6 | 11.9 | 5.9 | 8.3 | 17.1 | 10.8 | 13.2 | 9.2 | 6.0 | 6.8 | 5.8 |
| 45–54 | 28.1 | 13.6 | 26.5 | 13.7 | 15.5 | 38.8 | 25.2 | 31.1 | 21.2 | 13.7 | 20.9 | 20.0 | |
| 55–64 | 26.2 | 12.2 | 23.7 | 16.9 | 16.6 | 35.7 | 23.6 | 31.7 | 18.2 | 7.6 | 26.0 | 33.0 | |
| 65–74 | 21.5 | 8.2 | 22.5 | 12.2 | 9.3 | 27.1 | 22.7 | 23.1 | 20.2 | 7.3 | 20.6 | 0.0 | |
| 75–84 | 15.2 | 11.6 | 12.2 | 14.4 | 12.9 | 16.1 | 15.5 | 22.8 | 20.3 | 6.0 | 23.1 | 0.0 | |
| 85+ | 9.9 | 5.8 | 17.5 | 7.7 | 8.7 | 8.1 | 12.1 | 10.5 | 12.8 | 21.4 | 15.7 | 0.0 | |
| Total | 16.1 | 8.1 | 15.3 | 8.5 | 10.0 | 21.6 | 14.4 | 17.7 | 12.4 | 7.2 | 11.6 | 9.0 | |
| 2008–12 | <45 | 14.7 | 7.1 | 13.3 | 6.8 | 9.5 | 20.0 | 13.1 | 17.8 | 12.9 | 5.9 | 9.7 | 8.1 |
| 45–54 | 36.9 | 15.5 | 31.9 | 14.6 | 19.7 | 53.2 | 32.8 | 52.4 | 23.4 | 10.8 | 24.9 | 20.2 | |
| 55–64 | 34.9 | 14.0 | 29.9 | 15.7 | 18.1 | 50.8 | 32.5 | 34.5 | 24.8 | 8.6 | 32.0 | 19.1 | |
| 65–74 | 28.6 | 11.1 | 28.4 | 12.8 | 12.6 | 37.9 | 28.9 | 37.0 | 25.2 | 8.6 | 28.5 | 15.6 | |
| 75–84 | 20.2 | 12.2 | 15.3 | 15.4 | 13.0 | 23.4 | 21.2 | 36.8 | 19.2 | 9.3 | 26.7 | 11.1 | |
| 85+ | 13.0 | 6.6 | 19.6 | 10.3 | 10.3 | 12.6 | 16.2 | 16.5 | 13.3 | 10.5 | 11.9 | 7.1 | |
| Total | 20.0 | 9.1 | 17.9 | 9.1 | 11.7 | 27.5 | 18.3 | 24.9 | 16.1 | 7.0 | 15.2 | 10.9 | |
| 2013–17 | <45 | 15.6 | 7.1 | 13.1 | 7.2 | 10.7 | 21.3 | 14.0 | 22.2 | 15.1 | 6.3 | 12.4 | 8.5 |
| 45–54 | 47.2 | 18.1 | 40.7 | 15.5 | 22.0 | 69.0 | 42.0 | 71.4 | 27.4 | 12.0 | 30.4 | 25.8 | |
| 55–64 | 43.5 | 15.7 | 35.9 | 16.6 | 19.0 | 64.7 | 41.9 | 45.1 | 29.9 | 9.8 | 33.9 | 23.8 | |
| 65–74 | 36.1 | 12.8 | 30.8 | 13.5 | 16.3 | 50.8 | 36.9 | 49.2 | 26.8 | 9.7 | 34.0 | 19.8 | |
| 75–84 | 26.0 | 12.3 | 21.5 | 16.3 | 13.1 | 31.7 | 27.0 | 45.9 | 24.8 | 10.6 | 32.7 | 14.2 | |
| 85+ | 15.2 | 8.4 | 18.8 | 10.9 | 11.5 | 15.2 | 17.8 | 24.5 | 14.3 | 12.0 | 19.0 | 8.3 | |
| Total | 23.1 | 9.6 | 19.6 | 9.7 | 13.1 | 32.5 | 21.5 | 32.2 | 18.9 | 7.6 | 18.4 | 12.7 | |
| 2018–22 | <45 | 15.3 | 6.7 | 12.5 | 7.5 | 11.4 | 21.1 | 13.9 | 24.6 | 16.6 | 6.5 | 14.5 | 8.4 |
| 45–54 | 53.5 | 20.0 | 44.2 | 16.1 | 24.6 | 77.3 | 49.5 | 91.9 | 33.1 | 13.0 | 37.5 | 29.3 | |
| 55–64 | 52.3 | 17.0 | 41.0 | 17.2 | 21.6 | 78.6 | 51.5 | 64.8 | 29.2 | 11.0 | 34.5 | 28.6 | |
| 65–74 | 44.1 | 14.8 | 35.8 | 14.1 | 18.6 | 64.7 | 45.2 | 49.6 | 29.2 | 11.0 | 31.6 | 24.1 | |
| 75–84 | 31.1 | 12.5 | 24.3 | 16.9 | 14.6 | 39.5 | 32.3 | 65.0 | 27.2 | 12.2 | 37.4 | 17.0 | |
| 85+ | 18.0 | 8.4 | 19.0 | 11.4 | 9.3 | 20.0 | 21.9 | 32.4 | 11.4 | 13.8 | 14.7 | 9.8 | |
| Total | 25.1 | 9.8 | 20.5 | 10.0 | 14.2 | 35.7 | 23.8 | 38.5 | 20.6 | 8.2 | 20.7 | 13.8 | |
| 2023–27 | <45 | 14.3 | 5.9 | 11.3 | 7.6 | 11.4 | 19.8 | 12.8 | 25.9 | 18.0 | 6.8 | 15.8 | 7.8 |
| 45–54 | 54.0 | 21.3 | 43.1 | 16.4 | 29.7 | 76.6 | 52.1 | 107.4 | 30.4 | 13.8 | 41.9 | 29.6 | |
| 55–64 | 61.1 | 18.9 | 48.5 | 17.5 | 23.3 | 92.4 | 60.1 | 78.1 | 28.9 | 12.2 | 32.8 | 33.4 | |
| 65–74 | 50.2 | 15.6 | 40.0 | 14.3 | 18.6 | 74.5 | 53.5 | 58.0 | 29.4 | 12.5 | 27.5 | 27.4 | |
| 75–84 | 36.2 | 13.7 | 24.8 | 17.2 | 18.1 | 48.3 | 38.1 | 72.8 | 24.3 | 13.8 | 35.4 | 19.8 | |
| 85+ | 21.8 | 7.9 | 27.3 | 11.6 | 9.9 | 24.7 | 25.7 | 34.2 | 15.5 | 15.9 | 17.9 | 11.9 | |
| Total | 25.9 | 9.6 | 20.5 | 10.2 | 15.1 | 37.0 | 24.9 | 43.1 | 21.2 | 8.7 | 21.6 | 14.2 | |
| 2028–32 | <45 | 13.7 | 5.2 | 10.2 | 7.7 | 11.6 | 18.9 | 12.5 | 27.2 | 19.5 | 7.0 | 17.1 | 7.5 |
| 45–54 | 51.9 | 21.7 | 42.8 | 16.7 | 30.9 | 74.1 | 48.9 | 112.9 | 28.2 | 14.3 | 46.7 | 28.4 | |
| 55–64 | 66.6 | 20.4 | 51.2 | 17.9 | 25.0 | 99.5 | 67.8 | 95.5 | 31.8 | 13.3 | 36.0 | 36.5 | |
| 65–74 | 57.9 | 16.6 | 44.2 | 14.6 | 21.0 | 86.8 | 62.7 | 77.6 | 26.1 | 14.1 | 24.3 | 31.7 | |
| 75–84 | 42.4 | 15.4 | 28.6 | 17.5 | 19.6 | 58.9 | 44.8 | 69.0 | 24.5 | 15.6 | 29.4 | 23.2 | |
| 85+ | 24.5 | 8.1 | 26.6 | 11.9 | 10.9 | 29.2 | 29.3 | 52.1 | 13.2 | 18.2 | 16.6 | 13.4 | |
| Total | 26.5 | 9.5 | 20.4 | 10.4 | 15.8 | 37.9 | 25.9 | 47.5 | 22.0 | 9.2 | 22.9 | 14.5 | |
Abbreviations: AB, Alberta; BC, British Columbia; CA, Canada; MB, Manitoba; NB, New Brunswick; NL, Newfoundland and Labrador; NS, Nova Scotia; ON, Ontario; PE, Prince Edward Island; QC, Quebec; SK, Saskatchewan; TC, All Territories (Yukon, Northwest Territories and Nunavut).
FIGURE 4.19.1. Age-standardized incidence rates (ASIRs) by region, thyroid cancer, 1983–2032.

One in 223 males and 1 in 71 females can expect to be diagnosed with thyroid cancer in their lifetime, and 1 in 1937 males and 1 in 1374 females can expect to die from it.36 Thyroid cancer has the highest 5-year relative survival rate of all cancers in Canada, at 98% in 2006–2008.1
Joinpoint analysis (data not shown, but the similar annual percent changes for males and the annual percent changes for females in their respective most recent observation periods are shown in Figure 3.1 or 3.2) further showed that the ASIRs of thyroid cancer in males in Canada increased 2.7% per year from 1986 to 1997 and then rose more quickly at 6.7% per year through 2007. The rates for females increased 4.4% per year during 1986 through 1998, accelerated to an 11.4% annual increase from 1998 to 2002 and thereafter rose more slowly by 6.9% annually. Cases are generally diagnosed at younger ages relative to other cancers. In 2003–2007, approximately 44% of new thyroid cancer cases in females were diagnosed in those aged under 45, 25% in those aged 45 to 54, 17% in those aged 55 to 64 and 15% in those aged 65 or older. For males, the corresponding percentages for the same age groups were 32%, 24%, 22% and 21% (Tables 4.19.1 and 4.19.2).
Through the entire observation period, the ASIRs were higher in females than in males in all age groups. The female-to-male ratio was highest in the youngest age group (<45), decreased steadily with age up to age 74 and increased slightly for the older age groups (Figure 4.19.2). Furthermore, the female-to-male ratio increased with time for each age group, with the most pronounced increases in those younger than 55. In the last observation period (2003–2007), the rates in the youngest females (under age 45) were nearly 5 times higher than those in males of the same age.
FIGURE 4.19.2. Age-standardized incidence rates (ASIRs) for thyroid cancer by age group (– males, – females), Canada, 1983–2032.

The observed increasing pattern of thyroid cancer ASIRs continued into the prediction periods in each age group in both sexes. However, the rates for both sexes are expected to reach their peak after 10 years in the youngest age group and after 20 years in 45–54 year age group (Figure 4.19.2). The rates are projected to increase in all regions, with the most prominent increase in Ontario and the least evident one in British Columbia (Figure 4.19.1). Internal ranking of ASIRs according to region is projected to be similar for males and females, with the highest rates in Ontario and the lowest in British Columbia.
From 2003–2007 to 2028–2032, the ASIRs of thyroid cancer for Canada are projected to increase by 55% in males, from 4.5 to 7.0 per 100 000, and by 65% in females, from 16.1 to 26.5 per 100 000 (Tables 4.19.3 and 4.19.4). The annual number of new cases is estimated to increase by 139% in males, from 795 to 1895, and by 146% in females from 2810 to 6910 (Tables 4.19.1 and 4.19.2).
Comments
The significantly increasing thyroid cancer incidence rates in Canada are similar to trends observed in other developed nations.257–259 Increased diagnostic scrutiny may have resulted in this observed increase. Advanced diagnostic technologies (e.g. ultrasonography, computed tomography scan, magnetic resonance imaging and fine-needle aspiration biopsy) have facilitated the detection of small, subclinical thyroid carcinomas.260 More frequent use of these technologies to diagnose benign thyroid diseases, which affect more females than males, may account for the more rapid increase of thyroid cancer in females.260,261
Although US evidence supports the theory that the increase in thyroid cancer incidence reflects the increased detection of subclinical disease,258 some investigators suggest that this increase is not based simply on greater detection, and that the changing prevalence of a known or an emerging risk factor may also explain this rise.259 Risk of thyroid cancer has been linked to environmental sources of ionizing radiation, insufficient or excess iodine consumption, and heredity.111,262,263 Increasing population exposure to diagnostic ionizing radiation may have increased the risk of thyroid cancer. Ionizing radiation was used to treat benign conditions in children and adolescents between 1930 and 1960.264,265 This use may explain some of the increase in thyroid cancer incidence in older women. A recent systematic review also supported a positive association of BMI with thyroid cancer risk.266 Obesity rates have been increasing over the last 30 years in Canada,51,72,73 and the increasing trend in obesity in the general population may be an important contributing factor in the rising thyroid cancer incidence.
20. Hodgkin lymphoma
Hodgkin lymphoma (HL) is a relatively rare cancer. In 2003–2007, the average annual number of new HL cases was 490 for males and 395 for females, constituting 0.6% and 0.5% of all new male and female cancer cases in Canada, respectively (Tables 4.20.1 and 4.20.2). HL is classified into 2 main groups: classical HL, the most common type, and nodular lymphocyte-predominant HL, which represents about 1 in 20 cases.111,267 The 5-year relative survival rates for HL diagnosed between 2006 and 2008 were 83% for males and 87% for females.1
TABLE 4.20.1.
Observed (2003–2007) and projected average annual new cases by age and province/territories combined (TC), Hodgkin lymphoma, males, Canada, 2003–2032
| Period | Age | New cases | |||||||||||
|---|---|---|---|---|---|---|---|---|---|---|---|---|---|
| CA | BC | AB | SK | MB | ON | QC | NB | NS | PE | NL | TC | ||
| 2003–07 | <45 | 300 | 35 | 30 | 10 | 10 | 115 | 80 | 10 | 10 | 0 | 5 | 0 |
| 45–54 | 65 | 5 | 5 | 0 | 0 | 30 | 15 | 0 | 0 | 0 | 0 | 0 | |
| 55–64 | 50 | 5 | 5 | 0 | 0 | 20 | 15 | 0 | 0 | 0 | 0 | 0 | |
| 65–74 | 40 | 5 | 5 | 0 | 0 | 20 | 10 | 0 | 0 | 0 | 0 | 0 | |
| 75–84 | 25 | 5 | 5 | 0 | 0 | 10 | 5 | 0 | 0 | 0 | 0 | 0 | |
| 85+ | 5 | 0 | 0 | 0 | 0 | 0 | 0 | 0 | 0 | 0 | 0 | 0 | |
| Total | 490 | 50 | 50 | 15 | 15 | 195 | 125 | 15 | 15 | 0 | 5 | 0 | |
| 2008–12 | <45 | 295 | 30 | 35 | 10 | 10 | 110 | 75 | 5 | 10 | 0 | 5 | 0 |
| 45–54 | 75 | 10 | 10 | 5 | 0 | 30 | 20 | 0 | 0 | 0 | 0 | 0 | |
| 55–64 | 60 | 5 | 5 | 0 | 5 | 25 | 15 | 0 | 0 | 0 | 0 | 0 | |
| 65–74 | 45 | 5 | 5 | 0 | 0 | 20 | 10 | 0 | 0 | 0 | 0 | 0 | |
| 75–84 | 25 | 5 | 5 | 0 | 0 | 10 | 5 | 0 | 0 | 0 | 0 | 0 | |
| 85+ | 5 | 0 | 0 | 0 | 0 | 0 | 0 | 0 | 0 | 0 | 0 | 0 | |
| Total | 505 | 55 | 55 | 15 | 15 | 200 | 125 | 15 | 15 | 0 | 5 | 0 | |
| 2013–17 | <45 | 295 | 30 | 35 | 10 | 10 | 115 | 80 | 5 | 10 | 0 | 5 | 0 |
| 45–54 | 75 | 5 | 10 | 0 | 0 | 30 | 15 | 0 | 0 | 0 | 0 | 0 | |
| 55–64 | 65 | 5 | 10 | 0 | 5 | 30 | 15 | 0 | 0 | 0 | 0 | 0 | |
| 65–74 | 55 | 5 | 5 | 0 | 0 | 25 | 10 | 0 | 0 | 0 | 0 | 0 | |
| 75–84 | 25 | 5 | 5 | 0 | 0 | 10 | 5 | 0 | 0 | 0 | 0 | 0 | |
| 85+ | 5 | 0 | 0 | 0 | 0 | 5 | 0 | 0 | 0 | 0 | 0 | 0 | |
| Total | 520 | 55 | 60 | 15 | 20 | 215 | 130 | 15 | 15 | 0 | 5 | 0 | |
| 2018–22 | <45 | 300 | 25 | 35 | 10 | 10 | 120 | 80 | 5 | 5 | 0 | 0 | 0 |
| 45–54 | 70 | 10 | 10 | 0 | 0 | 30 | 15 | 0 | 0 | 0 | 0 | 0 | |
| 55–64 | 75 | 10 | 10 | 0 | 5 | 35 | 15 | 5 | 0 | 0 | 0 | 0 | |
| 65–74 | 60 | 5 | 5 | 0 | 5 | 30 | 15 | 0 | 0 | 0 | 0 | 0 | |
| 75–84 | 30 | 5 | 5 | 0 | 0 | 15 | 5 | 0 | 0 | 0 | 0 | 0 | |
| 85+ | 10 | 0 | 0 | 0 | 0 | 5 | 0 | 0 | 0 | 0 | 0 | 0 | |
| Total | 545 | 55 | 60 | 15 | 20 | 235 | 130 | 15 | 15 | 0 | 5 | 0 | |
| 2023–27 | <45 | 305 | 25 | 35 | 10 | 10 | 130 | 75 | 5 | 5 | 0 | 0 | 0 |
| 45–54 | 75 | 10 | 10 | 0 | 0 | 30 | 20 | 0 | 0 | 0 | 0 | 0 | |
| 55–64 | 75 | 5 | 10 | 0 | 5 | 35 | 15 | 0 | 0 | 0 | 0 | 0 | |
| 65–74 | 70 | 5 | 10 | 0 | 5 | 35 | 15 | 5 | 5 | 0 | 0 | 0 | |
| 75–84 | 40 | 5 | 5 | 0 | 0 | 20 | 5 | 0 | 0 | 0 | 0 | 0 | |
| 85+ | 10 | 0 | 0 | 0 | 0 | 5 | 0 | 0 | 0 | 0 | 0 | 0 | |
| Total | 580 | 55 | 65 | 20 | 20 | 255 | 135 | 15 | 15 | 0 | 5 | 0 | |
| 2028–32 | <45 | 315 | 25 | 35 | 10 | 10 | 135 | 75 | 5 | 5 | 0 | 0 | 0 |
| 45–54 | 85 | 10 | 10 | 5 | 0 | 30 | 25 | 0 | 0 | 0 | 0 | 0 | |
| 55–64 | 75 | 10 | 10 | 0 | 5 | 35 | 15 | 0 | 0 | 0 | 0 | 0 | |
| 65–74 | 85 | 10 | 10 | 5 | 5 | 45 | 15 | 5 | 5 | 0 | 0 | 0 | |
| 75–84 | 50 | 5 | 5 | 0 | 0 | 25 | 10 | 0 | 0 | 0 | 0 | 0 | |
| 85+ | 10 | 0 | 0 | 0 | 0 | 5 | 0 | 0 | 0 | 0 | 0 | 0 | |
| Total | 615 | 60 | 70 | 20 | 20 | 275 | 140 | 15 | 15 | 0 | 5 | 0 | |
Abbreviations: AB, Alberta; BC, British Columbia; CA, Canada; MB, Manitoba; NB, New Brunswick; NL, Newfoundland and Labrador; NS, Nova Scotia; ON, Ontario; PE, Prince Edward Island; QC, Quebec; SK, Saskatchewan; TC, All Territories (Yukon, Northwest Territories and Nunavut).
Note: Totals may not add up due to rounding.
TABLE 4.20.2.
Observed (2003–2007) and projected average annual new cases by age and province/territories combined (TC), Hodgkin lymphoma, females, Canada, 2003–2032
| Period | Age | New cases | |||||||||||
|---|---|---|---|---|---|---|---|---|---|---|---|---|---|
| CA | BC | AB | SK | MB | ON | QC | NB | NS | PE | NL | TC | ||
| 2003–07 | <45 | 245 | 30 | 30 | 5 | 10 | 95 | 55 | 5 | 10 | 0 | 0 | 0 |
| 45–54 | 40 | 5 | 5 | 0 | 0 | 15 | 10 | 0 | 0 | 0 | 0 | 0 | |
| 55–64 | 45 | 5 | 5 | 0 | 0 | 20 | 10 | 0 | 0 | 0 | 0 | 0 | |
| 65–74 | 30 | 5 | 0 | 0 | 0 | 10 | 10 | 0 | 0 | 0 | 0 | 0 | |
| 75–84 | 30 | 0 | 0 | 0 | 0 | 15 | 10 | 0 | 0 | 0 | 0 | 0 | |
| 85+ | 5 | 0 | 0 | 0 | 0 | 0 | 0 | 0 | 0 | 0 | 0 | 0 | |
| Total | 395 | 45 | 40 | 10 | 15 | 160 | 95 | 10 | 15 | 0 | 5 | 0 | |
| 2008–12 | <45 | 260 | 30 | 35 | 5 | 10 | 100 | 65 | 5 | 10 | 0 | 0 | 0 |
| 45–54 | 45 | 5 | 5 | 0 | 0 | 20 | 10 | 0 | 0 | 0 | 0 | 0 | |
| 55–64 | 45 | 5 | 5 | 0 | 0 | 20 | 10 | 0 | 0 | 0 | 0 | 0 | |
| 65–74 | 35 | 5 | 5 | 0 | 0 | 15 | 10 | 0 | 0 | 0 | 0 | 0 | |
| 75–84 | 30 | 5 | 0 | 0 | 0 | 15 | 5 | 0 | 0 | 0 | 0 | 0 | |
| 85+ | 10 | 0 | 0 | 0 | 0 | 5 | 5 | 0 | 0 | 0 | 0 | 0 | |
| Total | 420 | 50 | 50 | 10 | 20 | 170 | 100 | 10 | 15 | 0 | 5 | 0 | |
| 2013–17 | <45 | 255 | 30 | 35 | 5 | 10 | 100 | 65 | 5 | 10 | 0 | 0 | 0 |
| 45–54 | 45 | 5 | 5 | 0 | 0 | 20 | 10 | 0 | 0 | 0 | 0 | 0 | |
| 55–64 | 50 | 5 | 5 | 0 | 5 | 25 | 10 | 0 | 0 | 0 | 0 | 0 | |
| 65–74 | 45 | 5 | 5 | 0 | 0 | 20 | 10 | 0 | 0 | 0 | 0 | 0 | |
| 75–84 | 30 | 5 | 5 | 0 | 0 | 15 | 5 | 0 | 0 | 0 | 0 | 0 | |
| 85+ | 10 | 0 | 0 | 0 | 0 | 5 | 5 | 0 | 0 | 0 | 0 | 0 | |
| Total | 440 | 55 | 55 | 10 | 20 | 180 | 105 | 10 | 20 | 0 | 5 | 0 | |
| 2018–22 | <45 | 250 | 35 | 35 | 5 | 10 | 95 | 70 | 5 | 10 | 0 | 0 | 0 |
| 45–54 | 50 | 5 | 5 | 0 | 0 | 20 | 10 | 0 | 0 | 0 | 0 | 0 | |
| 55–64 | 55 | 5 | 5 | 0 | 5 | 30 | 10 | 0 | 0 | 0 | 0 | 0 | |
| 65–74 | 60 | 10 | 5 | 0 | 5 | 25 | 10 | 0 | 5 | 0 | 0 | 0 | |
| 75–84 | 35 | 5 | 5 | 0 | 0 | 15 | 5 | 0 | 0 | 0 | 0 | 0 | |
| 85+ | 10 | 0 | 0 | 0 | 0 | 5 | 5 | 0 | 0 | 0 | 0 | 0 | |
| Total | 455 | 55 | 60 | 10 | 20 | 195 | 110 | 10 | 20 | 0 | 5 | 0 | |
| 2023–27 | <45 | 240 | 35 | 35 | 5 | 10 | 95 | 70 | 5 | 10 | 0 | 0 | 0 |
| 45–54 | 50 | 5 | 5 | 0 | 0 | 20 | 10 | 0 | 0 | 0 | 0 | 0 | |
| 55–64 | 60 | 5 | 10 | 0 | 5 | 35 | 10 | 0 | 0 | 0 | 0 | 0 | |
| 65–74 | 65 | 10 | 5 | 0 | 5 | 30 | 10 | 0 | 5 | 0 | 0 | 0 | |
| 75–84 | 45 | 5 | 5 | 0 | 0 | 25 | 10 | 0 | 0 | 0 | 0 | 0 | |
| 85+ | 10 | 0 | 0 | 0 | 0 | 5 | 5 | 0 | 0 | 0 | 0 | 0 | |
| Total | 475 | 60 | 65 | 10 | 20 | 215 | 115 | 10 | 20 | 0 | 5 | 0 | |
| 2028–32 | <45 | 240 | 35 | 35 | 5 | 10 | 100 | 75 | 5 | 10 | 0 | 0 | 0 |
| 45–54 | 55 | 5 | 5 | 0 | 0 | 20 | 10 | 0 | 0 | 0 | 0 | 0 | |
| 55–64 | 65 | 5 | 10 | 0 | 5 | 35 | 10 | 0 | 0 | 0 | 0 | 0 | |
| 65–74 | 70 | 10 | 5 | 0 | 5 | 40 | 10 | 0 | 5 | 0 | 0 | 0 | |
| 75–84 | 55 | 5 | 5 | 0 | 5 | 35 | 10 | 0 | 5 | 0 | 0 | 0 | |
| 85+ | 15 | 0 | 5 | 0 | 0 | 5 | 5 | 0 | 0 | 0 | 0 | 0 | |
| Total | 500 | 65 | 70 | 10 | 25 | 235 | 120 | 10 | 20 | 0 | 5 | 0 | |
Abbreviations: AB, Alberta; BC, British Columbia; CA, Canada; MB, Manitoba; NB, New Brunswick; NL, Newfoundland and Labrador; NS, Nova Scotia; ON, Ontario; PE, Prince Edward Island; QC, Quebec; SK, Saskatchewan; TC, All Territories (Yukon, Northwest Territories and Nunavut).
Note: Totals may not add up due to rounding.
HL has a bimodal age distribution, with peaks at age 20 to 24 and 75 to 79 for both sexes in 2003–2007 (Figure 4.20.1). The disease was more common in men than in women beginning in adulthood, although the rates corresponded at ages 10 to 19. Tables 4.20.1 and 4.20.2 show that more than 70% of all HL cases occurred in those younger than 55. The age distribution between males and females was nearly identical (Figure 4.20.1).
FIGURE 4.20.1. Age-specific incidence rates of Hodgkin lymphoma, Canada, 2003–2007 (from average annual counts).

Figure 4.20.2 indicates that overall ASIRs of HL decreased modestly in both sexes until 1998–2002. During 1998–2007, the ASIRs increased non-significantly in males by 0.4% per year and by 0.9% per year in females (Figures 3.1 and 3.2). Quebec, Ontario, the Atlantic region and the country had similar trends for males, British Columbia showed an opposite pattern from 1988–1992, and the rates in the Prairies seemed to stabilize (Figure 4.20.2). For females, the ASIRs in British Columbia and Quebec were similar to the entire country, and the rates in Ontario have decreased steadily since 1988–1992. The rates for females in the Prairies and the Atlantic region seem random, likely because of the small numbers of annual cases and the unusual age distribution of the cancer occurrence, making it complicated to interpret the trends.
FIGURE 4.20.2. Age-standardized incidence rates (ASIRs) by region, Hodgkin lymphoma, 1983–2032.

The overall incidence rates for HL are projected to decrease slightly in both sexes (Figure 4.20.2), whereas the overall ASIRs are projected to increase steadily in the 45–54 age group and decrease or level off in other age groups (Figure 4.20.3). The ASIRs in males and females are predicted to converge in the age groups older than 54. Rates of HL in British Columbia males are projected to decrease significantly and diverge from those in other regions, where the rates will tend to remain unchanged and consistent (Figure 4.20.2). For females, the rates are projected to increase slightly in Quebec, the Atlantic region and the Prairies, and to decrease marginally in Ontario and British Columbia. The projected rates for HL in both sexes will be lowest in British Columbia and highest in Quebec.
FIGURE 4.20.3. Age-standardized incidence rates (ASIRs) for Hodgkin lymphoma by age group (– males, – females), Canada, 1983–2032.

From 2003–2007 to 2028–2032, the ASIRs of HL for Canada are expected to decrease by 3% in males, from 3.1 to 3.0 per 100 000, and by 7% in females, from 2.5 to 2.3 per 100 000 (Tables 4.20.3 and 4.20.4). Due to the projected Canada population growth and aging, the annual number of newly diagnosed cases is predicted to increase by roughly 26% in both sexes, from 490 to 615 in males and from 395 to 500 in females (Tables 4.20.1 and 4.20.2).
TABLE 4.20.3.
Observed (2003–2007) and projected age-standardized incidence rates (ASIRs) by age and province/territories combined (TC), Hodgkin lymphoma, males, Canada, 2003–2032
| Period | Age | ASIRs | |||||||||||
|---|---|---|---|---|---|---|---|---|---|---|---|---|---|
| CA | BC | AB | SK | MB | ON | QC | NB | NS | PE | NL | TC | ||
| 2003–07 | <45 | 3.0 | 2.6 | 2.7 | 3.6 | 2.7 | 2.9 | 3.4 | 3.5 | 4.0 | 2.8 | 2.2 | 1.1 |
| 45–54 | 2.7 | 1.9 | 2.4 | 2.8 | 1.6 | 3.1 | 2.8 | 3.5 | 3.1 | 1.8 | 1.0 | 2.6 | |
| 55–64 | 2.9 | 1.8 | 3.0 | 4.5 | 3.0 | 3.2 | 2.9 | 3.1 | 2.9 | 0.0 | 3.0 | 0.0 | |
| 65–74 | 4.0 | 3.3 | 3.3 | 1.7 | 4.3 | 4.4 | 4.1 | 5.3 | 2.3 | 3.8 | 4.3 | 10.9 | |
| 75–84 | 4.2 | 2.9 | 5.9 | 1.7 | 5.3 | 4.7 | 4.4 | 2.8 | 3.2 | 7.6 | 0.0 | 0.0 | |
| 85+ | 3.1 | 2.5 | 3.1 | 5.3 | 2.8 | 3.5 | 3.8 | 0.0 | 0.0 | 0.0 | 0.0 | 0.0 | |
| Total | 3.1 | 2.5 | 2.9 | 3.4 | 2.8 | 3.1 | 3.4 | 3.6 | 3.7 | 2.7 | 2.2 | 1.8 | |
| 2008–12 | <45 | 2.9 | 2.3 | 2.6 | 3.3 | 2.6 | 2.9 | 3.4 | 3.1 | 3.1 | 2.5 | 2.1 | 1.6 |
| 45–54 | 2.8 | 2.3 | 2.7 | 3.6 | 1.5 | 3.0 | 2.8 | 3.8 | 3.1 | 2.5 | 2.0 | 1.6 | |
| 55–64 | 2.8 | 2.0 | 3.4 | 2.7 | 3.8 | 3.3 | 2.7 | 4.3 | 2.7 | 2.5 | 2.0 | 1.5 | |
| 65–74 | 3.5 | 2.4 | 3.7 | 3.8 | 4.3 | 4.1 | 3.6 | 5.1 | 4.5 | 3.1 | 2.5 | 1.9 | |
| 75–84 | 3.8 | 3.6 | 5.0 | 3.8 | 3.9 | 4.3 | 3.2 | 6.0 | 4.2 | 3.3 | 2.7 | 2.1 | |
| 85+ | 2.9 | 4.1 | 3.5 | 3.4 | 4.3 | 3.0 | 3.0 | 1.6 | 0.9 | 2.5 | 2.0 | 1.6 | |
| Total | 3.0 | 2.3 | 2.9 | 3.3 | 2.7 | 3.1 | 3.3 | 3.5 | 3.2 | 2.6 | 2.1 | 1.6 | |
| 2013–17 | <45 | 2.9 | 2.1 | 2.6 | 3.2 | 2.5 | 2.8 | 3.4 | 3.2 | 3.0 | 2.5 | 2.1 | 1.6 |
| 45–54 | 2.8 | 2.1 | 2.7 | 3.6 | 1.4 | 3.0 | 2.9 | 3.9 | 2.9 | 2.5 | 2.0 | 1.6 | |
| 55–64 | 2.7 | 2.0 | 3.5 | 2.7 | 3.8 | 3.2 | 2.4 | 4.3 | 2.5 | 2.4 | 1.9 | 1.5 | |
| 65–74 | 3.4 | 2.1 | 3.7 | 3.8 | 4.3 | 4.3 | 3.2 | 5.2 | 4.2 | 3.0 | 2.4 | 1.9 | |
| 75–84 | 3.6 | 3.4 | 5.1 | 3.7 | 3.9 | 4.2 | 3.0 | 6.1 | 3.9 | 3.1 | 2.6 | 2.0 | |
| 85+ | 2.7 | 3.0 | 3.5 | 3.4 | 4.2 | 3.4 | 2.6 | 1.7 | 0.8 | 2.4 | 1.9 | 1.5 | |
| Total | 2.9 | 2.2 | 2.9 | 3.3 | 2.7 | 3.0 | 3.3 | 3.6 | 3.0 | 2.5 | 2.1 | 1.6 | |
| 2018–22 | <45 | 2.8 | 1.9 | 2.6 | 3.2 | 2.5 | 2.9 | 3.4 | 3.2 | 2.9 | 2.5 | 2.0 | 1.6 |
| 45–54 | 2.9 | 2.3 | 2.7 | 3.5 | 1.4 | 3.0 | 3.3 | 3.9 | 2.8 | 2.6 | 2.1 | 1.6 | |
| 55–64 | 2.9 | 2.1 | 3.5 | 2.6 | 3.8 | 3.5 | 2.4 | 4.4 | 2.4 | 2.5 | 2.0 | 1.6 | |
| 65–74 | 3.3 | 2.3 | 3.7 | 3.7 | 4.2 | 4.2 | 3.0 | 5.2 | 4.1 | 2.9 | 2.4 | 1.8 | |
| 75–84 | 3.3 | 2.9 | 5.1 | 3.7 | 3.9 | 4.0 | 2.7 | 6.1 | 3.7 | 2.9 | 2.4 | 1.8 | |
| 85+ | 2.6 | 3.8 | 3.5 | 3.3 | 4.2 | 3.1 | 2.2 | 1.7 | 0.7 | 2.3 | 1.9 | 1.4 | |
| Total | 2.9 | 2.0 | 2.9 | 3.2 | 2.7 | 3.1 | 3.2 | 3.6 | 3.0 | 2.5 | 2.1 | 1.6 | |
| 2023–27 | <45 | 2.9 | 1.8 | 2.6 | 3.2 | 2.5 | 3.0 | 3.4 | 3.2 | 2.9 | 2.5 | 2.0 | 1.6 |
| 45–54 | 3.1 | 2.5 | 2.7 | 3.5 | 1.4 | 3.0 | 3.8 | 3.9 | 2.8 | 2.7 | 2.2 | 1.7 | |
| 55–64 | 3.0 | 2.1 | 3.5 | 2.6 | 3.8 | 3.6 | 2.6 | 4.4 | 2.4 | 2.6 | 2.1 | 1.7 | |
| 65–74 | 3.3 | 2.4 | 3.7 | 3.7 | 4.2 | 4.3 | 2.8 | 5.2 | 4.0 | 2.9 | 2.3 | 1.8 | |
| 75–84 | 3.3 | 2.7 | 5.1 | 3.7 | 3.8 | 4.5 | 2.6 | 6.1 | 3.7 | 2.9 | 2.4 | 1.8 | |
| 85+ | 2.5 | 3.2 | 3.5 | 3.3 | 4.2 | 3.3 | 2.3 | 1.7 | 0.7 | 2.2 | 1.8 | 1.4 | |
| Total | 2.9 | 1.9 | 2.9 | 3.2 | 2.7 | 3.2 | 3.3 | 3.6 | 2.9 | 2.6 | 2.1 | 1.6 | |
| 2028–32 | <45 | 2.9 | 1.6 | 2.6 | 3.2 | 2.5 | 3.1 | 3.2 | 3.2 | 2.8 | 2.5 | 2.0 | 1.6 |
| 45–54 | 3.1 | 2.3 | 2.7 | 3.5 | 1.4 | 2.8 | 4.1 | 4.0 | 2.7 | 2.7 | 2.2 | 1.7 | |
| 55–64 | 3.1 | 2.2 | 3.5 | 2.6 | 3.7 | 3.7 | 3.0 | 4.4 | 2.3 | 2.7 | 2.2 | 1.7 | |
| 65–74 | 3.5 | 2.5 | 3.7 | 3.7 | 4.2 | 4.7 | 2.8 | 5.2 | 3.9 | 3.1 | 2.5 | 2.0 | |
| 75–84 | 3.2 | 2.9 | 5.1 | 3.7 | 3.8 | 4.3 | 2.5 | 6.1 | 3.6 | 2.8 | 2.3 | 1.8 | |
| 85+ | 2.3 | 2.8 | 3.5 | 3.3 | 4.2 | 3.0 | 2.0 | 1.7 | 0.7 | 2.0 | 1.6 | 1.3 | |
| Total | 3.0 | 1.9 | 2.9 | 3.2 | 2.7 | 3.3 | 3.2 | 3.6 | 2.9 | 2.6 | 2.1 | 1.6 | |
Abbreviations: AB, Alberta; BC, British Columbia; CA, Canada; MB, Manitoba; NB, New Brunswick; NL, Newfoundland and Labrador; NS, Nova Scotia; ON, Ontario; PE, Prince Edward Island; QC, Quebec; SK, Saskatchewan; TC, All Territories (Yukon, Northwest Territories and Nunavut).
TABLE 4.20.4.
Observed (2003–2007) and projected age-standardized incidence rates (ASIRs) by age and province/territories combined (TC), Hodgkin lymphoma, females, Canada, 2003–2032
| Period | Age | ASIRs | |||||||||||
|---|---|---|---|---|---|---|---|---|---|---|---|---|---|
| CA | BC | AB | SK | MB | ON | QC | NB | NS | PE | NL | TC | ||
| 2003–07 | <45 | 2.6 | 2.4 | 2.8 | 2.4 | 2.6 | 2.5 | 2.6 | 2.3 | 3.3 | 1.7 | 1.5 | 1.2 |
| 45–54 | 1.6 | 1.4 | 1.1 | 0.8 | 2.8 | 1.7 | 1.8 | 1.1 | 1.3 | 0.0 | 0.9 | 0.0 | |
| 55–64 | 2.4 | 1.8 | 2.1 | 2.1 | 2.6 | 2.8 | 2.2 | 2.9 | 3.2 | 0.0 | 0.7 | 7.1 | |
| 65–74 | 2.7 | 2.6 | 2.3 | 2.3 | 3.4 | 2.7 | 2.9 | 3.5 | 2.0 | 0.0 | 3.0 | 0.0 | |
| 75–84 | 3.5 | 2.0 | 3.4 | 2.9 | 4.7 | 4.0 | 3.7 | 4.7 | 2.3 | 0.0 | 1.4 | 0.0 | |
| 85+ | 2.0 | 1.2 | 2.2 | 2.6 | 2.5 | 1.8 | 2.5 | 2.1 | 4.8 | 0.0 | 0.0 | 0.0 | |
| Total | 2.5 | 2.3 | 2.5 | 2.2 | 2.7 | 2.5 | 2.5 | 2.4 | 3.0 | 1.2 | 1.5 | 1.4 | |
| 2008–12 | <45 | 2.6 | 2.4 | 2.9 | 2.1 | 2.9 | 2.5 | 2.9 | 2.5 | 3.6 | 1.3 | 1.6 | 1.4 |
| 45–54 | 1.6 | 1.5 | 1.6 | 1.4 | 1.8 | 1.7 | 1.7 | 1.7 | 2.1 | 0.8 | 0.9 | 0.9 | |
| 55–64 | 2.1 | 1.5 | 2.1 | 1.6 | 3.2 | 2.6 | 1.8 | 2.2 | 2.2 | 1.0 | 1.2 | 1.1 | |
| 65–74 | 2.7 | 2.6 | 2.9 | 2.8 | 3.6 | 2.8 | 2.6 | 2.8 | 3.7 | 1.3 | 1.6 | 1.5 | |
| 75–84 | 3.2 | 2.4 | 3.3 | 2.4 | 4.6 | 3.8 | 2.9 | 3.4 | 4.4 | 1.5 | 1.9 | 1.7 | |
| 85+ | 2.0 | 1.3 | 3.0 | 1.1 | 3.1 | 1.6 | 2.6 | 2.1 | 6.3 | 1.0 | 1.2 | 1.1 | |
| Total | 2.5 | 2.2 | 2.7 | 2.0 | 2.9 | 2.5 | 2.6 | 2.4 | 3.4 | 1.2 | 1.5 | 1.4 | |
| 2013–17 | <45 | 2.5 | 2.4 | 2.9 | 2.0 | 3.0 | 2.4 | 3.1 | 2.5 | 3.9 | 1.2 | 1.5 | 1.4 |
| 45–54 | 1.8 | 1.5 | 2.4 | 1.3 | 1.9 | 1.9 | 1.7 | 1.7 | 2.3 | 0.9 | 1.1 | 1.0 | |
| 55–64 | 2.1 | 1.5 | 2.0 | 1.5 | 3.3 | 2.7 | 1.7 | 2.2 | 2.4 | 1.0 | 1.2 | 1.1 | |
| 65–74 | 2.8 | 2.6 | 3.0 | 2.7 | 3.7 | 3.2 | 2.3 | 2.8 | 4.0 | 1.3 | 1.6 | 1.5 | |
| 75–84 | 3.0 | 2.4 | 3.8 | 2.3 | 4.7 | 3.5 | 2.8 | 3.3 | 4.8 | 1.5 | 1.8 | 1.6 | |
| 85+ | 2.2 | 1.3 | 3.9 | 1.0 | 3.2 | 1.8 | 2.3 | 2.1 | 6.9 | 1.0 | 1.3 | 1.2 | |
| Total | 2.4 | 2.2 | 2.8 | 1.9 | 3.0 | 2.5 | 2.7 | 2.4 | 3.7 | 1.2 | 1.4 | 1.3 | |
| 2018–22 | <45 | 2.4 | 2.4 | 2.9 | 2.0 | 3.0 | 2.3 | 3.2 | 2.4 | 4.1 | 1.2 | 1.4 | 1.3 |
| 45–54 | 2.0 | 1.5 | 2.4 | 1.3 | 1.9 | 2.2 | 2.0 | 1.7 | 2.4 | 1.0 | 1.2 | 1.1 | |
| 55–64 | 2.1 | 1.5 | 2.6 | 1.4 | 3.3 | 2.8 | 1.6 | 2.2 | 2.6 | 1.0 | 1.2 | 1.1 | |
| 65–74 | 2.8 | 2.6 | 2.6 | 2.6 | 3.7 | 3.4 | 2.3 | 2.8 | 4.3 | 1.4 | 1.7 | 1.5 | |
| 75–84 | 3.1 | 2.4 | 4.4 | 2.2 | 4.8 | 4.0 | 2.4 | 3.3 | 5.1 | 1.5 | 1.9 | 1.7 | |
| 85+ | 1.9 | 1.3 | 3.2 | 1.0 | 3.2 | 1.7 | 2.2 | 2.0 | 7.2 | 0.9 | 1.1 | 1.0 | |
| Total | 2.4 | 2.2 | 2.9 | 1.9 | 3.0 | 2.5 | 2.8 | 2.4 | 3.9 | 1.2 | 1.4 | 1.3 | |
| 2023–27 | <45 | 2.3 | 2.4 | 2.9 | 1.9 | 3.0 | 2.3 | 3.3 | 2.4 | 4.3 | 1.1 | 1.4 | 1.3 |
| 45–54 | 2.1 | 1.5 | 2.2 | 1.3 | 1.9 | 2.1 | 2.2 | 1.7 | 2.5 | 1.0 | 1.2 | 1.1 | |
| 55–64 | 2.3 | 1.5 | 3.6 | 1.4 | 3.4 | 3.2 | 1.6 | 2.1 | 2.7 | 1.1 | 1.4 | 1.3 | |
| 65–74 | 2.8 | 2.6 | 2.3 | 2.6 | 3.7 | 3.6 | 2.2 | 2.7 | 4.4 | 1.4 | 1.7 | 1.5 | |
| 75–84 | 3.2 | 2.4 | 4.3 | 2.2 | 4.8 | 4.6 | 2.2 | 3.3 | 5.2 | 1.6 | 1.9 | 1.8 | |
| 85+ | 1.9 | 1.3 | 4.3 | 1.0 | 3.2 | 1.6 | 2.1 | 2.0 | 7.4 | 0.9 | 1.1 | 1.0 | |
| Total | 2.3 | 2.2 | 2.9 | 1.8 | 3.0 | 2.5 | 2.9 | 2.4 | 4.0 | 1.1 | 1.4 | 1.3 | |
| 2028–32 | <45 | 2.2 | 2.4 | 2.9 | 1.9 | 3.0 | 2.3 | 3.4 | 2.4 | 4.4 | 1.1 | 1.3 | 1.2 |
| 45–54 | 2.0 | 1.5 | 2.4 | 1.2 | 1.9 | 1.9 | 2.1 | 1.7 | 2.6 | 1.0 | 1.2 | 1.1 | |
| 55–64 | 2.6 | 1.5 | 3.4 | 1.4 | 3.4 | 3.6 | 1.9 | 2.2 | 2.8 | 1.3 | 1.5 | 1.4 | |
| 65–74 | 2.8 | 2.6 | 2.9 | 2.5 | 3.8 | 3.8 | 2.1 | 2.7 | 4.5 | 1.4 | 1.7 | 1.5 | |
| 75–84 | 3.3 | 2.4 | 3.5 | 2.2 | 4.8 | 4.9 | 2.2 | 3.3 | 5.4 | 1.6 | 2.0 | 1.8 | |
| 85+ | 2.0 | 1.3 | 4.4 | 0.9 | 3.3 | 2.1 | 1.7 | 2.0 | 7.6 | 1.0 | 1.2 | 1.1 | |
| Total | 2.3 | 2.2 | 2.9 | 1.8 | 3.1 | 2.5 | 3.0 | 2.4 | 4.1 | 1.1 | 1.4 | 1.3 | |
Abbreviations: AB, Alberta; BC, British Columbia; CA, Canada; MB, Manitoba; NB, New Brunswick; NL, Newfoundland and Labrador; NS, Nova Scotia; ON, Ontario; PE, Prince Edward Island; QC, Quebec; SK, Saskatchewan; TC, All Territories (Yukon, Northwest Territories and Nunavut).
Comments
The etiology of HL remains incompletely characterized. Known risk factors for HL include infectious agents, a compromised immune system, genetic factors, and social and environmental factors. EBV, a ubiquitous virus infecting 80% to 100% of people worldwide, plays a causative role in the etiology of the neoplasm.52,268,269 The EBV genome is present in approximately 50% of the lymphoma cells of cases.86 Patients with immunodeficiences or autoimmune diseases are at elevated risk of HL.86 For instance, a systematic review shows an 11-fold increase in risk of HL in people with HIV/AIDS.270 Familial aggregation of HL has been observed. Having a parent with the disease increases the risk 3-fold.271 The familial risks are higher in males and in siblings.271
Recent reviews report that ever smoking is associated with a 10% to 15% increased risk of HL,272,273 functioning in a dose-dependent manner.272 Socioeconomic status in childhood is also linked to the risk. High childhood socioeconomic status, single family housing, small family size and high maternal education increase HL risk.274 It has been speculated that these social environments delay exposure to common infections which facilitate immune maturation.274
The bimodal age distribution of the incidence is expected to be the same in developed countries.275 EBV is more commonly associated with HL cases in older adults or younger children, possibly suggesting an alternate age-dependent pathway.268 HIV plays a role in developing HL in young people.275
21. Non-Hodgkin lymphoma
In 2003–2007, non-Hodgkin lymphoma (NHL) was the fifth most common type of new cancer diagnosis in Canadian males and females, and the most common lymphohematopoietic cancer. The average annual number of newly diagnosed NHL cases in this period was 3455 for males and 2915 for females, representing 4.3% and 3.9% of all new male and female cancer cases, respectively (Tables 4.21.1 and 4.21.2). The lifetime risk for developing NHL is 2.4% in males and 1.9% in females.1 NHL was the second most common (9.4%) incident cancer in males younger than 45 in 2003–2007 (Figure 3.9). The ASIRs of NHL increased with age to 122.0 per 100 000 in men aged 85 and over and to a maximum of 81.7 per 100 000 in women aged 75 to 84; the increase was less pronounced in women than in men (Tables 4.21.3 and 4.21.4). Overall, NHL occurred nearly 1.5 times as often in males as in females. More than 70% of all incident NHL cases occurred in people aged 55 or older (Tables 4.21.1 and 4.20.2). NHL has an intermediate 5-year relative survival rate among all cancers in Canada, at 65% in males and 69% in females for 2006–2008.1
TABLE 4.21.1.
Observed (2003–2007) and projected average annual new cases by age and province/territories combined (TC), non-Hodgkin lymphoma, males, Canada, 2003–2032
| Period | Age | New cases | |||||||||||
|---|---|---|---|---|---|---|---|---|---|---|---|---|---|
| CA | BC | AB | SK | MB | ON | QC | NB | NS | PE | NL | TC | ||
| 2003–07 | <45 | 445 | 60 | 45 | 10 | 15 | 185 | 100 | 10 | 15 | 0 | 5 | 0 |
| 45–54 | 495 | 60 | 45 | 15 | 15 | 200 | 115 | 15 | 20 | 0 | 5 | 0 | |
| 55–64 | 740 | 105 | 65 | 20 | 30 | 280 | 180 | 25 | 25 | 5 | 10 | 0 | |
| 65–74 | 860 | 115 | 80 | 30 | 35 | 340 | 195 | 20 | 30 | 5 | 10 | 0 | |
| 75–84 | 730 | 110 | 60 | 25 | 30 | 280 | 175 | 20 | 20 | 5 | 10 | 0 | |
| 85+ | 185 | 30 | 20 | 10 | 5 | 70 | 35 | 5 | 5 | 0 | 0 | 0 | |
| Total | 3455 | 480 | 310 | 110 | 130 | 1355 | 800 | 95 | 110 | 15 | 45 | 5 | |
| 2008–12 | <45 | 400 | 55 | 45 | 10 | 10 | 165 | 90 | 10 | 10 | 0 | 5 | 0 |
| 45–54 | 530 | 65 | 50 | 20 | 20 | 210 | 120 | 15 | 20 | 0 | 10 | 0 | |
| 55–64 | 880 | 120 | 80 | 25 | 30 | 345 | 195 | 25 | 30 | 5 | 15 | 0 | |
| 65–74 | 1025 | 150 | 90 | 30 | 35 | 395 | 235 | 30 | 35 | 5 | 15 | 0 | |
| 75–84 | 855 | 125 | 75 | 30 | 30 | 335 | 205 | 20 | 25 | 5 | 5 | 0 | |
| 85+ | 275 | 50 | 25 | 10 | 10 | 100 | 65 | 10 | 10 | 0 | 0 | 0 | |
| Total | 3970 | 555 | 365 | 125 | 145 | 1550 | 915 | 105 | 130 | 20 | 50 | 10 | |
| 2013–17 | <45 | 395 | 60 | 40 | 10 | 10 | 165 | 85 | 10 | 10 | 0 | 5 | 0 |
| 45–54 | 490 | 55 | 50 | 15 | 15 | 200 | 105 | 15 | 20 | 0 | 10 | 0 | |
| 55–64 | 955 | 130 | 95 | 30 | 30 | 370 | 210 | 30 | 35 | 5 | 15 | 5 | |
| 65–74 | 1295 | 185 | 115 | 35 | 45 | 510 | 290 | 35 | 45 | 5 | 15 | 5 | |
| 75–84 | 1005 | 145 | 85 | 30 | 40 | 390 | 240 | 25 | 30 | 5 | 10 | 0 | |
| 85+ | 375 | 60 | 35 | 15 | 15 | 145 | 90 | 10 | 10 | 0 | 0 | 0 | |
| Total | 4515 | 630 | 420 | 140 | 155 | 1775 | 1025 | 120 | 145 | 20 | 55 | 10 | |
| 2018–22 | <45 | 400 | 65 | 40 | 15 | 10 | 165 | 85 | 10 | 10 | 0 | 5 | 0 |
| 45–54 | 410 | 40 | 45 | 15 | 15 | 170 | 90 | 10 | 15 | 0 | 10 | 0 | |
| 55–64 | 995 | 130 | 95 | 35 | 35 | 400 | 210 | 25 | 35 | 5 | 15 | 5 | |
| 65–74 | 1545 | 210 | 145 | 45 | 55 | 615 | 335 | 40 | 55 | 10 | 20 | 5 | |
| 75–84 | 1245 | 185 | 110 | 35 | 45 | 470 | 300 | 30 | 35 | 5 | 10 | 0 | |
| 85+ | 470 | 70 | 45 | 15 | 15 | 180 | 110 | 10 | 15 | 0 | 0 | 0 | |
| Total | 5060 | 700 | 475 | 155 | 170 | 2000 | 1140 | 130 | 165 | 25 | 60 | 10 | |
| 2023–27 | <45 | 410 | 70 | 40 | 15 | 10 | 170 | 90 | 10 | 10 | 0 | 5 | 0 |
| 45–54 | 380 | 45 | 35 | 15 | 15 | 155 | 85 | 10 | 10 | 0 | 5 | 0 | |
| 55–64 | 930 | 110 | 95 | 30 | 35 | 385 | 190 | 25 | 35 | 5 | 15 | 0 | |
| 65–74 | 1685 | 225 | 165 | 55 | 50 | 670 | 365 | 45 | 55 | 10 | 20 | 5 | |
| 75–84 | 1605 | 230 | 140 | 40 | 55 | 615 | 380 | 35 | 50 | 10 | 15 | 5 | |
| 85+ | 580 | 90 | 50 | 15 | 20 | 220 | 140 | 15 | 15 | 0 | 0 | 0 | |
| Total | 5590 | 765 | 525 | 175 | 185 | 2215 | 1250 | 140 | 180 | 25 | 65 | 10 | |
| 2028–32 | <45 | 405 | 70 | 40 | 15 | 10 | 175 | 85 | 10 | 10 | 0 | 5 | 0 |
| 45–54 | 385 | 50 | 40 | 20 | 10 | 150 | 85 | 10 | 10 | 0 | 5 | 0 | |
| 55–64 | 795 | 85 | 80 | 30 | 30 | 330 | 165 | 25 | 25 | 5 | 15 | 0 | |
| 65–74 | 1790 | 230 | 170 | 60 | 60 | 725 | 375 | 45 | 65 | 10 | 25 | 5 | |
| 75–84 | 1940 | 265 | 180 | 55 | 65 | 750 | 450 | 45 | 60 | 10 | 15 | 5 | |
| 85+ | 735 | 115 | 70 | 20 | 20 | 275 | 180 | 20 | 20 | 5 | 5 | 0 | |
| Total | 6050 | 820 | 570 | 195 | 200 | 2405 | 1345 | 150 | 195 | 30 | 70 | 15 | |
Abbreviations: AB, Alberta; BC, British Columbia; CA, Canada; MB, Manitoba; NB, New Brunswick; NL, Newfoundland and Labrador; NS, Nova Scotia; ON, Ontario; PE, Prince Edward Island; QC, Quebec; SK, Saskatchewan; TC, All Territories (Yukon, Northwest Territories and Nunavut).
Note: Totals may not add up due to rounding.
TABLE 4.21.2.
Observed (2003–2007) and projected average annual new cases by age and province/territories combined (TC), non-Hodgkin lymphoma, females, Canada, 2003–2032
| Period | Age | New cases | |||||||||||
|---|---|---|---|---|---|---|---|---|---|---|---|---|---|
| CA | BC | AB | SK | MB | ON | QC | NB | NS | PE | NL | TC | ||
| 2003–07 | <45 | 290 | 35 | 30 | 10 | 10 | 125 | 60 | 5 | 10 | 0 | 5 | 0 |
| 45–54 | 355 | 45 | 30 | 10 | 15 | 140 | 80 | 15 | 10 | 5 | 5 | 0 | |
| 55–64 | 595 | 70 | 50 | 15 | 20 | 235 | 145 | 20 | 20 | 5 | 10 | 0 | |
| 65–74 | 680 | 85 | 55 | 20 | 25 | 270 | 175 | 15 | 20 | 5 | 10 | 0 | |
| 75–84 | 715 | 100 | 55 | 25 | 30 | 270 | 170 | 20 | 25 | 5 | 10 | 0 | |
| 85+ | 275 | 35 | 25 | 10 | 20 | 100 | 75 | 10 | 10 | 0 | 0 | 0 | |
| Total | 2915 | 375 | 245 | 95 | 115 | 1145 | 705 | 75 | 95 | 15 | 40 | 5 | |
| 2008–12 | <45 | 300 | 35 | 30 | 10 | 10 | 130 | 60 | 5 | 10 | 0 | 5 | 0 |
| 45–54 | 420 | 50 | 40 | 15 | 15 | 165 | 95 | 15 | 15 | 0 | 10 | 0 | |
| 55–64 | 685 | 85 | 60 | 20 | 25 | 270 | 165 | 20 | 25 | 5 | 15 | 0 | |
| 65–74 | 795 | 110 | 65 | 20 | 25 | 310 | 195 | 20 | 25 | 5 | 15 | 0 | |
| 75–84 | 775 | 100 | 65 | 25 | 30 | 300 | 190 | 20 | 20 | 5 | 10 | 0 | |
| 85+ | 350 | 50 | 30 | 15 | 15 | 130 | 85 | 10 | 10 | 0 | 0 | 0 | |
| Total | 3330 | 430 | 295 | 100 | 120 | 1300 | 790 | 90 | 110 | 15 | 50 | 5 | |
| 2013–17 | <45 | 300 | 35 | 35 | 10 | 10 | 135 | 65 | 5 | 10 | 0 | 5 | 0 |
| 45–54 | 425 | 50 | 40 | 15 | 15 | 170 | 90 | 10 | 15 | 0 | 10 | 0 | |
| 55–64 | 785 | 100 | 70 | 20 | 25 | 305 | 185 | 25 | 30 | 5 | 15 | 0 | |
| 65–74 | 985 | 135 | 85 | 25 | 30 | 380 | 235 | 25 | 30 | 5 | 15 | 0 | |
| 75–84 | 855 | 110 | 75 | 25 | 25 | 330 | 210 | 20 | 25 | 5 | 10 | 0 | |
| 85+ | 430 | 60 | 45 | 15 | 20 | 160 | 105 | 10 | 10 | 0 | 0 | 0 | |
| Total | 3780 | 490 | 350 | 110 | 130 | 1475 | 880 | 95 | 120 | 15 | 55 | 5 | |
| 2018–22 | <45 | 300 | 40 | 35 | 10 | 10 | 135 | 60 | 5 | 10 | 0 | 5 | 0 |
| 45–54 | 420 | 45 | 40 | 10 | 20 | 165 | 85 | 10 | 15 | 0 | 10 | 0 | |
| 55–64 | 870 | 110 | 80 | 25 | 25 | 340 | 195 | 25 | 30 | 5 | 15 | 0 | |
| 65–74 | 1160 | 160 | 110 | 30 | 35 | 450 | 265 | 30 | 40 | 5 | 20 | 5 | |
| 75–84 | 1005 | 140 | 90 | 25 | 30 | 380 | 240 | 25 | 30 | 5 | 10 | 0 | |
| 85+ | 505 | 65 | 55 | 15 | 20 | 190 | 125 | 10 | 10 | 0 | 0 | 0 | |
| Total | 4255 | 555 | 410 | 115 | 140 | 1660 | 975 | 110 | 135 | 20 | 65 | 10 | |
| 2023–27 | <45 | 300 | 40 | 40 | 10 | 15 | 140 | 65 | 5 | 10 | 0 | 5 | 0 |
| 45–54 | 415 | 45 | 40 | 10 | 20 | 165 | 85 | 10 | 15 | 0 | 10 | 0 | |
| 55–64 | 865 | 110 | 85 | 20 | 30 | 345 | 180 | 25 | 30 | 5 | 15 | 0 | |
| 65–74 | 1320 | 185 | 125 | 30 | 40 | 505 | 300 | 30 | 45 | 5 | 25 | 5 | |
| 75–84 | 1250 | 170 | 110 | 30 | 35 | 480 | 290 | 35 | 40 | 5 | 15 | 0 | |
| 85+ | 565 | 80 | 60 | 15 | 20 | 210 | 140 | 10 | 15 | 0 | 5 | 0 | |
| Total | 4720 | 630 | 465 | 120 | 155 | 1840 | 1060 | 120 | 145 | 20 | 70 | 10 | |
| 2028–32 | <45 | 295 | 45 | 40 | 10 | 15 | 140 | 65 | 5 | 10 | 0 | 5 | 0 |
| 45–54 | 420 | 50 | 45 | 15 | 20 | 165 | 85 | 10 | 15 | 0 | 10 | 0 | |
| 55–64 | 850 | 105 | 80 | 20 | 35 | 335 | 175 | 20 | 25 | 5 | 15 | 0 | |
| 65–74 | 1455 | 205 | 140 | 35 | 40 | 565 | 315 | 35 | 45 | 5 | 25 | 5 | |
| 75–84 | 1475 | 205 | 145 | 30 | 40 | 565 | 335 | 40 | 45 | 5 | 20 | 5 | |
| 85+ | 685 | 95 | 70 | 15 | 25 | 255 | 165 | 15 | 15 | 5 | 5 | 0 | |
| Total | 5180 | 700 | 520 | 125 | 175 | 2025 | 1135 | 130 | 160 | 25 | 70 | 10 | |
Abbreviations: AB, Alberta; BC, British Columbia; CA, Canada; MB, Manitoba; NB, New Brunswick; NL, Newfoundland and Labrador; NS, Nova Scotia; ON, Ontario; PE, Prince Edward Island; QC, Quebec; SK, Saskatchewan; TC, All Territories (Yukon, Northwest Territories and Nunavut).
Note: Totals may not add up due to rounding.
TABLE 4.21.3.
Observed (2003–2007) and projected age-standardized incidence rates (ASIRs) by age and province/territories combined (TC), non-Hodgkin lymphoma, males, Canada, 2003–2032
| Period | Age | ASIRs | |||||||||||
|---|---|---|---|---|---|---|---|---|---|---|---|---|---|
| CA | BC | AB | SK | MB | ON | QC | NB | NS | PE | NL | TC | ||
| 2003–07 | <45 | 4.3 | 4.5 | 3.8 | 3.9 | 4.1 | 4.5 | 4.1 | 4.7 | 4.3 | 4.2 | 3.7 | 2.2 |
| 45–54 | 20.0 | 18.6 | 18.1 | 20.3 | 16.9 | 21.4 | 19.1 | 22.9 | 25.8 | 13.6 | 16.9 | 13.0 | |
| 55–64 | 43.2 | 44.6 | 41.9 | 40.9 | 49.1 | 44.4 | 40.7 | 51.4 | 44.0 | 66.9 | 29.4 | 25.6 | |
| 65–74 | 80.0 | 77.5 | 85.6 | 82.7 | 91.5 | 83.8 | 72.8 | 80.0 | 81.3 | 89.2 | 54.3 | 101.6 | |
| 75–84 | 117.8 | 121.1 | 117.9 | 116.5 | 123.3 | 116.8 | 119.3 | 122.0 | 114.1 | 95.7 | 89.7 | 122.7 | |
| 85+ | 122.0 | 124.0 | 140.7 | 135.8 | 100.2 | 122.8 | 117.4 | 160.3 | 104.4 | 79.7 | 53.6 | 0.0 | |
| Total | 19.7 | 19.8 | 19.7 | 19.6 | 20.6 | 20.4 | 18.9 | 21.6 | 20.2 | 20.5 | 14.4 | 16.4 | |
| 2008–12 | <45 | 4.0 | 4.1 | 3.6 | 4.0 | 3.2 | 4.3 | 4.0 | 4.6 | 4.1 | 4.2 | 3.9 | 4.2 |
| 45–54 | 19.3 | 17.6 | 17.7 | 23.8 | 19.3 | 19.8 | 18.3 | 22.9 | 26.4 | 20.2 | 21.2 | 18.4 | |
| 55–64 | 42.8 | 42.0 | 41.0 | 42.1 | 45.9 | 45.3 | 38.8 | 47.2 | 48.4 | 44.8 | 34.5 | 37.5 | |
| 65–74 | 82.9 | 84.1 | 85.0 | 79.0 | 89.4 | 85.8 | 75.5 | 95.7 | 84.7 | 86.8 | 56.4 | 78.7 | |
| 75–84 | 122.8 | 120.8 | 128.4 | 125.7 | 131.4 | 123.7 | 122.4 | 110.2 | 120.0 | 128.6 | 62.9 | 119.7 | |
| 85+ | 131.8 | 146.8 | 133.7 | 128.6 | 132.0 | 122.9 | 139.4 | 153.1 | 118.9 | 138.0 | 48.9 | 126.1 | |
| Total | 19.9 | 19.9 | 19.7 | 20.1 | 20.4 | 20.5 | 19.0 | 21.8 | 21.1 | 20.9 | 14.5 | 19.0 | |
| 2013–17 | <45 | 3.8 | 4.3 | 3.2 | 4.1 | 3.1 | 4.1 | 3.8 | 4.7 | 4.1 | 4.0 | 4.0 | 4.1 |
| 45–54 | 17.9 | 14.2 | 17.8 | 23.1 | 18.4 | 18.3 | 17.2 | 22.5 | 25.3 | 18.8 | 22.1 | 18.2 | |
| 55–64 | 40.5 | 39.7 | 38.3 | 44.2 | 37.1 | 42.1 | 37.3 | 50.5 | 46.8 | 42.4 | 35.9 | 37.4 | |
| 65–74 | 83.0 | 82.0 | 83.6 | 78.9 | 87.1 | 87.2 | 74.8 | 86.8 | 91.3 | 87.0 | 58.5 | 78.2 | |
| 75–84 | 130.7 | 130.1 | 132.8 | 129.4 | 151.4 | 131.5 | 128.5 | 125.8 | 120.1 | 136.9 | 65.2 | 118.5 | |
| 85+ | 140.1 | 140.5 | 150.4 | 145.5 | 133.7 | 134.8 | 148.2 | 125.3 | 137.5 | 146.7 | 50.8 | 124.9 | |
| Total | 19.9 | 19.6 | 19.4 | 20.6 | 20.1 | 20.5 | 18.9 | 21.8 | 21.5 | 20.8 | 15.1 | 18.9 | |
| 2018–22 | <45 | 3.7 | 4.5 | 3.1 | 4.1 | 2.7 | 3.9 | 3.6 | 4.8 | 4.1 | 3.9 | 4.0 | 4.1 |
| 45–54 | 16.3 | 11.7 | 15.0 | 24.6 | 17.5 | 16.6 | 16.4 | 23.2 | 20.5 | 17.0 | 22.8 | 18.0 | |
| 55–64 | 38.3 | 36.4 | 34.7 | 45.0 | 38.5 | 39.5 | 34.9 | 46.8 | 47.5 | 40.1 | 36.9 | 37.0 | |
| 65–74 | 81.5 | 77.1 | 81.1 | 81.6 | 83.6 | 86.4 | 73.6 | 81.5 | 91.9 | 85.4 | 60.0 | 77.7 | |
| 75–84 | 134.1 | 135.7 | 134.0 | 124.5 | 143.7 | 133.8 | 131.6 | 137.5 | 126.3 | 140.4 | 66.8 | 118.2 | |
| 85+ | 148.4 | 144.6 | 159.1 | 159.9 | 139.7 | 143.9 | 154.1 | 130.5 | 156.9 | 155.4 | 52.1 | 123.8 | |
| Total | 19.5 | 19.1 | 18.7 | 21.0 | 19.4 | 20.1 | 18.6 | 21.7 | 21.6 | 20.4 | 15.4 | 18.8 | |
| 2023–27 | <45 | 3.7 | 4.5 | 2.9 | 4.1 | 2.8 | 3.9 | 3.7 | 4.9 | 4.2 | 3.8 | 4.1 | 4.0 |
| 45–54 | 15.0 | 12.2 | 12.4 | 25.7 | 15.5 | 15.4 | 14.7 | 23.6 | 20.1 | 15.7 | 23.2 | 17.5 | |
| 55–64 | 35.8 | 30.2 | 34.1 | 43.8 | 38.1 | 36.8 | 33.0 | 44.5 | 46.1 | 37.5 | 37.4 | 36.0 | |
| 65–74 | 77.1 | 72.0 | 74.2 | 85.3 | 70.1 | 80.4 | 71.0 | 83.4 | 87.0 | 80.7 | 60.7 | 75.6 | |
| 75–84 | 133.4 | 129.5 | 128.6 | 125.8 | 143.9 | 135.4 | 130.6 | 119.2 | 133.8 | 139.7 | 67.6 | 114.8 | |
| 85+ | 156.8 | 156.5 | 158.0 | 157.6 | 170.3 | 151.0 | 162.6 | 151.5 | 140.6 | 164.2 | 52.7 | 120.3 | |
| Total | 18.9 | 18.2 | 17.6 | 21.3 | 18.5 | 19.4 | 18.1 | 21.2 | 21.2 | 19.8 | 15.6 | 18.2 | |
| 2028–32 | <45 | 3.6 | 4.5 | 2.8 | 4.1 | 2.8 | 3.9 | 3.5 | 4.9 | 4.2 | 3.7 | 4.1 | 3.9 |
| 45–54 | 14.4 | 13.1 | 12.0 | 25.7 | 12.9 | 14.3 | 14.6 | 24.0 | 20.2 | 15.1 | 23.5 | 17.0 | |
| 55–64 | 32.6 | 24.8 | 29.4 | 46.3 | 35.3 | 33.5 | 31.7 | 45.2 | 37.6 | 34.1 | 37.9 | 35.0 | |
| 65–74 | 73.3 | 66.1 | 68.1 | 86.1 | 73.2 | 76.0 | 67.0 | 76.7 | 90.5 | 76.8 | 61.4 | 72.9 | |
| 75–84 | 130.5 | 122.0 | 124.8 | 129.0 | 134.3 | 133.1 | 128.8 | 115.1 | 134.0 | 136.7 | 68.4 | 111.2 | |
| 85+ | 156.6 | 157.8 | 158.6 | 149.3 | 134.0 | 149.5 | 163.0 | 156.6 | 164.3 | 164.0 | 53.4 | 116.6 | |
| Total | 18.1 | 17.2 | 16.5 | 21.6 | 17.5 | 18.6 | 17.6 | 20.8 | 21.0 | 19.0 | 15.8 | 17.7 | |
Abbreviations: AB, Alberta; BC, British Columbia; CA, Canada; MB, Manitoba; NB, New Brunswick; NL, Newfoundland and Labrador; NS, Nova Scotia; ON, Ontario; PE, Prince Edward Island; QC, Quebec; SK, Saskatchewan; TC, All Territories (Yukon, Northwest Territories and Nunavut).
TABLE 4.21.4.
Observed (2003–2007) and projected age-standardized incidence rates (ASIRs) by age and province/territories combined (TC), non-Hodgkin lymphoma, females, Canada, 2003–2032
| Period | Age | ASIRs | |||||||||||
|---|---|---|---|---|---|---|---|---|---|---|---|---|---|
| CA | BC | AB | SK | MB | ON | QC | NB | NS | PE | NL | TC | ||
| 2003–07 | <45 | 2.9 | 2.7 | 2.6 | 3.6 | 2.6 | 3.2 | 2.5 | 2.9 | 3.3 | 2.5 | 2.8 | 2.7 |
| 45–54 | 14.2 | 13.2 | 12.9 | 13.6 | 16.7 | 14.7 | 13.3 | 21.4 | 15.8 | 23.6 | 15.0 | 2.9 | |
| 55–64 | 33.7 | 30.1 | 32.4 | 31.3 | 33.4 | 35.9 | 32.1 | 40.2 | 38.7 | 31.8 | 33.1 | 13.3 | |
| 65–74 | 57.2 | 55.0 | 57.8 | 55.7 | 55.6 | 58.7 | 57.3 | 45.4 | 58.5 | 58.2 | 53.0 | 67.0 | |
| 75–84 | 81.7 | 86.0 | 79.8 | 86.0 | 92.4 | 80.6 | 79.4 | 80.9 | 84.9 | 98.8 | 66.6 | 151.6 | |
| 85+ | 80.9 | 69.1 | 87.5 | 74.0 | 111.0 | 79.5 | 89.7 | 81.7 | 70.2 | 21.4 | 23.5 | 0.0 | |
| Total | 14.1 | 13.4 | 13.7 | 14.3 | 14.7 | 14.6 | 13.6 | 14.6 | 15.0 | 14.7 | 12.6 | 13.3 | |
| 2008–12 | <45 | 3.0 | 2.6 | 2.7 | 3.1 | 3.5 | 3.3 | 2.8 | 3.4 | 3.5 | 3.0 | 2.2 | 2.7 |
| 45–54 | 15.4 | 13.5 | 14.3 | 17.9 | 15.2 | 15.5 | 14.6 | 20.3 | 20.8 | 16.7 | 22.3 | 15.3 | |
| 55–64 | 32.1 | 29.1 | 30.9 | 29.8 | 31.6 | 33.7 | 30.9 | 38.0 | 38.9 | 32.4 | 34.6 | 29.6 | |
| 65–74 | 58.8 | 59.2 | 58.9 | 56.3 | 58.0 | 59.7 | 56.3 | 53.9 | 57.5 | 54.4 | 55.0 | 56.9 | |
| 75–84 | 85.2 | 82.2 | 90.4 | 87.6 | 84.4 | 85.5 | 82.0 | 90.9 | 81.6 | 81.7 | 58.3 | 86.1 | |
| 85+ | 80.9 | 84.9 | 92.5 | 77.3 | 92.6 | 79.6 | 79.2 | 78.3 | 71.7 | 72.7 | 30.5 | 66.4 | |
| Total | 14.4 | 13.6 | 14.3 | 14.4 | 14.7 | 14.8 | 13.8 | 15.6 | 15.6 | 14.0 | 13.1 | 13.7 | |
| 2013–17 | <45 | 3.0 | 2.6 | 2.8 | 3.3 | 3.4 | 3.3 | 2.8 | 3.5 | 3.5 | 3.0 | 2.2 | 2.8 |
| 45–54 | 15.9 | 13.5 | 15.3 | 17.5 | 17.3 | 15.5 | 14.8 | 20.7 | 21.1 | 16.9 | 23.1 | 15.5 | |
| 55–64 | 32.2 | 29.7 | 30.3 | 28.9 | 32.3 | 32.8 | 31.5 | 38.5 | 39.4 | 32.8 | 35.9 | 30.3 | |
| 65–74 | 58.4 | 56.9 | 58.0 | 57.0 | 54.4 | 59.8 | 54.7 | 54.7 | 58.3 | 54.8 | 56.8 | 58.0 | |
| 75–84 | 88.5 | 86.0 | 94.3 | 85.6 | 81.5 | 87.9 | 85.6 | 92.1 | 82.6 | 82.2 | 60.2 | 87.7 | |
| 85+ | 84.4 | 83.2 | 103.1 | 84.5 | 97.4 | 82.0 | 81.6 | 79.4 | 72.6 | 73.3 | 31.6 | 67.3 | |
| Total | 14.5 | 13.6 | 14.6 | 14.4 | 14.6 | 14.8 | 13.9 | 15.8 | 15.8 | 14.1 | 13.5 | 14.0 | |
| 2018–22 | <45 | 2.8 | 2.6 | 2.9 | 3.4 | 3.3 | 3.2 | 2.7 | 3.5 | 3.5 | 3.0 | 2.2 | 2.8 |
| 45–54 | 16.7 | 13.0 | 15.3 | 17.2 | 21.1 | 16.0 | 16.1 | 20.9 | 21.3 | 16.9 | 23.7 | 15.7 | |
| 55–64 | 32.9 | 30.2 | 30.3 | 32.7 | 31.1 | 32.9 | 31.5 | 38.9 | 39.8 | 32.8 | 36.7 | 30.3 | |
| 65–74 | 56.6 | 54.6 | 58.1 | 50.1 | 50.4 | 57.9 | 53.6 | 55.2 | 58.8 | 55.1 | 58.0 | 58.5 | |
| 75–84 | 89.2 | 89.2 | 91.5 | 77.7 | 83.1 | 88.6 | 84.3 | 92.9 | 83.3 | 82.7 | 61.5 | 88.7 | |
| 85+ | 89.7 | 82.7 | 110.3 | 86.5 | 89.0 | 88.0 | 88.1 | 80.1 | 73.2 | 73.2 | 32.4 | 67.9 | |
| Total | 14.5 | 13.6 | 14.6 | 14.1 | 14.6 | 14.8 | 13.9 | 15.9 | 15.9 | 14.2 | 13.7 | 14.1 | |
| 2023–27 | <45 | 2.7 | 2.7 | 3.1 | 3.4 | 3.3 | 3.1 | 2.7 | 3.6 | 3.5 | 3.0 | 2.2 | 2.8 |
| 45–54 | 16.4 | 12.2 | 14.1 | 17.5 | 20.7 | 16.1 | 15.6 | 21.0 | 21.4 | 16.9 | 24.0 | 15.5 | |
| 55–64 | 33.2 | 30.0 | 31.6 | 30.7 | 34.4 | 32.6 | 31.4 | 39.1 | 40.0 | 32.8 | 37.2 | 30.2 | |
| 65–74 | 56.5 | 55.3 | 55.9 | 48.6 | 52.4 | 56.4 | 54.5 | 55.4 | 59.0 | 54.8 | 58.7 | 58.2 | |
| 75–84 | 87.6 | 84.8 | 89.0 | 76.5 | 78.3 | 87.8 | 81.9 | 93.3 | 83.7 | 82.5 | 62.1 | 87.7 | |
| 85+ | 90.7 | 88.9 | 110.1 | 78.0 | 90.5 | 87.3 | 89.3 | 80.4 | 73.5 | 73.5 | 32.8 | 67.3 | |
| Total | 14.4 | 13.5 | 14.5 | 13.7 | 14.8 | 14.6 | 13.8 | 16.0 | 16.0 | 14.2 | 13.9 | 14.0 | |
| 2028–32 | <45 | 2.6 | 2.7 | 3.1 | 3.5 | 3.3 | 3.0 | 2.7 | 3.6 | 3.6 | 3.0 | 2.2 | 2.7 |
| 45–54 | 15.4 | 12.4 | 14.6 | 17.9 | 20.6 | 15.3 | 14.6 | 21.1 | 21.6 | 16.8 | 24.4 | 15.4 | |
| 55–64 | 34.6 | 29.0 | 31.3 | 29.8 | 41.8 | 33.4 | 33.8 | 39.3 | 40.2 | 32.5 | 37.6 | 29.9 | |
| 65–74 | 57.1 | 55.9 | 55.8 | 52.6 | 49.8 | 56.3 | 53.9 | 55.7 | 59.3 | 54.6 | 59.3 | 57.6 | |
| 75–84 | 84.7 | 82.1 | 88.3 | 65.8 | 73.7 | 84.8 | 80.1 | 93.7 | 84.0 | 81.8 | 62.8 | 87.5 | |
| 85+ | 90.4 | 89.7 | 102.9 | 68.9 | 93.1 | 88.3 | 85.9 | 80.8 | 73.8 | 72.6 | 33.2 | 66.9 | |
| Total | 14.3 | 13.4 | 14.4 | 13.5 | 15.1 | 14.4 | 13.8 | 16.1 | 16.0 | 14.1 | 14.0 | 13.9 | |
Abbreviations: AB, Alberta; BC, British Columbia; CA, Canada; MB, Manitoba; NB, New Brunswick; NL, Newfoundland and Labrador; NS, Nova Scotia; ON, Ontario; PE, Prince Edward Island; QC, Quebec; SK, Saskatchewan; TC, All Territories (Yukon, Northwest Territories and Nunavut).
Figure 4.21.1 indicates that overall incidence rates increased modestly in both sexes during the entire observation period. During 1998–2007, the ASIRs for NHL increased significantly in males by 0.8% per year and increased non-significantly in females by 0.5% (Figures 3.1 and 3.2). Figure 4.21.2 reveals that the incidence of NHL increased over the observation periods for age groups above 55 in both sexes. For age groups below 55, the rates increased to their peaks in 1993–1997 for men under 45 and women aged 45 to 54, and in 1998–2002 for the opposite age–sex combinations, and then rates decreased.
FIGURE 4.21.1. Age-standardized incidence rates (ASIRs) by region, non-Hodgkin lymphoma, 1983–2032.

FIGURE 4.21.2. Age-standardized incidence rates (ASIRs) for non-Hodgkin lymphoma by age group (– males, – females), Canada, 1983–2032.

The incidence rates of NHL in males are predicted to peak (at 19.9 per 100 000) in 2008–2012 and then decrease slightly, while the rates in females will peak in 2013–2017 and then level off (Figure 4.21.1). The projected flat trajectory of the rates might be because of a decrease in rates in later birth cohorts, especially in males.
Even though the rates were very similar for all regions in the most recent 2 to 3 observed periods, the rates in the Atlantic region are predicted to diverge slightly in the future in females. The Atlantic region had the most marked increase, and these rates are projected to stabilize. The rates in the other regions are expected to be consistent, changing marginally with the same pattern as for the country.
Figure 4.21.2 shows that the ASIRs in males and females are projected to converge in age groups under 75 and to diverge in older age groups.
From 2003–2007 to 2028–2032, the ASIRs for NHL in Canada are projected to decrease by 8% in males, from 19.7 to 18.1 per 100 000, and to remain relatively stable in females, from 14.1 to 14.3 per 100 000 (Tables 4.21.3 and 4.21.4). The annual number of new male cases is estimated to increase by 75%, from 3455 to 6050, and the annual number of new female cases, by 78%, from 2915 to 5180 (Tables 4.21.1 and 4.21.2).
Comments
The observed incidence patterns likely result from a combination of improved detection and classification of this complex set of diseases, as well as changes in suspected risk factors because most of the risks for NHL are unknown.36 Familial aggregations of NHL have been observed.276,277 Immunodeficiency is one of the best characterized and strongest known risk factors for NHL. Risk is increased whether the immunodeficiency is congenital, iatrogenic or acquired.278 NHL is over 50 times more common in patients with congenital or acquired immunodeficiency than in the general population.278 The increase in the prevalence of acquired immunodefi-ciency syndrome (AIDS) in the 1980s is responsible in part for increased incidence rates during that period.
Infectious agents of human T-cell lympho-tropic virus type 1 (HTLV-1), EBV and HCV have also been associated with an increased risk of NHL.47 A number of studies have pointed to a positive association between HCV infection and NHL,279,280 but a causal relationship is inconclusive.281 A meta-analysis of 23 epidemiological studies presented a pooled odds ratio of 5.7 (95% CI: 4.1–8.0).279 A more recent systematic review which included only studies with ≥100 cases reported a pooled relative risk of 2.5 (95% CI=2.1–3.0), with consistent risks for B- and T-cell subtypes.280
The projected increases of the Atlantic region's rates in females were based on the long-term steeply rising trends starting with much lower levels in earlier periods and are therefore less likely to continue and result in rates higher than for all other regions. Incidence data from the early 1990s should be accurate.282
The causes of NHL are still largely unknown. Recent analyses describe the biological and clinical heterogeneity within the NHLs according to histology, suggesting that future epidemiological investigations need to focus on NHL risks and causal factors according to subtype.283
22. Multiple myeloma
Multiple myeloma (MM), or plasma cell myeloma, is the third most common lymphohematopoietic cancer, after NHL and leukemia. During 2003–2007, the average annual number of newly diagnosed MM cases was 1065 for males and 875 for females in Canada, which represented 1.3% and 1.2% of all new male and female cancer cases, respectively (Tables 4.22.1 and 4.22.2). The estimated lifetime risk of developing MM is 1 in 131 for males and 1 in 157 for females.1 Incidence was rare below age 45, accounting for 2.8% and 2.3% of the respective male and female cases in 2003–2007, while nearly 56% to 58% of the cases were diagnosed in people aged 65 to 84 (Tables 4.22.1 and 4.22.2). The incidence rates increased gradually with age (Tables 4.22.3 and 4.22.4). The overall male-to-female ratio was 1.5. MM has a poor prognosis among all lymphohe-matopoietic cancers, with a 5-year survival rate of 43% in 2006–2008.1
TABLE 4.22.1.
Observed (2003–2007) and projected average annual new cases by age and province/territories combined (TC), multiple myeloma, males, Canada, 2003–2032
| Period | Age | New cases | |||||||||||
|---|---|---|---|---|---|---|---|---|---|---|---|---|---|
| CA | BC | AB | SK | MB | ON | QC | NB | NS | PE | NL | TC | ||
| 2003–07 | <45 | 30 | 5 | 5 | 0 | 0 | 15 | 5 | 0 | 0 | 0 | 0 | 0 |
| 45–54 | 110 | 10 | 10 | 5 | 5 | 45 | 25 | 0 | 0 | 0 | 0 | 0 | |
| 55–64 | 240 | 30 | 20 | 10 | 5 | 95 | 60 | 5 | 10 | 0 | 5 | 0 | |
| 65–74 | 295 | 30 | 30 | 10 | 10 | 110 | 80 | 10 | 10 | 0 | 5 | 0 | |
| 75–84 | 300 | 40 | 20 | 10 | 10 | 120 | 80 | 5 | 10 | 0 | 0 | 0 | |
| 85+ | 90 | 15 | 10 | 5 | 5 | 35 | 25 | 5 | 0 | 0 | 0 | 0 | |
| Total | 1065 | 130 | 95 | 35 | 35 | 425 | 270 | 25 | 30 | 10 | 10 | 0 | |
| 2008–12 | <45 | 30 | 5 | 5 | 0 | 0 | 10 | 10 | 0 | 0 | 0 | 0 | 0 |
| 45–54 | 130 | 15 | 10 | 5 | 5 | 60 | 30 | 0 | 5 | 0 | 0 | 0 | |
| 55–64 | 290 | 35 | 30 | 10 | 10 | 115 | 70 | 10 | 10 | 0 | 5 | 0 | |
| 65–74 | 365 | 40 | 35 | 10 | 10 | 140 | 95 | 10 | 10 | 5 | 5 | 0 | |
| 75–84 | 335 | 40 | 30 | 10 | 10 | 135 | 90 | 5 | 10 | 5 | 0 | 0 | |
| 85+ | 125 | 20 | 10 | 5 | 5 | 50 | 35 | 5 | 5 | 0 | 0 | 0 | |
| Total | 1270 | 150 | 115 | 35 | 40 | 510 | 330 | 30 | 35 | 10 | 10 | 5 | |
| 2013–17 | <45 | 35 | 5 | 5 | 0 | 0 | 10 | 10 | 0 | 0 | 0 | 0 | 0 |
| 45–54 | 130 | 10 | 10 | 5 | 5 | 60 | 35 | 0 | 5 | 0 | 0 | 0 | |
| 55–64 | 335 | 40 | 35 | 10 | 10 | 140 | 80 | 10 | 10 | 5 | 5 | 0 | |
| 65–74 | 480 | 55 | 45 | 10 | 15 | 185 | 120 | 15 | 15 | 5 | 5 | 0 | |
| 75–84 | 380 | 45 | 35 | 10 | 10 | 145 | 105 | 10 | 10 | 5 | 5 | 0 | |
| 85+ | 155 | 20 | 15 | 5 | 5 | 65 | 45 | 5 | 5 | 0 | 0 | 0 | |
| Total | 1515 | 175 | 135 | 40 | 45 | 615 | 385 | 35 | 40 | 10 | 15 | 5 | |
| 2018–22 | <45 | 40 | 5 | 5 | 0 | 0 | 10 | 10 | 0 | 0 | 0 | 0 | 0 |
| 45–54 | 120 | 10 | 10 | 5 | 5 | 50 | 30 | 0 | 5 | 0 | 0 | 0 | |
| 55–64 | 385 | 45 | 35 | 10 | 10 | 175 | 85 | 10 | 10 | 5 | 5 | 0 | |
| 65–74 | 585 | 70 | 60 | 15 | 15 | 230 | 140 | 15 | 15 | 5 | 5 | 0 | |
| 75–84 | 475 | 55 | 40 | 10 | 15 | 190 | 135 | 10 | 15 | 5 | 5 | 0 | |
| 85+ | 190 | 25 | 20 | 5 | 5 | 75 | 55 | 5 | 5 | 0 | 0 | 0 | |
| Total | 1790 | 205 | 165 | 45 | 50 | 730 | 455 | 40 | 45 | 15 | 15 | 5 | |
| 2023–27 | <45 | 40 | 5 | 5 | 0 | 0 | 15 | 10 | 0 | 0 | 0 | 0 | 0 |
| 45–54 | 130 | 10 | 10 | 5 | 5 | 50 | 30 | 0 | 5 | 0 | 0 | 0 | |
| 55–64 | 385 | 40 | 30 | 10 | 10 | 175 | 90 | 10 | 10 | 5 | 5 | 0 | |
| 65–74 | 680 | 80 | 75 | 20 | 20 | 285 | 160 | 20 | 20 | 5 | 5 | 0 | |
| 75–84 | 630 | 75 | 60 | 15 | 15 | 250 | 165 | 15 | 15 | 5 | 5 | 0 | |
| 85+ | 225 | 30 | 20 | 5 | 5 | 90 | 65 | 5 | 5 | 0 | 0 | 0 | |
| Total | 2085 | 240 | 195 | 50 | 55 | 860 | 520 | 45 | 55 | 15 | 15 | 5 | |
| 2028–32 | <45 | 40 | 5 | 5 | 0 | 0 | 15 | 10 | 0 | 0 | 0 | 0 | 0 |
| 45–54 | 135 | 15 | 10 | 5 | 5 | 50 | 35 | 0 | 5 | 0 | 0 | 0 | |
| 55–64 | 355 | 40 | 30 | 10 | 10 | 145 | 80 | 5 | 10 | 5 | 5 | 0 | |
| 65–74 | 780 | 90 | 75 | 20 | 20 | 350 | 175 | 20 | 20 | 5 | 5 | 0 | |
| 75–84 | 780 | 90 | 80 | 20 | 20 | 310 | 200 | 15 | 20 | 5 | 5 | 0 | |
| 85+ | 300 | 40 | 25 | 5 | 5 | 125 | 90 | 5 | 5 | 0 | 0 | 0 | |
| Total | 2395 | 275 | 225 | 55 | 65 | 995 | 585 | 50 | 60 | 20 | 15 | 5 | |
Abbreviations: AB, Alberta; BC, British Columbia; CA, Canada; MB, Manitoba; NB, New Brunswick; NL, Newfoundland and Labrador; NS, Nova Scotia; ON, Ontario; PE, Prince Edward Island; QC, Quebec; SK, Saskatchewan; TC, All Territories (Yukon, Northwest Territories and Nunavut).
Note: Totals may not add up due to rounding.
TABLE 4.22.2.
Observed (2003–2007) and projected average annual new cases by age and province/territories combined (TC), multiple myeloma, females, Canada, 2003–2032
| Period | Age | New cases | |||||||||||
|---|---|---|---|---|---|---|---|---|---|---|---|---|---|
| CA | BC | AB | SK | MB | ON | QC | NB | NS | PE | NL | TC | ||
| 2003–07 | <45 | 20 | 0 | 0 | 0 | 0 | 10 | 5 | 0 | 0 | 0 | 0 | 0 |
| 45–54 | 75 | 5 | 5 | 5 | 5 | 35 | 20 | 0 | 0 | 0 | 0 | 0 | |
| 55–64 | 165 | 15 | 15 | 5 | 5 | 65 | 45 | 5 | 5 | 0 | 0 | 0 | |
| 65–74 | 230 | 20 | 20 | 10 | 5 | 100 | 60 | 5 | 5 | 0 | 5 | 0 | |
| 75–84 | 275 | 30 | 20 | 10 | 10 | 115 | 70 | 5 | 5 | 0 | 5 | 0 | |
| 85+ | 110 | 10 | 5 | 0 | 5 | 45 | 30 | 0 | 5 | 0 | 0 | 0 | |
| Total | 875 | 90 | 70 | 25 | 30 | 370 | 230 | 20 | 25 | 5 | 10 | 0 | |
| 2008–12 | <45 | 20 | 0 | 0 | 0 | 0 | 10 | 5 | 0 | 0 | 0 | 0 | 0 |
| 45–54 | 95 | 10 | 10 | 5 | 5 | 45 | 20 | 0 | 0 | 0 | 0 | 0 | |
| 55–64 | 190 | 15 | 15 | 5 | 5 | 80 | 50 | 5 | 5 | 0 | 0 | 0 | |
| 65–74 | 265 | 25 | 25 | 10 | 5 | 110 | 65 | 5 | 5 | 0 | 5 | 0 | |
| 75–84 | 290 | 30 | 25 | 10 | 10 | 120 | 80 | 5 | 5 | 0 | 5 | 0 | |
| 85+ | 145 | 15 | 10 | 5 | 5 | 65 | 45 | 0 | 5 | 0 | 0 | 0 | |
| Total | 1000 | 100 | 85 | 30 | 30 | 425 | 265 | 25 | 25 | 5 | 10 | 0 | |
| 2013–17 | <45 | 15 | 0 | 0 | 0 | 0 | 10 | 5 | 0 | 0 | 0 | 0 | 0 |
| 45–54 | 100 | 10 | 10 | 5 | 5 | 55 | 20 | 0 | 0 | 0 | 0 | 0 | |
| 55–64 | 215 | 20 | 20 | 5 | 5 | 85 | 60 | 5 | 5 | 0 | 5 | 0 | |
| 65–74 | 335 | 35 | 30 | 10 | 10 | 135 | 85 | 10 | 10 | 0 | 5 | 0 | |
| 75–84 | 310 | 30 | 30 | 10 | 10 | 130 | 80 | 10 | 10 | 0 | 5 | 0 | |
| 85+ | 175 | 15 | 15 | 5 | 5 | 75 | 55 | 0 | 5 | 0 | 0 | 0 | |
| Total | 1150 | 115 | 100 | 30 | 35 | 485 | 300 | 25 | 30 | 5 | 15 | 0 | |
| 2018–22 | <45 | 20 | 0 | 0 | 0 | 0 | 10 | 5 | 0 | 0 | 0 | 0 | 0 |
| 45–54 | 90 | 10 | 10 | 0 | 5 | 40 | 15 | 0 | 0 | 0 | 0 | 0 | |
| 55–64 | 250 | 25 | 25 | 5 | 5 | 110 | 60 | 10 | 10 | 0 | 5 | 0 | |
| 65–74 | 395 | 40 | 35 | 10 | 10 | 160 | 100 | 10 | 10 | 0 | 5 | 0 | |
| 75–84 | 365 | 40 | 35 | 10 | 10 | 150 | 95 | 10 | 10 | 0 | 5 | 0 | |
| 85+ | 190 | 20 | 15 | 5 | 5 | 80 | 60 | 5 | 5 | 0 | 0 | 0 | |
| Total | 1310 | 130 | 120 | 35 | 40 | 555 | 335 | 30 | 35 | 5 | 15 | 0 | |
| 2023–27 | <45 | 20 | 0 | 0 | 0 | 0 | 10 | 5 | 0 | 0 | 0 | 0 | 0 |
| 45–54 | 85 | 10 | 10 | 0 | 5 | 40 | 15 | 0 | 0 | 0 | 0 | 0 | |
| 55–64 | 265 | 25 | 25 | 5 | 5 | 120 | 55 | 5 | 5 | 0 | 5 | 0 | |
| 65–74 | 445 | 45 | 40 | 15 | 10 | 175 | 115 | 10 | 10 | 0 | 5 | 0 | |
| 75–84 | 470 | 50 | 40 | 10 | 15 | 190 | 125 | 10 | 10 | 0 | 5 | 0 | |
| 85+ | 210 | 20 | 20 | 5 | 5 | 95 | 60 | 5 | 5 | 0 | 0 | 0 | |
| Total | 1495 | 155 | 140 | 40 | 45 | 630 | 375 | 35 | 40 | 5 | 15 | 0 | |
| 2028–32 | <45 | 20 | 0 | 0 | 0 | 0 | 10 | 5 | 0 | 0 | 0 | 0 | 0 |
| 45–54 | 90 | 10 | 10 | 5 | 5 | 45 | 20 | 0 | 0 | 0 | 0 | 0 | |
| 55–64 | 245 | 25 | 25 | 5 | 5 | 95 | 50 | 5 | 5 | 0 | 0 | 0 | |
| 65–74 | 515 | 60 | 50 | 15 | 15 | 225 | 120 | 10 | 10 | 0 | 5 | 0 | |
| 75–84 | 555 | 55 | 50 | 15 | 20 | 225 | 145 | 15 | 15 | 0 | 5 | 0 | |
| 85+ | 260 | 25 | 20 | 5 | 10 | 110 | 80 | 5 | 5 | 0 | 5 | 0 | |
| Total | 1685 | 180 | 155 | 45 | 50 | 710 | 415 | 35 | 45 | 5 | 20 | 0 | |
Abbreviations: AB, Alberta; BC, British Columbia; CA, Canada; MB, Manitoba; NB, New Brunswick; NL, Newfoundland and Labrador; NS, Nova Scotia; ON, Ontario; PE, Prince Edward Island; QC, Quebec; SK, Saskatchewan; TC, All Territories (Yukon, Northwest Territories and Nunavut).
Note: Totals may not add up due to rounding.
TABLE 4.22.3.
Observed (2003–2007) and projected age-standardized incidence rates (ASIRs) by age and province/territories combined (TC), multiple myeloma, males, Canada, 2003–2032
| Period | Age | ASIRs | |||||||||||
|---|---|---|---|---|---|---|---|---|---|---|---|---|---|
| CA | BC | AB | SK | MB | ON | QC | NB | NS | PE | NL | TC | ||
| 2003–07 | <45 | 0.3 | 0.2 | 0.2 | 0.2 | 0.4 | 0.3 | 0.3 | 0.2 | 0.4 | 0.0 | 0.2 | 0.0 |
| 45–54 | 4.3 | 3.6 | 3.9 | 4.3 | 4.2 | 5.0 | 4.4 | 3.0 | 1.8 | 11.8 | 4.4 | 0.0 | |
| 55–64 | 14.2 | 12.0 | 14.7 | 17.2 | 12.9 | 15.2 | 13.4 | 15.0 | 13.9 | 31.3 | 11.4 | 3.6 | |
| 65–74 | 27.3 | 21.1 | 31.8 | 25.8 | 22.9 | 27.0 | 29.6 | 37.8 | 26.2 | 47.1 | 19.2 | 59.5 | |
| 75–84 | 48.3 | 43.6 | 41.5 | 37.7 | 48.0 | 50.9 | 53.8 | 33.2 | 51.1 | 67.0 | 16.8 | 57.5 | |
| 85+ | 59.3 | 53.8 | 61.8 | 42.6 | 36.2 | 61.9 | 72.4 | 72.9 | 37.3 | 79.7 | 8.9 | 0.0 | |
| Total | 6.1 | 5.1 | 6.1 | 5.6 | 5.5 | 6.4 | 6.5 | 6.2 | 5.7 | 10.4 | 3.6 | 6.4 | |
| 2008–12 | <45 | 0.3 | 0.2 | 0.2 | 0.3 | 0.4 | 0.3 | 0.3 | 0.2 | 0.4 | 0.5 | 0.1 | 0.3 |
| 45–54 | 4.6 | 3.6 | 3.5 | 4.8 | 4.2 | 5.5 | 4.7 | 3.9 | 4.1 | 7.9 | 3.4 | 5.3 | |
| 55–64 | 14.0 | 11.9 | 14.2 | 14.5 | 11.2 | 14.9 | 13.5 | 14.6 | 12.9 | 23.9 | 9.6 | 15.8 | |
| 65–74 | 29.4 | 23.9 | 32.5 | 27.9 | 25.4 | 30.4 | 30.4 | 34.0 | 27.2 | 50.1 | 19.3 | 33.2 | |
| 75–84 | 47.9 | 38.5 | 48.4 | 41.5 | 43.8 | 49.7 | 54.0 | 43.9 | 45.1 | 81.8 | 21.9 | 54.2 | |
| 85+ | 59.9 | 57.6 | 58.7 | 41.6 | 46.5 | 60.6 | 74.6 | 56.8 | 47.8 | 102.2 | 7.0 | 67.7 | |
| Total | 6.2 | 5.2 | 6.3 | 5.8 | 5.5 | 6.5 | 6.7 | 6.3 | 5.8 | 10.7 | 3.4 | 7.1 | |
| 2013–17 | <45 | 0.3 | 0.2 | 0.2 | 0.3 | 0.4 | 0.3 | 0.4 | 0.2 | 0.4 | 0.6 | 0.1 | 0.4 |
| 45–54 | 4.7 | 3.3 | 2.8 | 4.8 | 4.2 | 5.3 | 5.2 | 3.8 | 4.1 | 8.0 | 3.4 | 5.3 | |
| 55–64 | 14.2 | 11.8 | 13.6 | 14.7 | 11.1 | 15.9 | 13.8 | 14.4 | 13.0 | 24.3 | 9.6 | 16.1 | |
| 65–74 | 30.7 | 25.4 | 32.8 | 28.4 | 25.3 | 32.1 | 30.5 | 34.4 | 27.3 | 52.3 | 19.0 | 34.7 | |
| 75–84 | 49.1 | 38.4 | 53.2 | 42.1 | 43.6 | 49.9 | 56.6 | 44.7 | 45.3 | 83.9 | 21.0 | 55.6 | |
| 85+ | 58.6 | 50.8 | 55.8 | 42.2 | 46.3 | 62.5 | 72.1 | 57.3 | 48.0 | 100.0 | 6.6 | 66.3 | |
| Total | 6.4 | 5.2 | 6.3 | 5.9 | 5.5 | 6.7 | 6.8 | 6.3 | 5.8 | 10.9 | 3.4 | 7.3 | |
| 2018–22 | <45 | 0.3 | 0.2 | 0.2 | 0.3 | 0.4 | 0.3 | 0.4 | 0.2 | 0.4 | 0.6 | 0.1 | 0.4 |
| 45–54 | 4.6 | 3.3 | 2.7 | 4.9 | 4.2 | 4.7 | 5.3 | 3.8 | 4.1 | 7.9 | 3.4 | 5.3 | |
| 55–64 | 14.8 | 12.2 | 12.3 | 14.9 | 11.1 | 17.3 | 14.3 | 14.2 | 13.0 | 25.2 | 9.6 | 16.7 | |
| 65–74 | 31.0 | 24.8 | 34.3 | 28.7 | 25.2 | 32.5 | 30.6 | 34.3 | 27.4 | 53.0 | 18.8 | 35.1 | |
| 75–84 | 50.9 | 40.1 | 51.9 | 42.5 | 43.4 | 53.3 | 57.9 | 45.4 | 45.4 | 86.9 | 20.5 | 57.6 | |
| 85+ | 60.5 | 51.9 | 63.3 | 42.6 | 46.1 | 61.6 | 76.2 | 58.4 | 48.1 | 103.4 | 6.4 | 68.5 | |
| Total | 6.6 | 5.2 | 6.3 | 5.9 | 5.4 | 6.9 | 7.0 | 6.3 | 5.8 | 11.2 | 3.3 | 7.4 | |
| 2023–27 | <45 | 0.3 | 0.2 | 0.2 | 0.3 | 0.4 | 0.3 | 0.4 | 0.2 | 0.4 | 0.6 | 0.1 | 0.4 |
| 45–54 | 5.0 | 3.3 | 2.7 | 4.9 | 4.2 | 4.7 | 5.3 | 3.7 | 4.1 | 8.5 | 3.4 | 5.7 | |
| 55–64 | 14.7 | 11.4 | 10.6 | 15.0 | 11.1 | 16.6 | 15.2 | 14.0 | 13.1 | 25.1 | 9.6 | 16.6 | |
| 65–74 | 31.2 | 25.2 | 33.5 | 28.8 | 25.1 | 34.2 | 30.7 | 33.8 | 27.4 | 53.3 | 18.7 | 35.3 | |
| 75–84 | 52.3 | 42.4 | 53.9 | 42.7 | 43.3 | 55.1 | 57.2 | 45.8 | 45.5 | 89.2 | 20.2 | 59.1 | |
| 85+ | 60.9 | 51.1 | 68.3 | 42.8 | 46.1 | 62.0 | 77.9 | 59.4 | 48.2 | 104.0 | 6.3 | 68.9 | |
| Total | 6.7 | 5.3 | 6.3 | 5.9 | 5.4 | 7.1 | 7.1 | 6.3 | 5.9 | 11.4 | 3.3 | 7.5 | |
| 2028–32 | <45 | 0.4 | 0.2 | 0.2 | 0.3 | 0.4 | 0.3 | 0.4 | 0.2 | 0.4 | 0.6 | 0.1 | 0.4 |
| 45–54 | 5.0 | 3.3 | 2.7 | 4.9 | 4.2 | 4.8 | 5.4 | 3.7 | 4.1 | 8.6 | 3.4 | 5.7 | |
| 55–64 | 14.5 | 11.4 | 10.5 | 15.1 | 11.0 | 14.9 | 15.3 | 13.8 | 13.1 | 24.7 | 9.6 | 16.4 | |
| 65–74 | 32.1 | 25.5 | 30.5 | 29.0 | 25.1 | 36.5 | 31.8 | 33.3 | 27.4 | 54.9 | 18.6 | 36.4 | |
| 75–84 | 52.6 | 41.3 | 55.5 | 42.9 | 43.3 | 55.6 | 57.2 | 45.6 | 45.5 | 89.8 | 19.9 | 59.5 | |
| 85+ | 63.8 | 55.8 | 62.7 | 43.0 | 46.0 | 68.0 | 78.8 | 60.2 | 48.2 | 108.9 | 6.2 | 72.2 | |
| Total | 6.8 | 5.3 | 6.0 | 6.0 | 5.4 | 7.2 | 7.2 | 6.2 | 5.9 | 11.5 | 3.3 | 7.6 | |
Abbreviations: AB, Alberta; BC, British Columbia; CA, Canada; MB, Manitoba; NB, New Brunswick; NL, Newfoundland and Labrador; NS, Nova Scotia; ON, Ontario; PE, Prince Edward Island; QC, Quebec; SK, Saskatchewan; TC, All Territories (Yukon, Northwest Territories and Nunavut).
TABLE 4.22.4.
Observed (2003–2007) and projected age-standardized incidence rates (ASIRs) by age and province/territories combined (TC), multiple myeloma, females, Canada, 2003–2032
| Period | Age | ASIRs | |||||||||||
|---|---|---|---|---|---|---|---|---|---|---|---|---|---|
| CA | BC | AB | SK | MB | ON | QC | NB | NS | PE | NL | TC | ||
| 2003–07 | <45 | 0.2 | 0.1 | 0.2 | 0.1 | 0.2 | 0.2 | 0.2 | 0.1 | 0.3 | 0.4 | 0.1 | 0.0 |
| 45–54 | 3.1 | 2.2 | 2.7 | 3.7 | 3.0 | 3.5 | 3.1 | 2.2 | 2.6 | 1.7 | 2.3 | 2.8 | |
| 55–64 | 9.4 | 6.4 | 10.7 | 10.8 | 7.5 | 9.8 | 9.6 | 15.9 | 10.0 | 13.9 | 3.2 | 0.0 | |
| 65–74 | 19.1 | 14.0 | 20.2 | 20.1 | 13.3 | 21.5 | 18.9 | 21.1 | 15.2 | 18.6 | 18.5 | 14.3 | |
| 75–84 | 31.2 | 26.6 | 30.0 | 23.9 | 33.0 | 33.9 | 33.1 | 25.4 | 24.7 | 11.9 | 21.6 | 0.0 | |
| 85+ | 32.3 | 23.3 | 26.3 | 14.0 | 36.2 | 37.8 | 38.7 | 21.0 | 25.5 | 10.7 | 7.8 | 0.0 | |
| Total | 4.0 | 3.0 | 4.1 | 3.8 | 3.6 | 4.5 | 4.2 | 4.2 | 3.6 | 3.5 | 2.7 | 1.3 | |
| 2008–12 | <45 | 0.2 | 0.1 | 0.2 | 0.1 | 0.1 | 0.2 | 0.2 | 0.1 | 0.3 | 0.3 | 0.1 | 0.1 |
| 45–54 | 3.4 | 2.8 | 2.7 | 3.6 | 3.2 | 4.3 | 3.0 | 2.7 | 2.6 | 3.1 | 2.3 | 1.1 | |
| 55–64 | 9.0 | 5.9 | 9.1 | 8.5 | 7.1 | 10.0 | 9.6 | 12.1 | 9.7 | 8.9 | 6.1 | 2.9 | |
| 65–74 | 19.4 | 14.6 | 21.2 | 20.8 | 15.7 | 21.3 | 18.9 | 18.4 | 15.8 | 16.0 | 13.1 | 6.3 | |
| 75–84 | 31.7 | 24.9 | 32.2 | 28.7 | 32.2 | 33.2 | 33.8 | 34.1 | 26.3 | 21.5 | 21.3 | 10.3 | |
| 85+ | 33.4 | 21.5 | 32.7 | 20.5 | 29.5 | 38.9 | 42.2 | 14.3 | 27.5 | 24.7 | 22.5 | 10.9 | |
| Total | 4.1 | 3.0 | 4.1 | 3.8 | 3.6 | 4.5 | 4.2 | 4.0 | 3.6 | 3.4 | 2.7 | 1.3 | |
| 2013–17 | <45 | 0.2 | 0.1 | 0.2 | 0.1 | 0.1 | 0.2 | 0.2 | 0.1 | 0.3 | 0.3 | 0.1 | 0.1 |
| 45–54 | 3.7 | 2.7 | 2.8 | 3.6 | 3.2 | 4.7 | 2.9 | 2.7 | 2.6 | 3.0 | 2.5 | 1.2 | |
| 55–64 | 8.9 | 5.5 | 9.0 | 8.7 | 7.1 | 9.4 | 9.9 | 12.1 | 9.8 | 8.3 | 6.0 | 2.9 | |
| 65–74 | 19.8 | 15.0 | 19.5 | 21.1 | 15.6 | 21.5 | 20.3 | 17.9 | 15.9 | 15.1 | 13.3 | 6.4 | |
| 75–84 | 31.9 | 24.5 | 36.5 | 29.2 | 32.1 | 34.2 | 32.4 | 33.5 | 26.5 | 20.8 | 21.5 | 10.4 | |
| 85+ | 33.9 | 22.4 | 33.0 | 20.9 | 29.3 | 37.8 | 42.3 | 17.9 | 27.7 | 24.0 | 22.8 | 11.0 | |
| Total | 4.1 | 3.0 | 4.2 | 3.9 | 3.5 | 4.5 | 4.3 | 4.0 | 3.6 | 3.2 | 2.8 | 1.3 | |
| 2018–22 | <45 | 0.2 | 0.1 | 0.2 | 0.1 | 0.1 | 0.2 | 0.2 | 0.1 | 0.3 | 0.3 | 0.1 | 0.1 |
| 45–54 | 3.6 | 2.6 | 2.9 | 3.6 | 3.2 | 3.9 | 3.0 | 2.7 | 2.6 | 2.8 | 2.4 | 1.2 | |
| 55–64 | 9.5 | 7.1 | 9.3 | 8.8 | 7.0 | 10.7 | 9.9 | 12.1 | 9.8 | 7.8 | 6.4 | 3.1 | |
| 65–74 | 19.2 | 13.3 | 19.1 | 21.3 | 15.6 | 20.7 | 20.4 | 17.6 | 16.0 | 14.2 | 12.9 | 6.3 | |
| 75–84 | 32.5 | 24.1 | 34.8 | 29.5 | 32.0 | 34.9 | 33.3 | 32.5 | 26.7 | 19.9 | 21.9 | 10.6 | |
| 85+ | 33.5 | 22.5 | 34.3 | 21.1 | 29.3 | 36.7 | 41.2 | 19.8 | 27.9 | 23.3 | 22.6 | 10.9 | |
| Total | 4.1 | 3.0 | 4.1 | 3.9 | 3.5 | 4.5 | 4.3 | 3.9 | 3.7 | 3.1 | 2.8 | 1.3 | |
| 2023–27 | <45 | 0.2 | 0.1 | 0.2 | 0.1 | 0.1 | 0.2 | 0.2 | 0.1 | 0.3 | 0.2 | 0.1 | 0.1 |
| 45–54 | 3.2 | 2.6 | 3.0 | 3.6 | 3.2 | 3.9 | 3.1 | 2.7 | 2.6 | 2.7 | 2.2 | 1.0 | |
| 55–64 | 10.1 | 7.1 | 9.4 | 8.8 | 7.0 | 11.2 | 9.5 | 12.1 | 9.9 | 7.4 | 6.8 | 3.3 | |
| 65–74 | 19.0 | 13.9 | 18.5 | 21.5 | 15.5 | 19.7 | 20.6 | 17.4 | 16.0 | 13.3 | 12.8 | 6.2 | |
| 75–84 | 32.8 | 25.4 | 32.1 | 29.6 | 32.0 | 34.9 | 34.6 | 32.3 | 26.7 | 18.7 | 22.1 | 10.7 | |
| 85+ | 33.9 | 22.3 | 39.5 | 21.2 | 29.2 | 38.8 | 38.4 | 18.7 | 27.9 | 22.4 | 22.8 | 11.0 | |
| Total | 4.2 | 3.0 | 4.1 | 4.0 | 3.5 | 4.5 | 4.3 | 3.9 | 3.7 | 2.9 | 2.8 | 1.4 | |
| 2028–32 | <45 | 0.2 | 0.1 | 0.2 | 0.1 | 0.1 | 0.2 | 0.2 | 0.1 | 0.3 | 0.2 | 0.1 | 0.1 |
| 45–54 | 3.2 | 2.5 | 3.0 | 3.6 | 3.2 | 3.9 | 3.1 | 2.7 | 2.6 | 2.5 | 2.2 | 1.1 | |
| 55–64 | 9.9 | 7.0 | 9.6 | 8.9 | 7.0 | 9.6 | 9.6 | 12.1 | 9.9 | 7.0 | 6.7 | 3.2 | |
| 65–74 | 20.2 | 16.7 | 18.8 | 21.6 | 15.5 | 22.3 | 20.3 | 17.3 | 16.1 | 12.4 | 13.6 | 6.6 | |
| 75–84 | 31.6 | 22.2 | 30.7 | 29.8 | 31.9 | 33.4 | 34.4 | 32.0 | 26.8 | 17.5 | 21.3 | 10.3 | |
| 85+ | 34.5 | 22.1 | 32.6 | 21.3 | 29.2 | 38.4 | 41.5 | 18.5 | 28.0 | 21.3 | 23.3 | 11.2 | |
| Total | 4.2 | 3.1 | 4.0 | 4.0 | 3.5 | 4.5 | 4.4 | 3.9 | 3.7 | 2.7 | 2.8 | 1.4 | |
Abbreviations: AB, Alberta; BC, British Columbia; CA, Canada; MB, Manitoba; NB, New Brunswick; NL, Newfoundland and Labrador; NS, Nova Scotia; ON, Ontario; PE, Prince Edward Island; QC, Quebec; SK, Saskatchewan; TC, All Territories (Yukon, Northwest Territories and Nunavut).
The overall incidence rates of MM have increased marginally throughout the whole observation period in males (Figure 4.22.1). The similar magnitude of the increase in females showed levelling off in the last 10 years. During 1998–2007, the ASIRs for MM increased non-significantly in males by 0.4% per year and were stable in females (Figures 3.1 and 3.2). Rate stabilization has been observed in all regions, the only variation being a decrease in British Columbia in the last period. The inter-regional differences in ASIRs were small, ranged from 5.0 to 6.7 per 100 000 in males and 3.0 to 4.5 in females.
FIGURE 4.22.1. Age-standardized incidence rates (ASIRs) by region, multiple myeloma, 1983–2032.

The incidence rates of MM in males are expected to increase by 3% to 13% in all regions from 2003–2007 to 2028–2032 (Figure 4.22.1). When the Atlantic region is not considered, the observed east–west gradient in male rates that started in 1998–2002 will remain over the next 25 years, with the highest rates in Quebec and the lowest rates in British Columbia. The rates in females are projected to stabilize in the Atlantic region and Ontario and increase marginally (4%–8%) in the other regions. Females in Ontario are predicted to experience the highest incidence, whereas those in British Columbia will have the lowest rates. The age-specific analysis illustrated in Figure 4.22.2 indicates that the ASIRs in Canada are expected to increase slightly or stabilize in each age group, resulting from continuation of their observed long-term trends.
FIGURE 4.22.2. Age-standardized incidence rates (ASIRs) for multiple myeloma by age group (– males, – females), Canada, 1983–2032.

From 2003–2007 to 2028–2032, the ASIRs of MM for the country are projected to increase by 11% in males, from 6.1 to 6.8 per 100 000, and by 4% in females, from 4.0 to 4.2 per 100 000 (Tables 4.22.3 and 4.22.4). The annual number of new male cases is projected to increase by 125%, from 1065 to 2395, and the number of new female cases is projected to increase by 92%, from 875 to 1685 (Tables 4.22.1 and 4.22.2).
Comments
In accordance with recent reports from Sweden, England and US,284–286 the overall incidence rates for MM increased marginally throughout the whole observation period in Canada. The apparent increasing trends of MM in Canada and worldwide may be due to improved diagnostic practices and better case ascertainment. The role of risk factors responsible for the trends in the disease frequency should also not be ruled out.
Other than older age, male gender, Black ethnicity, family history of lymphohemato-poietic cancer, and monoclonal gammopa-thy of undetermined significance (MGUS), there are few known risk factors for the clinical entity.287 However, several factors have been implicated as potentially etiolo-gic, although findings are inconsistent.
Numerous studies have reported increased risk of developing MM in people with a family history of cancer, specifically lym-phohematopoietic cancer, although the underlying mechanisms remain elusive and family history may be responsible for a relatively small proportion of new cases.287,288 MGUS, a condition of excessive plasma cell growth, has consistently been observed to progress to MM.287 Annual risk of progression from MGUS to MM is about 1%.289
Obesity has been associated consistently with an elevated risk of MM. Researchers at the Karolinsksa Institute, Stockholm, conducted a meta-analysis of 11 cohort studies and 4 case–control studies published from 1994 to May 2007.290 In the cohort studies, overweight and obese people have a 12% and 27% increase in risk of MM, respectively. For case-control studies, the summary estimates were significantly higher. This effect was independent of age, sex and ethnicity. Their recent systematic review of 15 cohort studies is in line with these findings.291
Chronic immune stimulation conditions or autoimmune disorders have not been consistently related to MM; however, the incidence of MM appears to be elevated in people with AIDS.287 A meta-analysis published in 2008 found that MM was 2.6 times more prevalent in HIV-infected people than the general population.292
23. Leukemia
Leukemia is the second most common lymphohematopoietic cancer diagnosed in Canadians, after NHL. During 2003–2007, the average annual number of new leukemia cases was 2570 for males and 1875 for females, making up 3.2% and 2.5% of all new male and female cancer cases, respectively (Tables 4.23.1 and 4.23.2). The lifetime risk of developing leukemia is 1 in 53 for males and 1 in 72 for females.1 The lifetime probability of dying from the disease is 1 in 96 for males and 1 in 125 for females. The 5-year relative survival rate for leukemia is intermediate among cancers, at 59% in males and females for 2006–2008 in Canada.1
TABLE 4.23.1.
Observed (2003–2007) and projected average annual new cases by age and province/territories combined (TC), leukemia, males, Canada, 2003–2032
| Period | Age | New cases | |||||||||||
|---|---|---|---|---|---|---|---|---|---|---|---|---|---|
| CA | BC | AB | SK | MB | ON | QC | NB | NS | PE | NL | TC | ||
| 2003–07 | <45 | 395 | 45 | 45 | 15 | 10 | 165 | 85 | 10 | 10 | 5 | 5 | 0 |
| 45–54 | 265 | 35 | 30 | 10 | 10 | 105 | 50 | 5 | 10 | 0 | 5 | 0 | |
| 55–64 | 460 | 65 | 45 | 15 | 15 | 190 | 95 | 10 | 15 | 5 | 5 | 0 | |
| 65–74 | 615 | 80 | 55 | 20 | 25 | 245 | 150 | 15 | 20 | 5 | 5 | 0 | |
| 75–84 | 620 | 80 | 55 | 25 | 25 | 250 | 155 | 10 | 15 | 5 | 0 | 0 | |
| 85+ | 215 | 30 | 15 | 10 | 10 | 75 | 60 | 5 | 5 | 0 | 0 | 0 | |
| Total | 2570 | 330 | 250 | 100 | 95 | 1030 | 600 | 55 | 75 | 15 | 20 | 5 | |
| 2008–12 | <45 | 415 | 50 | 50 | 15 | 10 | 180 | 90 | 5 | 10 | 0 | 5 | 0 |
| 45–54 | 300 | 40 | 35 | 10 | 10 | 135 | 55 | 5 | 10 | 0 | 0 | 0 | |
| 55–64 | 570 | 75 | 65 | 20 | 20 | 230 | 115 | 20 | 20 | 5 | 5 | 0 | |
| 65–74 | 710 | 90 | 65 | 25 | 25 | 290 | 170 | 15 | 20 | 5 | 5 | 0 | |
| 75–84 | 695 | 90 | 65 | 25 | 25 | 275 | 180 | 10 | 15 | 5 | 5 | 0 | |
| 85+ | 285 | 45 | 20 | 10 | 10 | 115 | 75 | 5 | 5 | 0 | 0 | 0 | |
| Total | 2980 | 390 | 295 | 105 | 100 | 1220 | 680 | 60 | 80 | 15 | 20 | 5 | |
| 2013–17 | <45 | 440 | 55 | 50 | 20 | 15 | 190 | 90 | 10 | 10 | 0 | 5 | 0 |
| 45–54 | 310 | 40 | 35 | 10 | 5 | 145 | 55 | 5 | 10 | 0 | 0 | 0 | |
| 55–64 | 660 | 85 | 75 | 20 | 25 | 275 | 125 | 20 | 20 | 5 | 5 | 0 | |
| 65–74 | 885 | 120 | 85 | 25 | 35 | 365 | 200 | 20 | 25 | 5 | 5 | 0 | |
| 75–84 | 780 | 105 | 70 | 25 | 25 | 315 | 195 | 15 | 20 | 5 | 5 | 0 | |
| 85+ | 365 | 55 | 30 | 10 | 15 | 145 | 100 | 5 | 10 | 0 | 0 | 0 | |
| Total | 3440 | 450 | 350 | 110 | 115 | 1430 | 775 | 70 | 90 | 15 | 20 | 5 | |
| 2018–22 | <45 | 465 | 60 | 50 | 20 | 15 | 205 | 95 | 10 | 10 | 0 | 5 | 0 |
| 45–54 | 295 | 35 | 35 | 10 | 5 | 140 | 50 | 0 | 5 | 0 | 0 | 0 | |
| 55–64 | 725 | 90 | 85 | 20 | 20 | 320 | 135 | 15 | 25 | 5 | 5 | 0 | |
| 65–74 | 1095 | 145 | 115 | 25 | 40 | 450 | 235 | 30 | 30 | 5 | 5 | 0 | |
| 75–84 | 940 | 125 | 85 | 25 | 30 | 385 | 235 | 15 | 20 | 5 | 5 | 0 | |
| 85+ | 430 | 65 | 35 | 10 | 15 | 170 | 120 | 5 | 10 | 0 | 0 | 0 | |
| Total | 3950 | 520 | 410 | 115 | 125 | 1675 | 870 | 80 | 100 | 15 | 20 | 5 | |
| 2023–27 | <45 | 485 | 65 | 55 | 20 | 15 | 215 | 95 | 10 | 10 | 0 | 5 | 0 |
| 45–54 | 295 | 35 | 30 | 10 | 5 | 140 | 55 | 0 | 5 | 0 | 0 | 0 | |
| 55–64 | 740 | 95 | 85 | 20 | 20 | 340 | 135 | 10 | 20 | 5 | 5 | 0 | |
| 65–74 | 1270 | 165 | 145 | 25 | 45 | 535 | 265 | 35 | 35 | 5 | 5 | 0 | |
| 75–84 | 1210 | 165 | 120 | 30 | 40 | 495 | 285 | 25 | 30 | 5 | 5 | 0 | |
| 85+ | 515 | 75 | 45 | 15 | 15 | 215 | 135 | 5 | 10 | 0 | 0 | 0 | |
| Total | 4515 | 595 | 480 | 120 | 145 | 1940 | 975 | 90 | 115 | 20 | 25 | 10 | |
| 2028–32 | <45 | 500 | 65 | 55 | 20 | 15 | 225 | 100 | 10 | 10 | 0 | 5 | 0 |
| 45–54 | 320 | 45 | 35 | 10 | 10 | 150 | 60 | 5 | 5 | 0 | 0 | 0 | |
| 55–64 | 705 | 85 | 85 | 20 | 20 | 330 | 125 | 10 | 20 | 5 | 5 | 0 | |
| 65–74 | 1410 | 180 | 160 | 30 | 45 | 625 | 280 | 30 | 35 | 5 | 5 | 0 | |
| 75–84 | 1515 | 205 | 160 | 35 | 50 | 620 | 345 | 35 | 40 | 5 | 5 | 0 | |
| 85+ | 645 | 95 | 55 | 10 | 20 | 265 | 175 | 10 | 15 | 5 | 0 | 0 | |
| Total | 5095 | 680 | 550 | 125 | 160 | 2220 | 1085 | 95 | 125 | 20 | 25 | 10 | |
Abbreviations: AB, Alberta; BC, British Columbia; CA, Canada; MB, Manitoba; NB, New Brunswick; NL, Newfoundland and Labrador; NS, Nova Scotia; ON, Ontario; PE, Prince Edward Island; QC, Quebec; SK, Saskatchewan; TC, All Territories (Yukon, Northwest Territories and Nunavut).
Note: Totals may not add up due to rounding.
TABLE 4.23.2.
Observed (2003–2007) and projected average annual new cases by age and province/territories combined (TC), leukemia, females, Canada, 2003–2032
| Period | Age | New cases | |||||||||||
|---|---|---|---|---|---|---|---|---|---|---|---|---|---|
| CA | BC | AB | SK | MB | ON | QC | NB | NS | PE | NL | TC | ||
| 2003–07 | <45 | 300 | 35 | 35 | 10 | 10 | 120 | 65 | 5 | 5 | 0 | 5 | 0 |
| 45–54 | 180 | 20 | 20 | 10 | 5 | 75 | 35 | 5 | 5 | 0 | 0 | 0 | |
| 55–64 | 280 | 35 | 30 | 10 | 15 | 110 | 60 | 5 | 10 | 0 | 5 | 0 | |
| 65–74 | 390 | 50 | 35 | 15 | 15 | 155 | 95 | 10 | 10 | 0 | 0 | 0 | |
| 75–84 | 480 | 55 | 40 | 20 | 20 | 190 | 125 | 10 | 15 | 0 | 0 | 0 | |
| 85+ | 250 | 35 | 15 | 10 | 10 | 95 | 75 | 5 | 10 | 0 | 0 | 0 | |
| Total | 1875 | 230 | 175 | 70 | 75 | 750 | 455 | 40 | 55 | 10 | 15 | 5 | |
| 2008–12 | <45 | 315 | 35 | 35 | 10 | 10 | 135 | 70 | 5 | 5 | 0 | 5 | 0 |
| 45–54 | 200 | 25 | 20 | 10 | 5 | 85 | 40 | 5 | 5 | 0 | 0 | 0 | |
| 55–64 | 335 | 40 | 35 | 10 | 15 | 145 | 65 | 5 | 10 | 0 | 5 | 0 | |
| 65–74 | 450 | 55 | 45 | 15 | 15 | 185 | 105 | 10 | 10 | 0 | 5 | 0 | |
| 75–84 | 520 | 65 | 50 | 20 | 15 | 210 | 135 | 10 | 15 | 0 | 0 | 0 | |
| 85+ | 340 | 45 | 25 | 10 | 15 | 135 | 100 | 5 | 10 | 0 | 0 | 0 | |
| Total | 2155 | 270 | 205 | 75 | 75 | 895 | 510 | 50 | 55 | 10 | 15 | 5 | |
| 2013–17 | <45 | 330 | 40 | 35 | 10 | 10 | 140 | 70 | 5 | 5 | 0 | 5 | 0 |
| 45–54 | 200 | 25 | 20 | 10 | 5 | 95 | 35 | 10 | 5 | 0 | 0 | 0 | |
| 55–64 | 380 | 45 | 40 | 15 | 15 | 170 | 75 | 10 | 10 | 0 | 5 | 0 | |
| 65–74 | 565 | 75 | 55 | 15 | 25 | 230 | 125 | 15 | 15 | 0 | 5 | 0 | |
| 75–84 | 565 | 70 | 55 | 20 | 15 | 235 | 145 | 10 | 15 | 0 | 5 | 0 | |
| 85+ | 400 | 60 | 30 | 10 | 15 | 160 | 110 | 5 | 10 | 0 | 0 | 0 | |
| Total | 2445 | 310 | 240 | 80 | 80 | 1035 | 560 | 55 | 60 | 10 | 20 | 5 | |
| 2018–22 | <45 | 345 | 45 | 35 | 10 | 10 | 150 | 75 | 5 | 5 | 0 | 5 | 0 |
| 45–54 | 195 | 20 | 20 | 5 | 5 | 100 | 35 | 10 | 5 | 0 | 0 | 0 | |
| 55–64 | 425 | 50 | 50 | 20 | 15 | 195 | 75 | 15 | 10 | 0 | 5 | 0 | |
| 65–74 | 670 | 90 | 70 | 20 | 25 | 285 | 140 | 15 | 20 | 5 | 5 | 0 | |
| 75–84 | 680 | 85 | 65 | 20 | 20 | 280 | 165 | 15 | 20 | 5 | 5 | 0 | |
| 85+ | 455 | 65 | 40 | 10 | 15 | 180 | 125 | 10 | 10 | 0 | 0 | 0 | |
| Total | 2770 | 355 | 280 | 90 | 90 | 1190 | 615 | 65 | 70 | 10 | 20 | 5 | |
| 2023–27 | <45 | 360 | 45 | 35 | 10 | 10 | 160 | 75 | 5 | 5 | 0 | 5 | 0 |
| 45–54 | 200 | 20 | 20 | 5 | 5 | 95 | 40 | 5 | 5 | 0 | 0 | 0 | |
| 55–64 | 430 | 50 | 50 | 20 | 15 | 210 | 70 | 15 | 10 | 0 | 5 | 0 | |
| 65–74 | 765 | 100 | 80 | 30 | 25 | 335 | 160 | 20 | 20 | 5 | 5 | 0 | |
| 75–84 | 855 | 115 | 85 | 25 | 30 | 355 | 200 | 20 | 25 | 5 | 5 | 0 | |
| 85+ | 520 | 75 | 45 | 10 | 15 | 215 | 140 | 10 | 15 | 5 | 0 | 0 | |
| Total | 3130 | 405 | 320 | 100 | 100 | 1365 | 680 | 75 | 75 | 15 | 20 | 5 | |
| 2028–32 | <45 | 370 | 50 | 35 | 10 | 10 | 165 | 75 | 5 | 5 | 0 | 5 | 0 |
| 45–54 | 205 | 20 | 20 | 10 | 5 | 95 | 45 | 5 | 5 | 0 | 0 | 0 | |
| 55–64 | 415 | 45 | 45 | 15 | 10 | 215 | 70 | 15 | 10 | 0 | 5 | 0 | |
| 65–74 | 855 | 105 | 90 | 35 | 30 | 380 | 165 | 25 | 20 | 5 | 5 | 0 | |
| 75–84 | 1025 | 140 | 110 | 30 | 35 | 440 | 225 | 20 | 30 | 5 | 5 | 0 | |
| 85+ | 645 | 100 | 55 | 15 | 20 | 260 | 165 | 15 | 15 | 5 | 0 | 0 | |
| Total | 3520 | 460 | 360 | 115 | 115 | 1555 | 745 | 85 | 85 | 15 | 25 | 10 | |
Abbreviations: AB, Alberta; BC, British Columbia; CA, Canada; MB, Manitoba; NB, New Brunswick; NL, Newfoundland and Labrador; NS, Nova Scotia; ON, Ontario; PE, Prince Edward Island; QC, Quebec; SK, Saskatchewan; TC, All Territories (Yukon, Northwest Territories and Nunavut).
Note: Totals may not add up due to rounding.
Leukemia is the most frequently diagnosed childhood malignancy, representing 72% of the lymphohematopoietic cancers in children and youth aged 0 to 14, and 33% of all childhood cancers in Canada during 2003–2007 (data not shown). Figure 4.23.1 shows how age-specific incidence rates varied with age in 2003–2007. The incidence rate had a small peak in children aged 0 to 4, then decreased and remained stable until age 30 when it started to increase slowly to the early 50s. The rate then escalated rapidly and reached its peak in people aged 85 and over. Almost three-quarters (74%) of leukemia cases occurred in those aged 55 or older. Males and females had similar rates up to age 50, after which the rates were higher in males and the divergence between sexes increased consistently with advancing age (Figure 4.23.1). The male-to-female ratio of ASIRs increased steadily from 1.3:1 in the under 45 age group to 1.9:1 in those aged 85 or older.
FIGURE 4.23.1. Age-specific incidence rates of leukemia, Canada, 2003–2007 (from average annual counts).

The overall ASIRs for leukemia decreased slightly from 1983–1987 until 1993–1997 (Figure 4.23.2). Thereafter, the incidence rates increased slightly to the same level in 2003–2007 as in the earliest observation period 20 years before. During 1998–2007, leukemia ASIRs increased non-significantly in males by 0.6% per year and increased significantly in females by 1.2% per year (Figures 3.1 and 3.2). Most of the increases occurred in men aged 65 or older and in women aged 65 to 74. The regional trends in ASIRs of leukemia were very similar for males and females (Figure 4.23.2). In the last observation period (2003–2007), the internal ranking of the regional ASIRs was similar for males and females, with significantly low rates in Atlantic Canada and elevated rates in the Prairies.
FIGURE 4.23.2. Age-standardized incidence rates (ASIRs) by region, leukemia, 1983–2032.

The predicted regional trends of leukemia ASIRs are similar in males and females (Figure 4.23.2). The ASIRs are expected to increase slightly in British Columbia, in the Atlantic region, and most evidently in Ontario. The rates will decrease marginally or stabilize in the Prairies and Quebec. The ranking of the regions in ASIRs will be the same for males and females. The rates for Ontario are projected to surpass those for the Prairies within the next 5 years. The Atlantic region will continue to experience the lowest rates. Figure 4.23.3 shows that the ASIRs of leukemia are predicted to increase or level off across the age groups but the difference between males and females persists over time.
FIGURE 4.23.3. Age-standardized incidence rates (ASIRs) for leukemia by age group (– males, – females), Canada, 1983–2032.

From 2003–2007 to 2028–2032, leukemia ASIRs for Canada are projected to increase by 5% in males, from 15.1 to 15.8 per 100 000, and by 7% in females, from 9.2 to 9.8 per 100 000 (Tables 4.23.3 and 4.23.4). The annual number of newly diagnosed male cases is projected to increase by 98%, from 2570 to 5095, and the number of new female cases, by 88%, from 1875 to 3520 (Tables 4.23.1 and 4.23.2).
TABLE 4.23.3.
Observed (2003–2007) and projected age-standardized incidence rates (ASIRs) by age and province/territories combined (TC), leukemia, males, Canada, 2003–2032
| Period | Age | ASIRs | |||||||||||
|---|---|---|---|---|---|---|---|---|---|---|---|---|---|
| CA | BC | AB | SK | MB | ON | QC | NB | NS | PE | NL | TC | ||
| 2003–07 | <45 | 4.0 | 3.8 | 4.2 | 5.5 | 3.0 | 4.2 | 3.8 | 4.0 | 3.7 | 6.3 | 3.5 | 3.1 |
| 45–54 | 10.6 | 10.2 | 12.3 | 12.1 | 13.5 | 11.5 | 8.3 | 9.9 | 11.8 | 19.4 | 6.2 | 17.8 | |
| 55–64 | 26.9 | 27.0 | 30.3 | 33.1 | 25.2 | 29.5 | 21.9 | 27.0 | 29.2 | 36.0 | 15.5 | 14.5 | |
| 65–74 | 57.0 | 51.5 | 62.2 | 63.8 | 62.5 | 59.8 | 56.4 | 49.0 | 52.6 | 77.5 | 17.0 | 32.8 | |
| 75–84 | 100.1 | 86.6 | 104.6 | 107.7 | 104.0 | 104.1 | 108.7 | 66.7 | 83.3 | 132.0 | 20.8 | 61.3 | |
| 85+ | 139.3 | 116.6 | 115.9 | 141.1 | 153.0 | 133.1 | 194.9 | 82.6 | 108.1 | 132.8 | 17.9 | 145.1 | |
| Total | 15.1 | 13.9 | 16.0 | 17.6 | 15.3 | 15.8 | 15.1 | 12.7 | 14.0 | 20.9 | 6.5 | 11.2 | |
| 2008–12 | <45 | 4.2 | 4.0 | 3.9 | 5.6 | 3.2 | 4.6 | 4.0 | 3.7 | 3.8 | 4.2 | 3.6 | 3.1 |
| 45–54 | 11.0 | 10.3 | 11.5 | 12.5 | 9.4 | 12.8 | 8.4 | 6.9 | 12.4 | 11.2 | 5.3 | 8.1 | |
| 55–64 | 27.7 | 26.4 | 31.6 | 30.9 | 28.2 | 30.3 | 22.4 | 33.9 | 29.8 | 28.2 | 12.7 | 20.4 | |
| 65–74 | 57.2 | 51.8 | 62.5 | 63.1 | 65.8 | 62.4 | 53.7 | 44.7 | 45.9 | 55.0 | 19.8 | 42.1 | |
| 75–84 | 99.2 | 89.2 | 109.0 | 110.8 | 91.2 | 101.0 | 107.7 | 71.6 | 81.8 | 97.6 | 24.4 | 72.9 | |
| 85+ | 135.9 | 131.5 | 113.9 | 132.4 | 128.2 | 140.1 | 165.5 | 68.5 | 115.8 | 131.0 | 27.3 | 99.9 | |
| Total | 15.3 | 14.2 | 16.0 | 17.5 | 14.7 | 16.4 | 14.8 | 12.5 | 13.8 | 15.1 | 6.6 | 11.3 | |
| 2013–17 | <45 | 4.2 | 4.0 | 3.8 | 5.9 | 3.2 | 4.7 | 4.0 | 3.9 | 3.9 | 4.2 | 3.6 | 3.1 |
| 45–54 | 11.4 | 10.5 | 11.6 | 14.7 | 7.7 | 13.3 | 8.9 | 4.9 | 11.7 | 11.2 | 5.2 | 8.4 | |
| 55–64 | 28.1 | 26.5 | 31.7 | 26.4 | 27.7 | 31.2 | 22.5 | 35.7 | 31.2 | 28.4 | 12.5 | 20.6 | |
| 65–74 | 56.8 | 52.7 | 62.6 | 54.2 | 63.9 | 62.4 | 51.9 | 52.5 | 45.7 | 55.3 | 19.6 | 41.8 | |
| 75–84 | 101.0 | 90.1 | 108.1 | 111.0 | 99.7 | 106.7 | 104.2 | 67.3 | 80.4 | 98.2 | 24.0 | 74.3 | |
| 85+ | 136.8 | 130.3 | 139.5 | 117.8 | 126.5 | 135.4 | 170.4 | 71.5 | 122.0 | 131.4 | 27.0 | 100.6 | |
| Total | 15.5 | 14.3 | 16.2 | 16.8 | 14.6 | 16.8 | 14.7 | 13.0 | 13.9 | 15.2 | 6.6 | 11.4 | |
| 2018–22 | <45 | 4.3 | 4.1 | 3.8 | 6.0 | 3.2 | 4.8 | 4.1 | 4.0 | 4.0 | 4.3 | 3.6 | 3.2 |
| 45–54 | 11.5 | 9.9 | 11.7 | 16.2 | 8.1 | 13.8 | 9.1 | 4.7 | 10.8 | 11.4 | 5.2 | 8.5 | |
| 55–64 | 28.0 | 25.7 | 30.9 | 26.3 | 25.0 | 31.9 | 21.9 | 26.8 | 31.0 | 28.7 | 12.4 | 20.5 | |
| 65–74 | 57.7 | 53.2 | 64.4 | 48.6 | 61.4 | 63.5 | 51.5 | 64.3 | 49.2 | 56.1 | 19.4 | 42.4 | |
| 75–84 | 101.1 | 91.8 | 107.8 | 98.6 | 106.7 | 109.1 | 101.8 | 69.1 | 77.7 | 99.2 | 23.8 | 74.3 | |
| 85+ | 136.0 | 130.7 | 131.0 | 120.7 | 119.4 | 136.9 | 166.2 | 77.0 | 114.2 | 133.2 | 26.8 | 100.0 | |
| Total | 15.6 | 14.4 | 16.2 | 16.2 | 14.5 | 17.2 | 14.5 | 13.2 | 13.9 | 15.4 | 6.5 | 11.5 | |
| 2023–27 | <45 | 4.3 | 4.2 | 3.9 | 5.8 | 3.3 | 4.9 | 4.1 | 4.2 | 4.0 | 4.3 | 3.6 | 3.2 |
| 45–54 | 11.6 | 9.9 | 10.7 | 17.7 | 7.8 | 14.2 | 9.6 | 4.9 | 11.1 | 11.4 | 5.2 | 8.6 | |
| 55–64 | 28.6 | 25.8 | 31.4 | 30.3 | 21.2 | 32.7 | 22.7 | 20.5 | 29.4 | 28.9 | 12.4 | 21.0 | |
| 65–74 | 58.1 | 53.1 | 64.9 | 41.8 | 61.3 | 64.6 | 51.3 | 65.2 | 51.0 | 56.2 | 19.3 | 42.7 | |
| 75–84 | 100.4 | 92.9 | 109.2 | 86.0 | 104.4 | 108.5 | 98.5 | 81.2 | 78.4 | 99.6 | 23.7 | 73.8 | |
| 85+ | 140.4 | 132.1 | 136.3 | 118.1 | 143.4 | 147.0 | 160.5 | 67.3 | 116.6 | 133.9 | 26.7 | 103.2 | |
| Total | 15.7 | 14.5 | 16.2 | 15.7 | 14.4 | 17.5 | 14.5 | 13.2 | 14.0 | 15.4 | 6.5 | 11.5 | |
| 2028–32 | <45 | 4.4 | 4.1 | 3.9 | 6.2 | 3.3 | 4.9 | 4.1 | 4.5 | 4.0 | 4.3 | 3.6 | 3.2 |
| 45–54 | 11.9 | 11.5 | 10.5 | 15.6 | 8.5 | 14.4 | 9.7 | 4.9 | 11.7 | 11.4 | 5.1 | 8.8 | |
| 55–64 | 29.0 | 24.7 | 31.8 | 32.6 | 22.1 | 33.6 | 23.4 | 20.1 | 27.6 | 29.0 | 12.3 | 21.3 | |
| 65–74 | 57.8 | 51.5 | 63.6 | 43.4 | 55.6 | 65.6 | 50.3 | 49.5 | 50.8 | 56.6 | 19.2 | 42.5 | |
| 75–84 | 101.9 | 93.5 | 112.2 | 77.4 | 101.5 | 110.1 | 98.5 | 98.7 | 83.8 | 100.1 | 23.6 | 74.9 | |
| 85+ | 137.1 | 134.8 | 132.5 | 96.6 | 143.4 | 144.1 | 158.6 | 77.2 | 109.0 | 134.3 | 26.5 | 100.7 | |
| Total | 15.8 | 14.5 | 16.3 | 15.5 | 14.0 | 17.7 | 14.5 | 13.1 | 14.0 | 15.5 | 6.5 | 11.6 | |
Abbreviations: AB, Alberta; BC, British Columbia; CA, Canada; MB, Manitoba; NB, New Brunswick; NL, Newfoundland and Labrador; NS, Nova Scotia; ON, Ontario; PE, Prince Edward Island; QC, Quebec; SK, Saskatchewan; TC, All Territories (Yukon, Northwest Territories and Nunavut).
TABLE 4.23.4.
Observed (2003–2007) and projected age-standardized incidence rates (ASIRs) by age and province/territories combined (TC), leukemia, females, Canada, 2003–2032
| Period | Age | ASIRs | |||||||||||
|---|---|---|---|---|---|---|---|---|---|---|---|---|---|
| CA | BC | AB | SK | MB | ON | QC | NB | NS | PE | NL | TC | ||
| 2003–07 | <45 | 3.1 | 2.9 | 3.3 | 3.2 | 3.0 | 3.2 | 3.1 | 3.4 | 2.5 | 3.6 | 3.2 | 3.7 |
| 45–54 | 7.1 | 6.1 | 7.3 | 10.8 | 7.6 | 8.1 | 6.0 | 8.2 | 5.5 | 5.5 | 4.1 | 0.0 | |
| 55–64 | 15.9 | 14.7 | 20.4 | 20.4 | 22.6 | 16.8 | 13.1 | 12.5 | 15.7 | 14.5 | 10.3 | 20.4 | |
| 65–74 | 32.4 | 30.7 | 37.2 | 38.8 | 31.0 | 33.8 | 31.1 | 31.6 | 29.3 | 32.8 | 9.0 | 39.5 | |
| 75–84 | 54.3 | 48.7 | 57.8 | 55.6 | 57.3 | 56.0 | 56.6 | 43.3 | 53.7 | 55.4 | 16.6 | 61.8 | |
| 85+ | 73.6 | 69.5 | 54.0 | 61.2 | 58.6 | 75.7 | 91.0 | 48.2 | 78.2 | 75.1 | 11.8 | 0.0 | |
| Total | 9.2 | 8.5 | 10.0 | 10.4 | 9.6 | 9.6 | 9.0 | 8.5 | 8.4 | 9.3 | 4.9 | 9.2 | |
| 2008–12 | <45 | 3.3 | 3.1 | 2.9 | 3.4 | 2.5 | 3.5 | 3.2 | 3.6 | 2.6 | 3.4 | 2.9 | 3.1 |
| 45–54 | 7.3 | 6.2 | 7.5 | 10.9 | 7.3 | 8.1 | 6.0 | 11.7 | 5.7 | 7.1 | 5.3 | 6.8 | |
| 55–64 | 15.7 | 14.2 | 18.9 | 19.1 | 18.9 | 18.0 | 12.4 | 13.0 | 14.8 | 14.6 | 9.6 | 15.0 | |
| 65–74 | 33.3 | 30.8 | 39.4 | 38.3 | 37.1 | 35.6 | 30.6 | 30.8 | 26.4 | 26.7 | 14.5 | 30.8 | |
| 75–84 | 56.4 | 51.3 | 64.7 | 64.0 | 50.1 | 58.8 | 57.0 | 52.3 | 54.3 | 45.9 | 17.4 | 55.4 | |
| 85+ | 78.3 | 76.9 | 64.8 | 65.2 | 67.1 | 81.0 | 94.3 | 46.4 | 67.1 | 72.1 | 13.6 | 71.5 | |
| Total | 9.5 | 8.7 | 10.1 | 10.7 | 9.2 | 10.2 | 9.0 | 9.3 | 8.1 | 8.6 | 5.1 | 9.0 | |
| 2013–17 | <45 | 3.3 | 3.0 | 2.9 | 3.4 | 2.5 | 3.6 | 3.3 | 3.4 | 2.5 | 3.7 | 3.0 | 3.1 |
| 45–54 | 7.5 | 6.3 | 7.4 | 10.9 | 7.7 | 9.0 | 5.8 | 13.5 | 5.7 | 7.3 | 5.5 | 6.9 | |
| 55–64 | 15.7 | 13.5 | 17.4 | 22.6 | 15.5 | 18.6 | 12.4 | 15.6 | 14.3 | 14.6 | 9.8 | 15.1 | |
| 65–74 | 33.5 | 31.8 | 38.7 | 37.6 | 40.8 | 36.1 | 29.8 | 33.2 | 26.6 | 26.6 | 14.9 | 31.1 | |
| 75–84 | 58.3 | 53.0 | 69.0 | 62.0 | 50.9 | 62.0 | 58.1 | 47.7 | 53.3 | 46.8 | 17.8 | 56.0 | |
| 85+ | 78.5 | 82.6 | 74.3 | 67.1 | 63.5 | 82.5 | 86.6 | 55.8 | 69.1 | 74.4 | 14.0 | 72.3 | |
| Total | 9.6 | 8.8 | 10.2 | 11.0 | 9.1 | 10.6 | 9.0 | 9.7 | 8.0 | 8.9 | 5.3 | 9.1 | |
| 2018–22 | <45 | 3.3 | 3.1 | 2.8 | 3.5 | 2.5 | 3.6 | 3.2 | 3.4 | 2.3 | 4.1 | 3.0 | 3.2 |
| 45–54 | 7.8 | 5.7 | 7.4 | 10.0 | 6.0 | 9.5 | 6.8 | 14.6 | 5.3 | 7.7 | 5.6 | 7.1 | |
| 55–64 | 16.1 | 13.0 | 18.0 | 27.5 | 16.9 | 18.9 | 12.5 | 20.5 | 13.6 | 14.7 | 10.0 | 15.4 | |
| 65–74 | 32.7 | 30.9 | 36.9 | 35.5 | 36.3 | 36.8 | 28.3 | 30.1 | 27.0 | 26.4 | 15.1 | 31.7 | |
| 75–84 | 60.1 | 55.9 | 69.1 | 64.9 | 58.7 | 64.9 | 57.7 | 49.0 | 52.0 | 47.0 | 18.1 | 57.0 | |
| 85+ | 80.9 | 86.3 | 81.5 | 64.7 | 65.1 | 83.1 | 88.3 | 75.3 | 76.3 | 76.3 | 14.2 | 73.6 | |
| Total | 9.7 | 8.9 | 10.1 | 11.3 | 9.1 | 10.8 | 8.9 | 10.3 | 7.9 | 9.2 | 5.4 | 9.3 | |
| 2023–27 | <45 | 3.3 | 3.2 | 2.7 | 3.6 | 2.3 | 3.6 | 3.2 | 3.6 | 2.3 | 4.6 | 3.1 | 3.2 |
| 45–54 | 7.9 | 5.2 | 7.9 | 10.0 | 6.4 | 9.1 | 7.6 | 12.6 | 5.5 | 8.2 | 5.6 | 7.0 | |
| 55–64 | 16.5 | 13.2 | 18.0 | 27.5 | 18.3 | 20.1 | 11.9 | 23.3 | 13.9 | 15.1 | 10.1 | 15.5 | |
| 65–74 | 32.7 | 29.4 | 34.7 | 41.9 | 32.0 | 37.4 | 28.5 | 35.7 | 26.5 | 26.2 | 15.2 | 31.8 | |
| 75–84 | 59.8 | 57.1 | 68.5 | 62.0 | 64.2 | 64.7 | 56.2 | 50.8 | 52.8 | 46.7 | 18.2 | 57.3 | |
| 85+ | 83.0 | 87.8 | 85.4 | 62.8 | 67.0 | 88.9 | 89.5 | 50.9 | 69.7 | 77.1 | 14.3 | 73.4 | |
| Total | 9.8 | 8.8 | 10.0 | 11.7 | 9.0 | 11.0 | 8.9 | 10.6 | 7.8 | 9.6 | 5.4 | 9.3 | |
| 2028–32 | <45 | 3.3 | 3.2 | 2.8 | 3.7 | 2.2 | 3.7 | 3.2 | 3.6 | 2.3 | 5.1 | 3.1 | 3.3 |
| 45–54 | 7.7 | 5.6 | 7.0 | 10.3 | 8.1 | 8.5 | 7.5 | 11.3 | 4.6 | 9.0 | 5.7 | 7.2 | |
| 55–64 | 17.0 | 12.2 | 17.8 | 25.6 | 15.0 | 21.1 | 13.5 | 24.8 | 13.2 | 15.9 | 10.2 | 15.7 | |
| 65–74 | 33.3 | 28.8 | 36.1 | 49.2 | 36.0 | 37.7 | 28.2 | 44.5 | 25.5 | 26.5 | 15.4 | 32.3 | |
| 75–84 | 58.6 | 55.6 | 65.3 | 60.1 | 57.4 | 65.9 | 53.4 | 46.7 | 53.9 | 46.2 | 18.4 | 58.2 | |
| 85+ | 85.2 | 94.3 | 83.0 | 68.8 | 83.0 | 90.4 | 87.5 | 70.8 | 72.3 | 77.1 | 14.5 | 75.2 | |
| Total | 9.8 | 8.8 | 9.8 | 12.1 | 9.0 | 11.1 | 8.9 | 11.3 | 7.7 | 10.1 | 5.5 | 9.5 | |
Abbreviations: AB, Alberta; BC, British Columbia; CA, Canada; MB, Manitoba; NB, New Brunswick; NL, Newfoundland and Labrador; NS, Nova Scotia; ON, Ontario; PE, Prince Edward Island; QC, Quebec; SK, Saskatchewan; TC, All Territories (Yukon, Northwest Territories and Nunavut).
Comments
Leukemia is a cancer of the white blood cells. It has 4 main subtypes: acute lymphocytic leukemia (ALL), chronic lymphocytic leukemia (CLL), acute myeloid leukemia (AML) and chronic myeloid leukemia (CML).
The overall observed incidence rates for leukemia were generally modest, decreasing slightly during 1983–1997 and then increasing slightly, a pattern consistent with that observed in the US.293 The etiology of leukemia remains largely unknown. The established and suspected risk factors include environmental exposures, genetic (inherited) susceptibility and lifestyle category.
In 2008, IARC documented that exposure to ionizing radiation, alkylating agents (used in chemotherapy) and benzene had been consistently associated with leukemia risk.86 Ionizing radiation is linked to increased incidence of AML, ALL and CML, but not CLL. Exposures include atomic bomb exposure (Hiroshima and Nagasaki), nuclear power plant accidents and therapeutic radiation exposure.52,53,86,294,295 Findings from exposure to electromagnetic fields are inconsistent. IARC has concluded that occupational benzene exposure causes leukemia, particularly AML.47,86 Benzene is also present in tobacco smoke and gasoline. Smoking, accounting for 20% of AML cases, is associated with a 2-fold increase in AML risk including in a Canadian cohort.52,111,295,296 The prevalence of these exposures has been stable or decreasing during the study period and can explain the relative stable and the decreased component of the incidence trend of leukemia.
Viruses, particularly retroviruses, have been linked to the development of leukemia. IARC considers HTLV-1 infection to be causally associated with leukemia.47 HTLV-1 infects 5 to 10 million people in the world,297 with clusters in certain ethnic/geographical concentrations in Japan, Africa, South America, the Caribbean and Melanesia.297,298 EBV is the etiological agent of acute infectious mononucleosis and is associated with adult ALL and aggressive NK-cell leukemia.53,298,299
Some identified chromosomal anomalies are related to leukemia. CLL, the most common adult leukemia in the West, is estimated to have one of the highest familial risks for a hematological malignancy.300 A 7.5-fold increased risk of CLL has been observed in people with a first-degree relative with CLL.301 Cytogenetic abnormalities occur in around 50% of CLL cases.302 A reciprocal chromosomal translocation known as the Philadelphia chromosome is present in 95% of CML cases.303 Philadelphia chromosome is also seen in about 20% to 30% of adult ALL cases.304 Children with Down syndrome have a 10- to 30-fold increased risk of ALL and AML.52,53,111,294,305 Inherited genetic syndromes have been linked to 5% of ALL and AML cases.306
Lifestyle factors have been implicated in the development of leukemia.307 A meta-analysis showed an increased risk for each of the 4 major subtypes of leukemia in obese people.308 A Canadian case-control study estimated that, compared with normal weight, the odds ratios of leukemia were 1.3 (95% CI: 1.1–1.5) for overweight and 1.6 (CI: 1.3–2.0) for obesity.309 Overweight and obesity together accounted for 18% of all leukemias in Canada—9% from overweight and 8% from obesity.309 The prevalence of obesity has increased in Canada.51,72,73,110 However, current data are not sufficient to conclude whether the increased prevalence of obesity explains some of the recent increase in leukemia incidence. Based on the same population-based Canadian data, the researchers observed a 25% risk reduction for adult leukemia associated with the highest category of vigorous physical activity (OR = 0.75; CI: 0.57–0.99). Risk reductions associated with high levels of vigorous activity were greater with higher BMI.310
Changes in coding practice and the clinical ability to identify leukemia may contribute to some of the increase. In addition, changes in classification could also influence the trends.295
24. All other cancers
In 2003–2007, the average annual number of all other cancers in Canada was 7005 for males and 6995 for females, representing 8.7% and 9.4% of all new male and female cancer cases, respectively (Tables 4.24.1 and 4.24.2). During the same period, the ASIRs of these cancers increased with age from 6.2 per 100 000 in those aged 44 or younger to 466.4 in those aged 85 or older in males and from 6.3 to 345.4 in females in the same age groups. For those aged 54 or younger, the increase was less pronounced (Table 4.24.3 and 4.24.4). The ASIRs were virtually the same for males and females younger than age 55 but were higher in men than in women after this age. Overall, all other cancers occurred nearly 1.3 times as often in males as in females. Tables 4.24.1 and 4.24.2 show that more than 80% of all other cancer cases occurred in people aged 55 or older.
TABLE 4.24.1.
Observed (2003–2007) and projected average annual new cases by age and province/territories combined (TC), all other cancers, males, Canada, 2003–2032
| Period | Age | New cases | |||||||||||
|---|---|---|---|---|---|---|---|---|---|---|---|---|---|
| CA | BC | AB | SK | MB | ON | QC | NB | NS | PE | NL | TC | ||
| <45 | 635 | 75 | 65 | 15 | 20 | 260 | 155 | 10 | 20 | 5 | 5 | 0 | |
| 2003–07 | 45–54 | 730 | 90 | 65 | 15 | 25 | 315 | 170 | 15 | 20 | 5 | 10 | 0 |
| 55–64 | 1245 | 155 | 105 | 30 | 40 | 500 | 320 | 25 | 45 | 5 | 20 | 5 | |
| 65–74 | 1790 | 215 | 150 | 55 | 65 | 705 | 470 | 35 | 60 | 10 | 25 | 5 | |
| 75–84 | 1895 | 235 | 155 | 60 | 75 | 705 | 535 | 35 | 65 | 10 | 20 | 0 | |
| 85+ | 710 | 90 | 55 | 25 | 35 | 240 | 215 | 20 | 25 | 5 | 5 | 0 | |
| Total | 7005 | 865 | 595 | 205 | 260 | 2725 | 1865 | 135 | 230 | 30 | 80 | 10 | |
| 2008–12 | <45 | 615 | 65 | 65 | 10 | 20 | 275 | 155 | 10 | 15 | 0 | 5 | 0 |
| 45–54 | 800 | 95 | 75 | 15 | 20 | 380 | 180 | 15 | 20 | 5 | 10 | 0 | |
| 55–64 | 1520 | 185 | 125 | 35 | 45 | 660 | 375 | 30 | 45 | 5 | 20 | 0 | |
| 65–74 | 2025 | 235 | 160 | 55 | 65 | 825 | 535 | 35 | 70 | 10 | 25 | 5 | |
| 75–84 | 2165 | 270 | 180 | 60 | 70 | 810 | 645 | 40 | 65 | 15 | 15 | 0 | |
| 85+ | 1015 | 135 | 75 | 35 | 40 | 350 | 340 | 20 | 30 | 5 | 5 | 0 | |
| Total | 8140 | 975 | 680 | 205 | 255 | 3300 | 2220 | 145 | 245 | 40 | 80 | 15 | |
| 2013–17 | <45 | 630 | 65 | 65 | 10 | 15 | 310 | 155 | 10 | 15 | 0 | 5 | 0 |
| 45–54 | 755 | 80 | 70 | 15 | 20 | 385 | 160 | 15 | 20 | 5 | 5 | 0 | |
| 55–64 | 1775 | 200 | 155 | 35 | 45 | 830 | 415 | 30 | 45 | 5 | 20 | 0 | |
| 65–74 | 2480 | 290 | 195 | 60 | 70 | 1045 | 645 | 45 | 80 | 15 | 30 | 5 | |
| 75–84 | 2380 | 290 | 190 | 60 | 70 | 910 | 715 | 45 | 70 | 20 | 20 | 5 | |
| 85+ | 1315 | 160 | 105 | 35 | 45 | 475 | 455 | 20 | 30 | 5 | 5 | 0 | |
| Total | 9340 | 1085 | 780 | 210 | 265 | 3960 | 2540 | 160 | 260 | 50 | 85 | 15 | |
| 2018–22 | <45 | 660 | 70 | 55 | 10 | 15 | 340 | 160 | 10 | 15 | 0 | 5 | 0 |
| 45–54 | 660 | 65 | 75 | 10 | 15 | 355 | 130 | 15 | 15 | 5 | 5 | 0 | |
| 55–64 | 1915 | 215 | 160 | 35 | 45 | 980 | 415 | 30 | 45 | 10 | 20 | 5 | |
| 65–74 | 3010 | 350 | 250 | 65 | 75 | 1330 | 740 | 50 | 90 | 15 | 35 | 5 | |
| 75–84 | 2810 | 335 | 225 | 65 | 80 | 1095 | 840 | 45 | 85 | 20 | 20 | 5 | |
| 85+ | 1550 | 190 | 125 | 40 | 45 | 560 | 550 | 25 | 35 | 10 | 5 | 0 | |
| Total | 10 605 | 1220 | 890 | 225 | 275 | 4655 | 2835 | 175 | 280 | 60 | 90 | 15 | |
| 2023–27 | <45 | 695 | 75 | 50 | 10 | 15 | 380 | 165 | 10 | 15 | 0 | 5 | 0 |
| 45–54 | 630 | 60 | 75 | 5 | 15 | 355 | 120 | 10 | 10 | 0 | 5 | 0 | |
| 55–64 | 1815 | 200 | 155 | 35 | 45 | 965 | 370 | 30 | 45 | 10 | 15 | 5 | |
| 65–74 | 3515 | 405 | 310 | 70 | 85 | 1635 | 815 | 50 | 90 | 20 | 40 | 5 | |
| 75–84 | 3525 | 430 | 285 | 80 | 95 | 1400 | 1025 | 60 | 105 | 25 | 30 | 5 | |
| 85+ | 1780 | 210 | 140 | 40 | 50 | 660 | 620 | 30 | 40 | 10 | 5 | 0 | |
| Total | 11 960 | 1375 | 1020 | 240 | 300 | 5400 | 3115 | 195 | 305 | 70 | 100 | 20 | |
| 2028–32 | <45 | 725 | 75 | 50 | 10 | 20 | 405 | 175 | 10 | 15 | 0 | 5 | 0 |
| 45–54 | 645 | 65 | 70 | 5 | 15 | 380 | 115 | 10 | 15 | 0 | 5 | 0 | |
| 55–64 | 1605 | 165 | 165 | 25 | 35 | 885 | 305 | 30 | 35 | 10 | 15 | 0 | |
| 65–74 | 3830 | 440 | 330 | 75 | 90 | 1905 | 825 | 50 | 95 | 25 | 40 | 10 | |
| 75–84 | 4360 | 535 | 380 | 90 | 105 | 1790 | 1200 | 75 | 120 | 30 | 35 | 5 | |
| 85+ | 2225 | 265 | 180 | 50 | 60 | 820 | 790 | 30 | 50 | 10 | 10 | 0 | |
| Total | 13 390 | 1545 | 1170 | 255 | 325 | 6185 | 3415 | 210 | 330 | 75 | 105 | 20 | |
Abbreviations: AB, Alberta; BC, British Columbia; CA, Canada; MB, Manitoba; NB, New Brunswick; NL, Newfoundland and Labrador; NS, Nova Scotia; ON, Ontario; PE, Prince Edward Island; QC, Quebec; SK, Saskatchewan; TC, All Territories (Yukon, Northwest Territories and Nunavut).
Note: Totals may not add up due to rounding.
TABLE 4.24.2.
Observed (2003–2007) and projected average annual new cases by age and province/territories combined (TC), all other cancers, females, Canada, 2003–2032
| Period | Age | New cases | |||||||||||
|---|---|---|---|---|---|---|---|---|---|---|---|---|---|
| CA | BC | AB | SK | MB | ON | QC | NB | NS | PE | NL | TC | ||
| 2003–07 | <45 | 625 | 65 | 60 | 20 | 20 | 280 | 135 | 10 | 15 | 0 | 10 | 0 |
| 45–54 | 740 | 85 | 70 | 20 | 20 | 305 | 185 | 15 | 25 | 0 | 10 | 0 | |
| 55–64 | 1070 | 130 | 100 | 30 | 35 | 410 | 275 | 20 | 35 | 5 | 20 | 5 | |
| 65–74 | 1425 | 180 | 115 | 45 | 50 | 555 | 380 | 25 | 50 | 10 | 20 | 0 | |
| 75–84 | 1955 | 235 | 150 | 65 | 70 | 715 | 585 | 40 | 65 | 10 | 20 | 0 | |
| 85+ | 1185 | 155 | 85 | 45 | 40 | 385 | 405 | 25 | 40 | 5 | 5 | 0 | |
| Total | 6995 | 845 | 585 | 220 | 245 | 2645 | 1965 | 135 | 225 | 30 | 90 | 10 | |
| 2008–12 | <45 | 645 | 70 | 70 | 15 | 20 | 280 | 135 | 15 | 15 | 5 | 10 | 0 |
| 45–54 | 825 | 95 | 85 | 25 | 25 | 355 | 195 | 15 | 25 | 5 | 15 | 0 | |
| 55–64 | 1360 | 165 | 135 | 40 | 40 | 525 | 350 | 25 | 40 | 5 | 25 | 5 | |
| 65–74 | 1660 | 215 | 140 | 50 | 55 | 635 | 440 | 30 | 60 | 10 | 25 | 5 | |
| 75–84 | 2100 | 250 | 185 | 70 | 70 | 775 | 645 | 35 | 70 | 10 | 20 | 0 | |
| 85+ | 1610 | 205 | 120 | 50 | 55 | 535 | 565 | 25 | 45 | 5 | 10 | 0 | |
| Total | 8195 | 1000 | 735 | 245 | 270 | 3110 | 2330 | 145 | 255 | 35 | 105 | 15 | |
| 2013–17 | <45 | 690 | 75 | 80 | 20 | 25 | 305 | 140 | 15 | 15 | 5 | 10 | 0 |
| 45–54 | 820 | 95 | 90 | 20 | 25 | 380 | 165 | 20 | 20 | 5 | 15 | 0 | |
| 55–64 | 1625 | 195 | 170 | 50 | 50 | 640 | 415 | 25 | 50 | 5 | 30 | 5 | |
| 65–74 | 2085 | 265 | 195 | 60 | 65 | 790 | 555 | 35 | 70 | 10 | 40 | 5 | |
| 75–84 | 2250 | 280 | 205 | 70 | 70 | 840 | 685 | 35 | 80 | 10 | 25 | 5 | |
| 85+ | 1920 | 245 | 150 | 60 | 65 | 635 | 710 | 30 | 50 | 10 | 10 | 0 | |
| Total | 9395 | 1155 | 895 | 275 | 295 | 3590 | 2670 | 165 | 285 | 45 | 125 | 15 | |
| 2018–22 | <45 | 725 | 80 | 90 | 20 | 25 | 325 | 140 | 15 | 15 | 5 | 10 | 0 |
| 45–54 | 790 | 95 | 90 | 20 | 25 | 370 | 150 | 25 | 20 | 5 | 15 | 0 | |
| 55–64 | 1775 | 215 | 195 | 55 | 50 | 740 | 410 | 35 | 55 | 10 | 30 | 5 | |
| 65–74 | 2580 | 320 | 265 | 75 | 75 | 985 | 680 | 45 | 80 | 15 | 50 | 5 | |
| 75–84 | 2615 | 335 | 235 | 75 | 80 | 965 | 800 | 45 | 95 | 10 | 30 | 5 | |
| 85+ | 2145 | 270 | 190 | 60 | 70 | 725 | 785 | 30 | 55 | 10 | 10 | 0 | |
| Total | 10 625 | 1315 | 1070 | 305 | 320 | 4115 | 2965 | 190 | 320 | 50 | 150 | 20 | |
| 2023–27 | <45 | 750 | 85 | 95 | 20 | 25 | 340 | 140 | 15 | 15 | 5 | 10 | 0 |
| 45–54 | 810 | 95 | 95 | 25 | 25 | 390 | 140 | 20 | 15 | 5 | 15 | 0 | |
| 55–64 | 1715 | 215 | 195 | 50 | 50 | 770 | 345 | 40 | 45 | 10 | 35 | 5 | |
| 65–74 | 3010 | 375 | 325 | 90 | 90 | 1180 | 775 | 55 | 95 | 15 | 60 | 5 | |
| 75–84 | 3275 | 410 | 325 | 90 | 95 | 1200 | 995 | 60 | 115 | 15 | 45 | 5 | |
| 85+ | 2355 | 315 | 195 | 65 | 65 | 805 | 875 | 35 | 65 | 10 | 10 | 0 | |
| Total | 11 920 | 1495 | 1230 | 340 | 350 | 4685 | 3270 | 220 | 355 | 55 | 175 | 25 | |
| 2028–32 | <45 | 760 | 90 | 100 | 20 | 25 | 345 | 140 | 15 | 15 | 5 | 10 | 0 |
| 45–54 | 840 | 105 | 100 | 25 | 25 | 420 | 130 | 20 | 15 | 5 | 15 | 0 | |
| 55–64 | 1640 | 210 | 195 | 50 | 50 | 755 | 305 | 45 | 40 | 5 | 35 | 5 | |
| 65–74 | 3270 | 405 | 360 | 100 | 95 | 1355 | 770 | 65 | 105 | 15 | 65 | 10 | |
| 75–84 | 4050 | 500 | 435 | 115 | 115 | 1505 | 1215 | 75 | 130 | 20 | 60 | 10 | |
| 85+ | 2840 | 375 | 255 | 75 | 80 | 960 | 1055 | 40 | 80 | 15 | 15 | 5 | |
| Total | 13 405 | 1685 | 1445 | 385 | 390 | 5345 | 3610 | 260 | 385 | 60 | 200 | 25 | |
Abbreviations: AB, Alberta; BC, British Columbia; CA, Canada; MB, Manitoba; NB, New Brunswick; NL, Newfoundland and Labrador; NS, Nova Scotia; ON, Ontario; PE, Prince Edward Island; QC, Quebec; SK, Saskatchewan; TC, All Territories (Yukon, Northwest Territories and Nunavut).
Note: Totals may not add up due to rounding.
TABLE 4.24.3.
Observed (2003–2007) and projected age-standardized incidence rates (ASIRs) by age and province/territories combined (TC), all other cancers, males, Canada, 2003–2032
| Period | Age | ASIRs | |||||||||||
|---|---|---|---|---|---|---|---|---|---|---|---|---|---|
| CA | BC | AB | SK | MB | ON | QC | NB | NS | PE | NL | TC | ||
| 2003–07 | <45 | 6.2 | 6.0 | 5.6 | 4.8 | 5.8 | 6.5 | 6.7 | 5.5 | 6.3 | 5.9 | 3.9 | 4.3 |
| 45–54 | 29.4 | 27.7 | 25.6 | 22.0 | 27.4 | 34.0 | 28.2 | 22.3 | 24.9 | 23.9 | 20.6 | 20.6 | |
| 55–64 | 72.9 | 65.7 | 67.4 | 66.5 | 66.8 | 78.9 | 73.4 | 53.1 | 77.7 | 74.0 | 63.4 | 71.5 | |
| 65–74 | 165.9 | 140.7 | 164.6 | 158.8 | 177.3 | 172.3 | 175.5 | 131.2 | 179.5 | 163.8 | 120.3 | 151.8 | |
| 75–84 | 305.2 | 261.1 | 307.1 | 257.5 | 304.0 | 294.1 | 370.2 | 228.3 | 340.1 | 315.8 | 189.6 | 241.5 | |
| 85+ | 466.4 | 370.5 | 432.8 | 364.7 | 470.1 | 424.7 | 677.0 | 427.4 | 439.9 | 584.5 | 214.4 | 145.1 | |
| Total | 40.7 | 35.5 | 39.0 | 35.2 | 40.5 | 41.6 | 46.1 | 32.2 | 42.7 | 41.4 | 27.6 | 31.8 | |
| 2008–12 | <45 | 6.1 | 5.0 | 5.3 | 3.9 | 4.9 | 7.0 | 6.7 | 5.3 | 5.7 | 5.1 | 4.9 | 2.8 |
| 45–54 | 29.2 | 25.7 | 24.7 | 19.5 | 22.4 | 36.0 | 27.3 | 21.0 | 25.2 | 24.3 | 19.3 | 28.4 | |
| 55–64 | 73.8 | 63.5 | 63.1 | 57.4 | 60.4 | 86.4 | 73.4 | 56.9 | 69.3 | 62.7 | 52.7 | 34.6 | |
| 65–74 | 163.6 | 132.9 | 152.4 | 145.4 | 155.5 | 177.9 | 171.2 | 109.8 | 171.8 | 180.2 | 113.3 | 215.5 | |
| 75–84 | 308.4 | 261.3 | 307.0 | 253.4 | 289.6 | 298.9 | 381.3 | 240.0 | 317.1 | 436.3 | 156.3 | 232.8 | |
| 85+ | 484.5 | 403.0 | 433.8 | 386.2 | 432.8 | 433.5 | 736.5 | 373.0 | 492.6 | 644.4 | 147.4 | 239.3 | |
| Total | 40.9 | 34.3 | 37.6 | 32.7 | 36.4 | 43.4 | 46.8 | 30.7 | 40.8 | 46.0 | 24.9 | 33.5 | |
| 2013–17 | <45 | 6.1 | 4.7 | 4.9 | 3.1 | 4.5 | 7.7 | 6.7 | 4.9 | 5.1 | 5.1 | 4.7 | 2.8 |
| 45–54 | 27.5 | 21.9 | 23.4 | 17.9 | 19.7 | 34.9 | 25.7 | 23.6 | 27.9 | 24.3 | 14.6 | 30.0 | |
| 55–64 | 75.5 | 62.1 | 63.9 | 51.3 | 54.6 | 94.0 | 73.2 | 51.2 | 61.6 | 72.7 | 54.5 | 28.9 | |
| 65–74 | 159.5 | 130.0 | 141.3 | 133.1 | 136.9 | 180.0 | 165.8 | 104.6 | 159.5 | 167.9 | 99.9 | 197.6 | |
| 75–84 | 307.1 | 252.8 | 290.8 | 249.3 | 269.2 | 307.3 | 377.4 | 232.4 | 306.1 | 501.6 | 146.0 | 298.3 | |
| 85+ | 492.1 | 386.2 | 455.2 | 387.7 | 439.7 | 446.0 | 756.9 | 348.1 | 448.3 | 694.8 | 124.3 | 258.6 | |
| Total | 40.6 | 32.9 | 36.1 | 30.5 | 33.4 | 45.0 | 46.3 | 29.4 | 38.2 | 48.9 | 22.9 | 34.5 | |
| 2018–22 | <45 | 6.2 | 4.7 | 4.1 | 2.8 | 4.2 | 8.1 | 6.9 | 4.9 | 5.3 | 5.1 | 4.6 | 2.8 |
| 45–54 | 26.0 | 17.9 | 25.4 | 14.4 | 17.9 | 34.7 | 23.5 | 25.2 | 23.2 | 24.3 | 12.8 | 31.1 | |
| 55–64 | 73.7 | 60.4 | 58.9 | 48.1 | 51.7 | 97.0 | 68.1 | 49.0 | 59.2 | 80.3 | 51.1 | 38.2 | |
| 65–74 | 159.1 | 128.6 | 138.8 | 120.1 | 120.5 | 187.6 | 162.1 | 104.5 | 147.7 | 187.9 | 98.8 | 130.0 | |
| 75–84 | 302.3 | 244.1 | 279.7 | 248.9 | 258.3 | 310.3 | 367.9 | 202.2 | 297.0 | 436.5 | 139.8 | 311.2 | |
| 85+ | 489.1 | 388.1 | 446.1 | 379.6 | 408.6 | 444.2 | 755.6 | 361.5 | 418.1 | 816.6 | 123.5 | 404.3 | |
| Total | 40.1 | 31.9 | 34.7 | 28.6 | 30.9 | 46.1 | 45.1 | 28.4 | 36.2 | 49.8 | 22.0 | 32.7 | |
| 2023–27 | <45 | 6.3 | 4.8 | 3.8 | 2.7 | 4.0 | 8.6 | 7.0 | 4.9 | 5.1 | 5.1 | 4.6 | 2.8 |
| 45–54 | 24.7 | 16.2 | 25.1 | 10.0 | 18.0 | 35.4 | 21.1 | 22.5 | 19.9 | 24.3 | 12.0 | 31.7 | |
| 55–64 | 69.6 | 54.2 | 57.0 | 46.9 | 49.1 | 92.5 | 63.0 | 53.6 | 65.2 | 84.3 | 45.0 | 38.9 | |
| 65–74 | 160.6 | 128.7 | 141.2 | 113.4 | 115.3 | 197.1 | 157.6 | 96.6 | 133.8 | 198.6 | 110.9 | 104.6 | |
| 75–84 | 293.2 | 243.5 | 262.7 | 235.8 | 236.7 | 307.8 | 351.1 | 198.7 | 279.1 | 389.7 | 133.7 | 277.4 | |
| 85+ | 483.8 | 373.5 | 421.0 | 391.2 | 401.7 | 454.4 | 728.1 | 335.1 | 419.7 | 811.6 | 123.7 | 418.1 | |
| Total | 39.4 | 31.1 | 33.6 | 27.2 | 29.4 | 46.8 | 43.3 | 27.5 | 34.7 | 49.2 | 21.9 | 30.1 | |
| 2028–32 | <45 | 6.4 | 4.8 | 3.5 | 2.6 | 4.3 | 8.9 | 7.3 | 4.9 | 4.9 | 5.1 | 4.5 | 2.8 |
| 45–54 | 24.0 | 17.3 | 21.4 | 8.5 | 15.3 | 35.9 | 19.3 | 22.4 | 22.6 | 24.3 | 11.2 | 32.3 | |
| 55–64 | 66.0 | 46.2 | 61.4 | 40.2 | 46.1 | 90.4 | 57.9 | 58.2 | 57.6 | 88.5 | 42.7 | 39.6 | |
| 65–74 | 156.4 | 126.2 | 132.5 | 109.8 | 112.4 | 199.4 | 146.6 | 92.9 | 131.7 | 209.7 | 107.9 | 131.8 | |
| 75–84 | 292.9 | 242.8 | 264.0 | 219.7 | 216.7 | 317.8 | 342.5 | 196.1 | 261.4 | 408.8 | 141.4 | 183.0 | |
| 85+ | 473.0 | 368.1 | 416.9 | 392.1 | 391.7 | 446.8 | 710.7 | 282.4 | 399.4 | 603.4 | 123.2 | 428.4 | |
| Total | 38.7 | 30.2 | 32.7 | 25.6 | 28.0 | 47.3 | 41.7 | 27.0 | 33.2 | 48.8 | 21.7 | 28.8 | |
Abbreviations: AB, Alberta; BC, British Columbia; CA, Canada; MB, Manitoba; NB, New Brunswick; NL, Newfoundland and Labrador; NS, Nova Scotia; ON, Ontario; PE, Prince Edward Island; QC, Quebec; SK, Saskatchewan; TC, All Territories (Yukon, Northwest Territories and Nunavut).
TABLE 4.24.4.
Observed (2003–2007) and projected age-standardized incidence rates (ASIRs) by age and province/territories combined (TC), all other cancers, females, Canada, 2003–2032
| Period | Age | ASIRs | |||||||||||
|---|---|---|---|---|---|---|---|---|---|---|---|---|---|
| CA | BC | AB | SK | MB | ON | QC | NB | NS | PE | NL | TC | ||
| 2003–07 | <45 | 6.3 | 5.0 | 5.8 | 6.3 | 6.2 | 7.1 | 6.1 | 5.3 | 5.3 | 4.6 | 6.7 | 4.0 |
| 45–54 | 29.6 | 25.1 | 29.1 | 27.2 | 25.6 | 32.4 | 30.4 | 21.3 | 30.3 | 15.2 | 22.1 | 20.0 | |
| 55–64 | 60.7 | 54.9 | 66.2 | 63.9 | 60.3 | 62.4 | 59.9 | 47.1 | 64.6 | 47.2 | 62.7 | 71.1 | |
| 65–74 | 119.1 | 112.9 | 119.9 | 114.0 | 118.7 | 120.2 | 123.1 | 82.1 | 128.3 | 176.1 | 111.7 | 112.4 | |
| 75–84 | 221.1 | 199.2 | 218.1 | 204.5 | 202.5 | 208.4 | 265.3 | 168.2 | 233.9 | 270.9 | 166.8 | 244.3 | |
| 85+ | 345.4 | 318.3 | 307.9 | 281.9 | 258.2 | 305.1 | 497.9 | 268.3 | 304.9 | 235.9 | 121.5 | 289.6 | |
| Total | 32.3 | 29.0 | 32.0 | 30.8 | 30.2 | 32.5 | 35.6 | 24.4 | 32.7 | 33.0 | 27.2 | 30.4 | |
| 2008–12 | <45 | 6.5 | 5.5 | 6.3 | 6.1 | 5.9 | 7.2 | 6.2 | 6.8 | 5.2 | 6.4 | 6.7 | 4.6 |
| 45–54 | 30.3 | 25.3 | 30.1 | 29.4 | 26.6 | 33.8 | 29.8 | 26.3 | 30.3 | 27.4 | 29.2 | 27.9 | |
| 55–64 | 63.6 | 54.7 | 69.0 | 64.9 | 55.3 | 65.5 | 66.4 | 44.5 | 61.5 | 64.3 | 66.2 | 69.0 | |
| 65–74 | 122.5 | 116.3 | 124.9 | 125.2 | 117.6 | 123.3 | 126.6 | 88.0 | 138.1 | 129.6 | 115.0 | 139.7 | |
| 75–84 | 227.1 | 204.1 | 248.4 | 222.2 | 212.9 | 216.3 | 273.3 | 156.9 | 250.2 | 221.6 | 165.6 | 216.7 | |
| 85+ | 369.8 | 338.8 | 351.1 | 293.3 | 303.1 | 324.7 | 539.5 | 227.5 | 308.1 | 328.6 | 134.8 | 257.2 | |
| Total | 33.5 | 29.9 | 34.6 | 32.5 | 30.5 | 33.7 | 37.2 | 25.3 | 33.6 | 33.1 | 28.6 | 32.1 | |
| 2013–17 | <45 | 6.8 | 5.6 | 6.7 | 6.7 | 6.3 | 7.6 | 6.3 | 6.7 | 5.4 | 6.6 | 6.7 | 4.5 |
| 45–54 | 30.3 | 26.0 | 32.0 | 29.2 | 26.6 | 35.0 | 27.4 | 37.0 | 26.8 | 28.1 | 34.1 | 27.1 | |
| 55–64 | 66.8 | 57.0 | 72.7 | 68.8 | 58.3 | 69.5 | 70.6 | 45.2 | 66.3 | 65.7 | 70.8 | 66.7 | |
| 65–74 | 123.7 | 112.5 | 135.3 | 127.9 | 115.1 | 123.5 | 129.7 | 86.6 | 131.8 | 132.4 | 131.1 | 137.5 | |
| 75–84 | 230.2 | 212.1 | 249.9 | 233.3 | 211.0 | 220.9 | 277.9 | 156.9 | 261.3 | 226.6 | 157.3 | 216.8 | |
| 85+ | 376.8 | 345.8 | 357.8 | 320.4 | 304.1 | 327.0 | 565.5 | 229.8 | 335.6 | 335.0 | 143.4 | 263.1 | |
| Total | 34.3 | 30.4 | 36.2 | 34.0 | 30.8 | 34.7 | 37.9 | 26.4 | 34.1 | 33.8 | 30.4 | 31.6 | |
| 2018–22 | <45 | 6.8 | 5.7 | 7.1 | 6.5 | 6.2 | 7.6 | 6.0 | 6.6 | 5.4 | 6.6 | 6.7 | 4.5 |
| 45–54 | 31.6 | 26.8 | 34.2 | 32.6 | 29.0 | 36.5 | 27.6 | 43.0 | 26.7 | 28.3 | 39.5 | 26.6 | |
| 55–64 | 67.1 | 57.7 | 72.8 | 72.3 | 58.7 | 71.8 | 66.9 | 53.3 | 68.6 | 66.3 | 76.0 | 64.6 | |
| 65–74 | 126.1 | 110.0 | 141.4 | 131.2 | 111.3 | 127.0 | 136.4 | 88.9 | 127.0 | 133.7 | 139.5 | 134.0 | |
| 75–84 | 230.9 | 214.4 | 247.3 | 238.2 | 212.9 | 222.2 | 279.3 | 158.6 | 262.0 | 228.3 | 162.2 | 214.9 | |
| 85+ | 380.1 | 344.1 | 395.9 | 332.1 | 314.5 | 335.0 | 557.5 | 211.0 | 348.4 | 338.0 | 153.5 | 265.3 | |
| Total | 34.6 | 30.5 | 37.4 | 35.1 | 30.9 | 35.4 | 37.9 | 27.7 | 34.1 | 34.1 | 32.3 | 31.1 | |
| 2023–27 | <45 | 6.8 | 5.6 | 7.4 | 6.4 | 5.9 | 7.6 | 6.0 | 6.6 | 5.6 | 6.6 | 6.7 | 4.4 |
| 45–54 | 31.8 | 26.6 | 32.9 | 36.7 | 31.1 | 38.1 | 25.2 | 42.7 | 26.7 | 28.3 | 39.4 | 26.3 | |
| 55–64 | 65.6 | 57.6 | 73.7 | 70.9 | 57.7 | 73.1 | 60.0 | 72.9 | 60.8 | 66.3 | 85.8 | 63.0 | |
| 65–74 | 128.8 | 111.8 | 143.5 | 136.5 | 114.1 | 131.6 | 139.6 | 91.3 | 134.7 | 133.8 | 149.2 | 129.7 | |
| 75–84 | 228.4 | 204.1 | 257.9 | 240.1 | 203.6 | 219.6 | 278.9 | 159.0 | 247.2 | 228.8 | 183.4 | 211.7 | |
| 85+ | 376.8 | 359.1 | 356.5 | 344.5 | 296.3 | 335.2 | 562.6 | 228.0 | 357.2 | 338.5 | 134.5 | 264.1 | |
| Total | 34.6 | 30.3 | 37.7 | 35.9 | 30.5 | 35.9 | 37.3 | 29.7 | 33.7 | 34.1 | 34.4 | 30.4 | |
| 2028–32 | <45 | 6.8 | 5.6 | 7.7 | 6.0 | 5.8 | 7.5 | 6.0 | 6.6 | 5.6 | 6.6 | 6.7 | 4.3 |
| 45–54 | 31.1 | 26.5 | 32.8 | 35.9 | 30.1 | 38.6 | 22.1 | 42.4 | 25.5 | 28.4 | 39.4 | 25.9 | |
| 55–64 | 66.9 | 58.5 | 76.9 | 77.3 | 60.7 | 74.9 | 59.3 | 84.9 | 59.5 | 66.4 | 98.0 | 61.8 | |
| 65–74 | 127.5 | 111.6 | 140.8 | 141.3 | 114.1 | 134.9 | 130.5 | 107.0 | 135.4 | 133.6 | 157.4 | 125.7 | |
| 75–84 | 230.8 | 199.2 | 264.1 | 244.2 | 198.5 | 225.0 | 288.3 | 163.5 | 238.4 | 228.5 | 193.1 | 206.2 | |
| 85+ | 375.4 | 348.9 | 372.4 | 343.1 | 311.4 | 335.1 | 551.9 | 220.9 | 348.1 | 338.7 | 155.0 | 261.1 | |
| Total | 34.6 | 30.1 | 38.4 | 36.6 | 30.5 | 36.5 | 36.5 | 31.8 | 33.1 | 34.1 | 36.5 | 29.7 | |
Abbreviations: AB, Alberta; BC, British Columbia; CA, Canada; MB, Manitoba; NB, New Brunswick; NL, Newfoundland and Labrador; NS, Nova Scotia; ON, Ontario; PE, Prince Edward Island; QC, Quebec; SK, Saskatchewan; TC, All Territories (Yukon, Northwest Territories and Nunavut).
Figure 4.24.1 illustrates that overall incidence rates for this group increased modestly in males during the first 3 observation periods and then stabilized. For females, the overall rates increased steadily throughout the whole observation period. During 1998–2007, the ASIRs for all other cancers increased non-significantly in males by 0.1% per year and increased significantly by 0.6% in females (data not shown). The inter-regional comparison indicated that, in the last 10 years of observation, male ASIRs increased in Ontario and Quebec, and decreased in other regions (Figure 4.24.1). For females, the ASIRs have increased gradually since the early 1990s in most regions. Figure 4.24.2 shows that the ASIRs increased consistently in females of all age groups since 1988–1992, and in males aged 65 or older.
FIGURE 4.24.1. Age-standardized incidence rates (ASIRs) by region, all other cancers, 1983–2032.

FIGURE 4.24.2. Age-standardized incidence rates (ASIRs) for all other cancers by age group (– males, – females), Canada, 1983–2032.

For males, the incidence rates of all other cancers are projected to stabilize (at about 40 per 100 000) for Canada as a whole (Figure 4.24.1). At the regional level, the rates in Ontario are expected to continue to increase consistently, whereas the incidence in Quebec will tend to increase marginally in the next 5 years and thereafter decrease steadily. The rates in other regions will continue to decrease. For females, the overall rates are projected to increase until 2013–2017 and then level off. Similar trends will occur in British Columbia, the Prairies and Quebec. The rates in females will increase slightly in Ontario and the Atlantic region. Figure 4.24.2 shows that the ASIRs in Canada are estimated to increase and then level off in all age groups except in men aged 45 to 74, for whom the rates will decrease.
From 2003–2007 to 2028–2032, the ASIRs of all other cancers for Canada are projected to fall by 5% in males, from 40.7 to 38.7 per 100 000, and to rise by 7% in females, from 32.3 to 34.6 per 100 000 (Tables 4.24.3 and 4.24.4). The annual number of new cases in males is projected to increase by 91%, from 7005 to 13 390, and the number of new cases in females, by 92%, from 6995 to 13 405 (Tables 4.24.1 and 4.24.2).
Comments
‘‘All other cancers’’ is a heterogeneous category. The distributions of the most common types of non-sex-specific cancers in this group were generally the same for males and females between 2003 and 2007. During this period, the most frequently diagnosed cancers were cancers of other digestive system (10% in males and 12% in females), soft tissue including heart (8% in males and 6% in females), and all other and unspecified primary sites (47% in both males and females). Mesothelioma accounted for a larger proportion of cancers in males (5%) compared with females (1%). The number of Canadian males diagnosed with mesothelioma rose from 153 cases in 1984 to 420 cases in 2007 (data not shown) because of exposure to asbestos in the 1950s, 1960s and 1970s.311 The incidence rate also increased from 1.4 to 2.3 per 100 000.
Cancer of other female genital system organs accounted for 11% of this category in females. The remaining represented cancers of minor sites, in particular the digestive and respiratory systems, and the urinary organs. The vast diversity of this category makes it difficult to identify the reason for the projected trends.
The presence of numerous types of rare and complex cancers in this category makes it a challenge for either the cancer care system or researchers to deal with. One implication is that there may be value in research that examines multiple rare cancers that contribute to this group.
Chapter 5: Discussion
Main findings
In this monograph we show that the ASIRs for all cancers combined in Canada are not projected to change substantially from 2003–2007 to 2028–2032. The rates are expected to decrease by 5% in males, from 464.8 to 443.2 per 100 000, and to increase by 4% in females, from 358.3 to 371.0 per 100 000 (Figure 3.3). The decrease in lung cancer rates in males 65 or older and of prostate cancer in those 75 or older will contribute to the overall decrease in cancer rates in males, given that these 2 cancers account for about 40% of all new cancer cases in Canadian males. The predicted overall increase in cancer rates for females is primarily the result of increasing lung cancer rates in women aged 65 or older; it also represents the expected increase in cancers of uterus, thyroid, breast (in females under 45), leukemia, pancreas, kidney and melanoma.
The annual number of newly diagnosed cancer cases is projected to increase by 84% in males, from 80 810 in 2003–2007 to 148 370 in 2028–2032, and by 74% in females, from 74 165 to 128 830 over the same period. Our decomposition analysis of the drivers of change illustrated that the projected rise in the number of new cancer cases will primarily come from the structural aging of the Canadian population and, to a lesser extent, the increase in population size. Changes in the risk of cancer will contribute little to the increase in new cases, especially for males.
Between 2003–2007 and 2028–2032, significant risk reductions are projected for major common tobacco-related cancers, albeit with relatively lower reductions or delayed downturns in females. The incidence of smoking-related cancers is projected to decrease by 2% to 59% for oral cancer in males, cervical and esophageal cancer in females, and larynx, lung, stomach and bladder cancers in both sexes, while an increase of 0.6% to 7% is expected for kidney cancer, leukemia and pancreas cancer in both sexes, oral cancer in females, and esophageal cancer in males. The differences in incidence trends of the tobacco-related cancers between males and females reflect the differences in histories of tobacco use.42,43 Given the lag of 20 years or more between the drop in smoking rates and the decrease in cancer incidence rates, it is likely that incidence rates in females will begin to drop more noticeably for the tobacco-related cancers with projected stable or marginally decreased trends over the longer term.
Over the 25-year projection period, the incidence rates for cancers associated with excess weight and physical inactivity are estimated to rise by 0.6% to 16% for cancers of uterus, kidney, pancreas, female breast and male esophagus, in descending order. Incidence rates for colorectal and female esophageal cancer, also associated with excess weight and physical inactivity, are estimated to fall by 2% to 6%. Increased obesity prevalence in Canada may contribute to the increased incidence trends of these cancers.51,72,73,110 Weight control and physical activity may represent opportunities for modifying the risk of developing these cancers.
The most common cancers caused by chronic infections are cancers of cervix, caused by human papilloma virus (HPV), stomach, caused by Helicobacter pylori (H. pylori), and liver, caused by hepatitis B virus (HBV) and hepatitis C virus (HCV). The ongoing increasing trend of liver cancer incidence in Canada is possibly linked to the historical increase and continued high incidence in HCV infection,98 the aging of the population previously infected and increasing immigration from areas where risk factors, such as HBV, are prevalent.75,104,105 The persisting decrease in incidence of stomach cancer may be explained by improved healthy behaviours, such as decreased smoking and changes in diet,82 and increased recognition and treatment of infection with H. pylori.36,83 The continuing downward trend in the rates of cervical cancer is mainly attributable to general population screening with the Papanicolaou (Pap) test and successful treatment of screening-detected precancer-ous lesions. The immunization of school-aged children with HPV vaccine is anticipated to further reduce incidence of cervical cancer.
The incidence rates for all cancers combined are projected to continue to be highest for males in the Atlantic region and for females in Quebec in 15 years but in Ontario thereafter, and lowest in British Columbia. The cancer-specific analysis shows that the highest incidence rates in males are projected to be in the Atlantic region for cancers of oral, esophagus, stomach, colorectum, pancreas, larynx, melanoma, prostate, kidney and non-Hodgkin lymphoma (NHL); in Ontario for melanoma, thyroid, NHL and leukemia; and in Quebec for cancers of larynx, lung, bladder, central nervous system (CNS), Hodgkin lymphoma and multiple myeloma. For females, the elevated incidence rates are predicted in the Prairies for cervical cancer; in Ontario for multiple myeloma, leukemia, oral, stomach, breast, uterus, ovary and thyroid cancers; in Quebec for cancers of pancreas, lung, bladder, CNS and Hodgkin lymphoma; and in the Atlantic region for cancers of colorectal, larynx, melanoma, kidney and NHL.
While British Columbia is projected to continue to have the lowest incidence rates for majority of cancers in both males and females, this province will continue to experience the highest rates of esophageal cancer in females, liver cancer in both sexes, and testis cancer. The Atlantic region is projected to have the lowest rates for breast, uterus and ovarian cancers, and for liver and leukemia in both sexes, but elevated rates in males for about half the cancers studied (listed above).
The differences in incidence rates in regions are influenced in part by variation in the past prevalence of risk factors across the country, in keeping with lengthy time lags between exposure and cancer outcomes. Cancer risk factors include cigarette smoking, alcohol consumption, obesity, physical inactivity, diet/nutrition, radiation, some chronic infections, medicinal drugs, immunosup-pression, occupational and environmental contaminants, and genetic susceptibility. The historically higher smoking rates in Quebec and Atlantic Canada likely account for the higher incidence rates of lung cancer in these regions. The higher rates of liver cancer in British Columbia is possibly linked to the higher HCV rates in this province.297 In addition, the high incidence rates of liver cancer and of esophagus cancer in females in British Columbia could partially be explained by high number of immigrants from South Asia and China where HBV is endemic.75–78 Significantly higher incidence rates of liver cancer have been found in immigrants from South-East Asia and NorthEast Asia in Canada.104 Compared to Canada, the rate of esophageal cancer is significantly higher in Asia, including China and Central Asia, especially in females.312 The geographical variation in cancer incidence may also be due to the availability of screening and diagnostic services for breast, colorectal, prostate and cervical cancers, and the different rates of participation in formal screening programs (e.g. mammographic screening for breast cancer) or other screening procedures (e.g. prostate-specific antigen [PSA] testing for prostate cancer). Finally, the variation in cancer registry practices could also explain some of the geographical differences in cancer distribution (see the section ‘‘Data quality issues’’ below). Low rates of prostate cancer and melanoma in Quebec are likely the result of the registry relying on hospitalization data and missing cancers diagnosed and treated outside the hospitals.130
Prostate, colorectal, lung and bladder cancers figure among the top 4 most common cancers newly diagnosed in males in 1983–1987, 2003–2007 and 2028–2032. However, prostate cancer replaced lung cancer as the most frequent in 2003–2007, and colorectal cancer is projected to overtake lung cancer as the second most frequently diagnosed cancer in males by 2028–2032. For females, breast, lung, colorectal and uterine cancers are the leading incident cancers in these 3 periods, but colorectal cancer—the second most common type of cancer in 1983–1987—is ranked third as of 2003–2007. Thyroid cancer will replace NHL as the fifth most common cancer in females by 2028–2032.
Mistry et al.4 projected cancer incidence in the UK for 2008–2030 based on 1975–2007 data and using a method similar to the Nordpred package. The years 2007 and 2030 are used here to approximate the periods 2003–2007 and 2028–2032, and correspondingly, to compare projections between Canada and the UK. As in Canada (Table 5.1), almost no change is projected in the ASIRs of all cancers combined from 2007 to 2030 in the UK. Sites with similar projected decreases in ASIRs in both countries included cancers of stomach and CNS. Oral cancer incidence rates in Canada are projected to decrease in males by 6% from 2007 to 2030 and remain stable in females, in contrast to the increases of 25% in males and 21% in females in the UK. However, the rates for 2007 in Canada were higher than those in the UK by 15% in males and 13% in females. The predicted changes in ASIRs for colorectal cancer are below the medians in all cancers, with a decrease of 6% for both sexes in Canada, whereas the rates in the UK are expected to decrease by a similar amount in males but increase by 2% in females. The incidence rates of laryngeal cancer are estimated to decrease about 2 times faster in Canada than in the UK in both sexes. For lung cancer, the ASIRs are projected to decrease by 34% in males and 16% in females in Canada, compared with a predicted decrease of 8% in males and increase of 7% in females in the UK. The ASIR of ovarian cancer is expected to decrease to a greater extent in the UK than in Canada (28% vs. 4%). Breast cancer incidence is expected to show the smallest change (increase of less than 1%) over the entire 25-year forecasting horizon in all cancer sites in Canadian females. Similar to Canada, breast cancer incidence rate in females is not predicted to change substantially in the next 25 years in the UK.
TABLE 5.1.
Changes in average annual new cases and age-standardized incidence rates (ASIRs) for cancers by sex, Canada, from 2003–2007 to 2028–2032
| Cancer Type | Males | Females | ||||||||||
|---|---|---|---|---|---|---|---|---|---|---|---|---|
| Number of cases | ASIR (per 100 000) | Number of cases | ASIR (per 100 000) | |||||||||
| 2003–07 | 2028–32 | Change (%)a | 2003–07 | 2028–32 | Change (%) | 2003–07 | 2028–32 | change(%)a | 2003–07 | 2028–32 | change | |
| All cancers | 80 810 | 148 370 | 83.6 | 464.8 | 443.2 | −4.6 | 74 165 | 128 830 | 73.7 | 358.3 | 371.0 | 3.6 |
| Oral | 2285 | 3595 | 57.5 | 12.6 | 11.8 | −6.0 | 1085 | 1760 | 62.4 | 5.2 | 5.3 | 1.6 |
| Esophagus | 1095 | 2110 | 92.7 | 6.2 | 6.2 | 0.6 | 385 | 690 | 79.5 | 1.7 | 1.7 | -2.3 |
| Stomach | 1925 | 2680 | 39.1 | 11.1 | 7.7 | −30.0 | 1080 | 1425 | 31.6 | 4.9 | 3.7 | -23.7 |
| Colorectal | 10 620 | 19 815 | 86.6 | 60.8 | 57.0 | −6.3 | 9010 | 15 260 | 69.4 | 41.0 | 38.6 | -6.1 |
| Liver | 1025 | 2845 | 177.8 | 5.7 | 8.2 | 43.3 | 350 | 760 | 116.6 | 1.6 | 1.9 | 15.1 |
| Pancreas | 1810 | 3635 | 100.7 | 10.3 | 10.5 | 1.4 | 1900 | 3730 | 96.2 | 8.5 | 9.1 | 7.1 |
| Larynx | 900 | 900 | 0.0 | 5.1 | 2.7 | −47.5 | 195 | 145 | -25.9 | 1.0 | 0.4 | -58.8 |
| Lung | 12 245 | 16 420 | 34.1 | 70.7 | 46.4 | −34.4 | 9865 | 15 945 | 61.6 | 47.1 | 39.6 | -15.9 |
| Melanoma | 2320 | 4065 | 75.4 | 13.1 | 12.4 | −5.8 | 2055 | 3465 | 68.7 | 10.7 | 11.2 | 4.6 |
| Breast | 20 110 | 31 255 | 55.4 | 97.9 | 98.7 | 0.7 | ||||||
| Cervix | 1345 | 1435 | 6.8 | 7.6 | 6.1 | -20.2 | ||||||
| Body of uterus | 4105 | 7700 | 87.6 | 19.9 | 23.1 | 16.2 | ||||||
| Ovary | 2385 | 3650 | 53.1 | 11.6 | 11.1 | -4.0 | ||||||
| Prostate | 21 460 | 42 225 | 96.8 | 123.3 | 123.3 | 0.1 | ||||||
| Testis | 825 | 1070 | 29.7 | 5.6 | 6.0 | 8.5 | ||||||
| Kidney | 2580 | 5020 | 94.7 | 14.4 | 15.5 | 7.4 | 1665 | 3070 | 84.4 | 8.0 | 8.6 | 6.8 |
| Bladder | 4815 | 8825 | 83.4 | 27.9 | 24.0 | −13.9 | 1705 | 3030 | 78.0 | 7.7 | 7.3 | -6.1 |
| Central nervous system | 1365 | 1965 | 43.8 | 7.9 | 7.1 | −10.4 | 1055 | 1470 | 39.1 | 5.6 | 5.2 | -7.6 |
| Thyroid | 795 | 1895 | 138.8 | 4.5 | 7.0 | 54.5 | 2810 | 6910 | 145.9 | 16.1 | 26.5 | 64.8 |
| Hodgkin lymphoma | 490 | 615 | 26.6 | 3.1 | 3.0 | −3.4 | 395 | 500 | 26.3 | 2.5 | 2.3 | -6.8 |
| Non-Hodgkin lymphoma | 3455 | 6050 | 75.0 | 19.7 | 18.1 | −8.3 | 2915 | 5180 | 77.7 | 14.1 | 14.3 | 1.4 |
| Multiple myeloma | 1065 | 2395 | 125.1 | 6.1 | 6.8 | 11.3 | 875 | 1685 | 92.2 | 4.0 | 4.2 | 4.0 |
| Leukemia | 2570 | 5095 | 98.3 | 15.1 | 15.8 | 4.5 | 1875 | 3520 | 87.6 | 9.2 | 9.8 | 6.9 |
| All other cancers | 7005 | 13 390 | 91.1 | 40.7 | 38.7 | −5.1 | 6 995 | 13 405 | 91.6 | 32.3 | 34.6 | 7.0 |
change was calculated before rounding.
The ASIRs of liver cancer in males are projected to rise by 43% in Canada and 27% in the UK from the similar level in 2007, whereas the rates in females are estimated to increase by 15% in Canada but level off with a 2% fall in the UK. However, the UK rate in females for 2007 was 69% higher than the Canadian rate. A 52% increase in melanoma rates is projected for males and females in the UK from 2007 to 2030, while Canadian rates are predicted to decrease by 6% in males and increase by 5% in females. Melanoma incidence rates in the UK were similar to Canadian rates in males and slightly higher in females in 2007. The ASIR of uterus cancer is projected to rise more rapidly in Canada (16% vs. 4%) from the same level in 2007. Increases in kidney cancer rates in females are projected in both the UK and Canada to about the same level, but the rate in 2007 in Canada was 10% higher than that in the UK. Conversely, the rates in males were the same in the both countries in 2007, but are estimated to increase 4 times faster in the UK between 2007 and 2030. The ASIRs of thyroid cancer are estimated to increase at 55% for Canadian males and 65% for Canadian females, but are not shown in the UK study. In both sexes, the rates of multiple myeloma and leukemia are projected to decrease by 14% to 23% from 2007 to 2030 in the UK but increase by 4% to 11% in Canada. Recent relatively stable rates of multiple myeloma in Canada have been mapped to these future trends.
Data quality issues
Although the standardization of case ascertainment, definition and classification has improved the registration of cancer cases and comparability of data across the country, reporting procedures, accuracy and completeness still vary.1 International Agency for Research on Cancer (IARC) rules313 for multiple primaries were used for cases from the Canadian Cancer Registry (CCR), whereas during the period covered by the National Cancer Incidence Reporting System (NCIRS), registries other than Quebec and Ontario used multiple primary rules that allowed a small percentage of additional cases.
Non-melanoma skin cancer is difficult to register completely because it is quite plentiful and may be diagnosed and treated in a variety of settings. Most provincial and territorial cancer registries do not register these cases. For this reason, non-mela-noma skin cancer is excluded from our analysis.
For the observed data years covered by this analysis, death certificate only (DCO) cases were not reported to CCR by Quebec and Newfoundland and Labrador, with the exception of the 2000–2006 Quebec data and 2007 Newfoundland and Labrador data. The number of DCO cases for 2007 in Quebec was estimated by averaging the numbers in 2002–2006. This missing reporting has likely led to underestimates of the incidence rates in these provinces, especially for highly fatal cancers such as lung and pancreas. In Canada, the number of DCO cases is less than 2% of the total new cancer cases. In addition, the incidence of some cancers in Quebec, particularly for those that rely more heavily on pathological diagnosis, are underestimated as a result of the registry's dependence on hospitalization data. Prostate cancer, mel-anoma and bladder cancer estimates are affected.130 Owing to changes to the Quebec registry that increase registration for data after 2007, the number of mela-noma cases is underestimated in the current report.
Comments on methods and results
Our model comparison exercise, based on the more recent observed data (2008–2010) which were not available when present study was undertaken, addressed the accuracy of the projection methods used in this monograph. For example, Table 5.2 presents the medians of the absolute relative differences between the observed and projected average annual number of cases at the national level only and across the provinces in 1992–2010 by length of projection for the combinations of cancer site (excluding prostate cancer), sex and province (excluding Quebec, see Chapter 2 for details), not listed in Table 2.3. The projected numbers were calculated by the projection method used in this monograph (denoted as PHACpred, which therefore only includes the Nordpred APC models (NP_ADPC) with the Nordpred standard drift (D) reduction and its modifications), and the 3 versions of NP_ADPC with its standard drift reduction: using the average trend over the whole observation period for projections (M0F); using the slope between the 2 most recent periods for projections (M0T); and automatically determining whether the recent trend (or the average trend) is projected based on a significance test for departure from a linear trend (M0A). The medians are shown with and without all male cancers combined. The table shows that the medians from PHACpred are the smallest in the 4 models for any length of projection period. The differences in the medians among the 4 models or between PHACpred and M0A are not statistically significant when across the provinces (each p §.05), but are statistically significant for national-level 15- and 20-year projections. The performances of M0F and M0T were published for the population of the 4 Nordic countries.15 In this study, Moller et al.15 made projection model comparisons for 20 cancer sites in each sex for Denmark, Finland, Norway and Sweden for 1983–1997 based on 1958–1977 data. The respective median deviations (over the combinations of site, sex and country) of M0F and M0T are 13% and 12% for 10-year projections, and 20% and 18% for 20-year projections. The median numbers are similar to ours for M0T model in the scenario from across the provinces, but M0F seems to perform better for our specified data. Consequently, we can see that our PHACpred multiple modelling approach produced more accurate projections than the default Nordpred method applied uniformly.
TABLE 5.2.
Median of absolute relative difference (%) between observed and projected number of average annual cancer cases in 1992–2010, Canadaa
| Projection method | Length of projection | |||||
|---|---|---|---|---|---|---|
| 10 years | 15 years | 20 years | ||||
| National level | Across provinces | National level | Across provinces | National level | Across provinces | |
| Exclusion of prostate cancer | ||||||
| M0F | 10.6 | 11.1 | 13.6 | 15.5 | 10.3 | 15.2 |
| M0T | 7.8 | 11.8 | 10.6 | 16.1 | 14.9 | 18.3 |
| M0A | 7.8 | 11.6 | 10.6 | 14.6 | 16.0 | 16.3 |
| PHACpred | 5.8 | 10.9 | 6.9 | 13.9 | 7.6 | 15.1 |
| p-valueb of differences among the 4 models | 0.02 | 0.36 | <0.01 | 0.12 | <0.01 | 0.06 |
| p-value of differences between PHACpred and M0A | 0.12 | 0.35 | <0.01 | 0.4 | <0.01 | 0.53 |
| Exclusion of prostate cancer and all male cancers combined | ||||||
| M0F | 10.6 | 11.7 | 14.3 | 15.8 | 10.4 | 15.8 |
| M0T | 7.8 | 12.3 | 10.9 | 16.7 | 15.2 | 18.9 |
| M0A | 8.5 | 11.8 | 12.0 | 15.5 | 16.1 | 17.1 |
| PHACpred | 6.3 | 11.3 | 7.0 | 14.4 | 7.6 | 15.5 |
| p-value of differences among the 4 models | 0.03 | 0.34 | <0.01 | 0.17 | <0.01 | 0.05 |
| p-value of differences between PHACpred and M0A | 0.12 | 0.42 | <0.01 | 0.52 | <0.01 | 0.61 |
Note: 1. Comparisons were presented for the combination of cancer site, sex and area not listed in Table 2.3.
2. PHACpred, the method used in this monograph, only include Nordpred APC models (NP_ADPC) with varied drift reductions for this table. Three versions of NP_ADPC with its default drift reduction: using the average trend over the whole observation period for projections (M0F); using the slope between the two most recent periods for projections (M0T); and automatically determining whether the recent trend (or the average trend) is projected based on a significance test for departure from linear trend (M0A).
Excluding Quebec, see Methods.
p-value of Friedman's test.
Validation of the predicted incidence counts and rates is critical. Incidence data for some cancers were subject to changes in classification/coding practices, introduction or expansion of screening programs, and use of new diagnostic technologies. A model created on cohorts in early periods for these cancers may give inaccurate predictions when applied to contemporary cohorts. Because the datasets for model creation and application in this study were largely from different periods, we examined the projections from the selected models using our knowledge of data quality, trends in cancer rates, risk factors or interventions, which guided selection of the final models.
Our results were compared with the projections using the default Nordpred model, M0A, for each of the combinations of cancer site, sex and geographical area. The medians of the absolute relative differences between the projected average annual numbers of cases from PHACpred and M0A models (relative to the M0A) across all the combinations are 1.9% and 3.8% for 10-year and 25-year projections, respectively. In 25-year projections, the respective medians for breast cancer in females, colorectum and lung are 10.3%, 0.8% and 0%. The largest medians of the disagreement of the 2 methods are found in cancers of prostate (40.2%), thyroid (21.2%) and stomach (21.4%). However, M0A produces extreme increases in prostate cancer rates and new cases and therefore is not applicable to our projections (see discussions in the third paragraph below).
The principal projection models used are based on decomposition of the observed incidence data into 3 time dimensions of age, period and cohort. While the effects of risk factors, screening and intervention were not incorporated into the models because of insufficient data in most circumstances, they have been modelled indirectly to some extent, through the period and cohort effects in the model.3 However, the models will be insensitive to any recent changes not foreshadowed in the observed time series of cancers because of the long latency between exposure and cancer outcomes.
The observed incidence rates for the cancers of female genital system also reflect the fact that many females who underwent a hysterectomy or bilateral salpingo-oophorectomy were not at risk of developing the disease. Table 5.3 shows that the prevalence of hysterectomy was high in the Atlantic provinces and Quebec based on the 2003 Canadian Community Health Survey (Cycle 2.1). Using all females as the denominator in the rate calculation can result in artefactual differences in regional rates. In addition, changes in trends of the rates of these procedures can impact the cancer projections. For example, if surgery rates decrease more than expected based on current trends, the incidence rates of cervical, uterine and ovarian cancers would be greater than our projections.
TABLE 5.3.
Prevalence of hysterectomy in women aged 40 and older by geographical area, Canada, 2003
| Province/territory | Prevalence (%) | |
|---|---|---|
| Estimate | 95% CI | |
| Newfoundland and Labrador | 28.7 | (25.4–32.0) |
| Prince Edward Island | 33.5 | (28.2–38.8) |
| Nova Scotia | 37.4 | (34.2–40.6) |
| New Brunswick | 35.2 | (32.2–38.2) |
| Quebec | 28.1 | (26.7–29.4) |
| Ontario | 23 | (22.1–23.9) |
| Manitoba | 21.7 | (19.3–24.1) |
| Saskatchewan | 26.8 | (24.2–29.4) |
| Alberta | 26.2 | (24.3–28.2) |
| British Columbia | 25 | (23.4–26.5) |
| Yukon | 29.8a | (15.8–43.8) |
| Northwest Territories | 15.2 | (10.3–20.2) |
| Nunavut | 19.9a | (9.8–29.9) |
| Canada | 25.8 | (25.2–26.4) |
Source: Canadian Community Health Survey Cycle 2.1 (2003), Share File, using sample weights
Abbreviation: CI, Confidence interval
With large sampling variability
It is useful to acknowledge that forecasting prostate cancer incidence is subject to some uncertainty as a result of over-diagnosis of this cancer because of the PSA test. The common Nordpred approach would predict extreme increases in prostate cancer incidence rates, so this necessitated a model adjustment and/or exclusion of the observed data for certain periods. We used the 2-step approach of the short-term modelling projection following by the long-term constant-rates projection for projecting prostate cancer incidence in this report (see Chapter 2 for details). Several publications have adopted the projection method where future numbers of prostate cancer are affected only by demographic changes.28,35,314 Quon et al.314 assumed that the age-specific incidence rates of prostate cancer in the current year would remain in the future in their ‘‘best-case’’ scenario and predicted that the number of new prostate cancers will increase to 35 121 cases by 2021 in Canada. This is consistent with our estimate of 34 460 new cases annually in 2018–2022. Moller et al.28,35 used the 5-year average method for their projections of prostate cancer incidence in England and Norway. These constant-rate projection methods would result in underestimates of the future burden of prostate cancer if the prevalence of screening is increased or the diagnosis is improved. The future use of the PSA test will principally determine the accuracy of our projections for prostate cancer incidence.
Projections for a cancer with low frequency (whether rare or from a small population) may be subjective and unreliable. Although our projections are based on comparisons of the various models (see Chapter 2 for details) for each of such cancers, they are limited in that the number of cases only met the minimum requirements for some models.
Long-term cancer incidence projections inherently carry some uncertainty as they depend on an assumption about the continuity of past trends. Although this assumption seems reasonable based on historical data, it is likely that increasing focus on lifecourse cancer prevention, especially primordial and primary prevention through reducing risk factors while promoting protective ones, and secondary preventions through screening and early detection, will exert an influence on future incidence rates of preventable cancers. On the other hand, the projections are useful in evaluating the effects of preventive interventions. If rates observed in the future differ from those projected, this suggests that the risk/preventions influencing the rates have changed. The reliability of projections also depends on the accuracy of population forecast. The predicted populations were based on the assumptions on rates of fertility, mortality, interprovincial and international migration, and so on.10 Elements of subjectivity may enter the population projection method. The justifiability of these assumptions can only be decided when the data are available.
Projection, a way to map out possible future cancer scenarios, naturally associates with uncertainty. However, we believe that the results of this study, which are the most reasonable for our present data and the limitations discussed, will provide a useful source for future health planning and evaluation of interventions in Canada.
Implications for future cancer control strategies
The projected aging and growth of the population are expected to cause a progressive and significant increase in the total number of new cases of cancer in Canada over the next 25 years. Consequently, these data indicate the need to continue to strengthen cancer control strategies and leverage resources to meet future health care requirements and reduce the burden of cancer in Canada. Although incidence rates are projected to decrease for many cancers, the rates for some cancers, for example, thyroid, liver, uterus, pancreas, kidney and leukemia, are estimated to increase. Additional etiological research to better understand risk factors and guide prevention efforts is needed.
This monograph underscores the increasing importance of nutrition/diet, physical activity and obesity in relation to cancer prevention as well as the need for continuing efforts to tackle smoking, improve uptake of cancer screening, and increase use of HPV vaccination. The expected effect of future changes in our demographic profiles and cancer trends should be addressed from multidisciplinary perspectives, embracing prevention and early detection, research and surveillance, treatment and psychosocial, palliative and medical care.
Acknowledgements
We would like to acknowledge the contribution of the following people and organizations:
the Health Statistics Division of Statistics Canada, for providing data from the Canadian Cancer Registry (CCR), and the Canadian provincial/territorial cancer registries, for providing data to the CCR;
Dr. Freddie Bray and Dr. Bjorn Moller of the Cancer Registry of Norway and Dr. Michael Otterstatter of the Public Health Agency of Canada for providing methodological support;
Dr. Eric Holowaty of the Dalla Lana School of Public Health at the University of Toronto, Dr. Hannah K. Weir with the Centers for Disease Control and Prevention (US), and Ms. Amanda Shaw and Dr. Michael Otterstatter of the Public Health Agency of Canada for providing a content review;
Ms. Lori Anderson, for providing an editorial review;
The staff members of CancerCare Manitoba who reviewed the risk factor information for the cancer incidence atlas project. This includes Dr. Deepak Pruthi and Dr. Alain Demers along with their site-specific contributors: Dr. Piotr Czaykowski, Dr. Steven Latosinsky, Dr. Robert Lotocki, Dr. Marshall Pitz, Dr. Richard Nason, Dr. Mathew Seftel, Dr. Harminder Singh and Dr. Marni Wiseman.
Footnotes
All ages are in years unless otherwise specified.
All ages are in years unless otherwise specified.
References
- 1.Canadian Cancer Society’s Advisory Committee on Cancer Statistics . Canadian cancer statistics 2013. Toronto (ON): Canadian Cancer Society; 2013. [Google Scholar]
- 2.National Cancer Registry . Cork (IE): National Cancer Registry; 2006. Trends in Irish cancer incidence 1994–2002 with predictions to 2020 [Internet] [cited 2013 Oct 28]. Available from: http://www.ncri.ie/publications/cancer-trends-and-projections/trends-irish-cancer-incidence-1994-2002-predictions-2020. [Google Scholar]
- 3.Møller B, Fekjær H, Hakulinen T, et al. Eur J Cancer Prev. Suppl 11. 2002. Prediction of cancer incidence in the Nordic countries up to the year 2020; pp. S1–96. [PubMed] [Google Scholar]
- 4.Mistry M, Parkin DM, Ahmad AS, Sasieni P. Cancer incidence in the United Kingdom: projections to the year 2030. Br J Cancer. 2011;105:1795–803. doi: 10.1038/bjc.2011.430. [DOI] [PMC free article] [PubMed] [Google Scholar]
- 5.New Zealand: Ministry of Health . New Zealand: Ministry of Health; 2002. Cancer in New Zealand: trends and projections [Internet] [cited 2013 Oct 28]. Available from: http://www.moh.govt.nz/notebook /nbbooks.nsf/0/B005B6A9C2BB332DCC256C83006CF13D?opendocument. [Google Scholar]
- 6.World Health Organization . Geneva (CH): World Health Organization; 1977. International classification of diseases, 9th revision. Volumes 1 and 2. [Google Scholar]
- 7.Fritz A, Percy C, Jack A, et al. 3rd ed. Geneva (CH): World Health Organization; 2000. International classification of diseases for oncology. [Google Scholar]
- 8.National Cancer Institute . Bethesda (MD): National Cancer Institute; 2003. SEER incidence site recode [Internet] [cited 2013 Oct 28]. Available from: http://seer.cancer.gov/siterecode/icdo3_d01272003/ [Google Scholar]
- 9.Statistics Canada . Demographic estimates compendium 2010. Ottawa (ON): Ministry of Industry; 2010. CANSIM table 051-0001 released on September 29, 2010. [Google Scholar]
- 10.Statistics Canada . Ottawa: Ministry of Industry; 2010. Population projections for Canada, provinces and territories: 2009 to 2036 [Internet] [cited 2013 Oct 28]. [Statistics Canada, Catalogue No. 91-520-X] Available from: http://www.statcan.gc.ca/pub/91-520-x/91-520-x2010001-eng.htm. [Google Scholar]
- 11.Breslow N, Day N. The design and analysis of cohort studies. Lyon (FR): IARC Scientific Publications no. 82; 1987. Statistical methods in cancer research. Volume 2: [PubMed] [Google Scholar]
- 12.Hakulinen T, Dyba T. Precision of incidence predictions based on Poisson distributed observations. Stat Med. 1994;13:1513–23. doi: 10.1002/sim.4780131503. [DOI] [PubMed] [Google Scholar]
- 13.Dyba T, Hakulinen T. Comparison of different approaches to incidence prediction based on simple interpolation techniques. Stat Med. 2000;19:1741–52. doi: 10.1002/1097-0258(20000715)19:13<1741::aid-sim496>3.0.co;2-o. [DOI] [PubMed] [Google Scholar]
- 14.Holford TR. The estimation of age, period and cohort effects for vital rates. Biometrics. 1983;39:311–24. [PubMed] [Google Scholar]
- 15.Moller B, Fekjaer H, Hakulinen T, et al. Prediction of cancer incidence in the Nordic countries: Empirical comparison of different approaches. Stat Med. 2003;22:2751–66. doi: 10.1002/sim.1481. [DOI] [PubMed] [Google Scholar]
- 16.Osmond C. Using age, period and cohort models to estimate future mortality rates. Int J Epidemiol. 1985;14:124–9. doi: 10.1093/ije/14.1.124. [DOI] [PubMed] [Google Scholar]
- 17.McCullagh P, Nelder JA. Generalized linear models. 2nd ed. London (UK): Chapman and Hall; 1989. [Google Scholar]
- 18.Hastie TJ, Tibshirani RJ. Generalized additive models. London (UK): Chapman and Hall; 1990. [Google Scholar]
- 19.Wood SN. Generalized additive models: an introduction with R. Boca Raton (Fl): Chapman and Hall; 2006. [Google Scholar]
- 20.Verdecchia A, De Angelis G, Capocaccia R. Estimation and projections of cancer prevalence from cancer registry data. Stat Med. 2002;21:3511–26. doi: 10.1002/sim.1304. [DOI] [PubMed] [Google Scholar]
- 21.Carstensen B. Age-period-cohort models for the lexis diagram. Stat Med. 2007;26:3018–45. doi: 10.1002/sim.2764. [DOI] [PubMed] [Google Scholar]
- 22.Bray I. Application of Markov chain Monte Carlo methods to projecting cancer incidence and mortality. J R Stat Soc Ser C, Appl Stat. 2002;51:151–64. [Google Scholar]
- 23.Robert CP, Casella G. Monte Carlo Statistical Methods. New York: Springer-Verlag; 1999. [Google Scholar]
- 24.Smith BD, Smith GL, Hurria A, Hortobagyi GN, Buchholz TA. Future of cancer incidence in the United States: burdens upon an aging, changing nation. J Clin Oncol. 2009;27:2758–2765. doi: 10.1200/JCO.2008.20.8983. [DOI] [PubMed] [Google Scholar]
- 25.Cancer Registry of Norway . Oslo (NO): Institute of Population-Based Research; 2009. Nordpred software package [software] [cited 2013 Oct 28]. Available from: http://www.kreftregisteret.no/software/nordpred. [Google Scholar]
- 26.Clayton D, Schifflers E. Models for temporal variation in cancer rates. II: Age-period-cohort models. Stat Med. 1987;6:469–81. doi: 10.1002/sim.4780060406. [DOI] [PubMed] [Google Scholar]
- 27.Lee TC, Dean CB, Semenciw R. Short-term cancer mortality projections: a comparative study of prediction methods. Stat Med. 2011;30:3387–402. doi: 10.1002/sim.4373. [DOI] [PubMed] [Google Scholar]
- 28.Moller H, Fairley L, Coupland V, et al. The future burden of cancer in England: incidence and numbers of new patients in 2020. Br J Cancer. 2007;96:1484–8. doi: 10.1038/sj.bjc.6603746. [DOI] [PMC free article] [PubMed] [Google Scholar]
- 29.Coupland VH, Okello C, Davies EA, Bray F, Møller H. The future burden of cancer in London compared with England. J Public Health (Oxf) 2010;32:83–9. doi: 10.1093/pubmed/fdp082. [DOI] [PubMed] [Google Scholar]
- 30.Aitken R, Morell S, Barraclough H, et al. Cancer incidence and mortality projections in New South Wales, 2007 to 2011. New South Wales: Cancer Institute; 2008. [Google Scholar]
- 31.Olsen AH, Parkin DM, Sasieni P. Cancer mortality in the United Kingdom: Projections to the year 2025. Br J Cancer. 2008;99:1549–54. doi: 10.1038/sj.bjc.6604710. [DOI] [PMC free article] [PubMed] [Google Scholar]
- 32.Lunn DJ, Thomas A, Best N, Spiegelhalter D. WinBUGS - a Bayesian modelling framework: concepts, structure, and extensibility. Statistics and Computing. 2000;10:325–37. [Google Scholar]
- 33.Ntzoufras I. Bayesian Modeling Using WinBUGS. Hoboken, New Jersey (NY): John Wiley & Sons; 2009. [Google Scholar]
- 34.Spiegelhalter DJ, Thomas A, Best NG, Lunn D. Cambridge (UK): The BUGS Project; 1996. BUGS Examples Volume 2 [Internet] [cited 2013 Oct 28]. Available from: http://www.mrc-bsu.cam.ac.uk/bugs/winbugs/Vol2.pdf. [Google Scholar]
- 35.Cancer Registry of Norway . Oslo (NO): Cancer Registry of Norway; 2012. Cancer in Norway 2005—Special issue: Predictions of cancer incidence by health region 2010–2020 [Internet] [cited 2013 Oct 28]. Available from: http://www.kreftregisteret.no/en/General/Publications/Cancer-in-Norway/Cancer-in-Norway-2005/ [Google Scholar]
- 36.Canadian Cancer Society’s Steering Committee on Cancer Statistics . Canadian cancer statistics 2011. Toronto (ON): Canadian Cancer Society; 2011. [Google Scholar]
- 37.Band PR, Gaudette LA, Hill GB, et al. The making of the Canadian Cancer Registry: cancer incidence in Canada and its regions, 1969 to 1988. Ottawa: Minister of Supply and Services; 1993. [Google Scholar]
- 38.Pelletier G. Collection Données statistiques et Indicateurs. Quebec: Government of Quebec, Ministry of Health and Social Services, Planning and Evaluation Branch; 1993. La survie reliéé au cancer. Étude des nouveau cas de cancer déclarés au Québec au cours des années 1984, 1985, et 1986. [Google Scholar]
- 39.Larsen RJ, Marx ML. An introduction to mathematical statistics and its applications. 3rd ed. Upper Saddle River (NJ): Prentice Hall; 2001. [Google Scholar]
- 40.Kim HJ, Fay MP, Feuer EJ, Midthune DN. Permutation tests for joinpoint regression with applications to cancer rates. Stat Med. 2000;19:335–51. doi: 10.1002/(sici)1097-0258(20000215)19:3<335::aid-sim336>3.0.co;2-z. [DOI] [PubMed] [Google Scholar]
- 41.National Cancer Institute . Bethesda (MD): National Cancer Institute; 2013. Joinpoint regression program [Internet software] [updated 2013 May 6; cited 2013 Oct 30]. Available from: http://surveillance.cancer.gov/joinpoint/ [Google Scholar]
- 42.National Cancer Institute of Canada . Canadian cancer statistics 2000. Toronto (ON): Canadian Cancer Society; 2000. [Google Scholar]
- 43.Health Canada . Ottawa (ON): Health Canada; 2011. Canadian Tobacco Use Monitoring Survey (CTUMS) 2011 [Internet] [cited 2013 Sept 4]. Available from: http://www.hc-sc.gc.ca/hc-ps/tobac-tabac/research-recherche/stat/ctums-esutc_2011-eng.php. [Google Scholar]
- 44.Weiss W. Cigarette smoking and lung cancer trends. A light at the end of the tunnel? Chest. 1997;111:1414–6. doi: 10.1378/chest.111.5.1414. [DOI] [PubMed] [Google Scholar]
- 45.Canadian Partnership Against Cancer . Toronto (ON): Canadian Partnership Against Cancer; 2013. Cervical cancer screening in Canada: programs and strategies [Internet] [updated 2013 Mar; cited 2013 Oct 28]. Available from: http://www.cancerview.ca/idc/groups/public/documents/webcontent/cervical_cancer_screen_pro.pdf. [Google Scholar]
- 46.Canadian Partnership Against Cancer . Cervical cancer control in Canada [Internet] Toronto (ON): Canadian Partnership Against Cancer; 2013. [updated 2012 Aug 20; cited 2013 Oct 28]. Available from: http://www.cancerview.ca/cv/portal/Home/Prevention AndScreening/PSProfessionals/PSScreeningAndEarlyDiagnosis/CervicalCancerControlInCanada?_afrLoop=2134228682807000&lang=en&_afrWindowMode=0&_adf.ctrl-state=18nxh7zwbr_890. [Google Scholar]
- 47.International Agency for Research on Cancer . Lyon (FR): International Agency for Research on Cancer; 2013. Agents classified by the IARC monographs, Volumes 1-109 IARC Monographs on the evaluation of carcinogenic risks to humans [Internet] [updated 2013 Oct 30; cited 2013 Dec 21]. Available from: http://monographs.iarc.fr/ENG/Classification/index.php. [Google Scholar]
- 48.Turati F, Garavello W, Tramacere I, et al. A meta-analysis of alcohol drinking and oral and pharyngeal cancers: results from subgroup analyses. Alcohol Alcohol. 2013;48:107–18. doi: 10.1093/alcalc/ags100. [DOI] [PubMed] [Google Scholar]
- 49.Gandini S, Botteri E, Iodice S, et al. Tobacco smoking and cancer: a meta-analysis. Int J Cancer. 2008;122:155–64. doi: 10.1002/ijc.23033. [DOI] [PubMed] [Google Scholar]
- 50.Bagnardi V, Blangiardo M, La Vecchia C, Corrao G. A meta-analysis of alcohol drinking and cancer risk. Br J Cancer. 2001;85:1700–5. doi: 10.1054/bjoc.2001.2140. [DOI] [PMC free article] [PubMed] [Google Scholar]
- 51.Statistics Canada . Ottawa (ON): Statistics Canada; 2013. Health trends 2013 [Internet] [cited 2013 Oct 28]. [Statistics Canada Catalogue No. 82-213-XWE]. Available from: http://www12.statcan.gc.ca/health-sante/82-213/index.cfm?Lang=eng. [Google Scholar]
- 52.Kufe DW, Bast RC, Jr, Hait WN, et al. Cancer medicine. 7th ed. Hamilton (ON): BC Decker Inc.; 2006. [Google Scholar]
- 53.Haskell CM. Cancer treatment. 5th ed. Philadelphia (PA): WB Saunders Company; 2001. [Google Scholar]
- 54.Forte T, Niu J, Lockwood GA, Bryant HE. Incidence trends in head and neck cancers and human papillomavirus (HPV)-associated oropharyngeal cancer in Canada, 1992-2009. Cancer Causes Control. 2012;23(8):1343–8. doi: 10.1007/s10552-012-0013-z. [DOI] [PubMed] [Google Scholar]
- 55.Johnson-Obaseki S, McDonald JT, Corsten M, Rourke R. Head and neck cancer in Canada: trends 1992 to 2007. Otolaryngol Head Neck Surg. 2012;147(1):74–8. doi: 10.1177/0194599812437332. [DOI] [PubMed] [Google Scholar]
- 56.Jemal A, Simard EP, Dorell C, et al. Annual Report to the Nation on the Status of Cancer, 1975-2009, featuring the burden and trends in human papillomavirus(HPV)-associated cancers and HPV vaccination coverage levels. J Natl Cancer Inst. 2013;105(3):175–201. doi: 10.1093/jnci/djs491. [DOI] [PMC free article] [PubMed] [Google Scholar]
- 57.Blomberg M, Nielsen A, Munk C, Kjaer SK. Trends in head and neck cancer incidence in Denmark, 1978-2007: focus on human papil-lomavirus associated sites. Int J Cancer. 2011;129(3):733–41. doi: 10.1002/ijc.25699. [DOI] [PubMed] [Google Scholar]
- 58.Shin A, Jung YS, Jung KW, Kim K, Ryu J, Won YJ. Trends of human papillomavirus-related head and neck cancers in Korea: National cancer registry data Laryngoscope. 2013 Nov;123(11):E30–7. doi: 10.1002/lary.24243. [DOI] [PubMed] [Google Scholar]
- 59.National Advisory Committee on Immunization (NACI) Update on human papilloma-virus (HPV) vaccines. An Advisory Committee Statement (ACS). CCDR. 2012:38 (ACS-1) Ottawa (ON): Public Health Agency of Canada; [updated 2012 Aug 27; cited 2013 Dec 21]. Available from: http://www.phac-aspc-.gc.ca/publicat/ccdr-rmtc/12vol38/acs-dcc-1/index-eng.php. [Google Scholar]
- 60.Wilson SE, Harris T, Sethi P, Fediurek J, Macdonald L, Deeks SL. Coverage from Ontario, Canada’s school-based HPV vaccine program: the first three years. Vaccine. 2013;31(5):757–62. doi: 10.1016/j.vaccine.2012.11.090. [DOI] [PubMed] [Google Scholar]
- 61.Canadian Cancer Society’s Steering Committee on Cancer Statistics . Canadian cancer statistics 2010. Toronto (ON): Canadian Cancer Society; 2010. [Google Scholar]
- 62.Lagergren J. Etiology and risk factors for oesophageal adenocarcinoma: possibilities for chemoprophylaxis? Best Pract Res Clin Gastroenterol. 2006;20:803–12. doi: 10.1016/j.bpg.2006.04.009. [DOI] [PubMed] [Google Scholar]
- 63.Blot WJ, McLaughlin JK, Fraumeni JF., Jr . Esophageal cancer. In: Schottenfeld D, Fraumeni JF Jr, editors. Cancer epidemiology and prevention. 3rd ed. New York (NY): Oxford University Press; 2006. pp. 697–706. [Google Scholar]
- 64.Thrift AP, Whiteman DC. The incidence of esophageal adenocarcinoma continues to rise: analysis of period and birth cohort effects on recent trends. Ann Oncol. 2012;23:3155–62. doi: 10.1093/annonc/mds181. [DOI] [PubMed] [Google Scholar]
- 65.Freedman ND, Abnet CC, Leitzmann MF, et al. A prospective study of tobacco, alcohol, and the risk of esophageal and gastric cancer subtypes. Am J Epidemiol. 2007;165:1424–33. doi: 10.1093/aje/kwm051. [DOI] [PubMed] [Google Scholar]
- 66.Lee YC, Marron M, Benhamou S, et al. Active and involuntary tobacco smoking and upper aerodigestive tract cancer risks in a multi-center case-control study. Cancer Epidemiol Biomarkers Prev. 2009;18:3353–61. doi: 10.1158/1055-9965.EPI-09-0910. [DOI] [PMC free article] [PubMed] [Google Scholar]
- 67.Engel LS, Chow WH, Vaughan TL, et al. Population attributable risks of esophageal and gastric cancers. J Natl Cancer Inst. 2003;95:1404–13. doi: 10.1093/jnci/djg047. [DOI] [PubMed] [Google Scholar]
- 68.Lagergren J, Lagergren P. Recent developments in esophageal adenocarcinoma. CA Cancer J Clin. 2013;63:232–48. doi: 10.3322/caac.21185. [DOI] [PubMed] [Google Scholar]
- 69.Fedorak RN, van Zanten SV, Bridges R. Canadian Digestive Health Foundation Public Impact Series: gastroesophageal reflux disease in Canada: incidence, prevalence, and direct and indirect economic impact. Can J Gastroenterol. 2010;24:431–4. doi: 10.1155/2010/296584. [DOI] [PMC free article] [PubMed] [Google Scholar]
- 70.Renehan AG, Tyson M, Egger M, Heller RF, Zwahlen M. Body-mass index and incidence of cancer: a systematic review and meta-analysis of prospective observational studies. Lancet. 2008;371:569–78. doi: 10.1016/S0140-6736(08)60269-X. [DOI] [PubMed] [Google Scholar]
- 71.Steffen A, Schulze MB, Pischon T, et al. Anthropometry and esophageal cancer risk in the European prospective investigation into cancer and nutrition. Cancer Epidemiol Biomarkers Prev. 2009;18:2079–89. doi: 10.1158/1055-9965.EPI-09-0265. [DOI] [PubMed] [Google Scholar]
- 72.Tjepkema M. Nutrition: findings from the Canadian Community Health Survey, no. 1. [Statistics Canada Catalogue No. 82-620-MWE] Ottawa (ON): Statistics Canada; 2006. Adult obesity in Canada: measured height and weight. [Google Scholar]
- 73.Public Health Agency of Canada . Ottawa (ON): Public Health Agency of Canada; 2011. Obesity in Canada [Internet] [updated 2011 Jun 23; cited 2013 Oct 28]. Available from: http://www.phac-aspc.gc.ca/hp-ps/hl-mvs/oic-oac/adult-eng.php#figure-1. [Google Scholar]
- 74.El-Serag HB. Time trends of gastroesopha-geal reflux disease: a systematic review. Clin Gastroenterol Hepatol. 2007;5:17–26. doi: 10.1016/j.cgh.2006.09.016. [DOI] [PubMed] [Google Scholar]
- 75.Statistics Canada . Ottawa (ON): Statistics Canada; Population by selected ethnic origins, by province and territory (2006 Census). [Internet] [updated 2009 Jul 28; cited 2009 Jul 28]. Available from: http://www.statcan.gc.ca/tables-tableaux/sum-som/l01/cst01/demo26k-eng.htm. [Google Scholar]
- 76.World Health Organization . Geneva (CH): World Health Organization; 2013. Hepatitis B. Fact sheet no. 204 [Internet] [updated 2013 Jul; cited 2013 Oct 28]. Available from: http://www.who.int/mediacentre/factsheets/fs204/en/ [Google Scholar]
- 77.Ott JJ, Stevens GA, Groeger J, Wiersma ST. Global epidemiology of hepatitis B virus infection: new estimates of age-specific HBsAg seroprevalence and endemicity. Vaccine. 2012;30:2212–9. doi: 10.1016/j.vaccine.2011.12.116. [DOI] [PubMed] [Google Scholar]
- 78.Burak KW, Coffin CS, Myers RP. Hepatitis B awareness and education: a failing grade. Can J Gastroenterol. 2011;25:125–6. doi: 10.1155/2011/956763. [DOI] [PMC free article] [PubMed] [Google Scholar]
- 79.Nagini S. Carcinoma of the stomach: a review of epidemiology, pathogenesis, molecular genetics and chemoprevention. World J Gastrointest Oncol. 2012;4(7):156–69. doi: 10.4251/wjgo.v4.i7.156. [DOI] [PMC free article] [PubMed] [Google Scholar]
- 80.D’Elia L, Rossi G, Ippolito R, Cappuccio FP, Strazzullo P. Habitual salt intake and risk of gastric cancer: a meta-analysis of prospective studies. Clin Nutr. 2012;31(4):489–98. doi: 10.1016/j.clnu.2012.01.003. [DOI] [PubMed] [Google Scholar]
- 81.Statistics Canada . Ottawa (ON): Statistics Canada; 2009. Food statistics 2009. [cited 2013 Oct 28]. [Statistics Canada, Catalogue No. 21-020-XWE]. Available from: http://www.statcan.gc.ca/bsolc/olc-cel/olc-cel?catno=21-020-XWE&lang=eng. [Google Scholar]
- 82.Howson CP, Hiyama T, Wynder EL. The decline in gastric cancer: epidemiology of an unplanned triumph. Epidemiol Rev. 1986;8:1–27. doi: 10.1093/oxfordjournals.epirev.a036288. [DOI] [PubMed] [Google Scholar]
- 83.International Agency for Research on Cancer . IARC Monographs on the Evaluation of Carcinogenic Risks to Humans, Vol. 61. Lyon (FR): IARC Press; 1994. Schistosomes, liver flukes and Helicobacter pylori. [PMC free article] [PubMed] [Google Scholar]
- 84.Public Health Agency of Canada . Ottawa (ON): Public Health Agency of Canada; 2013. Colorectal cancer [Internet] [updated 2013 Apr 22; cited 2013 Oct 28]. Available from: www.phac-aspc.gc.ca/cd-mc/cancer/colorectal_cancer-cancer_colorectal-eng.php. [Google Scholar]
- 85.Cancer Research UK . London (UK): Cancer Research UK; 2012. Bowel cancer risk factors [Internet] [updated 2012 Jan 31; cited 2013 Oct 28]. Available from: http://www.cancerresearchuk.org/cancer-info/cancerstats/types/bowel/riskfactors/#sourcep. [Google Scholar]
- 86.Boyle P, Levin B, editors. World Cancer report 2008 [Internet] Lyon (FR): International Agency for Research on Cancer; 2008. [cited 2013 Oct 28]. Available from: http:// www.iarc.fr/en/publications/pdfs-online/wcr/2008/wcr_2008.pdf. [Google Scholar]
- 87.Aune D, Lau R, Chan DS, et al. Nonlinear reduction in risk for colorectal cancer by fruit and vegetable intake based on meta-analysis of prospective studies. Gastroenterology. 2011;141:106–18. doi: 10.1053/j.gastro.2011.04.013. [DOI] [PubMed] [Google Scholar]
- 88.Labonte R, Muhajarine N, Winquist B, Quail J. Waterloo (ON): Waterloo University; 2010. Healthy populations: a report of the Canadian index of wellbeing (CIW) [Internet] September. [cited 2013 Oct 28]. Available from: http://uwaterloo.ca/canadian-index-wellbeing/sites/ca.canadian-index-wellbeing/files/uploads/files/HealthyPopulation_DomainReport.sflb_.pdf. [Google Scholar]
- 89.Lin KJ, Cheug WY, Lai JY, Giovannucci EL. The effect of estrogen vs. combined estrogen-progestogen therapy on the risk of colorectal cancer. Int J Cancer. 2012;130:419–30. doi: 10.1002/ijc.26026. [DOI] [PubMed] [Google Scholar]
- 90.Garriguet D. Canadians’ eating habits. Health Rep. 2007;18:17–32. [PubMed] [Google Scholar]
- 91.Nesbitt A, Majowicz S, Finley R. Food consumption patterns in the Waterloo Region, Ontario, Canada: a cross-sectional telephone survey. BMC Public Health. 2008;8:370. doi: 10.1186/1471-2458-8-370. [DOI] [PMC free article] [PubMed] [Google Scholar]
- 92.Edwards BK, Ward E, Kohler BA, et al. Annual report to the nation on the status of cancer, 1975-2006, featuring colorectal cancer trends and impact of interventions (risk factors, screening, and treatment) to reduce future rates. Cancer. 2010;116:544–573. doi: 10.1002/cncr.24760. [DOI] [PMC free article] [PubMed] [Google Scholar]
- 93.Edwards BK, Noone AM, Mariotto AB, et al. Annual Report to the Nation on the status of cancer, 1975-2010, featuring prevalence of comorbidity and impact on survival among persons with lung, colorectal, breast, or prostate cancer. Cancer. 2014;120:1290–314. doi: 10.1002/cncr.28509. [DOI] [PMC free article] [PubMed] [Google Scholar]
- 94.Canadian Partnership Against Cancer . Toronto (ON): Canadian Partnership Against Cancer; 2010. Colorectal cancer screening - 2010 [Internet] [cited 2013 Dec 21]. Available from: http://www.cancerview.ca/idc/groups/public/documents/webcontent/rl_cancer_1crcscreen.pdf. [Google Scholar]
- 95.Kadiyala S, Strumpf EC. Are United States and Canadian cancer screening rates consistent with guideline information regarding the age of screening initiation? Int J Qual Health Care. 2011;23:611–20. doi: 10.1093/intqhc/mzr050. [DOI] [PubMed] [Google Scholar]
- 96.El-Seraq HB. Hepatocellular carcinoma. N Engl J Med. 2011;365:1118–27. doi: 10.1056/NEJMra1001683. [DOI] [PubMed] [Google Scholar]
- 97.Yang JD, Kim B, Sanderson SO, et al. Hepatocellular carcinoma in Olmsted County, Minnesota, 1976-2008. Mayo Clin Proc. 2012;87:9–16. doi: 10.1016/j.mayocp.2011.07.001. [DOI] [PMC free article] [PubMed] [Google Scholar]
- 98.Dyer Z, Peltekian K, van Zanten SV. Review article: the changing epidemiology of hepa-tocellular carcinoma in Canada. Aliment Pharmacol Ther. 2005;22:17–22. doi: 10.1111/j.1365-2036.2005.02504.x. [DOI] [PubMed] [Google Scholar]
- 99.Public Health Agency of Canada . Ottawa (ON): Public Health Agency of Canada; 2012. Hepatitis C in Canada: 2005-2010 surveillance report [Internet] [cited 2013 Dec 21]. Available from: http://www.phac-aspc.gc.ca/sti-its-surv-epi/hepc/surv-eng.php. [Google Scholar]
- 100.Bosch FX, Rives J, Diaz M, Cléries R. Primary liver cancer: worldwide incidence and trends. Gastrenterology. 2004;127:S7–16. doi: 10.1053/j.gastro.2004.09.011. [DOI] [PubMed] [Google Scholar]
- 101.Zou S, Tepper M, El Saadany S. Prediction of hepatitis C burden in Canada. Can J Gastroenterol. 2000;14:575–80. doi: 10.1155/2000/642707. [DOI] [PubMed] [Google Scholar]
- 102.Public Health Agency of Canada . Ottawa (ON): Public Health Agency of Canada; 2004. National immunization strategy: final report 2003. [updated 2004 Jun 16; cited 2013 Oct 28]. Available from: http://www.phac-aspc.gc.ca/publicat/nis-sni-03/b2-eng.php. [Google Scholar]
- 103.Public Health Agency of Canada . Ottawa (ON): Public Health Agency of Canada; 2012. Vaccine-preventable diseases [Internet] [updated 2012 Jul 20; cited 2013 Oct 28]. Available from: http://www.phac-aspc.gc.ca/im/vpd-mev/index-eng.php. [Google Scholar]
- 104.McDermott S, DesMeules M, Lewis R, et al. Cancer incidence among Canadian immigrants, 1980-1998: results from a national cohort study. J Immigr Minor Health. 2011;13:15–26. doi: 10.1007/s10903-010-9347-3. [DOI] [PubMed] [Google Scholar]
- 105.Statistics Canada . Ottawa (ON): Statistics Canada; 2007. Immigrant population by place of birth, by province and territory (2006 Census) [Internet] [updated 2007 Dec 11; cited 2013 Oct 28]. Available from: http://www.statcan.gc.ca/tables-tableaux /sum-som/l01/cst01/demo34a-eng.htm. [Google Scholar]
- 106.Statistics Canada . Ottawa (ON): Statistics Canada; 2010. Selected trend data for Canada, 1996, 2001 and 2006 censuses [Internet] [updated 2010 Feb 6; cited 2013 Oct 28]. Available from: www12.statcan.gc.ca/census-recensement/2006/dp-pd/92-596/P1-2.cfm?Lang=eng&T=PR&PRCODE=01&GEOCODE=01&GEOLVL=PR&TID=0. [Google Scholar]
- 107.Nordenstedt H, White DL, El-Serag HB. The changing pattern of epidemiology in hepa-tocellular carcinoma. Dig Liver Dis. 2010;42(Suppl 3):S206–14. doi: 10.1016/S1590-8658(10)60507-5. [DOI] [PMC free article] [PubMed] [Google Scholar]
- 108.Eheman C, Henley SJ, Ballard-Barbash R, et al. Annual Report to the Nation on the status of cancer, 1975-2008, featuring cancers associated with excess weight and lack of sufficient physical activity. Cancer. 2012;118:2338–66. doi: 10.1002/cncr.27514. [DOI] [PMC free article] [PubMed] [Google Scholar]
- 109.Mittal S, El-Serag HB. Epidemiology of hepatocellular carcinoma: consider the population. J Clin Gastroenterol. 2013;47(Suppl):S2–6. doi: 10.1097/MCG.0b013e3182872f29. [DOI] [PMC free article] [PubMed] [Google Scholar]
- 110.Shields M, Tremblay MS, Laviolette M, Craig CL, Janssen I, Connor Gorber S. Fitness of Canadian adults: results from the 2007-2009 Canadian Health Measures Survey. Health Rep. 2010;21:21–35. [PubMed] [Google Scholar]
- 111.Devita VT, Jr, Hellman S, Rosenberg SA. Cancer: principles & practice of oncology. 7th ed. Philadelphia (PA): Lippincott Williams & Wilkins; 2005. [Google Scholar]
- 112.Villeneuve PJ, Johnson KC, Mao Y, Hanley AJ. Environmental tobacco smoke and the risk of pancreatic cancer: findings from a Canadian population-based case-control study. Can J Public Health. 2004;95:32–7. doi: 10.1007/BF03403631. [DOI] [PMC free article] [PubMed] [Google Scholar]
- 113.Gallicchio L, Kouzis A, Genkinger J, et al. Active cigarette smoking, household passive smoke exposure, and the risk of developing pancreatic cancer. Prev Med. 2006;42:200–5. doi: 10.1016/j.ypmed.2005.12.014. [DOI] [PubMed] [Google Scholar]
- 114.Weiss W, Benarde MA. The temporal relation between cigarette smoking and pancreatic cancer. Am J Public Health. 1983;73:1403–4. doi: 10.2105/ajph.73.12.1403. [DOI] [PMC free article] [PubMed] [Google Scholar]
- 115.Silverman DT, Schiffman M, Everhart J, et al. Diabetes mellitus, other medical conditions and familial history of cancer as risk factors for pancreatic cancer. Br J Cancer. 1999;80:1830–7. doi: 10.1038/sj.bjc.6690607. [DOI] [PMC free article] [PubMed] [Google Scholar]
- 116.Ghadirian P, Lynch HT, Krewski D. Epidemiology of pancreatic cancer: an overview. Cancer Detect Prev. 2003;27:87–93. doi: 10.1016/s0361-090x(03)00002-3. [DOI] [PubMed] [Google Scholar]
- 117.World Cancer Research Fund/American Institute for Cancer Research . World Cancer Research Fund; 2012. Continuous Update Project: keeping the science current. Pancreatic cancer 2012 report: food, nutrition, physical activity, and the prevention of pancreatic cancer [Internet] [cited 2013 Dec 21]. Available from: http://www.dietandcancerreport.org/cup/current_progress/pancreatic_cancer.php. [Google Scholar]
- 118.Bao Y, Michaud DS, Spiegelman D. Folate intake and risk of pancreatic cancer: pooled analysis of prospective cohort studies. J Natl Cancer Inst. 2011;103:1840–50. doi: 10.1093/jnci/djr431. [DOI] [PMC free article] [PubMed] [Google Scholar]
- 119.Aune D, Greenwood DC, Chan DS, et al. Body mass index, abdominal fatness and pancreatic cancer risk: a systematic review and non-linear dose-response meta-analysis of prospective studies. Ann Oncol. 2012;23:843–52. doi: 10.1093/annonc/mdr398. [DOI] [PubMed] [Google Scholar]
- 120.O’Rorke M, Cantwell MM, Cardwell CR, Mulholland HG, Murray LJ. Can physical activity modulate pancreatic cancer risk? a systematic review and meta-analysis. Int J Cancer. 2010;126:2957–68. doi: 10.1002/ijc.24997. [DOI] [PubMed] [Google Scholar]
- 121.Bao Y, Michaud DS. Physical activity and pancreatic cancer risk: a systematic review. Cancer Epidemiol Biomarkers Prev. 2008;17:2671–82. doi: 10.1158/1055-9965.EPI-08-0488. [DOI] [PMC free article] [PubMed] [Google Scholar]
- 122.Ben Q, Xu M, Ning X, et al. Diabetes mellitus and risk of pancreatic cancer: A meta-analysis of cohort studies. Eur J Cancer. 2011;47:1928–37. doi: 10.1016/j.ejca.2011.03.003. [DOI] [PubMed] [Google Scholar]
- 123.Elena JW, Steplowski E, Yu K, et al. Diabetes and risk of pancreatic cancer: a pooled analysis from the pancreatic cancer cohort consortium. Cancer Causes Control. 2013;24:13–25. doi: 10.1007/s10552-012-0078-8. [DOI] [PMC free article] [PubMed] [Google Scholar]
- 124.Cancer Research UK . Pancreatic cancer incidence statistics [Internet] London (UK): Cancer Research UK; 2013. [updated 2013 Oct 18; cited 2013 Oct 28]. Available from: http://www.cancerresearchuk.org/cancer-info/cancerstats/types/pancreas/incidence/#trends. [Google Scholar]
- 125.Berrino F, Crosignani P. [Epidemiology of malignant tumors of the larynx and lung] Ann Ist Super Sanita. 1992;28:107–20. [PubMed] [Google Scholar]
- 126.Burch JD, Howe GR, Miller AB, Semenciw R. Tobacco, alcohol, asbestos, and nickel in the etiology of cancer of the larynx: a case-control study. J Natl Cancer Inst. 1981;67:1219–24. [PubMed] [Google Scholar]
- 127.Health Canada . Ottawa (ON): Health Canada; 2012. Canadian Alcohol and Drug Use Monitoring Survey: summary of results for 2011. [updated 2012 Jul 03; cited 2013 Oct 28]. Available from: http://www.hc-sc.gc.ca/hc-ps/drugs-drogues/stat/_2011/summary-sommaire-eng.php#alc. [Google Scholar]
- 128.Surgeon General . Washington (DC): U.S. Department of Health and Human Services, Centers for Disease Control; 1989. Reducing the health consequences of smoking: 25 years of progress. [Google Scholar]
- 129.Shopland DR. Tobacco use and its contribution to early cancer mortality with a special emphasis on cigarette smoking. Environ Health Perspect. 1995;103:131–42. doi: 10.1289/ehp.95103s8131. [DOI] [PMC free article] [PubMed] [Google Scholar]
- 130.Brisson J, Major D, Pelletier E. Québec (QC): Institut national de la santé publique du Québec; 2003. Évaluation de l’exhaustivité du fichier des tumeurs du Québec. [Google Scholar]
- 131.Sneyd M, Cox B. The control of melanoma in New Zealand. N Z Med J. 2006;119:U2169. [PubMed] [Google Scholar]
- 132.Gandini S, Sera F, Cattaruzza MS, et al. Meta-analysis of risk factors for cutaneous melanoma: II. Sun exposure. Eur J Cancer. 2005;41:45–60. doi: 10.1016/j.ejca.2004.10.016. [DOI] [PubMed] [Google Scholar]
- 133.Elwood JM, Jopson J. Melanoma and sun exposure: an overview of published studies. Int J Cancer. 1997;73:198–203. doi: 10.1002/(sici)1097-0215(19971009)73:2<198::aid-ijc6>3.0.co;2-r. [DOI] [PubMed] [Google Scholar]
- 134.Miller AJ, Mihm MC., Jr Melanoma. N Engl J Med. 2006;355:51–65. doi: 10.1056/NEJMra052166. [DOI] [PubMed] [Google Scholar]
- 135.Naldi L, Randi G, Di Landro A, La Vecchia C. Red hHairs, number of nevi, and risk of cutaneous malignant melonoma: results from a case-control study in Italy. Arch Dermatol. 2006;142:935–6. doi: 10.1001/archderm.142.7.935. [DOI] [PubMed] [Google Scholar]
- 136.Olsen CM, Carroll HJ, Whiteman DC. Estimating the attributable fraction for melanoma: a meta-analysis of pigmentary characteristics and freckling. Int J Cancer. 2010;127:2430–45. doi: 10.1002/ijc.25243. [DOI] [PubMed] [Google Scholar]
- 137.Williams PF, Olsen CM, Hayward NK, Whiteman DC. Melanocortin 1 receptor and risk of cutaneous melanoma: a meta-analysis and estimates of population burden. Int J Cancer. 2011;129:1730–40. doi: 10.1002/ijc.25804. [DOI] [PubMed] [Google Scholar]
- 138.Olsen CM, Carroll HJ, Whiteman DC. Familial melanoma: a meta-analysis and estimates of attributable fraction. Cancer Epidemiol Biomarkers Prev. 2010;19:65–73. doi: 10.1158/1055-9965.EPI-09-0928. [DOI] [PubMed] [Google Scholar]
- 139.Gandini S, Sera F, Cattaruzza MS, et al. Meta-analysis of risk factors for cutaneous melanoma: III. Family history, actinic damage and phenotypic factors. Eur J Cancer. 2005;41:2040–59. doi: 10.1016/j.ejca.2005.03.034. [DOI] [PubMed] [Google Scholar]
- 140.Law MH, Macgregor S, Hayward NK. Melanoma genetics: recent findings take us beyond well-traveled pathways. J Invest Dermatol. 2012;132:1763–74. doi: 10.1038/jid.2012.75. [DOI] [PubMed] [Google Scholar]
- 141.Erdmann F, Lortet-Tieulent J, Schu¨z J, et al. International trends in the incidence of malignant melanoma 1953-2008—are recent generations at higher or lower risk? Int J Cancer. 2013;132:385–400. doi: 10.1002/ijc.27616. [DOI] [PubMed] [Google Scholar]
- 142.Shields M, Wilkins K. An update on mam-mography use in Canada. Health Rep. 2009;20:7–19. [PubMed] [Google Scholar]
- 143.Canadian Task Force on Preventive Health Care . Edmonton (AB): Canadian Task Force on Preventive Health Care; 2014. Screening for Breast Cancer -Summary of recommendations for clinicians and policy-makers [Internet] [cited 2014 Mar 28]. Available from: http://canadiantaskforce.ca/guidelines/2011-breast-cancer/ [Google Scholar]
- 144.Canadian Association of Radiologists . Ottawa (ON): Canadian Association of Radiologists; CAR practice guidelines and technical standards for breast imaging and intervention. [updated 2012 Sep 29; cited 2014 Mar 28]. Available from: http://www.car.ca/uploads/standards%20guidelines/20131024_en_breast_imaging_practice_guidelines.pdf. [Google Scholar]
- 145.Zahl PH, Strand BH, Maehlen J. Incidence of breast cancer in Norway and Sweden during introduction of nationwide screening: prospective cohort study. BMJ. 2004;328:921–4. doi: 10.1136/bmj.38044.666157.63. [DOI] [PMC free article] [PubMed] [Google Scholar]
- 146.Miller AB, Wall C, Baines CJ, Sun P, To T, Narod SA. Twenty five year follow-up for breast cancer incidence and mortality of the Canadian National Breast Screening Study: randomised screening trial. BMJ. 2014;348:g366. doi: 10.1136/bmj.g366. [DOI] [PMC free article] [PubMed] [Google Scholar]
- 147.Key TJ, Verkasalo PK, Banks E. Epidemiology of breast cancer. Lancet Oncol. 2001;2:133–40. doi: 10.1016/S1470-2045(00)00254-0. [DOI] [PubMed] [Google Scholar]
- 148.Ford D, Nault F. Changing Fertility Patterns, 1974 to 1994. Health Reports. 1996;8:39–46. [PubMed] [Google Scholar]
- 149.Statistics Canada . Ottawa: Statistics Canada; Births and total fertility rate, by province and territory (Fertility rate) [Internet] [updated 2013 Mar 19; cited 2013 Sept 6]. Available from: http://www.statcan.gc.ca/tables-tableaux/sum-som/l01/cst01/hlth85b-eng.htm. [Google Scholar]
- 150.Nelson HD, Humphrey LL, Nygren P, Teutsch SM, Allan JD. Postmenopausal hormone replacement therapy: scientific review. JAMA. 2002;288:872–81. doi: 10.1001/jama.288.7.872. [DOI] [PubMed] [Google Scholar]
- 151.Cancer Research UK . London (UK): Cancer Research UK; Breast cancer risk factors [Internet] [updated 2013 Dec 17; cited 2013 Dec 19]. Available from: http://www.cancerresearchuk.org/cancer-info/cancerstats/types/breast/riskfactors/ [Google Scholar]
- 152.Rossouw JE, Anderson GL, Prentice RL, et al. Risks and benefits of estrogen plus progestin in healthy postmenopausal women: principal results from the Women’s Health Initiative randomized controlled trial. JAMA. 2002;288(3):321–33. doi: 10.1001/jama.288.3.321. [DOI] [PubMed] [Google Scholar]
- 153.De P, Neutel CI, Olivotto I, Morrison H. Breast cancer incidence and hormone replacement therapy in Canada. J Natl Cancer Inst. 2010;102(19):1489–95. doi: 10.1093/jnci/djq345. [DOI] [PubMed] [Google Scholar]
- 154.Boyd NF, Martin LJ, Sun L, et al. Body size, mammographic density, and breast cancer risk. Cancer Epidemiol Biomarkers Prev. 2006;15:2086–92. doi: 10.1158/1055-9965.EPI-06-0345. [DOI] [PubMed] [Google Scholar]
- 155.Boyd NF, Martin LJ, Yaffe MJ, Minkin S. Mammographic density and breast cancer risk: current understanding and future prospects. Breast Cancer Res. 2011;13:223. doi: 10.1186/bcr2942. [DOI] [PMC free article] [PubMed] [Google Scholar]
- 156.Boyd N, Martin L, Stone J, Little L, Minkin S, Yaffe M. A longitudinal study of the effects of menopause on mammographic features. Cancer Epidemiol Biomarkers Prev. 2002;11(10 Pt 1):1048–53. [PubMed] [Google Scholar]
- 157.Huo CW, Chew GL, Britt KL, et al. Mammographic density-a review on the current understanding of its association with breast cancer. Breast Cancer Res Treat. 2014;144:479–502. doi: 10.1007/s10549-014-2901-2. [DOI] [PubMed] [Google Scholar]
- 158.Bertrand KA, Tamimi RM, Scott CG, et al. Mammographic density and risk of breast cancer by age and tumor characteristics. Breast Cancer Res. 2013;15:R104. doi: 10.1186/bcr3570. [DOI] [PMC free article] [PubMed] [Google Scholar]
- 159.Parkin DM, Boyd L, Walker LC. The fraction of cancer attributable to lifestyle and environmental factors in the UK in 2010. Summary and conclusions. Br J Cancer. 2011;105:S77–81. doi: 10.1038/bjc.2011.489. [DOI] [PMC free article] [PubMed] [Google Scholar]
- 160.Monninkhof EM, Elias SG, Vlems FA. Physical activity and breast cancer: a systematic review. Epidemiology. 2007;18:137–157. doi: 10.1097/01.ede.0000251167.75581.98. [DOI] [PubMed] [Google Scholar]
- 161.Kobayashi LC, Janssen I, Richardson H, Lai AS, Spinelli JJ, Aronson KJ. A case-control study of lifetime light intensity physical activity and breast cancer risk. Cancer Causes Control. 2014;25(1):133–40. doi: 10.1007/s10552-013-0312-z. [DOI] [PubMed] [Google Scholar]
- 162.Baan R, Straif K, Grosse Y, et al. WHO International Agency for Research on Cancer Monograph Working Group. Carcinogenicity of alcoholic beverages. Lancet Oncol. 2007;8:292–3. doi: 10.1016/s1470-2045(07)70099-2. [DOI] [PubMed] [Google Scholar]
- 163.Cogliano VJ, Baan R, Straif K, et al. Preventable exposures associated with human cancers. J Natl Cancer Inst. 2011;103:1827–39. doi: 10.1093/jnci/djr483. [DOI] [PMC free article] [PubMed] [Google Scholar]
- 164.Reynolds P. Smoking and breast cancer. J Mammary Gland Biol Neoplasia. 2013;18:15–23. doi: 10.1007/s10911-012-9269-x. [DOI] [PubMed] [Google Scholar]
- 165.Johnson KC, Miller AB, Collishaw NE, et al. Active smoking and secondhand smoke increase breast cancer risk: the report of the Canadian Expert Panel on Tobacco Smoke and Breast Cancer Risk (2009) Tob Control. 2011;20:e2. doi: 10.1136/tc.2010.035931. [DOI] [PubMed] [Google Scholar]
- 166.Walboomers JM, Jacobs MV, Manos MM, et al. Human papillomavirus is a necessary cause of invasive cervical cancer worldwide. J Pathol. 1999;189:12–9. doi: 10.1002/(SICI)1096-9896(199909)189:1<12::AID-PATH431>3.0.CO;2-F. [DOI] [PubMed] [Google Scholar]
- 167.Ferenczy A, Franco E. Persistent human papillomavirus infection and cervical neo-plasia. Lancet Oncol. 2002;3:11–6. doi: 10.1016/s1470-2045(01)00617-9. [DOI] [PubMed] [Google Scholar]
- 168.Deneris A, Bond S. Clinical update: human papillomavirus vaccine. J Midwifery Womens Health. 2006;51:515–8. doi: 10.1016/j.jmwh.2006.08.011. [DOI] [PubMed] [Google Scholar]
- 169.Moore RA, Ogilvie G, Fornika D, et al. Prevalence and type distribution of human papillomavirus in 5,000 British Columbia women—implications for vaccination. Cancer Causes Control. 2009;20:1387–96. doi: 10.1007/s10552-009-9365-4. [DOI] [PMC free article] [PubMed] [Google Scholar]
- 170.Palefsky JM, Holly EA. Chapter 6: Immunosuppression and co-infection with HIV. J Natl Cancer Inst Monogr. 2003;31:41–46. doi: 10.1093/oxfordjournals.jncimonographs.a003481. [DOI] [PubMed] [Google Scholar]
- 171.Parkin DM. Tobacco-attributable cancer burden in the UK in 2010. Br J Cancer. 2011;105:S6–13. doi: 10.1038/bjc.2011.475. [DOI] [PMC free article] [PubMed] [Google Scholar]
- 172.Colucci R, Hryniuk W, Savage C. Cancer Advocacy Coalition of Canada, Report card on cancer in Canada, 2008 [Internet] Cancer Advocacy Coalition of Canada; 2008. HPV vaccination programs in Canada: are we hitting the mark? [cited 2013 Sept 6]. Available from: http://www.canceradvocacy.ca/reportcard/2008/index.html. [Google Scholar]
- 173.Public Health Agency of Canada . Human papillomavirus (HPV) prevention and HPV vaccines: questions and answers [Internet] Ottawa (ON): Public Health Agency of Canada; 2011. [updated 2011 Mar 31; cited 2013 Sept 6]. Available from: http://www.phac-aspc.gc.ca/std-mts/hpv-vph/hpv-vph-vaccine-eng.php#a3. [Google Scholar]
- 174.Cogliano V, Grosse Y, Baan R, Straif K, Secretan B, El Ghissassi F. Carcinogenicity of combined oestrogen-progestagen contraceptives and menopausal treatment. Lancet Oncol. 2005;6:552–3. doi: 10.1016/s1470-2045(05)70273-4. [DOI] [PubMed] [Google Scholar]
- 175.Cust AE, Armstrong BK, Friedenreich CM, Slimani N, Bauman A. Physical activity and endometrial cancer risk: a review of the current evidence, biologic mechanisms and the quality of physical activity assessment methods. Cancer Causes Control. 2007;18:243–58. doi: 10.1007/s10552-006-0094-7. [DOI] [PubMed] [Google Scholar]
- 176.Zhang Y, Liu H, Yang S, Zhang J, Qian L, Chen X. Overweight, obesity and endome-trial cancer risk: results from a systematic review and meta-analysis. Int J Biol Markers. 2014;29(1):e21–9. doi: 10.5301/jbm.5000047. [DOI] [PubMed] [Google Scholar]
- 177.Arem H, Irwin ML, Zhou Y, Lu L, Risch H, Yu H. Physical activity and endometrial cancer in a population-based case-control study. Cancer Causes Control. 2011;22:219–26. doi: 10.1007/s10552-010-9689-0. [DOI] [PMC free article] [PubMed] [Google Scholar]
- 178.Voskuil DW, Monninkhof EM, Elias SG, Vlems FA, van Leeuwen FE, Task Force Physical Activity and Cancer Physical activity and endometrial cancer risk, a systematic review of current evidence. Cancer Epidemiol Biomarkers Prev. 2007;16:639–48. doi: 10.1158/1055-9965.EPI-06-0742. [DOI] [PubMed] [Google Scholar]
- 179.Bray F, dos Santos Silva I, Moller H, Weiderpasse E. Endometrial cancer incidence trends in Europe: underlying determinants and prospects for prevention. Cancer Epidemiol Biomarkers Prev. 2005;14:1132–42. doi: 10.1158/1055-9965.EPI-04-0871. [DOI] [PubMed] [Google Scholar]
- 180.Evans T, Sany O, Pearmain P, Ganesan R, Blann A, Sundar S. Differential trends in the rising incidence of endometrial cancer by type: data from a UK population-based registry from 1994 to 2006. Br J Cancer. 2011;104:1505–10. doi: 10.1038/bjc.2011.68. [DOI] [PMC free article] [PubMed] [Google Scholar]
- 181.Fisher WA, Black A. Contraception in Canada: a review of method choices, characteristics, adherence and approaches to counselling. CMAJ. 2007;176:953–61. doi: 10.1503/cmaj.060851. [DOI] [PMC free article] [PubMed] [Google Scholar]
- 182.Dossus L, Allen N, Kaaks R, et al. Reproductive risk factors and endometrial cancer: the European prospective investigation into cancer and nutrition. Int J Cancer. 2010;127:442–51. doi: 10.1002/ijc.25050. [DOI] [PubMed] [Google Scholar]
- 183.Tortolero-Luna G, Mitchell MF. The epidemiology of ovarian cancer. J Cell Biochem Suppl. 1995;23:200–7. doi: 10.1002/jcb.240590927. [DOI] [PubMed] [Google Scholar]
- 184.Kelsey JL, Whittemore AS. Epidemiology and primary prevention of cancers of the breast, endometrium, and ovary: a brief overview. Ann Epidemiol. 1994;4:89–95. doi: 10.1016/1047-2797(94)90052-3. [DOI] [PubMed] [Google Scholar]
- 185.Hunn J, Rodriguez GC. Ovarian cancer: etiology, risk factors, and epidemiology. Clin Obstet Gynecol. 2012;55:3–23. doi: 10.1097/GRF.0b013e31824b4611. [DOI] [PubMed] [Google Scholar]
- 186.Goldman MB, Hatch M. Women and Health. Waltham (MA): Academic Press; 1999. [Google Scholar]
- 187.Salehi F, Dunfield L, Phillips KP, Krewski D, Vanderhyden BC. Risk factors for ovarian cancer: an overview with emphasis on hormonal factors. J Toxicol Environ Health B Crit Rev. 2008;11:301–21. doi: 10.1080/10937400701876095. [DOI] [PubMed] [Google Scholar]
- 188.Pearce CL, Chung K, Pike MC, Wu AH. Increased ovarian cancer risk associated with menopausal estrogen therapy is reduced by adding a progestin. Cancer. 2009;115:531–9. doi: 10.1002/cncr.23956. [DOI] [PMC free article] [PubMed] [Google Scholar]
- 189.Beral V, Million Women Study Collaborators. Bull D, Green J, Reeves G. Ovarian cancer and hormone replacement therapy in the Million Women Study. Lancet. 2007;369:1703–10. doi: 10.1016/S0140-6736(07)60534-0. [DOI] [PubMed] [Google Scholar]
- 190.Levy-Lahad E, Friedman E. Cancer risks among BRCA1 and BRCA2 mutation carriers. Br J Cancer. 2007;96:11–5. doi: 10.1038/sj.bjc.6603535. [DOI] [PMC free article] [PubMed] [Google Scholar]
- 191.Gayther SA, Pharoah PD. The inherited genetics of ovarian and endometrial cancer. Curr Opin Genet Dev. 2010;20:231–8. doi: 10.1016/j.gde.2010.03.001. [DOI] [PMC free article] [PubMed] [Google Scholar]
- 192.Granstrom C, Sundquist J, Hemminki K. Population attributable fractions for ovarian cancer in Swedish women by morphological type. Br J Cancer. 2008;98:199–205. doi: 10.1038/sj.bjc.6604135. [DOI] [PMC free article] [PubMed] [Google Scholar]
- 193.Negri E, Pelucchi C, Franceschi S, et al. Family history of cancer and risk of ovarian cancer. Eur J Cancer. 2003;39:505–10. doi: 10.1016/s0959-8049(02)00743-8. [DOI] [PubMed] [Google Scholar]
- 194.Secretan B, Straif K, Baan R, et al. A review of human carcinogens--Part E: tobacco, areca nut, alcohol, coal smoke, and salted fish. Lancet Oncol. 2009;10:1033–4. doi: 10.1016/s1470-2045(09)70326-2. [DOI] [PubMed] [Google Scholar]
- 195.Canadian Task Force on the Periodic Health Examination Periodic health examination, 1991 update 3. Secondary prevention of prostate cancer. CMAJ. 1991;145:413–28. [PMC free article] [PubMed] [Google Scholar]
- 196.Levy IG, Gibbons L, Collins JP, Perkins DG, Mao Y. Prostate cancer trends in Canada: rising incidence or increased detection? CMAJ. 1993;149:617–24. [PMC free article] [PubMed] [Google Scholar]
- 197.Canadian Cancer Society’s Steering Committee on Cancer Statistics . Canadian Cancer Statistics 2006. Toronto (ON): Canadian Cancer Society; 2006. [Google Scholar]
- 198.Kramer BS, Brown ML, Prorok PC, Potosky AL, Gohagan JK. Prostate cancer screening: what we know and what we need to know. Ann Intern Med. 1993;119:914–23. doi: 10.7326/0003-4819-119-9-199311010-00009. [DOI] [PubMed] [Google Scholar]
- 199.Hayes JH, Barry MJ. Screening for prostate cancer with the prostate-specific antigen test: a review of current evidence. JAMA. 2014;311:1143–9. doi: 10.1001/jama.2014.2085. [DOI] [PubMed] [Google Scholar]
- 200.Evans HS, Møller H. Recent trends in prostate cancer incidence and mortality in southeast England. Eur Urol. 2003;43:337–41. doi: 10.1016/s0302-2838(03)00085-x. [DOI] [PubMed] [Google Scholar]
- 201.Brawley OW. Trends in prostate cancer in the United States. J Natl Cancer Inst Monogr. 2012;2012:152–6. doi: 10.1093/jncimonographs/lgs035. [DOI] [PMC free article] [PubMed] [Google Scholar]
- 202.Kicinski M, Vangronsveld J, Nawrot TS. An epidemiological reappraisal of the familial aggregation of prostate cancer: a meta-analysis. PLoS ONE. 2011;6:e27130. doi: 10.1371/journal.pone.0027130. [DOI] [PMC free article] [PubMed] [Google Scholar]
- 203.Bruner DW, Moore D, Parlanti A, Dorgan J, Engstrom P. Relative risk of prostate cancer for men with affected relatives: systematic review and meta-analysis. Int J Cancer. 2003;107:797–803. doi: 10.1002/ijc.11466. [DOI] [PubMed] [Google Scholar]
- 204.Johns LE, Houlston RS. A systematic review and meta-analysis of familial prostate cancer risk. BJU Int. 2003;91:794. doi: 10.1046/j.1464-410x.2003.04232.x. [DOI] [PubMed] [Google Scholar]
- 205.Hemminki K, Czene K. Age specific and attributable risks of familial prostate carcinoma from the family-cancer database. Cancer. 2002;95:1346–53. doi: 10.1002/cncr.10819. [DOI] [PubMed] [Google Scholar]
- 206.Ferlay J, Shin HR, Bray F, Forman D, Mathers C, Parkin DM. GLOBOCAN 2008, Cancer Incidence and Mortality Worldwide: IARC CancerBase No. 10. Lyon (FR): International Agency for Research on Cancer; 2010. [Google Scholar]
- 207.Parkin DM, Ferlay J, Hamdi-Cherif M, et al. Cancer in Africa: epidemiology and prevention. 1st ed. Lyon (FR): IARC Scientific Publications no.153; 2003. [PubMed] [Google Scholar]
- 208.Brawley OW. Prostate cancer epidemiology in the United States. World J Urol. 2012;30:195–200. doi: 10.1007/s00345-012-0824-2. [DOI] [PubMed] [Google Scholar]
- 209.Leitzmann MF, Rohrmann S. Risk factors for the onset of prostatic cancer: age, location, and behavioral correlates. Clin Epidemiol. 2012;4:1–11. doi: 10.2147/CLEP.S16747. [DOI] [PMC free article] [PubMed] [Google Scholar]
- 210.Chen L, Stacewicz-Sapuntzakis M, Duncan C, et al. Oxidative DNA damage in prostate cancer patients consuming tomato sauce-based entrees as a whole-food intervention. J Natl Cancer Inst. 2001;93:1872–1879. doi: 10.1093/jnci/93.24.1872. [DOI] [PubMed] [Google Scholar]
- 211.Yan L, Spitznagel EL. Soy consumption and prostate cancer risk in men: a revisit of a meta-analysis. Am J Clin Nutr. 2009;89:1155–63. doi: 10.3945/ajcn.2008.27029. [DOI] [PubMed] [Google Scholar]
- 212.Gao X, LaValley MP, Tucker KL. Prospective studies of dairy product and calcium intakes and prostate cancer risk: a meta-analysis. J Natl Cancer Inst. 2005;97:1768–77. doi: 10.1093/jnci/dji402. [DOI] [PubMed] [Google Scholar]
- 213.Gann PH. Risk factors for prostate cancer. Rev Urol. 2002;4(Suppl 5):S3–10. [PMC free article] [PubMed] [Google Scholar]
- 214.McGlynn KA, Devesa SS, Sigurdson AJ, Brown LM, Tsao L, Tarone RE. Trends in the incidence of testicular germ cell tumors in the United States. Cancer. 2003;97:63–70. doi: 10.1002/cncr.11054. [DOI] [PubMed] [Google Scholar]
- 215.Bray F, Richiardi L, Ekbom A, Pukkala E, Cuninkova M, Møller H. Trends in testicular cancer incidence and mortality in 22 European countries: continuing increases in incidence and declines in mortality. Int J Cancer. 2006;118:3099–111. doi: 10.1002/ijc.21747. [DOI] [PubMed] [Google Scholar]
- 216.Power DA, Brown RS, Brock CS, Payne HA, Majeed A, Babb P. Trends in testicular carcinoma in England and Wales, 1971-99. BJU Int. 2001;87:361–5. doi: 10.1046/j.1464-410x.2001.00078.x. [DOI] [PubMed] [Google Scholar]
- 217.Stone JM, Cruickshank DG, Sandeman TF, Matthews JP. Trebling of the incidence of testicular cancer in Victoria, Australia (1950-1985) Cancer. 1991;68:211–9. doi: 10.1002/1097-0142(19910701)68:1<211::aid-cncr2820680139>3.0.co;2-q. [DOI] [PubMed] [Google Scholar]
- 218.Møller H, Fairley L, Coupland V, et al. The future burden of cancer in England: incidence and numbers of new patients in 2020. Br J Cancer. 2007;96(9):1484–8. doi: 10.1038/sj.bjc.6603746. [DOI] [PMC free article] [PubMed] [Google Scholar]
- 219.Pettersson A, Richiardi L, Nordenskjold A, et al. Age at surgery for undescended testis and risk of testicular cancer. N Engl J Med. 2007;356:1835–41. doi: 10.1056/NEJMoa067588. [DOI] [PubMed] [Google Scholar]
- 220.Zhang Y, Graubard BI, Klebanoff MA, et al. Maternal hormone levels among populations at high and low risk of testicular germ cell cancer. Br J Cancer. 2005;92:1787–93. doi: 10.1038/sj.bjc.6602545. [DOI] [PMC free article] [PubMed] [Google Scholar]
- 221.Sharpe RM, Skakkebaek NE. Are oestro-gens involved in falling sperm counts and disorders of the male reproductive tract? Lancet. 1993;341:1392–5. doi: 10.1016/0140-6736(93)90953-e. [DOI] [PubMed] [Google Scholar]
- 222.Skakkebaek NE, Rajpert-De Meyts E, Jørgensen N, et al. Germ cell cancer and disorders of spermatogenesis: an environmental connection? APMIS. 1998;106:3–12. doi: 10.1111/j.1699-0463.1998.tb01314.x. [DOI] [PubMed] [Google Scholar]
- 223.Hemminki K, Chen B. Familial risks in testicular cancer as aetiological clues. Int J Androl. 2006;29:205–10. doi: 10.1111/j.1365-2605.2005.00599.x. [DOI] [PubMed] [Google Scholar]
- 224.Chow WH, Devesa SS. Contemporary epidemiology of renal cell cancer. Cancer J. 2008;14:288–301. doi: 10.1097/PPO.0b013e3181867628. [DOI] [PMC free article] [PubMed] [Google Scholar]
- 225.Chow WH, Devesa SS, Warren JL, Fraumeni JF., Jr. Rising incidence of renal cell cancer in the United States. JAMA. 1999;281:1628–31. doi: 10.1001/jama.281.17.1628. [DOI] [PubMed] [Google Scholar]
- 226.Liu S, Semenciw R, Morrison H, Schanzer D, Mao Y. Kidney cancer in Canada: the rapidly increasing incidence of adenocarci-noma in adults and seniors. Can J Public Health. 1997;88:99–104. doi: 10.1007/BF03403870. [DOI] [PMC free article] [PubMed] [Google Scholar]
- 227.Mathew A, Devesa SS, Fraumeni JF, Jr, Chow WH. Global increases in kidney cancer incidence, 1973-1992. Eur J Cancer Prev. 2002;11:171–8. doi: 10.1097/00008469-200204000-00010. [DOI] [PubMed] [Google Scholar]
- 228.Levi F, Ferlay J, Galeone C, et al. The changing patterns of kidney cancer incidence and mortality in Europe. BJU Int. 2008;101:949–58. doi: 10.1111/j.1464-410X.2008.07451.x. [DOI] [PubMed] [Google Scholar]
- 229.Chow WH, Dong LM, Devesa SS. Epidemiology and risk factors for kidney cancer. Nat Rev Urol. 2010;7:245–57. doi: 10.1038/nrurol.2010.46. [DOI] [PMC free article] [PubMed] [Google Scholar]
- 230.Simard EP, Ward EM, Siegel R, Jemal A. Cancers with increasing incidence trends in the United States: 1999 through 2008. CA Cancer J Clin. 2012;62:118–28. doi: 10.3322/caac.20141. [DOI] [PubMed] [Google Scholar]
- 231.Patard JJ. Incidental renal tumours. Curr Opin Uro. 2009;19:454–8. doi: 10.1097/MOU.0b013e32832f0ccd. [DOI] [PubMed] [Google Scholar]
- 232.Hock LM, Lynch J, Balaji KC. Increasing incidence of all stages of kidney cancer in the last 2 decades in the United States: An analysis of surveillance, epidemiology, and end results program data. J Urol. 2002;167:57–60. [PubMed] [Google Scholar]
- 233.Moore LE, Wilson RT, Campleman SL. Lifestyle factors, exposures, genetic susceptibility, and renal cell cancer risk: a review. Cancer Invest. 2005;23:240–55. doi: 10.1081/cnv-200055962. [DOI] [PubMed] [Google Scholar]
- 234.Lipworth L, Tarone RE, McLaughlin JK. The epidemiology of renal cell carcinoma. J Urol. 2006;176:2353–8. doi: 10.1016/j.juro.2006.07.130. [DOI] [PubMed] [Google Scholar]
- 235.Hu J, Ugnat AM. Active and passive smoking and risk of renal cell carcinoma in Canada. Eur J Cancer. 2005;41:770–8. doi: 10.1016/j.ejca.2005.01.003. [DOI] [PubMed] [Google Scholar]
- 236.Chow WH, Grindley G, Fraumeni JF, Jr, Jarvholm B. Obesity, hypertension, and the risk of kidney cancer in men. N Engl J Med. 2000;343:1305–11. doi: 10.1056/NEJM200011023431804. [DOI] [PubMed] [Google Scholar]
- 237.Bao C, Yang X, Xu W, et al. Diabetes mellitus and incidence and mortality of kidney cancer: A meta-analysis. J Diabetes Complications. 2013 Feb 20; doi: 10.1016/j.jdiacomp.2013.01.004. [DOI] [PubMed] [Google Scholar]
- 238.Bonsib SM. Renal cystic diseases and renal neoplasms: a mini-review. Clin J Am Soc Nephrol. 2009;4:1998–2007. doi: 10.2215/CJN.02020309. [DOI] [PubMed] [Google Scholar]
- 239.Curado FJA, Hernandez PC, Castro RP, et al. New epidemiologic patterns and risk factors in renal cancer. Actas Urol Esp. 2009;33:459–67. doi: 10.1016/s0210-4806(09)74178-6. [DOI] [PubMed] [Google Scholar]
- 240.Karami S, Lan Q, Rothman N, et al. Occupational trichloroethylene exposure and kidney cancer risk: a meta-analysis. Occup Environ Med. 2012;69:858–67. doi: 10.1136/oemed-2012-100932. [DOI] [PubMed] [Google Scholar]
- 241.Lynch CF, Platz CE, Jones MP, Gazzaniga JM. Cancer registry problems in classifying invasive bladder cancer. J Natl Cancer Inst. 1991;83:429–33. doi: 10.1093/jnci/83.6.429. [DOI] [PubMed] [Google Scholar]
- 242.Hankey BF, Edwards BK, Ries LA, Percy CL, Shambaugh E. Problems in cancer surveillance: Delineating in situ and invasive bladder cancer. J Natl Cancer Inst. 1991;83:384–5. doi: 10.1093/jnci/83.6.384. [DOI] [PubMed] [Google Scholar]
- 243.Schned AR, Andrew AS, Marsit CJ, Zens MS, Kelsey KT, Karagas MR. Survival following the diagnosis of noninvasive bladder cancer: WHO/International Society of Urological Pathology versus WHO Classification systems. J Urol. 2007:178–1200. doi: 10.1016/j.juro.2007.05.126. [DOI] [PubMed] [Google Scholar]
- 244.Brennan P, Bogillot O, Greiser E, et al. The contribution of cigarette smoking to bladder cancer in women (pooled European data) Cancer Causes Control. 2001;12:411–7. doi: 10.1023/a:1011214222810. [DOI] [PubMed] [Google Scholar]
- 245.Zeegers MP, Tan FE, Dorant E, van den Brandt PA. The impact of characteristics of cigarette smoking on urinary tract cancer risk: a meta-analysis of epidemiological studies. Cancer. 2000;89:630–9. doi: 10.1002/1097-0142(20000801)89:3<630::aid-cncr19>3.3.co;2-h. [DOI] [PubMed] [Google Scholar]
- 246.Pashos CL, Botteman MF, Laskin BL, Redaelli A. Bladder cancer: epidemiology, diagnosis, and management. Cancer Pract. 2002;10:311–22. doi: 10.1046/j.1523-5394.2002.106011.x. [DOI] [PubMed] [Google Scholar]
- 247.Olfert SM, Felknor SA, Delclos GL. An updated review of the literature: risk factors for bladder cancer with focus on occupational exposures. South Med J. 2006;99:1256–63. doi: 10.1097/01.smj.0000247266.10393.72. [DOI] [PubMed] [Google Scholar]
- 248.Letašiová S, Medve’ová A, Šovèíková A. Bladder cancer, a review of the environmental risk factors. Environ Health. 2012;11(Suppl 1):S11. doi: 10.1186/1476-069X-11-S1-S11. [DOI] [PMC free article] [PubMed] [Google Scholar]
- 249.Kirkali Z, Chan T, Manoharan M, et al. Bladder cancer: epidemiology, staging and grading, and diagnosis. Urology. 2005;66:4–34. doi: 10.1016/j.urology.2005.07.062. [DOI] [PubMed] [Google Scholar]
- 250.Siemiatycki J, Dewar R, Nadon L, Gérin M. Occupational risk factors for bladder cancer: results from a case-control study in Montreal, Quebec, Canada. Am J Epidemiol. 1994;140:1061–80. doi: 10.1093/oxfordjournals.aje.a117207. [DOI] [PubMed] [Google Scholar]
- 251.Gaertner RR, Trpeski L, Johnson KC. A case-control study of occupational risk factors for bladder cancer in Canada. Cancer Causes Control. 2004;15:1007–19. doi: 10.1007/s10552-004-1448-7. [DOI] [PubMed] [Google Scholar]
- 252.Villanueva CM, Fernández F, Malats N, Grimalt JO, Kogevinas M. Meta-analysis of studies on individual consumption of chlorinated drinking water and bladder cancer. J Epidemiol Community Health. 2003;57:166–73. doi: 10.1136/jech.57.3.166. [DOI] [PMC free article] [PubMed] [Google Scholar]
- 253.Villanueva CM, Cantor KP, King WD, et al. Total and specific fluid consumption as determinants of bladder cancer risk. Int J Cancer. 2006;118:2040–7. doi: 10.1002/ijc.21587. [DOI] [PubMed] [Google Scholar]
- 254.Canadian Cancer Society’s Steering Committee. Canadian cancer statistics 2009. Toronto: Canadian Cancer Society; 2009. [Google Scholar]
- 255.Preston-Martin S, Munir R, Chakrabarti I. Nervous system. In: Schottenfeld D, Fraumeni JF, editors. Cancer epidemiology and prevention. 3rd ed. New York (NY): Oxford University Press; 2006. pp. 1173–95. [Google Scholar]
- 256.Hemminki K, Tretli S, Olsen JH, et al. Familial risks in nervous system tumours: joint Nordic study. Br J Cancer. 2010;102:1786–90. doi: 10.1038/sj.bjc.6605708. [DOI] [PMC free article] [PubMed] [Google Scholar]
- 257.Kilfoy BA, Zheng T, Holford TR, et al. International patterns and trends in thyroid cancer incidence, 1973-2002. Cancer Causes Control. 2009;20:525–31. doi: 10.1007/s10552-008-9260-4. [DOI] [PMC free article] [PubMed] [Google Scholar]
- 258.Davies L, Welch HG. Increasing incidence of thyroid cancer in the United States, 1973-2002. JAMA. 2006;295:2164–7. doi: 10.1001/jama.295.18.2164. [DOI] [PubMed] [Google Scholar]
- 259.Enewold L, Zhu K, Ron E, et al. Rising thyroid cancer incidence in the United States by demographic and tumor characteristics, 1980-2005. Cancer Epidemiol Biomarkers Prev. 2009;18:784–91. doi: 10.1158/1055-9965.EPI-08-0960. [DOI] [PMC free article] [PubMed] [Google Scholar]
- 260.Kent WD, Hall SF, Isotalo PA, Houlden RL, George RL, Groome PA. Increased incidence of differentiated thyroid carcinoma and detection of subclinical disease. CMAJ. 2007;177:1357–61. doi: 10.1503/cmaj.061730. [DOI] [PMC free article] [PubMed] [Google Scholar]
- 261.Cancer Care Ontario. Toronto (ON): Cancer Care Ontario; 2010. Thyroid cancer incidence increasing in Ontario [Internet] [updated 2010 Mar 2; cited 2013 Oct 30]. Available from: https://www.cancercare.on.ca/cancerfacts/ [Google Scholar]
- 262.Ron E, Schneider AB. Thyroid Cancer. In: Schottenfeld D, Fraumeni JF Jr, editors. Cancer epidemiology and prevention. 3rd ed. New York (NY): Oxford University Press; 2006. pp. 975–94. [Google Scholar]
- 263.Haq M, Harmer C. Thyroid cancer: an overview. Nucl Med Commun. 2004;25:861–7. doi: 10.1097/00006231-200409000-00001. [DOI] [PubMed] [Google Scholar]
- 264.Zabel EW, Alexander BH, Mongin SJ, et al. Thyroid cancer and employment as a radiologic technologist. Int J Cancer. 2006;119:1940–5. doi: 10.1002/ijc.22065. [DOI] [PubMed] [Google Scholar]
- 265.Ron E, Lubin JH, Shore RE, et al. Thyroid cancer after exposure to external radiation: a pooled analysis of seven studies. Radiat Res. 1995;141:259–77. [PubMed] [Google Scholar]
- 266.Peterson E, De P, Nuttall R. BMI, diet and female reproductive factors as risks for thyroid cancer: a systematic review. PLoS ONE. 2012;7 doi: 10.1371/journal.pone.0029177. e29177. [DOI] [PMC free article] [PubMed] [Google Scholar]
- 267.Tsang RW, Hodgson DC, Crump M. Hodgkin’s lymphoma. Curr Probl Cancer. 2006;30:107–58. doi: 10.1016/j.currproblcancer.2006.04.001. [DOI] [PubMed] [Google Scholar]
- 268.Andersson J. Epstein-Barr virus and Hodgkin’s lymphoma. Herpes. 2006;13:12–6. [PubMed] [Google Scholar]
- 269.International Agency for Research on Cancer. IARC monographs on the evaluation of carcinogenic risks to humans, Vol. 70. Lyon, France: International Agency for Research on Cancer; 1997. Epstein-barr virus and Kaposi’s sarcoma herpesvirus/human herpesvirus 8. [Google Scholar]
- 270.Grulich AE, van Leeuwen MT, Falster MO, Vajdic CM. Incidence of cancers in people with HIV/AIDS compared with immuno-suppressed transplant recipients: a meta-analysis. Lancet. 2007;370:59–67. doi: 10.1016/S0140-6736(07)61050-2. [DOI] [PubMed] [Google Scholar]
- 271.Goldin LR, Pfeiffer RM, Gridley G, et al. Familial aggregation of Hodgkin lymphoma and related tumors. Cancer. 2004;100:1902–8. doi: 10.1002/cncr.20189. [DOI] [PubMed] [Google Scholar]
- 272.Sergentanis TN, Kanavidis P, Michelakos T, Petridou ET. Cigarette smoking and risk of lymphoma in adults: a comprehensive meta-analysis on Hodgkin and non-Hodgkin disease. Eur J Cancer Prev. 2013;22:131–50. doi: 10.1097/CEJ.0b013e328355ed08. [DOI] [PubMed] [Google Scholar]
- 273.Kamper-Jørgensen M, Rostgaard K, Glaser SL, et al. Cigarette smoking and risk of Hodgkin lymphoma and its subtypes: a pooled analysis from the International Lymphoma Epidemiology Consortium (InterLymph) Ann Oncol. 2013;24:2245–55. doi: 10.1093/annonc/mdt218. [DOI] [PMC free article] [PubMed] [Google Scholar]
- 274.Chang ET, Zheng T, Weir EG, et al. Childhood social environment and Hodgkin’s lym-phoma: new findings from a population-based case-control study. Cancer Epidemiol Biomarkers Prev. 2004;13:1361–70. [PubMed] [Google Scholar]
- 275.Cancer Care Ontario . Cancer Care Ontario. 2006. Cancer Fact: Hodgkin lymphoma incidence highest in young adults and elderly. [updated 2009 Oct 21; cited 2013 Sept 6]. Available from: https://www.cancercare.on.ca/cancerfacts/ [Google Scholar]
- 276.Wang SS, Slager SL, Brennan P, et al. Family history of hematopoietic malignancies and risk of non-Hodgkin lymphoma (NHL): a pooled analysis of 10 211 cases and 11 905 controls from the International Lymphoma Epidemiology Consortium (InterLymph) Blood. 2007;109:3479–99. doi: 10.1182/blood-2006-06-031948. [DOI] [PMC free article] [PubMed] [Google Scholar]
- 277.Crump C, Sundquist K, Sieh W, Winkleby MA, Sundquist J. Perinatal and family risk factors for non-Hodgkin lymphoma in early life: a Swedish National Cohort Study. J Natl Cancer Inst. 2012;104:923–30. doi: 10.1093/jnci/djs225. [DOI] [PMC free article] [PubMed] [Google Scholar]
- 278.Grulich AE, Vajdic CM, Cozen W. Altered immunity as a risk factor for non-Hodgkin lymphoma. Cancer Epidemiol Biomarkers Prev. 2007;16:405–8. doi: 10.1158/1055-9965.EPI-06-1070. [DOI] [PubMed] [Google Scholar]
- 279.Matsuo K, Kusano A, Sugumar A, Nakamura S, Tajima K, Mueller NE. Effect of hepatitis C virus infection on the risk of non-Hodgkin’s lymphoma: a meta-analysis of epidemiological studies. Cancer Sci. 2004;95:745–52. doi: 10.1111/j.1349-7006.2004.tb03256.x. [DOI] [PMC free article] [PubMed] [Google Scholar]
- 280.Dal ML, Franceschi S. Hepatitis C virus and risk of lymphoma and other lymphoid neoplasms: a meta-analysis of epidemiolo-gic studies. Cancer Epidemiol Biomarkers Prev. 2006;15:2078–85. doi: 10.1158/1055-9965.EPI-06-0308. [DOI] [PubMed] [Google Scholar]
- 281.Anderson LA, Engels EA. Hepatitis C virus infection and non-Hodgkin lymphoma: interesting association or causal relationship? Int J Cancer. 2008;122:10–2. doi: 10.1002/ijc.23462. [DOI] [PubMed] [Google Scholar]
- 282.Clarke CA, Glaser SL, Dorfman RF, Bracci PM, Eberle E, Holly EA. Expert review of non-Hodgkin’s lymphomas in a population-based cancer registry: reliability of diagnosis and subtype classifications. Cancer Epidemiol Biomarkers Prev. 2004;13(1):138–43. doi: 10.1158/1055-9965.epi-03-0250. [DOI] [PubMed] [Google Scholar]
- 283.Groves FD, Linet MS, Travis LB, Devesa SS. Cancer surveillance series: non-Hodgkin’s lymphoma incidence by histologic subtype in the United States from 1978 through 1995. J Natl Cancer Inst. 2000;92:1240–51. doi: 10.1093/jnci/92.15.1240. [DOI] [PubMed] [Google Scholar]
- 284.Turesson I, Velez R, Kristinsson SY, Landgren O. Patterns of multiple myeloma during the past 5 decades: stable incidence rates for all age groups in the population but rapidly changing age distribution in the clinic. Mayo Clin Proc. 2010;85:225–30. doi: 10.4065/mcp.2009.0426. [DOI] [PMC free article] [PubMed] [Google Scholar]
- 285.Renshaw C, Ketley N, Møller H, Davies EA. Trends in the incidence and survival of multiple myeloma in South East England 1985-2004. BMC Cancer. 2010;10:74. doi: 10.1186/1471-2407-10-74. [DOI] [PMC free article] [PubMed] [Google Scholar]
- 286.Levi F, Te VC, Randimbison L, La Vecchia C. Incidence of multiple myeloma in Olmsted County, Minnesota. Cancer. 2005;104:442. doi: 10.1002/cncr.21177. [DOI] [PubMed] [Google Scholar]
- 287.Alexander DD, Mink PJ, Adami HO, et al. Multiple myeloma: a review of the epide-miologic literature. Int J Cancer. 2007;120(Suppl 12):40–61. doi: 10.1002/ijc.22718. [DOI] [PubMed] [Google Scholar]
- 288.Kristinsson SY, Goldin LR, Bjo¨rkholm M, Koshiol J, Turesson I, Landgren O. Genetic and immune-related factors in the pathogenesis of lymphoproliferative and plasma cell malignancies. Haematologica. 2009;94:1581–9. doi: 10.3324/haematol.2009.008979. [DOI] [PMC free article] [PubMed] [Google Scholar]
- 289.Kyle RA, Therneau TM, Rajkumar SV, et al. A long-term study of prognosis in mono-clonal gammopathy of undetermined significance. N Engl J Med. 2002;346:564–9. doi: 10.1056/NEJMoa01133202. [DOI] [PubMed] [Google Scholar]
- 290.Larsson SC, Wolk A. Body mass index and risk of multiple myeloma: A meta-analysis. Int J Cancer. 2007;121:2512–6. doi: 10.1002/ijc.22968. [DOI] [PubMed] [Google Scholar]
- 291.Wallin A, Larson SC. Body mass index and risk of multiple myeloma: a meta-analysis of prospective studies. Eur J Cancer. 2011;47:1606–15. doi: 10.1016/j.ejca.2011.01.020. [DOI] [PubMed] [Google Scholar]
- 292.Shiels MS, Cole SR, Kirk GD, Poole C. A meta-analysis of the incidence of non-AIDS cancers in HIV-infected individuals. J Acquir Immune Defic Syndr. 2009;52:611–22. doi: 10.1097/QAI.0b013e3181b327ca. [DOI] [PMC free article] [PubMed] [Google Scholar]
- 293.National Cancer Institute . Bethesda (MD): National Cancer Institute; 2013. SEER Stat Fact Sheets: Leukemia [Internet] [updated 2013 Apr 1; cited 2013 Dec 19]. Available from: http://seer.cancer.gov/statfacts/html/leuks.html. [Google Scholar]
- 294.Deschler B, Lubbert M. Acute myeloid leukemia: epidemiology and etiology. Cancer. 2006;107:2099–107. doi: 10.1002/cncr.22233. [DOI] [PubMed] [Google Scholar]
- 295.International Agency for Research on Cancer . Pathology and genetics. Tumors of haematopoietic and lymphoid tissues. Lyon: IARC Press; 2001. Classification of tumours. [Google Scholar]
- 296.Kasim K, Levallois P, Abdous B, Auger P, Johnson KC, Canadian Cancer Registries Epidemiology Research Group Environmental tobacco smoke and risk of adult leukemia. Epidemiology. 2005;16:672–80. doi: 10.1097/01.ede.0000173039.79207.80. [DOI] [PubMed] [Google Scholar]
- 297.Gessain A, Cassar O. Epidemiological Aspects and World Distribution of HTLV-1 Infection. Front Microbiol. 2012;3:388. doi: 10.3389/fmicb.2012.00388. [DOI] [PMC free article] [PubMed] [Google Scholar]
- 298.International Agency for Research on Cancer . IARC Monographs on the Evaluation of Carcinogenic Risks to Humans, Vol. 67. Lyon (FR): IARC Press; 1996. Human immunodeficiency viruses and human T-cell lymphotropic viruses. [PMC free article] [PubMed] [Google Scholar]
- 299.Altieri A, Castro F, Bermejo JL, Hemminki K. Number of siblings and the risk of lym-phoma, leukemia, and myeloma by histopathology. Cancer Epidemiol Biomarkers Prev. 2006;15:1281–6. doi: 10.1158/1055-9965.EPI-06-0087. [DOI] [PubMed] [Google Scholar]
- 300.Slager SL, Caporaso NE, de Sanjose S, Goldin LR. Genetic susceptibility to chronic lymphocytic leukemia. Semin Hematol. 2013;50:296–302. doi: 10.1053/j.seminhematol.2013.09.007. [DOI] [PMC free article] [PubMed] [Google Scholar]
- 301.Goldin LR, Caporaso NE. Family studies in chronic lymphocytic leukaemia and other lymphoproliferative tumours. Br J Haematol. 2007;139:774–9. doi: 10.1111/j.1365-2141.2007.06810.x. [DOI] [PubMed] [Google Scholar]
- 302.Crowther-Swanepoel D, Houlston RS. Genetic variation and risk of chronic lymphocytic leukaemia. Semin Cancer Biol. 2010;20:363–9. doi: 10.1016/j.semcancer.2010.08.006. [DOI] [PubMed] [Google Scholar]
- 303.Ito T. Stem cell maintenance and disease progression in chronic myeloid leukemia. Int J Hematol. 2013;98:641–7. doi: 10.1007/s12185-013-1318-8. [DOI] [PubMed] [Google Scholar]
- 304.Liu-Dumlao T, Kantarjian H, Thomas DA, O’Brien S, Ravandi F. Philadelphia-positive acute lymphoblastic leukemia: current treatment options. Curr Oncol Rep. 2012;14:387–94. doi: 10.1007/s11912-012-0247-7. [DOI] [PMC free article] [PubMed] [Google Scholar]
- 305.Hoffbrand AV, Moss PAH, Pettit JE. Essential haematology. 5th ed. Oxford: Blackwell Publishing Ltd.; 2006. [Google Scholar]
- 306.Taylor GM, Birch JM. The hereditary basis of human leukemia. In: Henderson ES, Lister TA, Greaves MJ, editors. Leukemia. 6th ed. Philadelphia: WB Saunders; 1996. pp. 210–45. [Google Scholar]
- 307.Lichtman MA. Obesity and the risk for a hematological malignancy: leukemia, lym-phoma, or myeloma. Oncologist. 2010;15:1083–101. doi: 10.1634/theoncologist.2010-0206. [DOI] [PMC free article] [PubMed] [Google Scholar]
- 308.Larsson SC, Wolk A. Overweight and obesity and incidence of leukemia: a meta-analysis of cohort studies. Int J Cancer. 2008;122:1418–21. doi: 10.1002/ijc.23176. [DOI] [PubMed] [Google Scholar]
- 309.Pan SY, Johnson KC, Ugnat AM, Wen SW, Mao Y. Association of obesity and cancer risk in Canada. Am J Epidemiol. 2004;159:259–68. doi: 10.1093/aje/kwh041. [DOI] [PubMed] [Google Scholar]
- 310.Kasim K, Johnson KC, Levallois P, Abdous B, Auger P, Canadian Cancer Registries Epidemiology Research Group Recreational physical activity and the risk of adult leukemia in Canada. Cancer Causes Control. 2009;20:1377–86. doi: 10.1007/s10552-009-9364-5. [DOI] [PubMed] [Google Scholar]
- 311.Marrett LD, Ellison LF, Dryer D. Canadian cancer statistics at a glance: mesothelioma. CMAJ. 2008;178:677–8. doi: 10.1503/cmaj.080129. [DOI] [PMC free article] [PubMed] [Google Scholar]
- 312.American Cancer Society . Global Cancer Facts and Figures. 2nd Edition. Atlanta (GA): America Cancer Society; 2011. [cited 2013 Oct 30]. Available from: http://www.cancer.org/acs/groups/content/@epidemiologysurveilance/documents/document/acspc-027766.pdf. [Google Scholar]
- 313.International Agency for Research on Cancer . Lyon (FR): International Agency for Research on Cancer; 2004. International Rules for Multiple Primary Cancers (ICD-O Third Edition) [Internet] [cited 2013 Oct 30]. Available from: http://www.iacr.com.fr/MPrules_july2004.pdf. [Google Scholar]
- 314.Quon H, Loblaw A, Nam R. Dramatic increase in prostate cancer cases by 2021. BJU Int. 2011;108:1734–8. doi: 10.1111/j.1464-410X.2011.10197.x. [DOI] [PubMed] [Google Scholar]