Abstract
The steady rise in healthcare costs has deprived over 45 million Americans of healthcare services (1, 2) and has encouraged healthcare providers to look for opportunities to improve their operational efficiency. Prior studies have shown that evidence of healthcare seeking intent in Internet searches correlates well with healthcare resource utilization. Given the ubiquitous nature of mobile Internet search, we hypothesized that analyzing geo-tagged mobile search logs could enable us to machine-learn predictors of future patient visits. Using a de-identified dataset of geo-tagged mobile Internet search logs, we mined text and location patterns that are predictors of healthcare resource utilization and built statistical models that predict the probability of a user’s future visit to a medical facility. Our efforts will enable the development of innovative methods for modeling and optimizing the use of healthcare resources—a crucial prerequisite for securing healthcare access for everyone in the days to come.
Introduction
The increasing use of Internet for reporting outcomes and for seeking information regarding symptoms, diseases and treatments is resulting in the parallel growth of a body of medical information. The potential of addressing public health challenges and advancing medical research through the large scale aggregate analysis of such information repositories, as well as the challenges inherent to working with them, are being gradually recognized (3). As a web-scale repository of patient generated information, Internet search logs have been mined for evidence related to adverse drug events (4). The use of Internet searches as an indicator of individuals’ interests and concerns related to healthcare has been studied for understanding the relationship between health anxiety and its effect on information seeking behavior (5). Based on search logs collected from consenting users via a browser toolbar and complementary surveys, White et al. showed that analysis of long term search behavior reveals patterns that may serve as markers for a transition to in-world healthcare utilization (6). Logs of Internet searches initiated from mobile devices contain, in addition to search text and time stamp information, the location from where the search was initiated. The location information in search logs contains clues about the searcher’s interactions with the real world. For instance, two consecutive searches from approximately the same location that are separated by a significant span of time could indicate an engagement at the particular location. The information utility of an individual’s approximate location within a virtual geographical boundary (referred to as a “geo-fence”) has been studied extensively within the ubiquitous computing community and forms the basis of several “location based services” (7, 8). In a study that utilized de-identified searches and distances of searches from medical facilities, White et al. were able to demonstrate that the evidence of healthcare utilization is related to the acuity of symptom searches (9).
Viewed against the backdrop of the recent tectonic shifts in the healthcare landscape in the Unites States, search log repositories present an opportunity to understand the nature of interactions between healthcare organizations and users. We believe that gaining such an understanding is crucial if we hope to discover new ways of improving operational efficiencies and eventually, the accessibility of healthcare services. As an example, optimization of hospital staffing, which is the largest contributor to the cost of a hospital’s operations, could potentially result in more efficient operations. Since search log data closely mirrors users’ daily concerns and activities, they contain embedded clues about imminent health episodes. As a result, predictions of healthcare utilization based on geo-tagged search histories provide a snapshot of future healthcare demand that is based on an aggregation of personalized health trajectories. Such an approach is likely to better capture the complex patterns of healthcare demand as compared to, say, methods based on static historical averages (10).
We hypothesize that semantic and location patterns in searches can predict a future acquisition of a healthcare resource. Specifically, through statistical analysis of a de-identified dataset of geo-tagged, mobile search logs we demonstrate the relationship between the evidence of healthcare utilization and temporal features of searches over the preceding days. An investigation of search features over a time window to learn predictive patterns related to the structure, semantics and location of searches, to the best our knowledge has not been attempted earlier and represents a novel approach in understanding the motivators of healthcare resource use through Internet search data.
Methods
Datasets
Our dataset consists of de-identified mobile Internet search logs representing over 442 million searches from 22.7 million search users of the Baidu search engine (by Baidu Inc.), spread over December 2014 - January 2015. We also obtained date, duration and distance data for search users who searched from within the geo-fence of a known medical facility. A subset of the data that included nearly 24 million search logs from 6.1 million search users was marked “healthcare related” by the search provider based on their analysis of the search text data. Since the search text was in Chinese, we made use of the given healthcare related subset for constructing our cohort definitions, prior to doing our own analysis of search text content.
Identifying patients and controls
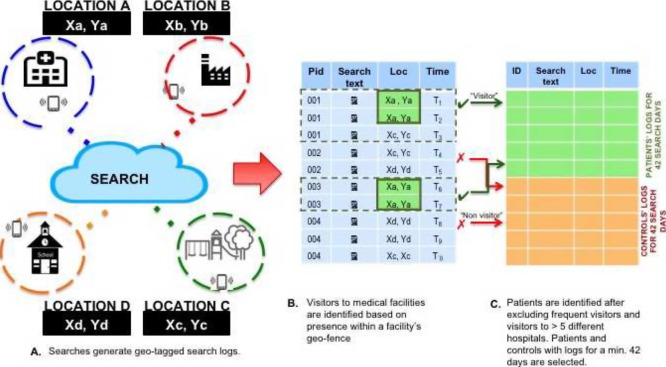
Identifying healthcare utilization based on evidence of searches that were made close to a hospital is prone to false positives and negatives. Search users may work close to hospital locations or may be passing by one and may not be consumers of healthcare resources at the time they make the search from locations proximal to a hospital. Similarly search users may visit a hospital as patients and not search during their visit. We acknowledge that it is not possible to completely eliminate false positives and false negatives when labels are assigned purely on the basis of searches made within the geo-fences of medical facilities. However, we have tried to reduce the number of false positives in our data by explicitly filtering out “weak” labels. We discarded search users who searched from within the geo-fence of a medical facility (identified by searches made within 200 m of the medical facility), but for whom there was no evidence of their presence in that location for more than 900 seconds. We also discarded search users who had more than 15 searches in a month from locations in the proximity of a medical facility as these may be individuals who lived or worked close by, or they may be healthcare professionals. Finally we also excluded those search users who searched more than 5 times in a month in the vicinity of different medical facilities. Since we were interested in studying the temporal characteristics of search logs that culminate in the visit to a medical facility, from the remaining 758,930 search users we selected those who had search logs for each of 42 or more days preceding their last visit to a medical facility (a higher threshold, we discovered, would reduce our cohort size significantly introducing issues of statistical power). In the remainder of our paper, we refer to this cohort as “patients”.
We used the set of search users in our data that had no searches in the vicinity of medical facilities to select controls. In absence of relevant user information, we matched our controls on the number of days of available search logs, requiring in addition that each control have at least one healthcare related search log (Figure 1).
Figure 1.
Definition of patients and controls (A) Generation of search logs based on searches within geo-fences (B) Identifying searches proximal to medical facilities (C) Selection of patients and controls based on filtering criterion
Longitudinal partitioning
We partitioned the search logs for patients and controls by search days, where search day n is the nth day in the sequence of days for which logs are available for a search user, preceding an end point. For patients, we defined the end point as the date of their last visit to a medical facility, where “visit” is defined as the presence within the geo-fence of the medical facility for at least 900 seconds, as inferred from geo-tagged search logs. For controls, the end point was the date of their last search log. After excluding the last day of visiting a medical facility, we could define an analysis window comprising of 41 consecutive search-days for patients. We defined a similar analysis window with 41 consecutive search days for controls with the end-point co-terminous with the first search day. Figure 2 illustrates the longitudinal partitioning of our search log data as described above.
Figure 2.
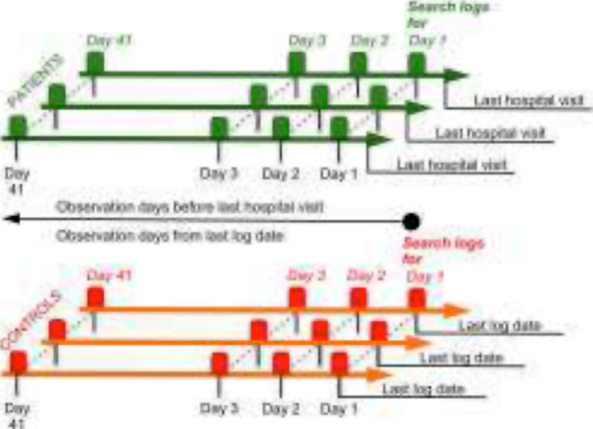
Longitudinal partitioning of search log data over analyses windows consisting of 41 search days
Feature engineering
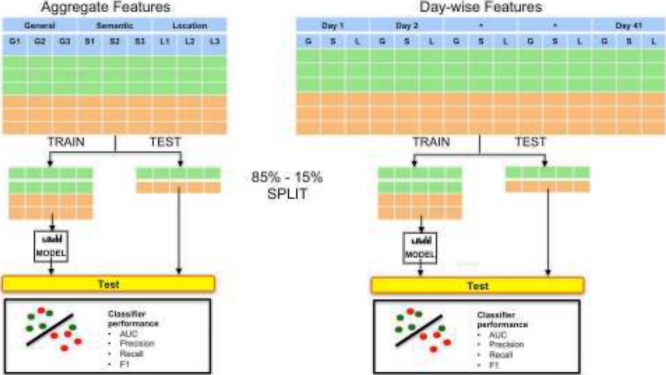
We chose three classes of features to study the discriminatory patterns in search logs across patients and controls over a succession of search days. The classes as described in Table 1, represent general (GE) attributes of search logs, semantic (SE) properties of the search text and the location (LO) attributes of search logs respectively. Based on these feature classes, we created two sets of features from the search logs for patients and controls. Our day-wise features represent general, semantic and location related attributes of search logs for each search-day in the analysis window. We also created aggregated features that were based on counts of search log properties aggregated over the entire analysis window.
Table 1:
Description of feature classes
| Class | Feature description | Aggregate | Day-wise | Day-wise Offset |
|---|---|---|---|---|
| General [GE] |
Number of searches | ✓ | ✓ | ✓ |
| Number of Healthcare related searches | ✓ | ✓ | ✓ | |
| Mean session duration | ✓ | ✓ | ✓ | |
| Mean length of search text | ✓ | ✓ | ✓ | |
| Semantic (SE) | Number of searches for a disease | ✓ | ✓ | ✓ |
| Number of searches for a drug | ✓ | ✓ | ✓ | |
| Number of searches for a medical device | ✓ | ✓ | ✓ | |
| Number of searches for a medical procedure | ✓ | ✓ | ✓ | |
| Number of searches containing one of 108 enriched (Chinese) words | ✓ | ✓ | ✓ | |
| Location (LO) | Number of searches mapped to one of 53 enriched location categories | ✓ | ✓ | ✗ |
| Number of searches who location labels contain one of 113 words | ✓ | ✗ | ✗ |
General features
It has been shown that the linguistic structure of Internet searches influences information retrieval from web-search engines (11). In a study comparing search characteristics that originate from mobile devices to searches that originate from PCs, Jadhav et al. showed that health search queries tend to be longer than general search queries (12). We chose to include attributes related to the length of text search and the duration of a search session amongst our general features. A search session represents several searches linked together by the most prominent themes returned in search results and longer sessions are likely to suggest the evolution of a search user’s interest from general to more specific concepts. We also included the number of searches and number of healthcare related searches in both our aggregate and day-wise features as a users’ level of concern over a healthcare issue is likely correlated to the number of times they search for information for reassurance or remedy.
Semantic features
The language of the search queries in our dataset posed a unique challenge to our analysis. On one hand, we can leverage advantageous aspects of the Chinese language, such as the lack of verb conjugation and plural forms. In addition, this allows us to capture the meaning behind idiomatic expressions that may be challenging to translate. On the other hand, English tokens would enable us to utilize a wider variety of existing language analytic tools. Thus, we balanced the two approaches by analyzing our tokens in Chinese, performing token translation and performing further analysis in English.
For our Chinese semantic analysis, we identified enriched tokens that are used by patients and controls using a Fisher’s test with Bonferroni correction. We also evaluated the number of patients and controls that searched for each token on any given day, and compared the term frequency between patients and controls. We took the union of the tokens from these two analyses, and the best performing 108 tokens were included as features in subsequent analysis. Following this analysis, all tokens from healthcare queries were translated independently based on their part of speech from Chinese to English for downstream analyses. (Figure 3).
Figure 3.
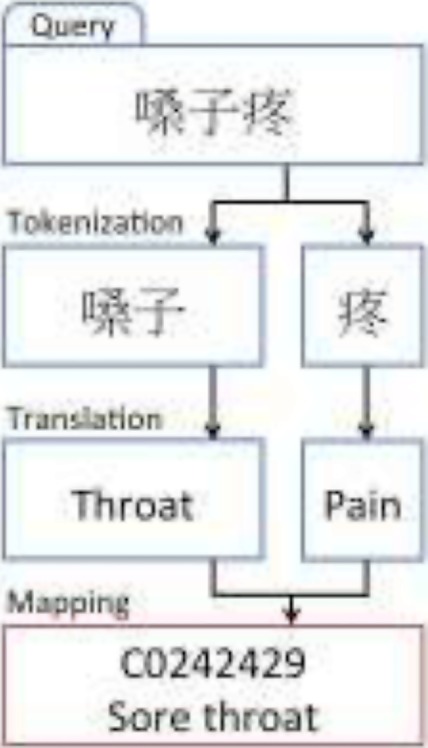
Framework for search text translation and mapping
In order to model the variation in search content across search days for patients and controls, we further chose to explicitly characterize the medical content within the search text by using an approach that has been validated in clinical text mining research. While the form and structure of search text is fundamentally different from the free text in patients’ records, we note that certain aspects of the two are strikingly similar from a linguistic stand-point. Intuitively, one may take advantage of this similarity by employing proven tools and techniques that have been used to characterize lexical coverage in the former, for achieving similar goals with the latter. In particular the use of ill-formed sentences, abbreviations and spelling errors are common to both search text and clinical text and motivated our choice of a biomedical terminology for identifying and delineating the use of medical terms in search text. We decided to use an extensive terminology of terms drawn from 22 clinically relevant ontologies from UMLS and BioPortal (13). The lexicon represents over 3.1 million terms that map to nearly 1.2 million concepts and a functional evaluation of annotations of clinical text based on the same have shown equivalence with more sophisticated natural language processing (NLP) based approaches. Since the UMLS provides a mapping from each concept to one or more semantic types, by coalescing relevant semantic types into groups that represent diseases, drugs, devices or procedures one may achieve a fine-grained characterization of search terms by determining their group membership. Based on the group assignment of individual terms, we counted the membership of individual searches into the aforementioned four groups and used these counts as features indicating the nature of the medical content in queries on a given search-day. Similarly, membership counts across the full analysis window yielded the aggregated semantic features related to medical content.
Search specificity
Information returned by medical searches is known to influence concerns related to health, which in turn modulates subsequent search behavior (14). Concerns about common symptomatology have been shown to escalate into searches for serious and rare diseases (15) and anxiety regarding one’s health is likely to influence healthcare utilization intent (6), possibly precipitating a visit to a medical facility. Thus, we were interested in modeling the evolution of searches that progressed from a general inquiry regarding symptoms into a specific inquiry regarding a serious health condition. We chose to use the information content (IC) score of the most specific term in a search as an indicator of the generality of the subject matter of the search. IC takes advantage of the hierarchical structure of a medical ontology to ensure a monotonically non-decreasing measure of specificity and may be computed on the basis of document level frequency of a term in a corpus. For search terms that mapped to our medical terminology we obtained IC scores computed for Medline abstracts. As with other semantic features, we chose the highest day-wise score for all searches from a given search-day for a day-wise measure of search specificity.
Location features
To build location features, we attached location labels to the latitude and longitude coordinates of searches. We used the Gecko Landmarks API, which takes as input the latitude and longitude and outputs the ten closest landmarks to this referenced location ranked by distance along with name and category labels for each landmark (16). For example, for a reference location given by latitude 39.903651 E, 116.415505 N, the Gecko API returns Beijing Hospital as the closest landmark with a category label of “Hospital”.
We obtained access to a rate-limited instance of a Gecko server that permitted us to submit 5 million API requests. We rounded each geographic coordinate to four decimal places and then filtered for uniqueness. This resulted in under 5 million coordinate pairs without a significant loss of precision. Coordinates with accuracy up to 4 decimal places represent an accuracy of about 11 meters, which we consider adequate for our location features. We then set up a network of Amazon Elastic Cloud Compute (EC2) instances for executing the Gecko API over batches of location coordinates (Figure 4). After the compute servers were finished running, we merged the lists of landmarks. From the list of landmarks associated with all unique and binned coordinates, we built our feature matrix. Specifically the features were the number of searches made by a user from a given landmark category (e.g. Health, Restaurant, etc.).
Figure 4.
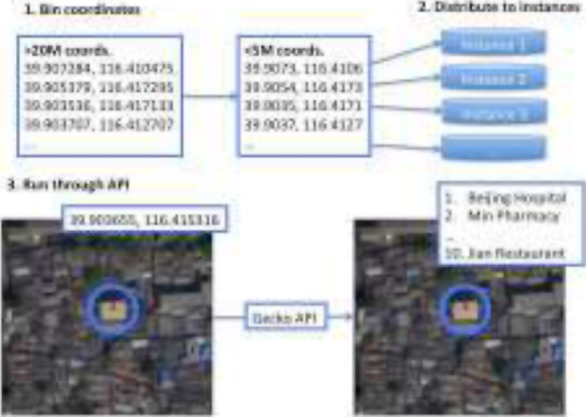
Workflow to extract location features
We also created features based on individual words in the location names. For example, searches from an educational building could have words “elementary” or “university” in the location names that were identified by the Gecko API. Though both universities and elementary schools have a category label of “education,” they have opposite effects on predicting hospitalization; the former term is enriched while the latter is slightly depleted in patient’s search logs. We indicated the presence or absence of a word token in a search location name using a binary (0,1) variable. Features based on individual tokens in location names capture additional granularity without imposing a structure on the location names a priori.
Building prediction models
We constructed a variety of supervised machine learning models based on our aggregate and day-wise features. In fitting our models, the aggregate feature set and the day-wise feature set were divided into 85% for training, and the remaining 15% for testing (Figure 5). Given the sparsity and correlations within our features, we focused primarily on using regularized models to reduce the dimensionality of our feature set and to avoid over-fitting. All machine-learning analysis was performed using R 3.2.0 (R Development Core Team, Vienna, Austria). We selected linear, nonparametric, and ensemble methods to evaluate the best fit to our data. For linear models, we built lasso, ridge, and elastic net models using the glmnet (17) package. Ten fold cross validation was applied to the training set to determine the optimal tuning parameter λ for lasso and ridge classification. For elastic net, a grid search was performed using the caret (18) package to determine λ and α. The λ that was within one standard error of the λ that produced the minimum cross validation error was selected for these models to prevent over-fitting. As an alternative form of feature selection, we applied forward stepwise logistic regression using the MASS package (19).
Figure 5.
Building and testing prediction models
In addition to linear models, we built support vector machine (SVM) models with a Gaussian kernel using the e1071 (20) package and random forest models using the randomForest (21) package. For our SVM models, γ was set to 1 divided by the number of features, and the cost C was chosen via cross validation. To evaluate the performance of our models, we constructed receiver-operator characteristic (ROC) curves using the ROCR package (22). We used the area under the curve (AUC) of the ROC curve, precision, recall, and the F1 measure to compare the performance of our classifiers in the held out test set.
Results
Feature extraction
Throughout the course of our feature engineering, we explored our features in patients and controls in our training data. Figure 6 shows a heat map where the rows are specific tokens in location names and the columns are patients and controls. Green and black represent the presence and absence of the feature, respectively. We see that patients tend to cluster in the middle and have a relative lack of variety of search locations, possibly reflecting the more sedentary nature of patients versus controls.
Figure 6.
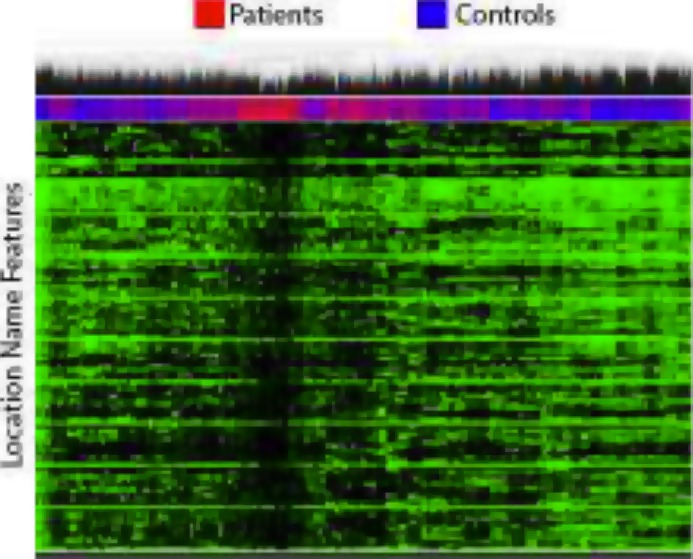
Heat map of words in location
Supervised machine learning
The AUCs for our feature sets across all models are shown in Table 2 and Figure 7. Computational restrictions precluded us from training the features more computationally expensive models such as the forward stepwise selection models on all feature sets. Our models showed the poorest performance with the aggregate features, with the highest AUC at 0.633 from the forward stepwise selection model. On the day-wise features, we observed the best performance with random forest, reaching an AUC of 0.75. Though the day-wise features performed better, the discrepancy between our training and test AUCs indicated that we needed to further account for over-fitting. To address this, we trained models using only general and semantic features. As explained earlier, our labels for patients and controls are noisy. To minimize any effects on account of controls visiting a medical facility immediately after the time of the last search log, we shifted the end point of the controls windows by 10 search days before the last search log. We refer to the general and semantic feature drawn from the analysis windows that were offset by 10 search-days for patients and controls, as our day-wise offset feature set. In doing so, we see further improvements, reaching an AUC of 0.813 with the lasso model.
Table 2:
AUCs for aggregate, day-wise and day-wise offset feature sets
| Model | Aggregate | Day-wise | Day-wise offset | |||
|---|---|---|---|---|---|---|
| Training | Test | Training | Test | Training | Test | |
| Lasso | 0.918 | 0.624 | 0.899 | 0.509 | 0.967 | 0.813 |
| Ridge | 0.912 | 0.601 | 0.947 | 0.561 | 0.973 | 0.785 |
| Random Forest | 0.895 | 0.481 | 0.896 | 0.750 | 0.941 | 0.557 |
| Elastic Net | 0.918 | 0.621 | 0.914 | 0.532 | 0.966 | 0.812 |
| SVM, Radial Kernel | 0.998 | 0.583 | - | - | - | - |
| Forward Stepwise Selection | 0.924 | 0.633 | - | - | - | - |
Figure 7.
ROC curves for (A) aggregate (B) day-wise and (C) day-wise offset feature sets
Feature importance
To investigate individual features in our models, we extracted the top features from the best performing model in each feature set. These features are shown in Table 3, where GE, SE, and LO correspond to general, semantic, and location features respectively. The top features include health related terms, common verbs and locations, and references to popular culture. This diverse set of features, particularly in the day-wise offset model, is likely due to the lasso model choosing an arbitrary representative feature among a set of correlated futures, some of which may have medical significance. Interestingly, the semantic feature “ 哪 (which),” a character used primarily at the beginning of questions, persisted throughout all three sets of analyses. This may be indicative of information seeking intent, which in the context of healthcare searches could imply healthcare seeking intent.
Table 3:
Top ranked features for best performing feature set models
| Aggregate | Day-wise | Day-wise offset | ||||
|---|---|---|---|---|---|---|
| 1 | SE | 哪, 哪个 (which) | SE | 视频 (video) | SE | 拉贝哪 (Bella Yao) |
| 2 | SE | 视频 (video) | LO | Accommodation, Hotel | SE | 家庭醫生訪問 (Home Doctor Visit) |
| 3 | SE | 至 (to) | LO | Health | SE | 范冰冰 (Bingbing Fan) |
| 4 | SE | 走 (go) | GE | Day 1 # Health searches | SE | 喝 (drink) |
| 5 | LO | “hua” | SE | 哪 (which) | SE | 哪个 (which) |
| 6 | LO | “mall” | LO | Safety, Police | SE | 买 (buy) |
| 7 | LO | “metro” | GE | Average IC | SE | 死 (die) |
Specifically, in our day-wise models, we see a variety of general, semantic, and location features, of which many align with our intuition of healthcare seeking behavior. For example, the number of healthcare related queries the day before a user visits the hospital was predictive, though the number of health searches was not considered a top feature for the aggregate model. As the day-wise model outperforms the aggregate model, it appears that the granularity gained by a day-wise feature breakdown reveals relevant healthcare features in a particular time frame important for prediction. Furthermore, health related locations were also predictive, which suggests that having prior hospital visits increases the probability of a future hospital visit.
When we analyze only general and semantic features from shorter analyses windows in our day-wise offset feature set, our lasso model selected a wider variety of features. These tokens range from Chinese celebrities to common nouns and verbs, including “家庭醫生訪問(home doctor visit)” and “死(die)”, which are health related. Searches containing celebrity names in our analysis window (which coincide with publicly released information regarding major health events associated with the celebrities) could be indicative of searchers’ interactions with their environment and the induced health anxiety that has been studied previously (5).
Discussion
The value of Internet search logs as valuable repositories of patient generated biomedical information is not in question. While studies in the past have focused on different aspects of medical research while analyzing log data, considerably less attention has been devoted to studying geo-tagged search logs for healthcare related research. Since location data offers an opportunity to link search users’ virtual behavior with their in-world activities, it holds promise for many areas of medical research that have heretofore remained un-impregnable to conventional research techniques. With its high sparsity, missingness and vulnerability to contamination, geo-tagged search data also poses unique challenges for informatics research. To date, we are aware of only one other study that has attempted to use such data for predicting healthcare utilization. In their privacy-sensitive analysis of geo-tagged data from mobile devices, White et al. predict the probability of a future search proximal to a medical facility based on features that convey healthcare utilization intent, extent of medical content in the search and evidence of earlier healthcare utilization (10). Our approach is similar in respect of using biomedical lexical resources to characterize the medical content in search. However, our approach of studying search behavior within a fixed analysis window of search-days is novel and captures at a higher resolution the progression of a wide variety of search attributes. We also note that two of our top day-wise features namely, the number of queries on the search day preceding the day of a medical visit, and the evidence of a prior visit to a medical facility are in agreement with the results demonstrated by White et al.
In the methods section we have referred to the issue of labeling errors that result from our labeling approach. We also expect labeling errors to arise on account of the “bleed-in” effect of visits to medical facilities that take place immediately before and after our observation period. The linear models trained on the day-wise offset features described earlier, show a much higher performance and do not exhibit the “classifier confusion” that we notice in the linear models trained on aligned analysis windows. Since the control features derived from this artificially offset analysis window are less likely to be contaminated by any bleed-in that could happen near the edges of our original analysis windows, it likely contributes to the performance gain along with less overfiting. This also suggests that a larger observation period may allow a better control on labeling errors.
We also note two other sources of noise in our features. Computation of IC scores for all tokens in our corpus is a computationally intensive task that was infeasible to accomplish within the scope of the current study. As a result, we chose to use IC scores for English translations of our tokens that had been pre-computed over Medline abstracts. Since the distribution of terms in bibliographic texts and searches is likely to be different, we suspect that our IC scores may not always capture the search specificity correctly. IC scores computed over a corpus of search text are likely to better represent search specificity. We used machine translations in order to use some of the tools that have demonstrable efficacy in the clinical text-mining realm. Using a lexicon based on Chinese biomedical ontology may allow us to avoid the translation step and the resulting feature noise altogether.
We derived aggregate and day-wise features from geo-tagged search logged data for modeling the progression of general, semantic and location based attributes over an analysis window based on a fixed number of search-days for patients and controls. The models trained on day-wise features performed better compared to the models trained on aggregate features suggesting that that day-wise progression of search attributes better represents search behavior that signals healthcare resource utilization. A key limitation is the vulnerability to noise from searches close to the observation boundaries, as well as from false negatives that arise from our labeling approach. We expect that with search data that spans larger observation windows will allow creation of clear feature sets. Methods that attempt to learn from positive only labeled data may also be explored to control for false negative labels. We intend to pursue these ideas in our future work. Our method demonstrates the potential of discovering features that are in agreement with results from prior studies on geo-tagged search log data. Overall, we believe that in conjunction with the state-of-the art forecasting methods, predictions based on geo-tagged search logs can help hospitals effectively streamline staffing costs.
Acknowledgments
We thank Baidu Research (USA) for providing us access to the de-identified search log data for our study. We thank the Gecko Landmarks Ltd. team for extensive custom access to their API. We acknowledge funding from NIGMS R01 GM101430 and a research grant from Baidu USA. We are grateful to Dr. Tim Sweeney, Dr. Steve Bagley, Dr. Russ Altman, Dr. Juan Banda and Dr. Rainer Winnenberg for their valuable advice.
References
- 1.Todd SR, Sommers , Benjamin D. Overview of the Uninsured in the United States: A Summary of the 2012 Current Population Survey Report. 2012. U.S. Department of Health & Human Services.
- 2.Wilper AP, Woolhandler S, Lasser KE, McCormick D, Bor DH, Himmelstein DU. Health insurance and mortality in US adults. American journal of public health. 2009;99(12):2289–95. doi: 10.2105/AJPH.2008.157685. [DOI] [PMC free article] [PubMed] [Google Scholar]
- 3.Horvitz E, Mulligan D. Policy forum. Data, privacy, and the greater good. Science. 2015;349(6245):253–5. doi: 10.1126/science.aac4520. [DOI] [PubMed] [Google Scholar]
- 4.White RW, Tatonetti NP, Shah NH, Altman RB, Horvitz E. Web-scale pharmacovigilance: listening to signals from the crowd. Journal of the American Medical Informatics Association: JAMIA. 2013;20(3):404–8. doi: 10.1136/amiajnl-2012-001482. [DOI] [PMC free article] [PubMed] [Google Scholar]
- 5.Eastin MS, Guinsler NM. Worried and wired: effects of health anxiety on information-seeking and health care utilization behaviors. Cyberpsychology & behavior: the impact of the Internet, multimedia and virtual reality on behavior and society. 2006;9(4):494–8. doi: 10.1089/cpb.2006.9.494. [DOI] [PubMed] [Google Scholar]
- 6.White RW, Horvitz E. From health search to healthcare: explorations of intention and utilization via query logs and user surveys. Journal of the American Medical Informatics Association: JAMIA. 2014;21(1):49–55. doi: 10.1136/amiajnl-2012-001473. [DOI] [PMC free article] [PubMed] [Google Scholar]
- 7.Benford S, Seager W, Flintham M, Anastasi R, Rowland D, Humble J, et al. The Error of Our Ways: The Experience of Self-Reported Position in a Location-Based Game. In: Davies N, Mynatt E, Siio I, editors. UbiComp 2004: Ubiquitous Computing. Springer Berlin Heidelberg: 2004. pp. 70–87. Lecture Notes in Computer Science. 3205. [Google Scholar]
- 8.Quercia D, Lathia N, Calabrese F, Di Lorenzo G, Crowcroft J, editors. Recommending Social Events from Mobile Phone Location Data; Data Mining (ICDM), 2010 IEEE 10th International Conference on; 2010. 2010 13-17 Dec. [Google Scholar]
- 9.White R, Horvitz E. From web search to healthcare utilization: privacy-sensitive studies from mobile data. Journal of the American Medical Informatics Association: JAMIA. 2013;20(1):61–8. doi: 10.1136/amiajnl-2011-000765. [DOI] [PMC free article] [PubMed] [Google Scholar]
- 10.2010. Association MH. Hospital Costs in Context: A Transparent View of the Cost of Care. Massachusets Hospitals Association.
- 11.Barr C, Jones R, Regelson M. The linguistic structure of English web-search queries; Proceedings of the Conference on Empirical Methods in Natural Language Processing; Honolulu, Hawaii: Association for Computational Linguistics; 2008. pp. 1021–30. [Google Scholar]
- 12.Jadhav A, Andrews D, Fiksdal A, Kumbamu A, McCormick JB, Misitano A, et al. Comparative analysis of online health queries originating from personal computers and smart devices on a consumer health information portal. Journal of medical Internet research. 2014;16(7):e160. doi: 10.2196/jmir.3186. [DOI] [PMC free article] [PubMed] [Google Scholar]
- 13.Jung K, LePendu P, Iyer S, Bauer-Mehren A, Percha B, Shah NH. Functional evaluation of out-of-the-box text-mining tools for data-mining tasks. Journal of the American Medical Informatics Association: JAMIA. 2015;22(1):121–31. doi: 10.1136/amiajnl-2014-002902. [DOI] [PMC free article] [PubMed] [Google Scholar]
- 14.White RW, Horvitz E. Cyberchondria: Studies of the escalation of medical concerns in Web search. ACM Trans Inf Syst. 2009;27(4):1–37. [Google Scholar]
- 15.Muse K, McManus F, Leung C, Meghreblian B, Williams JM. Cyberchondriasis: fact or fiction? A preliminary examination of the relationship between health anxiety and searching for health information on the Internet. Journal of anxiety disorders. 2012;26(1):189–96. doi: 10.1016/j.janxdis.2011.11.005. [DOI] [PubMed] [Google Scholar]
- 16.Landmarks G. Landmarks API. 2012.
- 17.Friedman JH, Hastie T, Tibshirani R. Regularization Paths for Generalized Linear Models via Coordinate Descent. Journal of Statistical Software. 2010;1(1) 2010. [PMC free article] [PubMed] [Google Scholar]
- 18.Kuhn M. Building Predictive Models in R Using the caret Package. 2008;28(5):26. 2008. [Google Scholar]
- 19.Ripley WNVaBD. Fourth ed. New York: Springer; 2002. Modern Applied Statistics with S. [Google Scholar]
- 20.Dimitriadou E, Hornik K, Leisch F, Meyer D, Weingessel A. Misc functions of the Department of Statistics (e1071) 2008;1:5–24. TU Wien. R package. [Google Scholar]
- 21.Liaw A, Wiener M. Classification and regression by randomForest. R news. 2002;2(3):18–22. [Google Scholar]
- 22.Sing T, Sander O, Beerenwinkel N, Lengauer T. ROCR: visualizing classifier performance in R. Bioinformatics. 2005;21(20):3940–1. doi: 10.1093/bioinformatics/bti623. [DOI] [PubMed] [Google Scholar]


