Abstract
We introduce a tool that extracts clinical data sets and provides visualizations from clinical data warehouses that use the Informatics for Integrating Biology and the Bedside (i2b2) query tool. Our tool, i2b2t2 (i2b2 to Tableau), can extract and visualize any i2b2 query into a portable format that researchers can easily explore without needing a highly technical or statistical background. This user-friendly format provides a quick visual summary of the queried population and is easily extendable to develop more intricate and robust visualizations. Extraction and visualization can be provided as a service by clinical data warehouses to expedite the release of data sets for research. i2b2t2 also encourages visualization as a self-service; a motivated researcher can develop custom visualizations for exploration or publication.
Introduction
Clinical research often begins with data extracted from clinical data warehouses (CDWs). Informatics for Integrating Biology and the Bedside (i2b2) is an initiative sponsored by the NIH Roadmap National Centers for Biomedical Computing which provides a query tool that supplies aggregate counts and basic analyses of patient populations from CDWs1. Ten internal medical centers, sixty academic medical centers, and over half of all sites awarded a Clinical and Translational Science Award (CTSA) report using i2b22. i2b2 is effective at estimating patient cohort sizes3 and has an extendable architecture where plugins with additional features can be developed1.
Modifications to i2b2 have a wide variety of purposes and impacts. Functional modifications seek to add novel functionality, such as the R-engine cell4 and SMART apps5. Performance modifications, such as replacing internal technical components6, 7, seek to improve the responsiveness of the tool. External modifications, such as the Integrated Data Repository Toolkit (IDRT) 8, seek to enhance the adoption, usage, and proliferation of i2b2. Our tool is external to i2b2 and attempts to bridge the gap between cohort identification and cohort information visualization.
Information visualization can engage users and their data and lessen the difficulty of discovering deeper details and relationships by exploiting their visual recognition abilities9. Visualization is well-studied in health-care10,11, medical informatics12, and imaging informatics13, but is relatively new to clinical research informatics14. Current research includes problem-specific examples, such as visualizing time series and analysis15. Problem- and domain-specific16 examples are plentiful, but we aim to construct a tool capable of assisting a general-purpose clinical researcher in delving into a retrospective data extract obtained through i2b2. Other visualization systems exist, such as HARVEST17 and SMART apps5, but their focus is primarily to summarize and visualize a single patient and their longitudinal event history rather than summarizing an entire population. Gnaeus18 is an example of a cohort visualization tool, but it does not assist in finding the cohort.
Visualization has been demonstrated to reduce task completion times, but its impact on finding and retrieving patients is uncertain and highly dependent on the visualization interface19. We avoid the retrieval process by relying upon i2b2’s dynamic interface to assist researchers in constructing a query and retrieving a population. Once a population is retrieved, we can then visualize it and assist the researcher in understanding the population’s characteristics.
Methods
We use our CDW as a hub for distributing clinical data extracts for research. One of the goals of i2b2t2 is to facilitate the process of delivering extracted data and visualizations to a researcher once they have found a desired patient population in i2b2. Tableaua is a commercial software package for authoring visualizations; these visualizations can be delivered in the form of packaged workbooks, which can then be opened in Tableau reader, a free workbook reader toolb similar in look and feel to an interactive PDF reader.
i2b2t2 uses Tableau’s Software Development Kitc to create Tableau data extract (TDE) files; only a simple database connection to i2b2 is needed. A user requests an extract and visualization workbook for a given i2b2 query; these identified queries are logged and queued into a request table. i2b2t2 runs as a service that executes pending data extract requests at a configurable interval. The pipeline for extracting data from i2b2 and constructing the workbook is found in Figure 2. Preliminary staging of extracted data is necessary because each data extract replaces the patient and encounter identifiers with randomly generated keys specific to that request; this reduces security concerns that additional information could be leaked or deduced from a “connect the dots” attack with multiple data extracts20. Also with the goal of preserving privacy, we independently date shift each patient’s history, so that the time between events within a patient’s record is faithfully preserved21.
Figure 2.
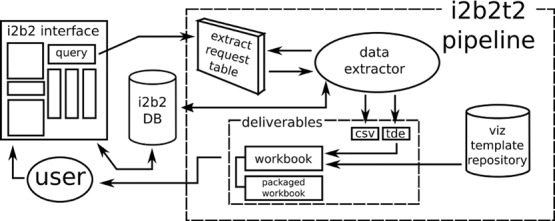
The pipeline of i2b2t2 begins with an i2b2 query and ends with a deliverable containing the raw data files for analysis, TDE files for constructing additional visualizations, and pre-constructed workbooks with interactive visualizations copied from a template.
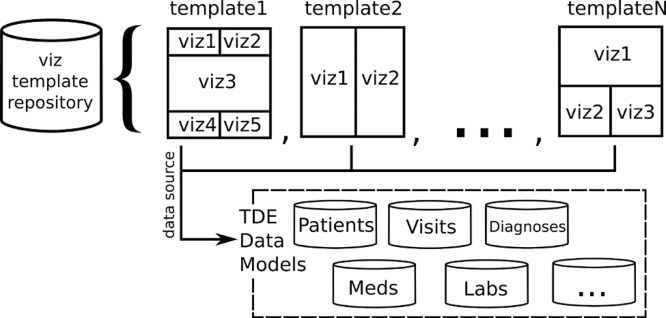
Once staging is complete, queries that extract selected dimensions, such as diagnoses, medications, procedures, and so on, are logged and executed. The result set of these queries are written to CSV files and to TDE files. The CSV files provide the detailed data necessary for analysis and the TDE files will be the data source for the workbook of visualizations. To construct the workbook, a template is copied from a local file repository (Figure 3) and its data sources are set to the newly extracted TDE files. The workbook templates contain visualizations we have developed and found useful for a general purpose data extract. For highly motivated researchers, new visualizations can be added by leveraging the same TDE files in Tableau Desktop or by using the CSV files in an analysis software package of their choosing. Other templates exist which provide visualizations for project specific queries, such as an in-depth visual analysis of our diabetic population.
Figure 3.
Any number of templates can reside in the repository; all visualizations share a common data source of models constructed through extracted i2b2 concepts.
Once the template is copied and its data sources are configured, a packaged workbook is created; this is a single compressed archive containing the workbook and data sources merged together and can be opened with the free reader tool. As a last step, i2b2t2 compresses all data files, workbooks, and packaged workbooks into a single compressed file that is deliverable to the researcher.
Results
A workbook can contain as many visualizations as desired. To prevent information overload9, multi-perspective summaries are provided. Our default template has eight general-purpose visualizations: patient list, demographics, top 10 medications, top 10 labs, top 10 procedures, HbAlc, metabolic panel, and blood pressure.
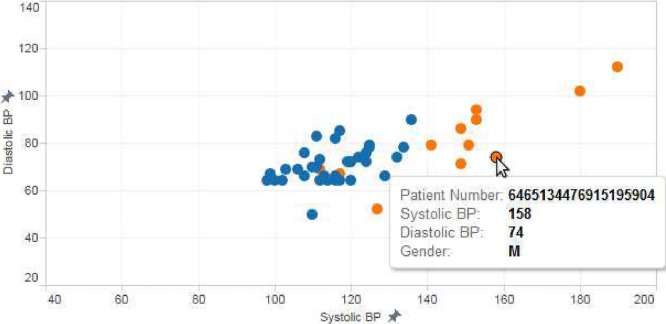
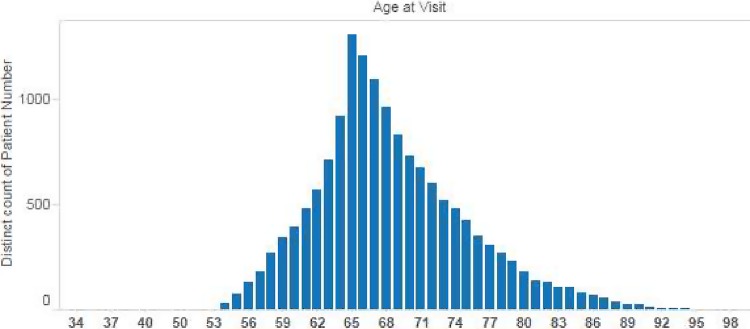
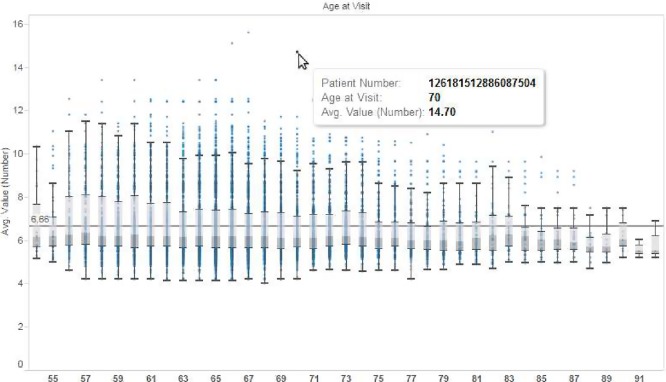
These visualizations give a bird’s eye view of the population contained in the data set. The default workbook template attempts to fulfill two common visualization needs: discovering trends and identifying outliers. Figure 4 shows how a very basic plot of blood pressure could help identify outliers of interest. Figure 5 shows how easily cohort trends can be visualized. Figure 6 shows how a high-volume set of lab values can be concisely summarized with a traditional box-and-whiskers plot.
Figure 4.
When plotting blood pressure, outliers are evident (orange dots are male and blue dots are female).
Figure 5.
Visualization allows one to see trends for certain study populations.
Figure 6.
Box and whiskers plots can show quartiles and outliers for lab measurements (HbA1c shown)
The template is extendable and interchangeable so that additional visualizations or workbooks can be implemented as needed. We also have a patient record viewer and event time-line template that allows one to drill-down based on a chosen concept (diagnosis, medication, etc.) to see only those patients who have that concept in their records.
For security and practical reasons, all queries are logged so that we know exactly what data has been included in a given data extract. This is helpful in both security and regulatory audits of clinical data releases. This also enables us to refresh an extract should the researcher need updated data in the future. By default, all extracts are released with identifiers for patients and visits specific to that encounter; this security feature also acts as a fingerprint of the data extract.
Before creating the entire pipeline, we piloted the idea of providing visualizations to researchers as part of their data extract requests. Initial feedback indicates the user-friendly point-and-click interfaces that these interactive visualizations provide are greatly welcomed. In our early findings, a clinical researcher was pleased that he did not have to completely rely on his statistician collaborator to explore the data set, which was too large to explore via the researcher’s traditional means. Being able to engage a very large data set without the need for an advanced statistical package eliminated a barrier for clinical research.
The pitfall of this approach is that not every visualization need can possibly be met. There will be great visualizations that are overly study specific, causing their utility to the general public to be questionable. A highly motivated researcher can use the TDE files to construct his or her own visualizations for research or publications without needing our template workbooks. There is a natural learning curve to Tableau and there have been studies of known barriers and challenges with novices creating visualizations22.
Discussion
Our approach for having visualization as a service relies upon the idea that existing information visualization authoring tools are highly effective in creating visualizations. Once the template for visualization is authored, instances of the visualizations can operate on specific data sets and be released to the researcher to aid them in surveying the data. We have chosen Tableau as a visualization framework because of its free PDF-like reader tool that researchers can easily download. As the process already yields CSV and TDE files, additional formats can be supported in the future. For example, we could provide R data frames and R scripts for basic analysis and create R-based visualizations also.
The entire pipeline is automated which drastically increases our ability as a CDW to release data to researchers quickly. We have extracted data as a service for several years and the ability to create a general-purpose data extracts greatly unburdens our data analyst team. Our institution maintains an internal CDW that feeds into i2b2; we could have interfaced Tableau with our internal CDW, but by choosing to layer Tableau with i2b2, our visualization efforts are reusable in the biomedical community for those that use i2b2 too. As illustrated in Figure 2, i2b2 acts as a public- facing portal that enables cohort discovery under a self-service model; data extracts and visualizations are additional deliverables of the process.
There is more than one strategy for connecting visualizations to i2b2. An alternative to our design is to develop i2b2 plugins that directly contain visualizations in the i2b2 web client’s interface; this design could leverage existing libraries such as D3 (Data-Driven Documents)a to create data-driven visualizations. Software development is an inarguably expensive process and often requires maintenance in perpetuity. We avoid the need for programming visualizations for the web by designing visualizations and workbook templates within the Tableau ecosystem, which removes the burden of designing visualizations compatible with different web browsers, platforms, and devices. This should improve the user’s experience by providing a consistent, professional visualization environment; the cost of this experience is that it requires downloading a free tool to read the workbooks. Development of new visualizations requires a licensed copy of the Tableau Desktop software, which is available at academic pricing. The process of developing visualization templates for i2b2t2 is quite rapid due to the point-and-click nature of Tableau. We are expanding our repository of visualization workbook templates to include more visualizations, including ones for popular subsets of patients such as diabetics.
As a means of communicating with visualizations, Tableau supports storytellingb, which is an open area of research in the information visualization community23. As future work, we are experimenting through i2b2t2 with effective ways to tell a story with visualizations for a given patient population. Intuitively, this requires the most relative templates to be chosen based upon the population selected and to order visualizations in a way that tell a meaningful story.
i2b2t2 runs as a service and can be installed on any server that runs i2b2. Our source code is available online24 and is completely extendable to other institutions. i2b2t2 works with many of the common ontologies found in i2b2, such as ICD9 codes for diagnoses and CPT codes for procedures. Adding a dimension simply requires creating a TDE model indicating which columns and data types are present.
As seen in Figure 2, i2b2t2 fits into a self-service model of cohort identification and aims to connect researchers to an environment that allows for visual exploration of their data. This environment can be controlled as needed by the regulatory requirements of the CDW: these visual workbooks could be delivered to a virtual machine where access is controlled and logged if necessary. An unintended consequences of this security measure is that the user no longer needs to download and install the free workbook reader tool. We have focused our efforts on using de-identified data without large regulatory burdens, but acknowledge that other institutions may benefit from adding data-access controls based on the requesting user’s access level.
Conclusions
We introduced i2b2t2, an open-source service which handles data extract requests for queries developed in i2b2. The resulting data extract contains both raw data files for analysis and a packaged workbook of visualizations, which assists the researcher in exploring and understanding the data effectively. With i2b2t2 CDWs can rapidly release from i2b2 an improved data extract with visualizations for research. This completes a CDW self-service model with a researcher constructing a query to target a desired population in i2b2 and subsequently receiving in return a workbook containing useful and insightful visualizations, as well as data files for analysis.
Figure 1.
i2b2t2 fits into a self-service model where researchers find their study populations through i2b2 and request a data extract with an interactive, exploratory visualization component.
Acknowledgment
The project described was supported by the National Center for Research Resources and the National Center for Advancing Translational Sciences, National Institutes of Health, through Grant UL1TR000117. The content is solely the responsibility of the authors and does not necessarily represent the official views of the NIH.
Footnotes
References
- 1.Murphy SN, Weber G, Mendis M, Gainer V, Chueh HC, Churchill S, et al. Serving the enterprise and beyond with informatics for integrating biology and the bedside (i2b2) Journal of the American Medical Informatics Association. 2010;17(2):124–130. doi: 10.1136/jamia.2009.000893. [DOI] [PMC free article] [PubMed] [Google Scholar]
- 2.Kohane IS, Churchill SE, Murphy SN. A translational engine at the national scale: informatics for integrating biology and the bedside. Journal of the American Medical Informatics Association. 2012;19(2):181–185. doi: 10.1136/amiajnl-2011-000492. [DOI] [PMC free article] [PubMed] [Google Scholar]
- 3.Deshmukh VG, Meystre SM, Mitchell JA. Evaluating the informatics for integrating biology and the bedside system for clinical research. BMC medical research methodology. 2009;9(1):70. doi: 10.1186/1471-2288-9-70. [DOI] [PMC free article] [PubMed] [Google Scholar]
- 4.Segagni D, Ferrazzi F, Larizza C, Tibollo V, Napolitano C, Priori SG, et al. R engine cell: integrating R into the i2b2 software infrastructure. Journal of the American Medical Informatics Association. 2011;18(3):314–317. doi: 10.1136/jamia.2010.007914. [DOI] [PMC free article] [PubMed] [Google Scholar]
- 5.Wattanasin N, Porter A, Ubaha S, Mendis M, Phillips L, Mandel J, et al. Apps to display patient data, making SMART available in the i2b2 platform; AMIA Annual Symposium Proceedings. vol. 2012; American Medical Informatics Association; 2012. p. 960. [PMC free article] [PubMed] [Google Scholar]
- 6.Harris DR, Henderson DW, Kavuluru R, Stromberg AJ, Johnson TR. Using common table expressions to build a scalable boolean query generator for clinical data warehouses. IEEE Journal of Biomedical and Health Informatics. 2014;18(5):1607–1613. doi: 10.1109/JBHI.2013.2292591. [DOI] [PMC free article] [PubMed] [Google Scholar]
- 7.Weber GM. Supercharging i2b2; AMIA Summit on Translational Bioinformatics Proceedings. vol. 2012; American Medical Informatics Association; 2012. p. 182. [Google Scholar]
- 8.Bauer C, Ganslandt T, Baum B, Christoph J, Engel I, Lobe M, et al. The Integrated Data Repository Toolkit (IDRT): accelerating translational research infrastructures. Journal of Clinical Bioinformatics. 2015;5((Suppl 1)):S6. [Google Scholar]
- 9.Chittaro L. Information visualization and its application to medicine. Articial intelligence in medicine. 2001;22(2):81–88. doi: 10.1016/s0933-3657(00)00101-9. [DOI] [PubMed] [Google Scholar]
- 10.Shneiderman B, Plaisant C, Hesse BW. Improving healthcare with interactive visualization. Computer. 2013;46(5):58–66. [Google Scholar]
- 11.West VL, Borland D, Hammond WE. Innovative information visualization of electronic health record data: a systematic review. Journal of the American Medical Informatics Association. 2015;22(2):330–339. doi: 10.1136/amiajnl-2014-002955. [DOI] [PMC free article] [PubMed] [Google Scholar]
- 12.Bui AA, Hsu W. Medical Imaging Informatics. Springer; 2010. Medical Data Visualization: Toward Integrated Clinical Workstations; pp. 139–193. [Google Scholar]
- 13.McAulie MJ, Lalonde FM, McGarry D, Gandler W, Csaky K, Trus BL. Medical image processing, analysis and visualization in clinical research; CBMS 2001. Proceedings. 14th IEEE Symposium on Computer-Based Medical Systems, 2001; IEEE; 2001. pp. 381–386. [Google Scholar]
- 14.Caban JJ, Gotz D. Visual analytics in healthcare-opportunities and research challenges. Journal of the American Medical Informatics Association. 2015;22(2):260–262. doi: 10.1093/jamia/ocv006. [DOI] [PubMed] [Google Scholar]
- 15.Shahar Y, Goren-Bar D, Boaz D, Tahan G. Distributed, intelligent, interactive visualization and exploration of time-oriented clinical data and their abstractions. Articial intelligence in medicine. 2006;38(2):115–135. doi: 10.1016/j.artmed.2005.03.001. [DOI] [PubMed] [Google Scholar]
- 16.Jontell M, Mattsson U, Torgersson O. MedView: An instrument for clinical research and education in oral medicine. Oral Surgery, Oral Medicine, Oral Pathology, Oral Radiology, and Endodontology. 2005;99(1):55–63. doi: 10.1016/j.tripleo.2004.01.009. [DOI] [PubMed] [Google Scholar]
- 17.Hirsch JS, Tanenbaum JS, Gorman SL, Liu C, Schmitz E, Hashorva D, et al. HARVEST, a longitudinal patient record summarizer. Journal of the American Medical Informatics Association. 2015;22(2):263–274. doi: 10.1136/amiajnl-2014-002945. [DOI] [PMC free article] [PubMed] [Google Scholar]
- 18.Federico P, Unger J, Amor-Amoros A, Sacchi L, Klimov D, Miksch S. Euro Vis Workshop on Visual Analytics (EuroVA) vol. 2015. The Eurographics Association; 2015. Gnaeus: utilizing clinical guidelines for knowledge-assisted visualisation of EHR cohorts. [Google Scholar]
- 19.Farri O, Rahman A, Monsen K, Zhang R, Pakhomov S, Pieczkiewicz D, et al. Impact of a prototype visualization tool for new information in EHR clinical documents. Appl Clin Inform. 2012;3(4):404–418. doi: 10.4338/ACI-2012-05-RA-0017. [DOI] [PMC free article] [PubMed] [Google Scholar]
- 20.Whang SE, Garcia-Molina H. Secure Data Management. Springer; 2012. A model for quantifying information leakage; pp. 25–44. [Google Scholar]
- 21.El Emam K, Arbuckle L. O’Reilly Media, Inc.; 2013. Anonymizing health data: case studies and methods to get you started. [Google Scholar]
- 22.Grammel L, Tory M, Storey MA. How information visualization novices construct visualizations. IEEE Transactions on Visualization and Computer Graphics. 2010;16(6):943–952. doi: 10.1109/TVCG.2010.164. [DOI] [PubMed] [Google Scholar]
- 23.Kosara R, Mackinlay J. Storytelling: The next step for visualization. Computer. 2013;(5):44–50. [Google Scholar]
- 24.Bitbucket. i2b2t2 [Internet]. 2016 [cited 7 January 2016] Available from: https://bitbucket.org/_harris/i2b2t2.


