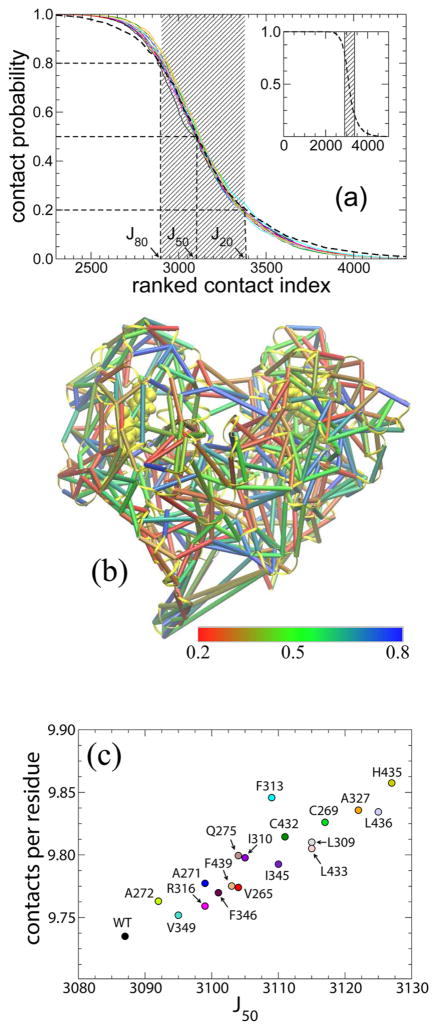
Figure 2.
Residue–residue contact analysis. (a) The ranked contact curves (RCCs) display the probability of residue–residue contacts for each individual system (thin lines) and the combined data (thick dashes). Note that there are 19 colored lines; each color represents an individual system from this study. The color scheme is displayed in panel c. Positions of J20, J50, and J80 of the combined RCC are labeled. The inset presents the overall view of the combined RCC. (b) The average contact probabilities for those contacts selected (between 20 and 80% formed) are displayed as cylinders (total of 489) between residues in the complex structure. The color spectrum is from red (0.2) to green (0.5) to blue (0.8). (c) The value of J50 vs the corresponding contacts per residue is displayed here for individual mutants and the wild type. The color scheme for the 19 systems is consistent throughout this work.

