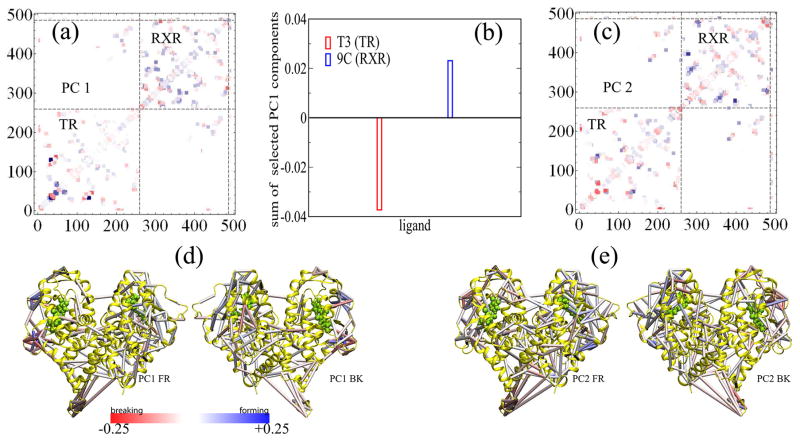
Figure 3.
(a) Eigenvector PC1 displayed on the residue–residue contact map. The internal index of the residues is used here for the axes. The dashed lines separate intra- and interprotein contacts. Another set of dashes demarcates the contacts formed between ligands (internal indices 492 and 493) and protein residues. (b) Sum of selected elements in eigenvector PC1 that contain the contact interaction between ligands (T3 and 9C) and the protein complex. The values of individual elements are listed in Figure S4 of the Supporting Information. (c) Eigenvector PC2 displayed on the contact map. Three-dimensional representations of PC1 and PC2 values are shown in panels d and e, respectively. For the sake of clarity, only those contacts with absolute values of >0.03 are explicitly displayed as colored cylinders.

