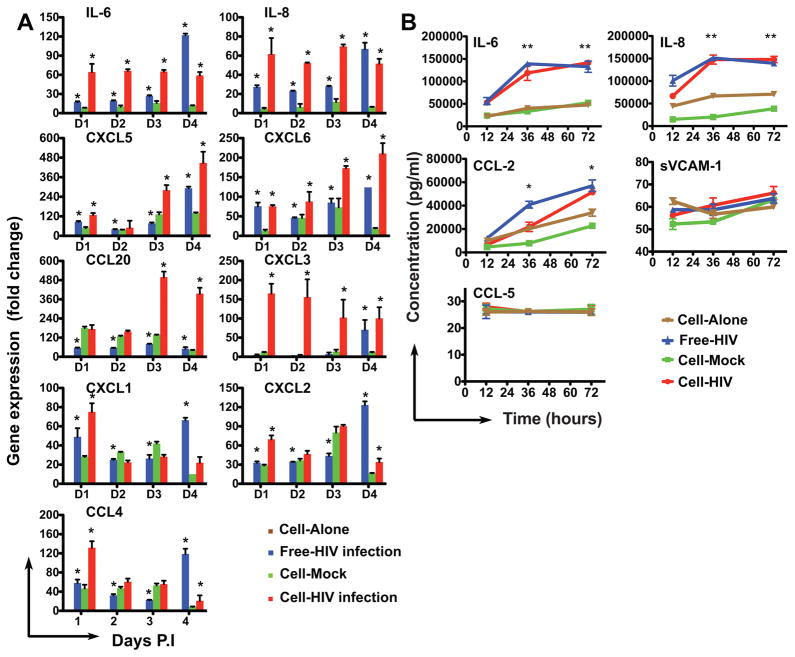
Figure 2. Measurement of RNA and protein levels of genes induced in RTEC following exposure to HIV or HIV infected T cells.
A. Quantitative real time PCR measurement of RNA level in HIV infected RTECs. RNA extraction was from RTECs infected with HIV (free-HIV or cell-HIV) at 1, 2, 3 and 4 days post infection, indicated as D1–D4 respectively. Gene expression levels of individual human cytokines/chemokines were normalized to the expression of GAPDH and are represented as fold change relative to GAPDH. HIV infection (cell-free infection, cell-associated infection and cell-mock infection) were normalized to cell alone which is set to default (fold change = 1).
B. Flowcytomix measurement of protein level from HIV-infected RTECs supernatants. Supernatants were collected from HIV infected RTECS at 12, 36 and 72 hours post infection. Protein level was determined by multiplexed analysis using standard references included in the detection kit.

