

We examined changes on human neuronal circuits by pairing transspinal and transcortical stimulation. Transspinal-transcortical paired associative stimulation (PAS) decreased intracortical inhibition and increased intracortical facilitation and corticospinal excitability. Transcortical-transspinal PAS did not affect intracortical circuits and decreased corticospinal excitability. Both protocols altered the excitation thresholds of Ia afferents and motor axons. This new PAS paradigm bears a significant physiological impact, because it can concomitantly alter the excitability of cortical circuits, corticospinal neurons, afferents, and motor axons in humans.
Keywords: motor cortex, spinal cord, PAS, transspinal stimulation, TMS, H-reflex
Abstract
Anatomical, physiological, and functional connectivity exists between the neurons of the primary motor cortex (M1) and spinal cord. Paired associative stimulation (PAS) produces enduring changes in M1, based on the Hebbian principle of associative plasticity. The present study aimed to establish neurophysiological changes in human cortical and spinal neuronal circuits by pairing noninvasive transspinal stimulation with transcortical stimulation via transcranial magnetic stimulation (TMS). We delivered paired transspinal and transcortical stimulation for 40 min at precise interstimulus intervals, with TMS being delivered after (transspinal-transcortical PAS) or before (transcortical-transspinal PAS) transspinal stimulation. Transspinal-transcortical PAS markedly decreased intracortical inhibition, increased intracortical facilitation and M1 excitability with concomitant decreases of motor threshold, and reduced the soleus Hoffmann's reflex (H-reflex) low frequency-mediated homosynaptic depression. Transcortical-transspinal PAS did not affect intracortical circuits, decreased M1 excitability, and reduced the soleus H-reflex-paired stimulation pulses' mediated postactivation depression. Both protocols affected the excitation threshold of group Ia afferents and motor axons. These findings clearly indicate that the pairing of transspinal with transcortical stimulation produces cortical and spinal excitability changes based on the timing interval and functional network interactions between the two associated inputs. This new PAS paradigm may constitute a significant neuromodulation method with physiological impact, because it can be used to alter concomitantly excitability of intracortical circuits, corticospinal neurons, and spinal inhibition in humans.
NEW & NOTEWORTHY
We examined changes on human neuronal circuits by pairing transspinal and transcortical stimulation. Transspinal-transcortical paired associative stimulation (PAS) decreased intracortical inhibition and increased intracortical facilitation and corticospinal excitability. Transcortical-transspinal PAS did not affect intracortical circuits and decreased corticospinal excitability. Both protocols altered the excitation thresholds of Ia afferents and motor axons. This new PAS paradigm bears a significant physiological impact, because it can concomitantly alter the excitability of cortical circuits, corticospinal neurons, afferents, and motor axons in humans.
the primary motor cortex (M1) engages in numerous physiological motor behaviors and sensorimotor learning (Lemon 2008) and contributes to the flexible control of spinal circuits (Rothwell 2012). Functional connectivity exists through anatomical and physiological connections and interactions between M1 neurons and spinal cord neurons (Lemon 2008; Porter and Lemon 1993). We have recently reported that 40 min of transspinal stimulation alone decreases the afferent-mediated facilitation of motor-evoked potentials (MEPs) and increases corticospinal excitability (Knikou et al. 2015). However, the effects of the pairing of transspinal and transcortical stimulation on human motor pathways are not known.
Paired associative stimulation (PAS) of presynaptic and postsynaptic cells produces spike timing-dependent plasticity via synaptic mechanisms (Song et al. 2000). This form of plasticity has been studied extensively by monitoring single-cell in vitro preparations, is associated with modifications in synaptic efficacy, and can modify synaptic efficacy in a bidirectional manner based on the timing of the two inputs [see reviews of Dan and Poo (2006) and Markram et al. (2011)]. Potentiation of a response occurs when the presynaptic input precedes the postsynaptic input, whereas depression occurs when the inputs are reversed (Buonomano and Merzenich 1998; Markram et al. 2011; Müller-Dahlhaus et al. 2010; Sjöström et al. 2008). Procedures for spike timing-dependent and PAS-induced plasticity in humans differ, but both are based on the Hebbian principle of associative plasticity (Hebb 1949) and may be mediated by similar neuronal mechanisms (Stefan et al. 2000, 2002). PAS-induced plasticity of M1 in humans is evident when transcranial magnetic stimulation (TMS) of the M1 is paired with stimulation to the contralateral M1 (Rizzo et al. 2009), supplementary motor area (Arai et al. 2011), premotor cortex (Buch et al. 2011), posterior parietal cortex (Chao et al. 2015; Koch et al. 2013), somatosensory cortex (Wolters et al. 2005), and peripheral nerve (Mrachacz-Kersting et al. 2007; Roy et al. 2007; Stefan et al. 2000). In humans, PAS-induced and practice-induced plasticity likely share the same synapses or involve interactions of similar neuronal circuits (Rosenkranz et al. 2007; Stefan et al. 2006; Ziemann et al. 2001), supporting the notion that PAS-induced plasticity may have functional implications.
In the current experiments, we applied associative stimulation to the spinal cord and M1 in healthy humans. We delivered paired transspinal and transcortical stimulation for 40 min at interstimulus intervals in which TMS was delivered after (transspinal-transcortical PAS) or before (transcortical-transspinal PAS) transspinal stimulation. In the transspinal-transcortical PAS, the transspinal stimulation served as the presynaptic input to cortical neurons. In the transcortical-transspinal PAS, transcortical stimulation served as the presynaptic input to spinal neurons. Our recent findings demonstrate that transspinal stimulation alone decreases soleus (SOL) Hoffmann's reflex (H-reflex) excitability and increases M1 excitability (Knikou 2013, 2014). Furthermore, the summation of transspinal-evoked potentials (TEPs), evoked by stimulation over the thoracolumbar region, and MEPs, evoked via TMS, supports the notion that transspinal and transcortical stimulation affects common neuronal pathways (Knikou 2014). We therefore hypothesized that transspinal-transcortical PAS will increase cortical output, whereas transcortical-transspinal PAS will increase spinal output. We found that transspinal-transcortical PAS decreases intracortical inhibition, increases intracortical facilitation, and increases M1 excitability with concomitant decreases of motor threshold (MT). In contrast, transcortical-transspinal PAS did not affect intracortical circuits and decreased corticospinal excitability. Both PAS protocols affected spinally mediated reflex depression and excitation thresholds of group Ia afferents and motor axons. These findings provide support for a timing-dependent bilateral PAS-mediated plasticity of human motor pathways using paired transspinal and transcortical stimulation. A preliminary report of some of this work has been published in abstract form (Dixon et al. 2016).
METHODS
Subjects
Nineteen healthy subjects (8 women; 24.84 ± 0.99 yr, mean age ± SE) participated in the study. None of the subjects had a history of neurological or musculoskeletal disorder or were taking medication that affects the excitability of the central nervous system. All subjects were right-leg dominant. A total of 78 experiments (3 different experimental sessions with 2 experiments conducted for each session) was completed on different days. Some subjects participated in more than one experimental session. In this case, the experiment was conducted at a 3-wk interval. For each experimental session, 12 subjects participated unless stated otherwise. For all subjects, eligibility for the study was first established based on a TMS safety-screening questionnaire. Written, informed consent was obtained before study enrollment. The blood pressure of all participants was monitored periodically during the experiment, and no significant changes were noted. All experimental procedures were conducted in compliance with the Declaration of Helsinki after full Institutional Review Board approval by the City University of New York Institutional Review Board Committee.
EMG Recordings
Surface electromyography (EMG) was recorded by single bipolar differential electrodes (MA300-28; Motion Lab Systems, Baton Rouge, LA) from the right tibialis anterior (TA) and SOL muscles. EMG signals were amplified, filtered (10-1,000 Hz), sampled at 2,000 Hz via a 1401 Plus [Cambridge Electronic Design (CED), Cambridge, UK], and stored for offline analysis.
Stimulation
Transcortical.
TMS focused over the left M1 was delivered via a Magstim 2002 stimulator (Magstim, Carmarthenshire, UK) with a double-cone coil (diameter 110 mm), positioned such that the current of the coil flowed from a posterior to an anterior direction. The point at which the lines between the inion and glabellum and the left and right ear tragus met was marked on an EEG cap. The center of the double-cone coil was placed 1 cm posterior and 1 cm to the left of this intersection point (Knikou 2014; Knikou et al. 2015). With the double-cone coil held at this position, the stimulation intensity was gradually increased from zero, and MEPs recorded from the right TA and SOL muscles were observed in real-time on a digital oscilloscope. When MEPs could not be evoked exclusively in the TA muscle at low-stimulation intensities, the magnetic coil was moved by a few millimeters to the left, and the procedure was repeated. When the optimal position was determined, the TA MEP resting threshold was established; resting threshold corresponded to the lowest stimulation intensity that induced repeatable MEPs of similar amplitude (∼100 μV) in three out of five consecutive, single TMS pulses (Rossini et al. 1994). Subjects answered a post-TMS questionnaire the day after each experiment. One subject from the group reported mild, remotely related sleepiness and trouble concentrating.
Transspinal.
The thoracic 11 (T11) spinous process was identified via palpation and in consolidation with anatomical landmarks (T1 spinal process, end of sternum, and end of rib cage). A single cathode electrode (Uni-Patch EP84169, 10.2 × 5.1 cm2; Medtronic, Wabasha, MN) was placed along the vertebrae, equally between the left and right paravertebral sides. Due to its size, the electrode covered from T11 to lumbar 1 or 2 (L1 or L2) vertebral levels. These vertebral levels correspond to L1 and sacral 2 spinal segments and thus to the segmental innervation of the muscles from which action potentials were recorded in this study. Two reusable, self-adhered electrodes (anode, same type as the cathode), connected to function as a single electrode, were placed bilaterally on the iliac crests (Knikou 2013; Knikou et al. 2015). The cathode and anode electrodes were connected to a constant current stimulator (DS7A; Digitimer, Hertfordshire, UK) that was triggered by Spike2 Scripts (CED).
Posterior tibial nerve.
A stainless-steel plate electrode (anode) of 4 cm in diameter was placed and secured proximal to the right patella. The most optimal stimulation site was established via a hand-held monopolar stainless-steel head electrode used as a probe (Knikou 2008). An optimal stimulation site corresponded to the site at which the M-wave had a similar shape to that of the H-reflex at low- and high-stimulation intensities, and low-stimulus intensities could evoke an H-reflex without an M-wave (Knikou 2008). When the optimal site was identified, the monopolar electrode was replaced by a pregelled disposable electrode (cathode, Suretrace; ConMed, Utica, NY) that was maintained under constant pressure throughout the experiment.
Transspinal and Transcortical PAS-Mediated Neuroplasticity
Paired stimulation included 240 pairs of TMS pulses delivered over the area of the motor cortex corresponding to the right TA muscle and cathodal transcutaneous constant current stimulation delivered to the spine. Both stimulations were delivered at 0.1 Hz for 40 min with subjects positioned in supine with knees-hips flexed at 30° and ankles in a neutral position.
The interstimulus interval between transspinal and transcortical stimulation was customized for each subject. The transspinal-transcortical PAS interval allowed transspinal stimulation to evoke depolarization of spinal motoneurons and affect cortical circuits before descending motor volleys, elicited by TMS, arrived at the presynaptic terminals of corticospinal neurons (Fig. 1). The transcortical-transspinal PAS interval allowed descending motor volleys, elicited by TMS, to arrive at the presynaptic terminals of corticospinal neurons before transspinal stimulation transynaptically evoked depolarization in spinal motoneurons. The interstimulus interval for each subject was estimated using the relative onset latencies of TA EMG responses to TMS (TA MEP) and transspinal stimulation (TA TEP). The conduction time from M1 to corticospinal presynaptic terminals was estimated by adding 1.5 ms to the TA TEP latency, and the resultant value was subtracted from the TA MEP latency. The added 1.5 ms is the time required for synaptic transmission and conduction to the lumbar nerve root at the vertebral foramina (Bunday and Perez 2012; Taylor and Martin 2009). This calculation resulted in interstimulus intervals that ranged from 8 to 13.5 ms (10.82 ± 0.56 ms) across subjects for the transcortical-transspinal PAS. These intervals are consistent with the 10.5 ± 0.9-ms central conduction time of TA MEP (Rossini et al. 1994). In the transspinal-transcortical PAS, the interstimulus intervals ranged from 10 to 15 ms (11.17 ± 0.41 ms) across subjects. Transspinal stimulation at intensities sufficient to evoke TEPs in all leg muscles depolarizes spinal motoneurons transynaptically and produces ascending and descending volleys from muscle and cutaneous afferents. Based on the conduction velocity of muscle and cutaneous afferents (Gandevia et al. 1982; Macefield et al. 1989), timing of distal limb afferents mediating MEP facilitation (Kasai et al. 1992; Nielsen et al. 1997), and evidence that transspinal cord stimulation with a single stimulus at the medium thoracic level induces cortical potentials with 10 ms onset latency and 30 ms duration in healthy humans (Costa and Deletis 2016), transspinal-induced ascending volleys at the interstimulus used reached motor cortex at times sufficient to affect MEPs at their origin site.
Fig. 1.

Paired associative stimulation (PAS) protocol. A: simplified illustration of transcranial magnetic stimulation (TMS volley) and transspinal stimulation-mediated volleys upon paired pulses. Note that TMS volleys are descending, whereas transspinal stimulation-mediated volleys are orthodromic and antidromic and can reach both brain hemispheres as transspinal stimulation alone evokes transspinal-evoked potentials in nearly all leg muscles bilaterally. PAS was delivered at timings during which corticospinal neurons, activated via TMS, arrived at the corticospinal neuron before spinal motoneurons were activated transynaptically by the transspinal stimulation (transcortical-transspinal PAS) and during which transspinal-mediated, ascending volleys arrived at the cortex before TMS was delivered over M1 (transspinal-transcortical PAS). B: electromyography (EMG) recordings from the right tibialis anterior (TA) muscle upon transspinal stimulation alone, TMS alone, and during transspinal-transcortical PAS and transcortical-transspinal PAS. During transspinal-transcortical PAS, a clear separation of motor- and transspinal-evoked potentials (MEPs and TEPs, respectively) is possible based on their associated latencies and durations, whereas summation of TA MEPs and TEPs in the surface EMG is evident at the interstimulus used to deliver transcortical-transspinal PAS. S20B and S22A, subjects 20B and 22A, respectively.
TA EMG recordings during transspinal-transcortical PAS indicate that TA TEPs can be easily separated from TA MEPs based on differential onset latencies and durations, whereas summation of MEPs and TEPs in the EMG occurs during transcortical-transspinal PAS (Fig. 1B), in line with our recently reported observations (Knikou 2014). In the transspinal-transcortical PAS protocol, transspinal stimulation was delivered at 48.38 ± 3.9 mA (1.08 ± 0.05 TA TEP threshold) and TMS at 63.42 ± 1.26 maximum stimulator output (1.13 ± 0.02 TA MEP resting threshold). In the transcortical-transspinal PAS protocol, transspinal stimulation was delivered at 54.6 ± 3.58 mA (1.14 ± 0.05 TA TEP threshold) and TMS at 60.24 ± 2.29 maximum stimulator output (1.08 ± 0.02 TA MEP resting threshold). The PAS stimulation intensities were selected based on the amplitude of the TA and SOL TEPs, TA MEPs, and SOL H-reflex amplitudes. Specifically, the transspinal stimulation intensity selected corresponded to that at which the TA TEPs were equivalent to the TA MEPs recorded at 1.2 resting MEP threshold, and SOL TEPs were equivalent to the SOL H-reflex that was ∼20–30% of the maximal M-wave (Mmax).
Neurophysiological Tests
The neurophysiological tests described below were conducted before and after 40 min of transspinal-transcortical and transcortical-transspinal PAS on different days.
Cortical neuroplasticity.
Cortical neuroplasticity was assessed by establishing changes in short-latency intracortical inhibition and medium-latency intracortical facilitation. Intracortical inhibition and facilitation do not depend on changes in spinal excitability (Chen et al. 1998; Kujirai et al. 1993) and thus can accurately measure plasticity in the motor cortex. TA MEPs, in response to paired TMS pulses over the left M1 (BiStim2 module; Magstim) at interstimulus intervals of 2, 3, 4, 10, 15, and 30 ms, were recorded randomly with unconditioned MEPs. In the transspinal-transcortical PAS protocol, the conditioning TMS (first stimulus) and the test TMS (second stimulus) were set at 0.73 ± 0.02 and 1.19 ± 0.01 MEP resting threshold across subjects, respectively. In the transcortical-transspinal PAS protocol, the conditioning TMS and the test TMS were set at 0.77 ± 0.01 and 1.16 ± 0.03 MEP resting threshold across subjects, respectively. At the interstimulus interval of 30 ms, the test TMS was also delivered at 1.4 TA MEP resting threshold to establish whether intracortical facilitation depends on the test MEP size. Unconditioned and conditioned MEPs were recorded before and after PAS at exactly the same stimulation intensities. Under control conditions, 24 MEPs at 0.1 Hz were recorded. Following subthreshold conditioning TMS, 12 MEPs at 0.1 Hz were recorded at each interstimulus interval.
Corticospinal neuroplasticity.
Corticospinal neuroplasticity was assessed based on the TA MEP recruitment curves. For each subject, the TA MEP recruitment curve was assembled in ascending order from stimulation intensities corresponding to 0.5 TA MEP resting threshold until maximum amplitudes were obtained. At least five MEPs at 0.1 Hz were recorded at different stimulation intensities. The MEP recruitment curves were assembled at the exact same intensities for each subject, before and after transspinal-transcortical and transcortical-transspinal PAS.
Spinal neuroplasticity.
Spinal neuroplasticity was assessed by establishing the changes in the following: 1) SOL H-reflex recruitment curve parameters, 2) low frequency-mediated homosynaptic SOL H-reflex depression, and 3) SOL H-reflex postactivation depression upon paired stimulation pulses at a constant stimulation frequency (0.2 Hz). SOL H-reflex recruitment curves and H-reflex depression were recorded randomly within and across subjects. For the SOL M-wave and H-reflex recruitment curve, the posterior tibial nerve was stimulated at 0.2 Hz at the popliteal fossa via a customized constant current stimulator, and at least 120 responses were recorded at varying stimulation intensities and saved by the LabVIEW Script. To evaluate SOL H-reflex postactivation depression, the SOL Mmax was evoked (DS7A; Digitimer), and its amplitude was used to determine the intensity required to elicit SOL H-reflexes on the ascending part of the recruitment curve, ranging from 20% to 30% of the Mmax. At this intensity, 20 H-reflexes were recorded at 0.2, 0.33, and 1 Hz stimulation frequencies, as well as upon paired stimulation pulses at 0.2 Hz with interstimulus intervals of 50 and 100 ms.
Data Analysis and Statistics
TA MEPs, SOL M-waves, and SOL H-reflexes were measured as the area of the full wave-rectified EMG signal (Spike2; CED), whereas the SOL M-waves and H-reflexes from the recruitment curves were measured as peak-to-peak amplitude by customized LabVIEW software. The TA MEP latency was measured based on the cumulative sum technique on the rectified waveform average (Ellaway 1978).
The TA MEPs evoked upon paired TMS pulses at different interstimulus intervals before and after PAS were measured and normalized to the mean control MEP recorded before PAS for each subject. The mean MEP amplitude from each subject was grouped based on time of testing and PAS protocol. The Shapiro-Wilk test was performed to test data for normal distribution. A repeated-measures ANOVA (rmANOVA) was performed to determine the effect of time (before vs. after), interstimulus interval of paired TMS pulses, and PAS protocol on the TA MEPs recorded in response to paired TMS pulses. Holm-Sidak t-tests for multiple comparisons were used to test for significant interactions among these factors. This analysis was also performed on raw values of unconditioned and conditioned TA MEPs. The control raw TA MEP values were also compared with a paired t-test before and after each PAS protocol.
A Boltzmann sigmoid function (Eq. 1; SigmaPlot 11; Systat Software, San Jose, CA) was fitted to TA MEPs recorded at different stimulation intensities (recruitment curve) plotted against the non-normalized (actual) stimulation intensities for each subject. The MEP slope and the stimuli corresponding to MEP threshold, 50% maximal MEP (50% MEPmax), and MEPmax were estimated based on Eqs. 2–4, respectively. These parameters were grouped from each subject based on time of testing and PAS protocol. rmANOVA was performed to determine the effect of time and PAS protocol on each predicted parameter. Subsequently, TMS intensities were normalized to the homonymous-predicted stimulation intensity corresponding to 50% MEPmax before and after PAS. This was done for each subject separately so that MEP amplitudes at different stimulation intensities could be grouped across subjects. The average normalized MEP size was calculated in increments of 0.05 multiples of 50% MEPmax stimulation intensities for each subject and across subjects.
| (1) |
| (2) |
| (3) |
| (4) |
The SOL peak-to-peak M-wave amplitudes from all points of the recruitment curve were normalized to the homonymous Mmax for each subject. A Boltzmann sigmoid function (Eq. 1) was fitted to the normalized M-waves plotted against the non-normalized stimulation intensities (Carroll et al. 2001; Devanne et al. 1997). The SOL M-wave slope and the stimuli corresponding to M-wave threshold, 50% Mmax, and Mmax were estimated based on Eqs. 2–4, respectively. These parameters were grouped from each subject based on time of testing and PAS protocol. Paired t-tests were performed to determine changes in each parameter after PAS. rmANOVA was performed to determine the effect of time and PAS protocol on each predicted parameter for the M-wave. The same analysis was also conducted for the SOL H-reflexes normalized to the homonymous Mmax and plotted against the stimulation intensities, ranging from below H-reflex threshold to maximal reflex amplitudes. To group the SOL M-wave and H-reflex recruitment curves across subjects, the predicted stimulation intensity at 50% Mmax before and after PAS was used to normalize the stimulation intensities and present them in multiples of MT. The average normalized SOL M-wave and H-reflex amplitudes were calculated in increments of 0.05 multiples of 50% Mmax stimulation intensities, first for each subject and then across subjects.
The SOL H-reflexes, recorded at 0.2, 0.33, and 1 Hz, were normalized to the homonymous Mmax. H-reflex postactivation depression upon paired pulses at 100 and 50 ms were measured as the second SOL H-reflex amplitude normalized to the mean amplitude of the first H-reflex. Paired t-tests were performed to assess changes in SOL H-reflex amplitudes after PAS for each protocol. rmANOVA was performed to determine the effect of time of testing (before vs. after) and PAS protocol on the SOL H-reflex amplitude. t-Tests and two- and three-way rmANOVAs were performed as needed. In all tests, statistical significance was assumed when P < 0.05. Data are presented as means ± SE.
RESULTS
Transspinal and Transcortical PAS-Induced Neurophysiological Changes in Cortical Circuits
Short-latency intracortical inhibition and medium-latency intracortical facilitation, established via paired TMS pulses to the left M1, were assessed before and after each PAS protocol to characterize immediate associative-induced changes in cortical networks. Nonrectified waveform averages of conditioned TA MEPs shown in Fig. 2A depict decreased short-latency intracortical inhibition and potentiation of intracortical facilitation after transspinal-transcortical PAS in both subjects. There was a significant effect of time [F(1) = 9.68, P = 0.002] and interstimulus interval [F(6) = 7.69, P < 0.001] on conditioned TA MEP amplitudes, but a significant interaction between time and interstimulus intervals was not found [F(6) = 0.33, P = 0.92]. The conditioned TA MEPs were significantly different before and after PAS at interstimulus intervals of 2, 3, 4, 10, and 15 ms (t = 3.11, P = 0.002; Fig. 2B). The control TA MEP sizes before and after transspinal-transcortical PAS were not statistically significantly different (t = −1.2, degrees of freedom = 22, P = 0.24; Fig. 2C).
Fig. 2.

Intracortical measures before and after transspinal-transcortical PAS. A: nonrectified waveform averages of conditioned tibialis anterior motor-evoked potentials (TA MEPs) by subthreshold transcranial magnetic stimulation (TMS) from 2 subjects, before (gray lines) and after (red lines) transspinal-transcortical PAS. B: overall amplitude of TA MEPs conditioned by subthreshold TMS from all subjects. C: mean raw amplitude of control TA MEPs recorded before and after PAS. auc, area under curve. Error bars indicate SE; *P < 0.05.
Nonrectified waveform averages of conditioned TA MEPs, shown in Fig. 3A, depict no significant effects of transcortical-transspinal PAS on cortical inhibition and cortical facilitation for both subjects. There was an overall significant effect of time [F(1) = 7.27, P = 0.008] and interstimulus interval [F(6) = 8.18, P < 0.001] on conditioned TA MEPs, whereas a significant interaction between time and interstimulus intervals was not found [F(6) = 0.37, P = 0.89] for transcortical-transspinal PAS (n = 14; Fig. 3B). However, Holm-Sidak pairwise multiple comparisons for time at each interstimulus interval showed no significant effects (2 ms: t = 0.55, P = 0.5; 3 ms: t = 0.39, P = 0.69; 4 ms: t = 0.28, P = 0.77; 10 ms: t = 1.23, P = 0.21; 15 ms: t = 1.85, P = 0.06; 30 ms at 1.2 MEPth: t = 1.39, P = 0.16; and 30 ms at 1.4 MEPth: t = 1.39, P = 0.16). The control TA MEP sizes recorded before and after transcortical-transspinal PAS were not significantly different (Wilcoxon signed-rank test, z = 1.53, P = 0.135; Fig. 3C).
Fig. 3.

Intracortical measures before and after transcortical-transspinal PAS. A: nonrectified waveform averages of conditioned tibialis anterior motor-evoked potentials (TA MEPs) by subthreshold transcranial magnetic stimulation (TMS) from 2 subjects before (gray lines) and after (red lines) transcortical-transspinal PAS. B: overall amplitude of TA MEPs conditioned by subthreshold TMS from all subjects. C: mean raw amplitude of control TA MEPs recorded before and after PAS. Error bars indicate SE.
Three-way rmANOVA, along with Holm-Sidak pairwise multiple comparisons, showed a significant effect of PAS protocol for all interstimulus intervals (2 ms: t = 3.03, P = 0.003; 3 ms: t = 0.38, P < 0.001; 4 ms: t = 4.2, P < 0.001; 10 ms: t = 4.1, P < 0.001; 15 ms: t = 2.89, P = 0.004; 30 ms at 1.2 MEPth: t = 3.35, P < 0.001; and 30 ms at 1.4 MEPth: t = 1.65, P = 0.099). This was also evident when three-way rmANOVA was conducted for the raw conditioned TA MEPs, during which an overall, significant effect of time [F(1) = 6.55, P = 0.011] and interstimulus interval [F(7) = 13.19, P < 0.001] was found; however, the effect of time and its interactions with interstimulus intervals was not significant [F(7) = 0.15, P = 0.99]. These findings indicate that intracortical inhibition and intracortical facilitation changed after transspinal-transcortical PAS but not after transcortical-transspinal PAS.
Transspinal and Transcortical PAS-Induced Neurophysiological Changes in Corticospinal Circuits
The latency of the TA MEPs recorded at rest did not change in the transspinal-transcortical PAS protocol (before: 30.74 ± 0.53 ms, after: 30.76 ± 0.49 ms, t = −0.08, P = 0.93) or in the transcortical-transspinal PAS protocol (before: 31.33 ± 0.36 ms, after: 31.2 ± 0.33 ms, t = 0.46, P = 0.64). The normalized TA MEP amplitudes plotted against multiples of 50% MEPmax stimulation intensities from all subjects in both protocols are shown in Fig. 4. Two-way rmANOVA showed an overall significant effect of time [F(1) = 7.53, P = 0.007] and normalized stimulation intensities [F(15) = 14.61, P < 0.001] on the actual MEP sizes in the transspinal-transcortical PAS protocol (Fig. 4A). The MEP size was increased from 0.9 to 1.2 50% MEPmax (all P < 0.05; Fig. 4A). The predicted stimulus corresponding to MEP threshold was decreased after transspinal-transcortical PAS (P = 0.01), but there were no statistically significant effects of time on the predicted MEPmax amplitude, MEP slope, or stimuli corresponding to 50% MEPmax and MEPmax (Table 1).
Fig. 4.
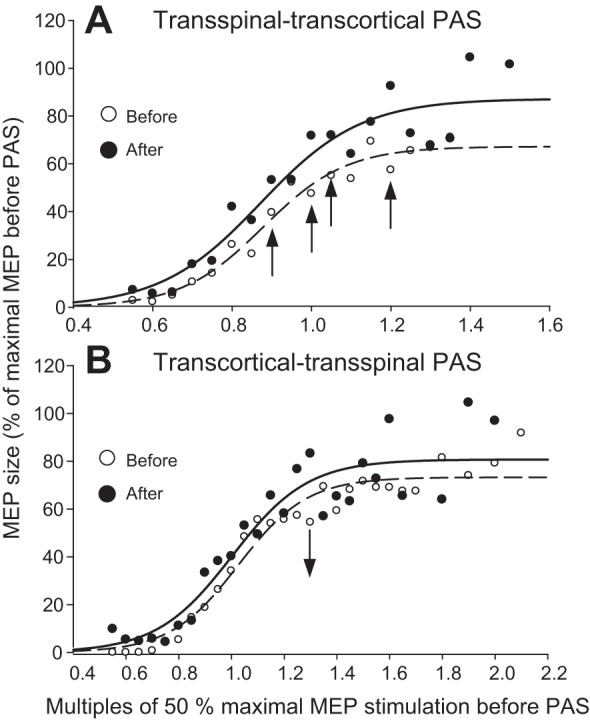
Corticospinal excitability before and after PAS. A and B: tibialis anterior motor-evoked potential (TA MEP) recruitment curves from all subjects before (open circles) and after (solid circles) transspinal-transcortical and transcortical-transspinal PAS, respectively. The pool data are normalized to the maximal MEP (MEPmax) size and plotted in multiples of stimulation intensities corresponding to 50% MEPmax; a sigmoid fit to the data is also shown. Analysis showed a significant effect of time for the transspinal-transcortical PAS with increased MEP sizes from 0.9 to 1.2 50% MEPmax and decreased MEP sizes at 1.3 50% MEPmax for the transcortical-transspinal PAS. *P < 0.05 is indicated as arrows.
Table 1.
TA MEP sigmoid function parameters
| MEPmax, mV | m | Slope | 50% MEPmax Stimulus | MEPth Stimulus | MEPmax Stimulus | |
|---|---|---|---|---|---|---|
| Transspinal-transcortical PAS | ||||||
| Before | 14.49 ± 3.19 | 0.14 ± 0.02 | 17.16 ± 1.76 | 66.60 ± 2.57 | 51.03 ± 1.21 | 85.36 ± 3.83 |
| After | 14.81 ± 3.16 | 0.14 ± 0.02 | 18.34 ± 2.42 | 63.66 ± 1.90 | 45.32 ± 1.85 | 82.00 ± 3.93 |
| P | 0.48 | 0.46 | 0.18 | 0.35 | 0.01 | 0.27 |
| Transcortical-transspinal PAS | ||||||
| Before | 12.30 ± 4.19 | 0.25 ± 0.06 | 11.31 ± 1.77 | 59.19 ± 2.88 | 47.88 ± 2.83 | 70.50 ± 3.86 |
| After | 17.72 ± 4.54 | 0.24 ± 0.06 | 17.56 ± 4.08 | 67.94 ± 6.60 | 50.38 ± 5.49 | 85.51 ± 9.50 |
| P | 0.19 | 0.44 | 0.08 | 0.11 | 0.34 | 0.07 |
Results of predicted parameters from the sigmoid input–output relation of non-normalized TA MEPs and stimulation intensities conducted for each subject separately and grouped based on time and paired-associative stimulation (PAS) protocol. m, slope parameter of the function. Means ± SE. P values shown are for before and after PAS comparisons.
Two-way rmANOVA showed that the actual normalized MEP sizes were only decreased after transcortical-transspinal PAS at 1.3 50% MEPmax [F(1) = 4.51, P = 0.035; Fig. 4B]. Nonsignificant effects of time were found on the predicted MEPmax and MEP slope and on stimuli corresponding to MEP threshold, 50% MEPmax, and MEPmax (for all P > 0.05; Table 1). Two-way rmANOVA showed significant effects of PAS protocol for the slope parameter of the function (m) [F(1) = 5.28, P = 0.02] and nonsignificant effects of PAS protocol for predicted MEPmax amplitude [F(1) = 0.0007, P = 0.97], MEP slope [F(1) = 1.42, P = 0.24], stimuli at MEP threshold [F(1) = 0.07, P = 0.78], stimuli at 50% MEPmax [F(1) = 0.14, P = 0.7], and stimuli at MEPmax [F(1) = 0.87, P = 0.35]. These findings indicate that transspinal-transcortical PAS increased membrane excitability of corticospinal neurons, as represented by decreased MEP thresholds and increased MEP sizes, whereas transcortical-transspinal PAS had marginal effects.
Transspinal and Transcortical PAS-Induced Neurophysiological Changes in Spinal Circuits
The SOL M-wave and H-reflex recruitment input-output curves from all subjects and both PAS protocols are shown in Fig. 5, A and B and C and D, respectively. The associated sigmoid fits for H-reflexes from the ascending part of the recruitment input-output curve are shown in Fig. 5, E and F, respectively, whereas the SOL H-reflexes recorded after PAS are normalized to stimulation intensities corresponding to 50% Mmax before and after PAS.
Fig. 5.

Spinal excitability before and after PAS. A–D: soleus M-wave and H-reflex recruitment curves from all subjects before (open circles) and after (solid circles) transspinal-transcortical and transcortical-transspinal PAS. The pool data illustrated in A–D are normalized to the homonymous maximal M-wave (Mmax) and are plotted in multiples of stimulation intensities corresponding to 50% of the Mmax. E and F: the soleus H-reflex recruitment curves were assembled from stimulation intensities in which H-reflexes were absent until they reached maximal amplitudes, with the sigmoid function fitted before (open circles) and after (solid circles) transspinal-transcortical and transcortical-transspinal PAS, indicated with H-reflexes plotted against stimulation intensities and grouped based on motor threshold (MT) observed both before and after PAS.
For the transspinal-transcortical PAS protocol, two-way rmANOVA showed a nonsignificant effect of time on the actual H-reflex sizes (from 0.35 to 0.9 multiples of MT) when H-reflexes after PAS were grouped based on stimulation intensities normalized to the MT before [F(1) = 0.02, P = 0.86] or after [F(1) = 0.38, P = 0.53] PAS (Fig. 5C). The same analysis for the M-waves showed a significant effect of time only when the M-waves after PAS were grouped based on stimulation intensities normalized to the MT before [F(1) = 15.63, P < 0.001] and not to the MT after [F(1) = 0.45, P = 0.5] PAS. Based on the sigmoid function results (H-reflexes or M-waves normalized to the homonymous Mmax plotted against the actual stimulation intensities), the maximal H-reflex (Hmax) amplitude (t = 2.08, P = 0.03) and stimulus corresponding to 50% Hmax (z = −2.1, P = 0.02) were decreased, whereas the H-reflex slope, m function of the sigmoid fit, and stimuli at threshold and at maximal intensities remained unaltered (for all P > 0.05; Table 2). Last, the m function of the sigmoid fit, M-wave slope, and stimuli, corresponding to M-wave threshold, 50% Mmax, and Mmax, was decreased (Wilcoxon signed-rank test; Table 2).
Table 2.
Soleus M-wave and H-reflex sigmoid function parameters: transspinal-transcortical PAS
| M-Wave, % Mmax | m | M-Slope | 50% Mmax Stimulus | Mth Stimulus | Mmax Stimulus | |
|---|---|---|---|---|---|---|
| Before | 96.91 ± 2.91 | 2.07 ± 0.65 | 1.85 ± 0.37 | 15.58 ± 1.63 | 13.73 ± 1.93 | 17.42 ± 1.36 |
| After | 96.88 ± 4.5 | 1.13 ± 0.25 | 2.54 ± 0.4 | 12.68 ± 0.89 | 10.14 ± 1.22 | 15.22 ± 0.63 |
| P | 0.19 | 0.01 | 0.007 | 0.005 | 0.001 | 0.03 |
| H-Reflex, % Mmax | m | H-Slope | 50% Hmax Stimulus | Hth Stimulus | Hmax Stimulus | |
|---|---|---|---|---|---|---|
| Before | 35.53 ± 5.74 | 0.91 ± 0.20 | 3.78 ± 0.84 | 11.55 ± 1.53 | 7.77 ± 1.79 | 15.33 ± 1.69 |
| After | 30.89 ± 6.42 | 0.86 ± 0.15 | 3.23 ± 0.52 | 9.79 ± 1.08 | 6.56 ± 1.25 | 13.01 ± 1.14 |
| P | 0.03 | 0.74 | 0.79 | 0.027 | 0.38 | 0.12 |
Results of predicted parameters from the sigmoid input–output relation of soleus M-waves and H-reflexes normalized to the homonymous maximal M-wave (Mmax) size and actual values of stimulation intensities recorded at all points of the recruitment curve for the M-wave and from baseline to maximal amplitudes for the H-reflex (Hmax). This was performed separately for each subject, and averages were estimated and grouped based on time. m, slope parameter of the function. Means ± SE. P values shown are for before and after PAS comparisons.
For the transcortical-transspinal PAS protocol, two-way rmANOVA showed a nonsignificant effect of time on the actual H-reflex sizes (from 0.35 to 0.9 multiples of MT) when H-reflexes recorded after PAS were grouped based on stimulation intensities normalized to the MT before PAS [F(1) = 0.02, P = 0.99] or to the MT after PAS [F(1) = 1.35, P = 0.24; Fig. 5D]. The same analysis for the M-waves showed a significant effect of time only when the M-waves after PAS were grouped based on stimulation intensities normalized to the MT before [F(1,11) = 39.08, P < 0.001] and not to the MT after [F(1,11) = 0.06, P = 0.79] PAS. A significant interaction between stimulation intensities and time was found for both cases [F(11) = 3, P < 0.001]. Based on the sigmoid function results (H-reflexes or M-waves normalized to the homonymous Mmax plotted against the actual stimulation intensities), the predicted stimuli corresponding to 50% Hmax (z = −2.9, P = 0.001) and H-reflex threshold (t = 4.11, P = 0.002) were decreased after PAS (Table 3). The H-reflex slope (t = −1.72, P = 0.11), Hmax amplitude (t = 2.08, P = 0.06), and m function of the sigmoid fit (t = 1, P = 0.33) remained unaltered (Table 3). The stimuli corresponding to M-wave threshold, 50% Mmax, and Mmax were decreased, whereas the M-wave slope and m function of the sigmoid fit remained unaltered (Wilcoxon signed-rank test; Table 3). These findings indicate that both transspinal-transcortical and transcortical-transspinal PAS decreased the excitation thresholds of SOL Ia afferents and motor axons.
Table 3.
Soleus M-wave and H-reflex sigmoid function parameters: transcortical-transspinal PAS
| M-wave, % Mmax | m | M-Slope | 50% Mmax Stimulus | Mth Stimulus | Mmax Stimulus | |
|---|---|---|---|---|---|---|
| Before | 97.44 ± 1.82 | 1.26 ± 0.21 | 2.17 ± 0.38 | 15.31 ± 1.89 | 13.33 ± 2.22 | 17.48 ± 1.59 |
| After | 96.57 ± 0.63 | 1.06 ± 0.21 | 3.16 ± 0.74 | 12.51 ± 1.49 | 9.35 ± 1.90 | 15.67 ± 1.38 |
| P | 0.57 | 0.52 | 0.46 | 0.001 | 0.005 | 0.001 |
| H-reflex, % Mmax | m | H-Slope | 50% Hmax Stimulus | Hth Stimulus | Hmax Stimulus | |
|---|---|---|---|---|---|---|
| Before | 47.93 ± 4.94 | 0.94 ± 0.17 | 3.16 ± 0.56 | 10.75 ± 1.52 | 7.59 ± 1.92 | 13.92 ± 1.25 |
| After | 37.76 ± 5.84 | 0.82 ± 0.21 | 4.12 ± 0.86 | 7.67 ± 0.83 | 3.55 ± 1.59 | 11.80 ± 0.59 |
| P | 0.06 | 0.33 | 0.11 | 0.001 | 0.002 | 0.11 |
Results of predicted parameters from the sigmoid input–output relation of soleus M-waves and H-reflexes normalized to the homonymous maximal M-wave (Mmax) size and actual values of stimulation intensities recorded at all points of the recruitment curve for the M-wave and from baseline to maximal amplitudes for the H-reflex (Hmax). This was performed separately for each subject, and averages were estimated and grouped based on time. m, slope parameter of the function. Means ± SE. P values shown are for before and after PAS comparisons.
Transcortical-transspinal PAS did not affect the SOL H-reflex homosynaptic depression (evoked at different stimulation frequencies; for all P > 0.05) but reduced the SOL H-reflex postactivation depression following paired pulses at interstimulus intervals of 100 ms (t = −2.88, P = 0.045) and 50 ms (t=−2.5, P = 0.02) at a constant stimulation frequency of 0.2 Hz (Fig. 6A). Transspinal-transcortical PAS reduced the SOL H-reflex homosynaptic depression at 0.2 Hz (t = −2.66, P = 0.032), 0.33 Hz (t = −2.82, P = 0.037), and 0.1 Hz (t = −2.25, P = 0.049). Furthermore, the SOL H-reflex postactivation depression, following paired pulses at interstimulus intervals of 100 ms (t = −1.17, P = 0.32) and 50 ms (t=−1.4, P = 0.18) at a constant stimulation frequency of 0.2 Hz, remained unaltered (Fig. 6B). Three-way rmANOVA showed a significant effect of stimulation frequency and interstimulus interval of paired pulses [F(4) = 26.36, P < 0.001] and time [F(1) = 13.62, P < 0.001] but not between protocols [F(1) = 1.76, P = 0.18]. These findings indicate that transcortical-transspinal PAS reduced the SOL H-reflex postactivation depression, and transspinal-transcortical PAS reduced the SOL H-reflex homosynaptic depression.
Fig. 6.

Spinal inhibitory measures before and after PAS. A and B: soleus H-reflex sizes as a percentage of the homonymous Mmax from all subjects before (open circles) and after (solid circles) transcortical-transspinal and transspinal-transcortical PAS, recorded at different stimulation frequencies and in response to paired stimulation pulses at interstimulus intervals of 100 and 50 ms at 0.2 Hz. Soleus H-reflexes, recorded at 0.2 Hz before and after PAS at exactly the same stimulation intensities (insets 1 and 2), illustrate that a clear shift in the recruitment order of Ia afferents (inset 3) occurred after both PAS protocols. Error bars represent SE; *P < 0.05.
It should be noted that transcortical-transspinal and transspinal-transcortical PAS substantially altered the SOL H-reflex excitability thresholds (see Fig. 6, A and B). Specifically, at the same stimulation intensity as that used before PAS, the SOL H-reflex after PAS was elicited at different points, i.e., at the derecruitment curve (see Fig. 6B). After PAS, to evoke a SOL H-reflex on the ascending portion of the recruitment curve and an M-wave with amplitude comparable with that before PAS, a substantial reduction in the stimulation intensity was required, consistent with the changes of predicted sigmoid parameters from the M-wave and H-reflex recruitment curve.
DISCUSSION
This study demonstrates that PAS-induced plasticity can be achieved by pairing transspinal and transcortical stimulation. This new paradigm produces both cortical and spinal plasticity with excitability changes in the human brain and spinal cord, dependent on timing interval and functional network interactions between the two associated inputs at a systems level.
Transspinal-Transcortical PAS-Mediated Cortical and Corticospinal Plasticity
Before PAS was delivered, we successfully probed and recorded short-latency MEP inhibition and medium-latency MEP facilitation upon paired TMS pulses (Figs. 2B and 3B), in accordance with previous studies (Di Lazzaro et al. 1998; Kujirai et al. 1993). The use of a subthreshold (∼0.7 MEP resting threshold)-conditioning TMS pulse minimizes direct activation of cortical motoneurons (Ziemann et al. 1996). Consequently, the MEP short-latency inhibition and medium-latency facilitation that we observed here were mediated by interneuronal circuits in the motor cortex (Ziemann et al. 1996). Test TA MEP sizes remained unaltered before and after both PAS protocols (Figs. 2C and 3C), suggesting that the observed changes in cortical interneuronal circuits were not due to differences of test MEP sizes or to the normalization of the conditioned TA MEPs. Short-latency intracortical inhibition is mediated by a low-threshold GABAA receptor-dependent inhibitory pathway (Ilic et al. 2002). The cortical networks mediating intracortical facilitation, however, are more complex (Di Lazzaro et al. 2002). Evidence suggests that cortical facilitation is nonsynaptic, occurs at the initial axon segment of cortical interneurons, involves a high-threshold excitatory pathway, and is mediated by a separate population of interneurons (Di Lazzaro et al. 1998, 2007; Ilic et al. 2002; Kujirai et al. 1993; Ridding et al. 1995; Sanger et al. 2001; Ziemann et al. 1996).
Transspinal-transcortical PAS shifted intracortical inhibition to intracortical facilitation (Fig. 2A). Overall, transspinal-transcortical PAS decreased intracortical inhibition and increased medium-latency intracortical facilitation (Fig. 2B). The decreased intracortical inhibition may be the result of potentiation of facilitatory mechanisms, such as the short-latency intracortical facilitation. These neurophysiological changes are consistent with the decrease in intracortical inhibition and increase in intracortical facilitation following median or radial nerve stimulation (Aimonetti and Nielsen 2001) and with TA MEP amplitude modulation when conditioned by transspinal stimulation at similar intervals (Knikou 2014). Possible sources for the altered behavior of intracortical interneuronal circuits after PAS include changes in the strength of short-latency intracortical facilitation, changes in interactions between I-waves, and changes in activation of cortical circuits that preferentially elicit I-3 waves (Di Lazzaro et al. 1999; Ferbert et al. 1992; Hanajima et al. 2002; Sakai et al. 1997).
The increase in MEP sizes at intensities ranging from 0.8 to 1.2 multiples of 50% MEPmax coincided with decreases in MEP threshold stimulation intensities (Fig. 4A and Table 1) and is consistent with median nerve-TMS PAS at an interstimulus interval of 15 ms in monkeys (Amaya et al. 2010). The increased TA MEP may be the result of reduced intracortical inhibition after transspinal-transcortical PAS, whereas changes in MT are considered correlates of intrinsic neuronal plasticity (Delvendahl et al. 2012). Transspinal stimulation could have potentially reinforced the TMS-induced descending volleys to corticospinal neurons so that a single TMS pulse induced a larger MEP. Additionally, transspinal stimulation may have directly affected the cortical interneurons mediating cortical inhibition and facilitation. Transspinal stimulation excites fibers of the spinal cord at their entry to or exit from the spinal canal (Ladenbauer et al. 2010), generating action potentials that travel anti- and orthodromically along the posterior and anterior root fibers of both limbs. Transspinal stimulation is associated with orthodromic excitation of motor axons and antidromic activation of muscle spindle afferents and all of their terminal branches leading to transynaptic excitation of motoneurons and interneurons near and far from the stimulation site (Coburn 1985; Gaunt et al. 2006; Hunter and Ashby 1994; Knikou 2013; Ladenbauer et al. 2010; Maertens de Noordhout et al. 1988). Stimulation of muscle afferents that terminate in the dorsal horn activates second-order neurons in the ipsilateral dorsal spinocerebellar tract with bilateral projections to the hemispheres of the brain (Spanne and Jörntell 2013). Hence, transspinal stimulation delivered before TMS has the ability to affect cortical neuronal circuits through the dorsal spinocerebellar tract. Cortical interneurons producing slow, inhibitory or excitatory, postsynaptic potentials are mainly distributed in layer II, where the main sensory input to the motor cortex arrives through thalamocortical projections (Constantinople and Bruno 2013). In conclusion, transspinal stimulation could have activated the spinocerebellar tract, a concept further supported by the altered conditioning effects of cutaneous afferents on TA MEPs after transspinal stimulation (Knikou et al. 2015; Mackey et al. 2016). Mathematical modeling of epidural spinal-cord stimulation demonstrated that dorsal column fibers are insusceptible to excitation up to 10 V (Rattay et al. 2000), requiring triple the stimulation intensity from that needed for dorsal and ventral root fibers (Danner et al. 2011). Therefore, dorsal column fibers, along with their collaterals, may not have been excited at low-stimulation intensities (Danner et al. 2014) in this study.
Transspinal-Transcortical PAS-Mediated Spinal Plasticity
Transcortical-transspinal and transspinal-transcortical PAS affected M-wave amplitudes when the M-waves recorded after PAS were normalized to MT before and not to MT after PAS. More importantly, both PAS protocols decreased the stimulation intensities needed to evoke M-waves at threshold, intermediate, and maximal amplitudes (Tables 2 and 3), suggesting that both PAS protocols affect the excitation thresholds of motor axons. The decreased stimulus currents needed to evoke M-waves at different sites of the M-wave recruitment curve suggest that both PAS protocols and especially transspinal stimulation affected the membrane potentials of motor axons (Burke et al. 2001). Median nerve stimulation at 8 Hz for 10 min decreases motor axon excitability with concomitant increases in motor axon thresholds, resulting from changes in the activity of the Na+-K+ electrogenic pump (Kiernan et al. 2004). In contrast, depolarizing currents delivered to human myelinated axons increase motor axon excitability and decrease MT secondary to changes in persistent and transient Na+ currents, followed by altered gating of slow K+ currents (Burke et al. 2009). This evidence suggests that our paradigm promoted depolarization of motor axons through changes in nodal and internodal ion channels. A decrease in excitation threshold, however, was also observed for group I afferents (SOL H-reflex). The stimulation intensities needed to evoke H-reflexes at threshold, intermediate, and maximum amplitudes were decreased (Tables 2 and 3). This finding suggests that our paradigm induced selective changes in the ability of Ia afferents to depolarize SOL motoneurons, altered the excitability of Ia afferents, altered the number of active motoneurons, or altered the aggregate of spinal motoneurons at the subliminal fringe (Capaday and Stein 1987; Knikou 2008; Pierrot-Deseilligny and Burke 2005). Based on the fact that the same stimulation intensity after PAS evoked H-reflexes, in which the amplitude corresponded to the derecruitment curve (see Fig. 6, A and B), we can suggest that PAS altered the excitability of group Ia afferents. This is consistent with the changes in the amplitude of the SOL H-reflex, as represented by the recruitment curve, and the changes in threshold electrotonus of sensory afferents following polarizing currents (Burke et al. 2001).
One may contend that the SOL H-reflex excitability changes after PAS were largely due to the altered M-wave recruitment. However, this cannot be substantiated, because sigmoid function results were obtained from each subject's H-reflex recruitment curves with stimulation intensities not normalized to the MT before or after PAS (Tables 2 and 3). Potential sources of H-reflex excitability changes after PAS include modifications in the excitability profile of the motoneuron pool and the properties of group Ia afferents.
Transcortical-transspinal PAS decreased the SOL H-reflex postactivation depression but not the low frequency-mediated homosynaptic depression (Fig. 6A), whereas transspinal-transcortical PAS had the exact opposite effect (Fig. 6B). Since TMS at 0.9 MEP threshold intensities decreases presynaptic inhibition of Ia afferents (Meunier and Pierrot-Deseilligny 1998), descending control may have been involved in the decreased homosynaptic or postsynaptic depression in response to PAS. However, the diametrically opposite effect of PAS protocols raises the question as to whether these two types of reflex depression are mediated by the same physiological neuronal mechanisms. The decreased size of the monosynaptic reflex during repetitive stimulation at low frequencies, both in the cat and human (Crone and Nielsen 1989; Eccles and Rall 1951), has been attributed to changes in the probability or amount of transmitter release by the previously activated Ia afferents occurring at the Ia/motoneuron synapse and thus is presynaptic in origin (Crone and Nielsen 1989; Hultborn et al. 1996). This frequency-dependent H-reflex depression is confined to occur at the same Ia/motoneuron synapses, lasts more than any other known spinal inhibitory process (up to 10 s), is strongly related to the frequency of the afferent input and magnitude of background contraction, and preferentially gates the reflex effects mediated via the γ loop (Burke 2016; Clair et al. 2011; Lamy et al. 2005; Pierrot-Deseilligny and Burke 2005). The decreased SOL H-reflex size in response to paired stimulation pulses delivered at a constant stimulation frequency or postactivation depression (Fig. 6) may be due to additional mechanisms that also involve activity-dependent hyperpolarization of Ia afferents. This is supported by the finding that the absent or impaired homosynaptic depression in people with motor-complete and -incomplete spinal-cord injury (Knikou and Mummidisetty 2014) coincides with present postactivation depression upon paired pulses at 50, 100, and 300 ms (M. Knikou, personal observations). Furthermore, the frequency-related H-reflex depression depends on the type of group I afferents and/or the target neurons (Lamy et al. 2005). The nonuniform shape of TEPs across muscles (Einhorn et al. 2013; Knikou 2014; Knikou et al. 2015) suggests that different groups of afferents may be engaged in the manifestation of TEPs.
Repetitive transcortical-transspinal PAS may have altered the recruitment pattern of SOL motor units, a phenomenon associated with SOL H-reflex postactivation depression (Kipp et al. 2012). However, we should also consider the possibility that postsynaptic inhibition, exerted from synergistic Ib afferents and antagonistic Ia afferents, may adapt differently to paired and frequency-dependent afferent discharges. We therefore suggest that the effects of medial gastrocnemius Ib afferents and antagonistic Ia afferents on SOL H-reflex postactivation depression warrant investigation, in a similar manner to that reported for the homosynaptic depression (Lamy et al. 2005). Although postactivation reflex depression is commonly used as a synonym to the homosynaptic frequency-mediated reflex depression in the literature, more research studies are needed to characterize the underlying physiological mechanisms of these two types of spinal reflex inhibition. Despite the limited amount of evidence, it is apparent that transcortical-transspinal PAS and transspinal-transcortical PAS have distinct effects on cortical and spinal inhibitory mechanisms.
Limitations of the Study
PAS-induced plasticity depends on frequency and number of spike trains (Froemke and Dan 2002; Froemke et al. 2006). However, we did not use medium or high frequencies or pulse trains to deliver PAS between M1 and the spinal cord in our experiments, as it is not feasible to pair TMS at medium or high frequencies in humans. We chose a single, 1-ms pulse duration at 0.1 Hz for both PAS protocols based on previous human and animal studies (Hunanyan et al. 2012; Stefan et al. 2000), and whereas this may have reduced the strength of plasticity, it cannot account for the neurophysiological differences we observed between the two PAS protocols. PAS was delivered for a prolonged time (40 min), but we did not perform the neurophysiological tests at different times after PAS termination, thus limiting our knowledge on the sustainability of neuroplasticity. Therefore, further studies that will concentrate on examining the time course of the effects are needed. These limitations are currently under investigation in our laboratory.
Conclusion
We show that the pairing of transspinal and transcortical stimulation produces both cortical and spinal PAS-mediated plasticity, but excitability changes in the human brain and spinal cord are based on the timing-interval and functional-network interactions between the two associated inputs. This new PAS paradigm has a significant physiological impact, because it can be used to alter concomitantly excitability of cortical circuits, corticospinal neurons, reflex-mediated postactivation depression, and excitation thresholds of motor axons and Ia afferents in humans.
GRANTS
Funding for this work was provided by the Craig H. Neilsen Foundation (Grant No. 339705; to M. Knikou).
DISCLOSURES
No conflicts of interest, financial or otherwise, are declared by the authors.
AUTHOR CONTRIBUTIONS
M.K. conception and design of research; L.D., M.M.I., D.S., and M.K. performed experiments; M.K. analyzed data; M.K. interpreted results of experiments; M.K. prepared figures; M.K. drafted manuscript L.D. and M.K. edited and revised manuscript; L.D., M.M.I., D.S., and M.K. approved final version of manuscript.
ACKNOWLEDGMENTS
The authors thank the subjects who participated in multiple experiments and Zaghloul Ahmed for his valuable comments and suggestions on previous versions of the manuscript.
REFERENCES
- Aimonetti JM, Nielsen JB. Changes in intracortical excitability induced by stimulation of wrist afferents in man. J Physiol 534: 891–902, 2001. [DOI] [PMC free article] [PubMed] [Google Scholar]
- Amaya F, Paulus W, Treue S, Liebetanz D. Transcranial magnetic stimulation and PAS induced cortical neuroplasticity in the awake rhesus monkey. Clin Neurophysiol 121: 2143–2151, 2010. [DOI] [PubMed] [Google Scholar]
- Arai N, Müller-Dahlhaus F, Murakami T, Bliem B, Lu MK, Ugawa Y, Ziemann U. State-dependent and timing-dependent bidirectional associative plasticity in the human SMA-M1 network. J Neurosci 31: 15376–15383, 2011. [DOI] [PMC free article] [PubMed] [Google Scholar]
- Buch ER, Johnen VM, Nelissen N, O'Shea J, Rushworth MF. Noninvasive associative plasticity induction in a corticocortical pathway of the human brain. J Neurosci 31: 17669–17679, 2011. [DOI] [PMC free article] [PubMed] [Google Scholar]
- Bunday KL, Perez MA. Motor recovery after spinal cord injury enhanced by strengthening corticospinal synaptic transmission. Curr Biol 22: 2355–2361, 2012. [DOI] [PMC free article] [PubMed] [Google Scholar]
- Buonomano DV, Merzenich MM. Cortical plasticity: from synapses to maps. Annu Rev Neurosci 21: 149–186, 1998. [DOI] [PubMed] [Google Scholar]
- Burke D. Clinical uses of H reflexes of upper and lower limbs. Clin Neurophysiol Pract 1: 9–17, 2016. [DOI] [PMC free article] [PubMed] [Google Scholar]
- Burke D, Howells J, Trevillion L, McNulty PA, Jankelowitz SK, Kiernan MC. Threshold behaviour of human axons explored using subthreshold perturbations to membrane potential. J Physiol 587: 491–504, 2009. [DOI] [PMC free article] [PubMed] [Google Scholar]
- Burke D, Kiernan MC, Bostock H. Excitability of human axons. Clin Neurophysiol 112: 1575–1585, 2001. [DOI] [PubMed] [Google Scholar]
- Capaday C, Stein RB. A method for simulating the reflex output of a motoneuron pool. J Neurosci Methods 21: 91–104, 1987. [DOI] [PubMed] [Google Scholar]
- Carroll TJ, Riek S, Carson RG. Reliability of the input-output properties of the cortico-spinal pathway obtained from transcranial magnetic and electrical stimulation. J Neurosci Methods 112: 193–202, 2001. [DOI] [PubMed] [Google Scholar]
- Chao CC, Karabanov AN, Paine R, Carolina de Campos A, Kukke SN, Wu T, Wang H, Hallett M. Induction of motor associative plasticity in the posterior parietal cortex-primary motor network. Cereb Cortex 25: 365–373, 2015. [DOI] [PMC free article] [PubMed] [Google Scholar]
- Chen R, Tam A, Butefisch C, Corwell B, Ziemann U, Rothwell JC, Cohen LG. Intracortical inhibition and facilitation in different representations of the human motor cortex. J Neurophysiol 80: 2870–2881, 1998. [DOI] [PubMed] [Google Scholar]
- Clair JM, Anderson-Reid JM, Graham CM, Collins DF. Postactivation depression and recovery of reflex transmission during repetitive electrical stimulation of the human tibial nerve. J Neurophysiol 106: 184–192, 2011. [DOI] [PubMed] [Google Scholar]
- Coburn B. A theoretical study of epidural electrical stimulation of the spinal cord—part II: effects on long myelinated fibers. IEEE Trans Biomed Eng 32: 978–986, 1985. [DOI] [PubMed] [Google Scholar]
- Constantinople CM, Bruno RM. Deep cortical layers are activated directly by thalamus. Science 340: 1591–1594, 2013. [DOI] [PMC free article] [PubMed] [Google Scholar]
- Costa P, Deletis V. Cortical activity after stimulation of the corticospinal tract in the spinal cord. Clin Neurophysiol 127: 1726–1733, 2016. [DOI] [PubMed] [Google Scholar]
- Crone C, Nielsen J. Methodological implications of the post activation depression of the soleus H-reflex in man. Exp Brain Res 78: 28–32, 1989. [DOI] [PubMed] [Google Scholar]
- Dan Y, Poo MM. Spike timing-dependent plasticity: from synapse to perception. Physiol Rev 86: 1033–1048, 2006. [DOI] [PubMed] [Google Scholar]
- Danner SM, Hofstoetter US, Krenn M, Mayr W, Rattay F, Minassian K. Potential distribution and nerve fiber responses in transcutaneous lumbosacral spinal cord stimulation. IFMBE Proc 44: 203–208, 2014. [Google Scholar]
- Danner SM, Hofstoetter US, Ladenbauer J, Rattay F, Minassian K. Can the human lumbar posterior columns be stimulated by transcutaneous spinal cord stimulation? A modeling study. Artif Organs 35: 257–262, 2011. [DOI] [PMC free article] [PubMed] [Google Scholar]
- Delvendahl I, Jung NH, Kuhnke NG, Ziemann U, Mall V. Plasticity of motor threshold and motor-evoked potential amplitude—a model of intrinsic and synaptic plasticity in human motor cortex? Brain Stimul 5: 586–593, 2012. [DOI] [PubMed] [Google Scholar]
- Devanne H, Lavoie BA, Capaday C. Input-output properties and gain changes in the human corticospinal pathway. Exp Brain Res 114: 329–338, 1997. [DOI] [PubMed] [Google Scholar]
- Di Lazzaro V, Oliviero A, Mazzone P, Pilato F, Saturno E, Dileone M, Insola A, Tonali PA, Rothwell JC. Short-term reduction of intracortical inhibition in the human motor cortex induced by repetitive transcranial magnetic stimulation. Exp Brain Res 147: 108–113, 2002. [DOI] [PubMed] [Google Scholar]
- Di Lazzaro V, Pilato F, Dileone M, Profice P, Ranieri F, Ricci V, Bria P, Tonali PA, Ziemann U. Segregating two inhibitory circuits in human motor cortex at the level of GABAA receptor subtypes: a TMS study. Clin Neurophysiol 118: 2207–2214, 2007. [DOI] [PubMed] [Google Scholar]
- Di Lazzaro V, Restuccia D, Oliviero A, Profice P, Ferrara L, Insola A, Mazzone P, Tonali P, Rothwell JC. Magnetic transcranial stimulation at intensities below active motor threshold activates intracortical inhibitory circuits. Exp Brain Res 119: 265–268, 1998. [DOI] [PubMed] [Google Scholar]
- Di Lazzaro V, Rothwell JC, Oliviero A, Profice P, Insola A, Mazzone P, Tonali P. Intracortical origin of the short latency facilitation produced by pairs of threshold magnetic stimuli applied to human motor cortex. Exp Brain Res 129: 494–499, 1999. [DOI] [PubMed] [Google Scholar]
- Dixon L, Santora D, Ibrahim MM, Murray LM, Knikou M. Paired transspinal and transcortical stimulation: a novel method for targeted cortical and spinal neuroplasticity. 26th Annual Meeting of the Society for the Neural Control of Movement, Montego Bay, Jamaica, 2016, abstract 102296, poster 4-F-39. [Google Scholar]
- Eccles JC, Rall W. Effects induced in a monosynaptic reflex path by its activation. J Neurophysiol 14: 353–376, 1951. [DOI] [PubMed] [Google Scholar]
- Einhorn J, Li A, Hazan R, Knikou M. Cervicothoracic multisegmental transpinal evoked potentials in humans. PLoS One 10: e76940, 2013. [DOI] [PMC free article] [PubMed] [Google Scholar]
- Ellaway PH. Cumulative sum technique and its application to the analysis of peristimulus time histograms. Electroencephalogr Clin Neurophysiol 45: 302–304, 1978. [DOI] [PubMed] [Google Scholar]
- Ferbert A, Priori A, Rothwell JC, Day BL, Colebatch JG, Marsden CD. Interhemispheric inhibition of the human motor cortex. J Physiol 453: 525–546, 1992. [DOI] [PMC free article] [PubMed] [Google Scholar]
- Froemke RC, Dan Y. Spike-timing-dependent synaptic modification induced by natural spike trains. Nature 416: 433–438, 2002. [DOI] [PubMed] [Google Scholar]
- Froemke RC, Tsay IA, Raad M, Long JD, Dan Y. Contribution of individual spikes in burst-induced long-term synaptic modification. J Neurophysiol 95: 1620–1629, 2006. [DOI] [PubMed] [Google Scholar]
- Gandevia S, Burke D, McKeon B. The relationship between the size of a muscle afferent volley and the cerebral potential it produces. J Neurol Neurosurg Psychiatry 45: 705–710, 1982. [DOI] [PMC free article] [PubMed] [Google Scholar]
- Gaunt RA, Prochazka A, Mushahwar VK, Guevremont L, Ellaway PH. Intraspinal microstimulation excites multisegmental sensory afferents at lower stimulus levels than local alpha-motoneuron responses. J Neurophysiol 96: 2995–3005, 2006. [DOI] [PubMed] [Google Scholar]
- Hanajima R, Ugawa Y, Terao Y, Enomoto H, Shiio Y, Mochizuki H, Furubayashi T, Uesugi H, Iwata NK, Kanazawa I. Mechanisms of intracortical I-wave facilitation elicited with paired-pulse magnetic stimulation in humans. J Physiol 538: 253–261, 2002. [DOI] [PMC free article] [PubMed] [Google Scholar]
- Hebb DO. The Organization of Behavior: A Neuropsychological Theory. New York: Wiley, 1949. [Google Scholar]
- Hultborn H, Illert M, Nielsen J, Paul A, Ballegaard M, Wiese H. On the mechanism of the post-activation depression of the H-reflex in human subjects. Exp Brain Res 108: 450–462, 1996. [DOI] [PubMed] [Google Scholar]
- Hunanyan AS, Petrosyan HA, Alessi V, Arvanian VL. Repetitive spinal electromagnetic stimulation opens a window of synaptic plasticity in damaged spinal cord: role of NMDA receptors. J Neurophysiol 107: 3027–3039, 2012. [DOI] [PubMed] [Google Scholar]
- Hunter JP, Ashby P. Segmental effects of epidural spinal cord stimulation in humans. J Physiol 474: 407–419, 1994. [DOI] [PMC free article] [PubMed] [Google Scholar]
- Ilic TV, Meintzschel F, Cleff U, Ruge D, Kessler KR, Ziemann U. Short-interval paired-pulse inhibition and facilitation of human motor cortex: the dimension of stimulus intensity. J Physiol 545: 153–167, 2002. [DOI] [PMC free article] [PubMed] [Google Scholar]
- Kasai T, Hayes KC, Wolfe DL, Allatt RD. Afferent conditioning of motor evoked potentials following transcranial magnetic stimulation of motor cortex in normal subjects. Electroencephalogr Clin Neurophysiol 85: 95–101, 1992. [DOI] [PubMed] [Google Scholar]
- Kiernan MC, Lin CS, Burke D. Differences in activity-dependent hyperpolarization in human sensory and motor axons. J Physiol 558: 341–349, 2004. [DOI] [PMC free article] [PubMed] [Google Scholar]
- Kipp K, Johnson ST, Hoffman MA. Effects of homosynaptic depression on spectral properties of H-reflex recordings. Somatosens Mot Res 29: 38–43, 2012. [DOI] [PubMed] [Google Scholar]
- Knikou M. Neurophysiological characterization of transpinal evoked potentials in human leg muscles. Bioelectromagnetics 34: 630–640, 2013. [DOI] [PubMed] [Google Scholar]
- Knikou M. The H-reflex as a probe: pathways and pitfalls. J Neurosci Methods 171: 1–12, 2008. [DOI] [PubMed] [Google Scholar]
- Knikou M. Transpinal and transcortical stimulation alter corticospinal excitability and increase spinal output. PLoS One 9: e102313, 2014. [DOI] [PMC free article] [PubMed] [Google Scholar]
- Knikou M, Dixon L, Santora D, Ibrahim MM. Transspinal constant-current long-lasting stimulation: a new method to induce cortical and corticospinal plasticity. J Neurophysiol 114: 1486–1499, 2015. [DOI] [PMC free article] [PubMed] [Google Scholar]
- Knikou M, Mummidisetty CK. Locomotor training improves premotoneuronal control after chronic spinal cord injury. J Neurophysiol 111: 2264–2275, 2014. [DOI] [PubMed] [Google Scholar]
- Koch G, Ponzo V, Di Lorenzo F, Caltagirone C, Veniero D. Hebbian and anti-Hebbian spike-timing-dependent plasticity of human cortico-cortical connections. J Neurosci 33: 9725–9733, 2013. [DOI] [PMC free article] [PubMed] [Google Scholar]
- Kujirai T, Caramia MD, Rothwell JC, Day BL, Thompson PD, Ferbert A, Wroe S, Asselman P, Marsden CD. Corticocortical inhibition in human motor cortex. J Physiol 471: 501–519, 1993. [DOI] [PMC free article] [PubMed] [Google Scholar]
- Ladenbauer J, Minassian K, Hofstoetter US, Dimitrijevic MR, Rattay F. Stimulation of the human lumbar spinal cord with implanted and surface electrodes: a computer simulation study. IEEE Trans Neural Syst Rehabil Eng 18: 637–645, 2010. [DOI] [PubMed] [Google Scholar]
- Lamy JC, Wargon I, Baret M, Ben Smail D, Milani P, Raoul S, Penicaud A, Katz R. Post-activation depression in various group I spinal pathways in humans. Exp Brain Res 166: 248–262, 2005. [DOI] [PubMed] [Google Scholar]
- Lemon RN. Descending pathways in motor control. Annu Rev Neurosci 31: 195–218, 2008. [DOI] [PubMed] [Google Scholar]
- Macefield G, Gandevia SC, Burke D. Conduction velocities of muscle and cutaneous afferents in the upper and lower limbs of human subjects. Brain 112: 1519–1532, 1989. [DOI] [PubMed] [Google Scholar]
- Mackey AS, Uttaro D, McDonough MP, Krivis LI, Knikou M. Convergence of flexor reflex and corticospinal inputs on tibialis anterior network in humans. Clin Neurophysiol 127: 706–715, 2016. [DOI] [PubMed] [Google Scholar]
- Maertens de Noordhout A, Rothwell JC, Thompson PD, Day BL, Marsden CD. Percutaneous electrical stimulation of lumbosacral roots in man. J Neurol Neurosurg Psychiatry 51: 174–181, 1988. [DOI] [PMC free article] [PubMed] [Google Scholar]
- Markram H, Gerstner W, Sjöström PJ. A history of spike-timing-dependent plasticity. Front Synaptic Neurosci 3: 4, 2011. [DOI] [PMC free article] [PubMed] [Google Scholar]
- Meunier S, Pierrot-Deseilligny E. Cortical control of presynaptic inhibition of Ia afferents in humans. Exp Brain Res 119: 415–426, 1998. [DOI] [PubMed] [Google Scholar]
- Mrachacz-Kersting N, Fong M, Murphy BA, Sinkjaer T. Changes in excitability of the cortical projections to the human tibialis anterior after paired associative stimulation. J Neurophysiol 97: 1951–1958, 2007. [DOI] [PubMed] [Google Scholar]
- Müller-Dahlhaus F, Ziemann U, Classen J. Plasticity resembling spike-timing dependent synaptic plasticity: the evidence in human cortex. Front Synaptic Neurosci 2: 34, 2010. [DOI] [PMC free article] [PubMed] [Google Scholar]
- Nielsen J, Petersen N, Fedirchuk B. Evidence suggesting a transcortical pathway from cutaneous foot afferents to tibialis anterior motoneurones in man. J Physiol 501: 473–484, 1997. [DOI] [PMC free article] [PubMed] [Google Scholar]
- Pierrot-Deseilligny E, Burke D. The Circuitry of the Human Spinal Cord. Cambridge, UK: Cambridge University Press, 2005. [Google Scholar]
- Porter R, Lemon R. Corticospinal Function and Voluntary Movement. Oxford, UK: Oxford University Press, 1993. [Google Scholar]
- Rattay F, Minassian K, Dimitrijevic MR. Epidural electrical stimulation of posterior structures of the human lumbosacral cord: 2. Quantitative analysis by computer modeling. Spinal Cord 38: 473–489, 2000. [DOI] [PubMed] [Google Scholar]
- Ridding MC, Taylor JL, Rothwell JC. The effect of voluntary contraction on cortico-cortical inhibition in human motor cortex. J Physiol 487: 541–548, 1995. [DOI] [PMC free article] [PubMed] [Google Scholar]
- Rizzo V, Siebner HS, Morgante F, Mastroeni C, Girlanda P, Quartarone A. Paired associative stimulation of left and right human motor cortex shapes interhemispheric motor inhibition based on a Hebbian mechanism. Cereb Cortex 19: 907–915, 2009. [DOI] [PubMed] [Google Scholar]
- Rosenkranz K, Kacar A, Rothwell JC. Differential modulation of motor cortical plasticity and excitability in early and late phases of human motor learning. J Neurosci 27: 12058–12066, 2007. [DOI] [PMC free article] [PubMed] [Google Scholar]
- Rossini PM, Barker AT, Berardelli A, Caramia MD, Caruso G, Cracco RQ, et al. Non-invasive electrical and magnetic stimulation of the brain, spinal cord and roots: basic principles and procedures for routine clinical application. Report of an IFCN Committee. Electroencephalogr Clin Neurophysiol 91: 79–92, 1994. [DOI] [PubMed] [Google Scholar]
- Rothwell JC. Overview of neurophysiology of movement control. Clin Neurol Neurosurg 114: 432–435, 2012. [DOI] [PubMed] [Google Scholar]
- Roy FD, Norton JA, Gorassini MA. Role of sustained excitability of the leg motor cortex after transcranial magnetic stimulation in associative plasticity. J Neurophysiol 98: 657–667, 2007. [DOI] [PubMed] [Google Scholar]
- Sakai K, Ugawa Y, Terao Y, Hanajima R, Furubayashi T, Kanazawa I. Preferential activation of different I waves by transcranial magnetic stimulation with a figure-of-eight-shaped coil. Exp Brain Res 113: 24–32, 1997. [DOI] [PubMed] [Google Scholar]
- Sanger TD, Garg RR, Chen R. Interactions between two different inhibitory systems in the human motor cortex. J Physiol 530: 307–317, 2001. [DOI] [PMC free article] [PubMed] [Google Scholar]
- Sjöström PJ, Rancz EA, Roth A, Häusser M. Dendritic excitability and synaptic plasticity. Physiol Rev 88: 769–840, 2008. [DOI] [PubMed] [Google Scholar]
- Song S, Miller KD, Abbott LF. Competitive Hebbian learning through spike-timing-dependent synaptic plasticity. Nat Neurosci 3: 919–926, 2000. [DOI] [PubMed] [Google Scholar]
- Spanne A, Jörntell H. Processing of multi-dimensional sensorimotor information in the spinal and cerebellar neuronal circuitry: a new hypothesis. PLoS Comput Biol 9: e1002979, 2013. [DOI] [PMC free article] [PubMed] [Google Scholar]
- Stefan K, Kunesch E, Benecke R, Cohen LG, Classen J. Mechanisms of enhancement of human motor cortex excitability induced by interventional paired associative stimulation. J Physiol 543: 699–708, 2002. [DOI] [PMC free article] [PubMed] [Google Scholar]
- Stefan K, Kunesch E, Cohen LG, Benecke R, Classen J. Induction of plasticity in the human motor cortex by paired associative stimulation. Brain 123: 572–584, 2000. [DOI] [PubMed] [Google Scholar]
- Stefan K, Wycislo M, Gentner R, Schramm A, Naumann M, Reiners K, Classen J. Temporary occlusion of associative motor cortical plasticity by prior dynamic motor training. Cereb Cortex 16: 376–385, 2006. [DOI] [PubMed] [Google Scholar]
- Taylor JL, Martin PG. Voluntary motor output is altered by spike-timing-dependent changes in the human corticospinal pathway. J Neurosci 29: 11708–11716, 2009. [DOI] [PMC free article] [PubMed] [Google Scholar]
- Wolters A, Schmidt A, Schramm A, Zeller D, Naumann M, Kunesch E, Benecke R, Reiners K, Classen J. Timing-dependent plasticity in human primary somatosensory cortex. J Physiol 565: 1039–1052, 2005. [DOI] [PMC free article] [PubMed] [Google Scholar]
- Ziemann U, Muellbacher W, Hallett M, Cohen LG. Modulation of practice-dependent plasticity in human motor cortex. Brain 124: 1171–1181, 2001. [DOI] [PubMed] [Google Scholar]
- Ziemann U, Rothwell JC, Ridding M. Interaction between intracortical inhibition and facilitation in human motor cortex. J Physiol 496: 873–881, 1996. [DOI] [PMC free article] [PubMed] [Google Scholar]