

Abstract
A brain image registration algorithm, referred to as RABBIT, is proposed to achieve fast and accurate image registration with the help of an intermediate template generated by a statistical deformation model. The statistical deformation model is built by principal component analysis (PCA) on a set of training samples of brain deformation fields that warp a selected template image to the individual brain samples. The statistical deformation model is capable of characterizing individual brain deformations by a small number of parameters, which is used to rapidly estimate the brain deformation between the template and a new individual brain image. The estimated deformation is then used to warp the template, thus generating an intermediate template close to the individual brain image. Finally, the shape difference between the intermediate template and the individual brain is estimated by an image registration algorithm, e.g., HAMMER. The overall registration between the template and the individual brain image can be achieved by directly combining the deformation fields that warp the template to the intermediate template, and the intermediate template to the individual brain image. The algorithm has been validated for spatial normalization of both simulated and real magnetic resonance imaging (MRI) brain images. Compared with HAMMER, the experimental results demonstrate that the proposed algorithm can achieve over five times speedup, with similar registration accuracy and statistical power in detecting brain atrophy.
Keywords: statistical deformation model, principal component analysis, intermediate template, fast image registration
1. INTRODUCTION
Elastic image registration has been one of standard preprocessing steps in a great deal of medical image analysis tasks for integration and comparison of data from individuals or groups, as well as for the development of statistical atlases that reflect anatomical and functional variability within a group of individuals (Evans et al., 1991; Freeborough and Fox, 1998; Prima et al., 1998; Thompson et al., 2001). The goal of elastic image registration is to estimate a deformation field that establishes dense spatial correspondences between images under registration. The elastic image registration is typically achieved by optimizing an appropriate image similarity measurement, or solving a partial different equation (PDE) system that models the image registration as an elastic material deformation driven by the forces derived from image similarity measurements (Zitova and Flusser, 2003).
In elastic image registration, the parameters needed to represent the deformation field are often in thousands when the deformation field is modeled by a linear combination of basis functions, or even in the magnitude of the number of voxels of images under registration when PDE methods are used. These high dimensional image registrations often have to be solved by using aggressive, iterative “local search” techniques, which are prone to local minima if good initializations cannot be provided due to the high dimensionality of parameters (Zhuang et al., 2008). To achieve stable performance and to penalize physically unfeasible or unrealistic deformations, the regularization terms are often used in elastic Wage registration, which include Laplacian term (Shen and Davatzikos, 2002; Shen and Davatzikos, 2003), elastic energy (Bajcsy and Kovacic, 1989), viscous fluid (Christensen et al., 1996), biomechanical model (Ferrant et al., 2000), or statistical constraints learned from the training samples (Loeckx et al., 2003; Wouters et al., 2006; Xue and Shen, 2007). However, the high computational cost of elastic image registration has been a long-lasting problem although parallel computing might be a solution (Zacharaki et al., 2008).
In this paper, we present a statistical deformation model based elastic image registration algorithm, referred to as RABBIT, to achieve robust and rapid image registration. It consists of three major components: (1) an efficient parameterization scheme of deformation fields learned from the training brain deformation fields, (2) a fast estimation of intermediate deformation field and intermediate template, and (3) a deformation field refinement scheme that can be implemented by any image registration algorithms with reasonable registration performance. In particular, a statistical deformation model is first built by principal component analysis (PCA) on a set of training brain deformation fields that warp a selected template to individual brain image samples. The statistical deformation model captures the statistical variation of brain image deformations, thus having a potential to characterize an individual brain deformation with a small number of parameters. To register an individual brain image to the template brain image, the statistical deformation model is used to estimate a deformation field for generating an intermediate template close to the individual image under study. This step enables the efficient and robust capture of major shape difference between the template and the individual brain image under registration, thanks to the reduced number of parameters to be optimized in this intermediate template estimation procedure. Finally, the estimated intermediate deformation field is further refined by a general registration algorithm, namely HAMMER (Shen and Davatzikos, 2002), to register the intermediate template with the individual brain image. This step can be achieved relatively fast since the remaining shape difference between the intermediate template and the individual brain image is small.
The proposed algorithm, RABBIT, has been validated for spatial normalization of both simulated and real MRI brain images. The algorithm has been quantitatively and qualitatively compared with HAMMER (Shen and Davatzikos, 2002), showing that RABBIT can achieve rapid image registration with similar registration accuracy and statistical power in detecting brain atrophy in the simulated data and real data such as MRI brain images of Alzheimer’s Disease (AD) patients.
2. METHOD
RABBIT consists of 1) constructing a statistical deformable model by learning from the training samples of deformation fields, 2) estimating an intermediate deformation field by parameter optimization to generate a specific intermediate template close to the individual brain under registration, and 3) refining the intermediate deformation field to achieve high registration accuracy by a registration algorithm, namely HAJMMER. These three steps are detailed next.
2.1 Statistical Model of Shape Deformations
The images to be registered are first globally normalized to the template image space using affine registration. Then, the elastic registration algorithm can focus on estimating the nonlinear difference between the images under registration. In the case of 3D image registration, the deformation field that warps a template T to an individual brain image I can be modeled as
| (1) |
or by an n × 3 vector
| (2) |
where (dxj, dyj, dzj) is a displacement vector that warps a voxel j of T to I, and n is the total number of voxels in T. In image registration algorithms, the deformation field is characterized either voxel-wisely or by means of linear basis functions, which generally needs a large number of parameters and requires solving a high-dimensional optimization problem.
To bypass the problem to solve the difficult high-dimensional optimization problem, we adopt a statistical deformation model with a small number of parameters to capture the statistical variation of brain deformations by learning from a set of training deformation fields that warps the template T to the individual brain samples (Loeckx et al., 2003; Wouters et al., 2006). This technique is similar to those successfully applied in the image segmentation field (Cootes et al., 1995; Cootes et al., 1994; Cootes and Taylor, 1995; Kelemen et al., 1999). However, the focus of our study is to perform statistical analysis on the voxel-wise deformation fields that warp individual brain images to the template image, and use the constructed statistical deformation model to improve the speed of the registration algorithm.
Given a set of brain image samples {Ii, 1 ≤ i ≤ M} and their respective deformation fields {fi, 1 ≤ i ≤ M} (directing from the template T to each affine registered subject brain image), we can use PCA to get a statistical deformation model that captures the statistical variations of the training deformation fields. From all M deformation field samples, a mean deformation field, , is first computed, and then a difference vector fi − f̄ for each fi is calculated to construct an overall difference matrix D:
| (3) |
From this overall difference matrix, we can compute a covariance matrix
| (4) |
The size of the covariance matrix of deformation fields is of 3N × 3N, which typically ranges from several thousands to several millions. Thus, it is not easy to directly calculate the eigenvectors and eigenvalues from this huge covariance matrix. However, the number of training samples is relatively small compared to the number of voxels. To efficiently compute the PCA model, similar to the methods described in (Cootes et al., 1995; Cootes et al., 1994), we first calculate the eigenvectors and eigenvalues of the transpose matrix of equation (3):
| (5) |
and obtain M − 1 pairs of eigenvectors {ei} and non-zero eigenvalues {λi} computed from Cov(DT). Then, the first M − 1 eigenvectors and eigenvalues of Cov(D) can be calculated as Dei and λi = 1,2, …M − 1, and the remaining 3N − M + 1 eigenvectors all have zero eigenvalues.
The eigenvalues reflect the energy distribution of the training deformation fields among eigenvectors, and the eigenvectors with the largest eigenvalues generally cover the majority of the energy within the training deformation Fields. Therefore, a small number of eigenvectors, serving as basis functions, can well capture the distribution of training deformation fields. By using this deformation model, any new deformation field f can be approximated as
| (6) |
where , λi and Dei are eigenvalues and eigenvectors of covariance matrix of the training deformation fields, and {ci} are the coefficients on the respective eigenvectors.
2.2 Estimation of Intermediate Deformation Field and Respective Intermediate Template
Using the statistical deformation model, the estimation of deformation field f from the template space T to a new brain image I can be modeled as an optimization problem to find appropriate parameters {ci} for the deformation field f (as described in equation (6)):
| (7) |
where s measures the similarity between the warped template f (T) and I,. The warped template f (T) is generated from T by applying f. In our experiments, the sum of squared difference (SSD) of image intensity is used as the similarity metric.
To find the optimal deformation field f, the similarity function has to be evaluated with respect to parameters {ci} in equation (6), which involves a computationally expensive image warping and comparison. To improve efficiency of the optimization, rather than randomly initializing the parameters of the deformation model, we place some intermediate templates around the template, as illustrated in Fig. 1.
Fig. 1.
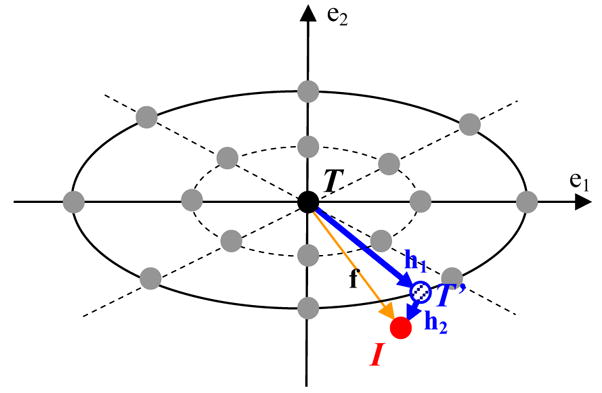
Schematic explanation on the proposed RABBIT algorithm. The black point indicates the location of template T. The two axes denotes two main eigen directions of brain deformations learned from the training samples. The grey points denote the pre-placed intermediate templates, used to fast initialize the deformation paramters for a new subject. The red point I denotes the location of the linearly aligned image of a new subject. Using Powell’s optimization, the deformation paramters can be further refined, thus obtaining a final intermediate deformation hi to generate a respective intermediate template T′. Since the remaining deformation h2 from T′ to I is small, it can be estimated relatively fast and easily by a conventional registration algorithm.
The statistical deformation model in the PCA space can be interpreted as a multidimensional Gaussian distribution of deformation fields, each dimension representing different amount of deformation information. To simplify the generation of intermediate templates, i.e., sampling the deformation fields in the learned multidimensional Gaussian distribution, we sample the deformation fields separately along each dimension according to its respective marginal Gaussian distribution. To make the sampled deformation fields distributed in a Gaussian way, we adopted a method proposed in (Lázaro-Gredilla et al., 2007). In particular, given a Gaussian distribution corresponding to the i-th major eigenvector and also the number of the required sampling deformation fields n (along this eigenvector), the coefficient ci in Equation (6) need to be assigned as below for sampling the deformation fields:
| (8) |
where {hj, j = 1, …, n} are the set of points uniformly distributed in the interval [0,1). With this designed strategy of sampling n deformation fields along each of t top major eigenvectors, the total number of sampled deformation fields or intermediate templates will be nt, by full combination of n coefficients along t top eigenvectors.
The number of sampling deformation fields (n) and the number of top major eigenvectors (t) used to generate the intermediate templates are typically determined empirically, to achieve acceptable registration accuracy with reasonable computational cost. In particular, we build the intermediate templates on the first few eigenvectors with the largest eigenvalues, which can contribute over 80% of the cumulative energy for deformation fields. In our experiments, we found that the method with t=5 top major eigenvectors and n=5 samples of deformation fields along each eigenvector produces the best results. In this case, totally 3125 intermediate templates are used.
Once the intermediate templates are generated, we compute the similarity between the image under registration and each of these pre-placed intermediate templates, and select the closest intermediate template to initialize the parameters {ci} in the statistical deformation model. The coefficients {ci} in the deformation model f are further optimized by means of Powell’s optimization algorithm iteratively (Press et al., 1992), thus generating an intermediated template, as illustrated in Fig. 1. The search range for each coefficient ci is set between −3 and +3, thus ensuring the validity of the generated deformation field. In the Powell’s optimization, we set the line search step as 0.1 and the termination cost of change (between current and previous iterations) as 0.01. The intermediate deformation field is further refined by a registration algorithm as described next, which is achieved by registering the intermediate template with the given new brain image.
2.3 Refinement of the Intermediate Deformation Field
The statistical deformation model based methods can achieve fast deformable image registration (Loeckx et al., 2003; Wouters et al., 2006); however, the registration accuracy might be limited due to the following reasons. First, the training dataset might be limited to capture all possible brain deformations. Second, although the PCA technique is optimal to linearly represent data, its assumption of data normality may limit its ability in capturing the statistical information from the data that doesn’t follow the Gaussian distribution. Furthermore, the performance of PCA is often limited in the applications with a relatively small number of training samples while the high dimensionality of image features (Xue et al., 2006a). Therefore, to achieve accurate registration, we adopt a registration refinement scheme, which is implemented by HAMMER. HAMMER, acronym of “Hierarchical Attribute Matching Mechanism for Elastic Registration”, achieves elastic image registration with a hierarchical morphological attribute-based deformation strategy (Shen and Davatzikos, 2002). Rather than directly matching image intensities between two images, HAMMER matches attribute vectors of images which are defined for each point in images to characterize the geometric features around that point. It also uses a hierarchical approximation strategy to optimize the energy function and has a potential to overcome the local minimum problem. It is worth noting that other elastic registration algorithms can also be utilized, including but not limited to the methods proposed in (Ashburner and Friston, 1999; Christensen et al., 1996; Chui and Rangarajan, 2003; Collins et al., 1994; Gee et al., 1993; Johnson and Christensen, 2002; Luan et al., 2008; Rueckert et al., 1999; Thirion, 1996; Thompson and Toga, 1996). Since the statistical deformation model based image registration has already provided a reasonably good initialization for registration, the registration refinement step can be completed very fast.
2.4 Evaluation of the Registration Performance
For quantitatively evaluating the performance of our proposed RABBIT registration algorithm, we use two ways to: 1) directly measure the registration error, and 2) measure the performance of brain atrophy detection.
To directly measure the registration error, we use two datasets: synthetic MR brain images with known deformations and real brain images with labeled regions of interest (ROI). The synthetic brain images are generated from a selected template by warping it using various simulated brain deformation fields (Xue et al., 2006c). Then, these synthetic brain images are registered with the original template by a registration algorithm to obtain the algorithm-estimated deformation fields. By comparing the errors between each simulated deformation field and its respective algorithm-estimated deformation field, we can obtain the registration error (E) to evaluate the performance of RABBIT. The registration error (E) is defined by the Euclidean distance between the simulated deformation field and the respective algorithm-estimated one as follows:
| (9) |
where Ω is the domain of a brain image, Fi,j,k (x), Fi,j,k (y) and Fi,j,k (z) represent the algorithm-estimated deformations along the x, y and z directions, and and are the ground-truth deformations simulated at x, y and z directions.
The real brain images with manually labeled regions of interest (ROIs), obtained from the Non-Rigid Registration Evaluation Project (NIREP) (Christensen et al., 2006), are further used to evaluate the performance of our proposed method. The NIREP Na0 database comprises a population of 16 richly annotated 3D MR brain images, each with 32 manually labeled ROIs in the gray matter region. To measure the registration accuracy, we randomly select an image from the Na0 dataset as a template and then register other 15 images to the selected template. After registration, the labels in each of 15 images can be warped onto the template space. In this way, we can measure the Dice rate between the corresponding labels of each registered image and the template to evaluate the registration performance. The Dice rate is defined as
| (10) |
where L1 and L2 are the corresponding labels in a registered image and the template. |L| denotes the total number of voxels in L. The average Dice rate can be calculated from all 15 registered images, with larger value indicating better registration performance.
Besides directly measuring the registration accuracy, we also evaluate the performance of RABBIT registration algorithm with respect to its sensitivity in detecting brain atrophy by using voxel based morphometry (VBM) (Ashburner et al., 2003; Ashburner and Friston, 2000; Davatzikos et al., 2001). In VBM studies, all individual brain images are spatially normalized onto a template space using a registration algorithm. Based on the estimated deformation field, the brain morphometry information for each brain can be measured by the tissue density maps, for white matter (WM), grey matter (GM), and cerebral spinal fluid (CSF), respectively. These tissue density maps reflect regional volumetric changes compared to the template image. Afterwards, voxel-wise group analysis can be performed to detect the brain atrophy by using SPM software (http://www.fil.ion.ucl.ac.uk/spm/software/spm5). This atrophy detection method has been successfully applied to many studies (Beresford et al., 2006; Davatzikos et al., 2001; Davatzikos et al., 2005; Goldszal et al., 1998; Resnick et al., 2003). In this paper, we use MR brain images with simulated atrophy as well as images of AD patients to evaluate the performance of RABBIT in atrophy detection.
3. RESULTS
The performance of RABBIT is evaluated with respect to registration accuracy, speed, and sensitivity of detecting brain atrophy in both simulated and real MRI brain images.
3.1 Statistical Deformation Model
Preparation of training and testing data
To build a statistical deformation model and test its performance in representation of new deformation fields, we selected MR brain image samples from the Open Access Series of Image Studies (OASIS). The detailed information about the clinical and demographic data for all samples is available at the OASIS website (http://www.oasis-brains.org). We also selected a normal brain image as a template (Kabani et al., 1998) for all experiments in this paper.
To generate the training and the testing data, 300 individual brain images are randomly selected from the OASIS database, and grouped (by age) into a middle-aged group and an elderly group. The middle-aged group consists of 150 brains aged from 25 to 55, and the elderly group consists of 150 brains aged over 65. All of these brain scans are spatially normalized onto the above-mentioned template using HAMMER registration algorithm, and the resulting deformation fields are used as training or testing samples as detailed below.
Effect of the size of training samples, and effect of ages
Each group is divided into two subsets, i.e., a training dataset with 100 deformation fields and a testing dataset with 50 deformation fields. From the training dataset, we can generate two statistical deformation models, trained by 50 or 100 samples in the training dataset, to test the effect of size of training samples on the performance of the produced models. These two models are referred to, respectively, as M50 and M100 below. These two models are applied to the testing dataset (with 50 sample deformation fields), to cross-validate the generalization of the built statistical deformation models.
To examine the effect of ages on performance of deformation model, we also apply the deformation models (M50 and M100) built from the middle-aged group (or the elderly group) to the testing dataset of the elderly group (or the middle-aged group). The difference between each testing deformation field and its statistical representation by a deformation model can be measured by Equation (9).
The testing results of both within- and cross-age groups are summarized in Table 1. It can be observed that the generalization ability of the statistical deformation models improves with the increase of the size of training dataset for both within- and cross-group testing. For example, M100 always performs better than M50. On the other hand, the errors in cross-group testing are always larger than those in within-group testing. This indicates that, for a specific age group, it is important to build a statistical deformation model from its own age, for better representing deformation fields.
Table 1.
Mean difference between deformation fields and their statistical representations (mm)
| Model | Middle-aged Group | Elderly Group | ||
|---|---|---|---|---|
| Testing data | M50 | M100 | M50 | M100I |
| Middle-aged group | 3.06 | 2.47 | 3.38 | 2.91 |
| Elderly group | 3.63 | 3.25 | 3.12 | 2.36 |
The relatively large errors shown Table 1 also highlights the necessity of using the refinement steps proposed in RABBIT. On the other hand, with the refinement step, the slightly worse performance of M50 has only moderate effect on the final registration performance, as shown in Section 3.2.
Intermediate template
Gaussian distribution of deformation fields is assumed in our method for building the statistical deformation model. Here, we test this assumption by empirically evaluating the normality of the coefficients {ci} of each training (or testing) deformation samples, to see whether they distribute like Gaussian. In particular, we use 50 samples from the training set of the elderly group to train a statistical deformation model M50 as mentioned above. For each major eigenvector (Dei), we can project 50 training samples onto this vector and obtain 50 coefficients {ci(j), j = 1,2,…, 50} Note that these coefficients have been normalized by the respective eigenvalue λi Therefore, we can draw a distribution of these 50 coefficients (corresponding one major eigenvector), which is shown as a curve in Fig. 2(a). There are totally 10 curves in Fig. 2(a), corresponding to 10 major eigenvectors, respectively. As we can observe, the distributions are all like Gaussian. We further apply this M50 model to the 50 testing samples of the elderly group, which are not included in the training set as emphasized above. Similarly, by projecting these 50 testing samples onto each of major eigenvectors, we can obtain the distribution of those 50 mapping coefficients, which corresponds to a curve in Fig. 2(b). Again, the 10 curves in Fig. 2(b) corresponds to 10 top eigenvectors. These distributions are close to Gaussian, although not as close as those in Fig. 2(a). The normality has been also confirmed by the Kolmogorov-Smirnov test (Lilliefors, 1969).
Fig. 2.

The distribution of coefficients of (a) 50 training samples and (b) 50 testing samples along each of ten top major eigenvectors. The 10 curves in each panel correspond to 10 distributions of coefficients along 10 top eigenvectors.
To qualitatively evaluate the representation performance of the statistical deformation model, we provide several representative intermediate templates in Fig. 3, which are generated from 5 top eigenvectors with the deformation fields represented by , i = 1,2, …,5. These intermediate template brain images show different variations of global and local brain shapes, e.g., small and large ventricles, indicating that the statistical deformation model can potentially represent a large variation of brain image deformation.
Fig. 3.

The template image is shown in the first column, and two intermediate template images generated from each of 5 top eigenvectors are shown from columns 2 to 6.
3.2 Registration performance of deformation model based registration
Preparation of testing simulation data
To quantitatively evaluate the registration accuracy of deformable model based registration and examine how its parameters affect the registration performance, twenty simulated deformation fields are generated by using Xue et al’s method (Xue et al., 2006c). These simulated deformation fields are then used to warp the template for generating 20 simulated MR brain images (with image size of 256×256×124). Notice that the deformation from the template to each simulated MR brain image is known. These simulated deformation fields are used as the ground-truth deformations for evaluating the performance of the deformation model based registration in the experiments performed below.
Effect of the number of pre-placed intermediate templates
We first examine how the number of the pre-placed intermediate templates affects the registration performance. In order to complete the deformation model based registration within five minutes, the number of deformation fields sampled along each of top eigenvectors is limited to no more than 5, i.e., n= 5. Therefore, we test how the registration performance is affected by the pre-placed intermediate templates generated with n=3 and n=5 sample deformation fields along each major eigenvector, respectively. The corresponding sample deformation fields are obtained according to Equation (8), with ci∈{−0.6745, 0, 0.6745} for the case of n=3, and ci ∈ {−0.9674, −0.4307, 0, 0.4307, 0.9674} for the case of n= 5. Therefore, when using t=5 top eigenvectors (which contain over 80% of the cumulative energy for deformation fields), the total number of pre-placed intermediate templates are nt =35 = 243 and nt= 55= 3125, respectively, for the case of sampling n=3 and n=5 deformation fields along each major eigenvector.
The effect of the size of intermediate templates is evaluated on 1) deformation model based registration and 2) the registration by RABBIT. For the deformation model based registration, after initialization with the pre-placed intermediate templates, statistical deformation models use ten eigenvectors to perform the registration. In particular, we use the above-mentioned statistical deformation models, i.e., M50 and M100 generated from 50 and 100 training samples of the elderly group, to estimate the deformations between those 20 simulated brain images and the template. Then, the algorithm-estimated deformations and the ground-truth deformations are compared to obtain the estimation errors for the deformation model based registration, with results shown in Fig. 4. It can be observed that the use of more intermediate templates (3125) leads to slightly better registration results, compared to the case of using less intermediate templates (243). However, both models (M50 and M100) have similar performance. As for the results obtained by RABBIT (see right part of Fig. 4), the number of training samples (i.e., M50 orM100) does not affect the estimation of simulated deformation fields, while the use of more intermediate templates (3125) offers slightly better result. Therefore, in this paper, we use 3125 intermediate templates for initialization of deformation parameters during the image registration with RABBIT.
Fig. 4.

Effect of the number of intermediate templates on registration. The left two columns shown the mean and standard deviation (std) of deformation estimation errors (mm) by the statistical deformation model (SMD) based registration method with 243 and 3125 pre-placed intermediate templates, respectively. The results by RABBIT with 243 and 3125 intermediate templates are also shown in the right two columns. The blue and red bars represent the results obtained using M50 and M100, where 50 and 100 training deformation samples from the elderly group are used for building the respective statistical models.
Effect of the number of eigenvectors (in the deformation model)
We then examine how the number of eigenvectors in the deformation model affects the registration performance. Both registration accuracy and computational cost are evaluated.
In the first experiment, the deformation models with different numbers of eigenvectors are used to represent the deformation field estimated during the deformation model based registration. For the initialization of these deformation models, 3125 pre-placed intermediate templates are used. Fig. 5 shows the mean and the standard deviation (std) of registration errors for the deformation models with 0–15 different numbers of eigenvectors. These results indicate that the deformation models (i.e., M50 and M100 built from the elderly group) produces very bad registration results when using only the mean of training deformation fields and no eigenvectors, i.e., the number of the used eigenvectors is zero, which corresponds to the affine registration result. As the number of the used eigenvectors in the deformation model increases, the mean and the standard deviation of registration errors decrease rapidly for the first few eigenvectors, and become stable once the number of eigenvectors exceeds 10. These two models (M50 and M100) have similar performance, while M50 is slightly better than M100 when the same number of eigenvectors are used (since it capture more energy forM50). Although more eigenvectors in the deformation model can better represent the brain deformations, it is computationally expensive to optimize a large number of parameters in the deformation model in order to achieve better registration performance, as demonstrated in Fig. 6.
Fig. 5.

The mean (left) and the standard deviation (right) of deformation estimation errors (mm) by the deformation model based registration, when including different numbers of eigenvectors in the deformation model. This is actually the error of RABBIT in estimating the intermediate template, but not the finally result by RABBIT.
Fig. 6.
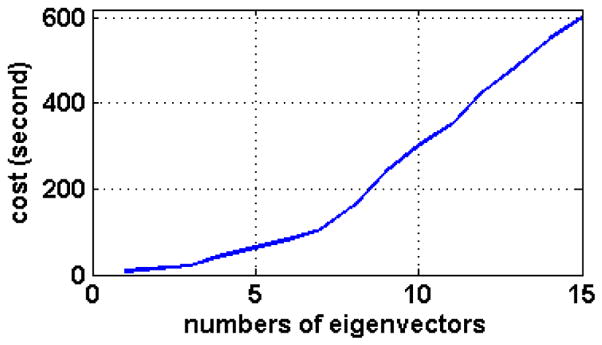
Computational cost in estimating the intermediate template, with respect to the number of eigenvectors used in the deformation model.
To determine the suitable number of eigenvectors to be included in the deformation model, in the second experiment we also examine how the number of eigenvectors (i.e., 5 and 10) used in the deformation model can eventually affect the registration performance of RABBIT. As shown in Fig. 7, the use of 10 eigenvectors in the deformation models produces slightly better final registration results on those 20 simulated brain images, compared the case using only 5 eigenvectors. The results by using 5 and 10 eigenvectors are both close to the results obtained by HAMMER (as shown in right column of Fig. 7). In addition, the overall registration performance by RABBIT is very similar for the cases of using deformation models M50 and M100 (trained with 50 and 100 deformation samples from the elderly group, respectively). This indicate that, with a sufficient number of training samples such as 50 samples, the performance of RABBIT can be improved very little by including more training samples.
Fig. 7.
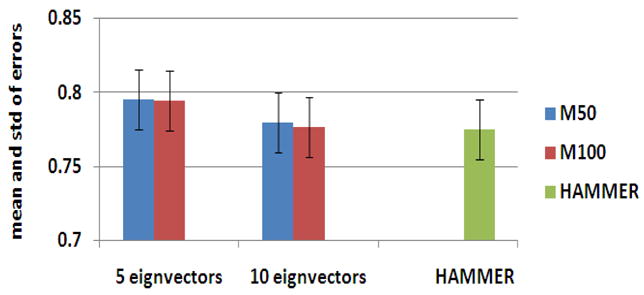
The final registration performance of RABBIT with respect to the use of different number of eigenvectors (i.e., 5 and 10 eigenvectors) in the deformation models M50 and M100. The registration performance of HAMMER on the same 20 simulated data is also provided in the last column for comparison.
In the third experiment, we examine how the computational cost (time) of entire registration steps (in RABBIT) varies with the number of eigenvectors used in the deformation model. It takes from 100 to 300 seconds when the number of the used eigenvectors varies from 5 to 10. When 10 eigenvectors are used in the deformation model, one iteration in the HAMMER-based refinement step takes about 50 seconds. It takes a little bit longer time when 5 eigenvectors are used in the deformation model, since the obtained intermediate templates are not as good as those obtained by the deformation model with 10 eigenvectors. It is worth noting that the computational time of HAMMER is not a linear function of the number of iterations used, since HAMMER is an adaptive registration algorithm which takes longer to finish an iteration when the difference between images are larger, and vice versa.
Taking all the above factors (evaluated in the three experiments) into consideration, we find that RABBIT using 10 eigenvectors in the deformation model has the best overall performance, in terms of both registration accuracy and speed. Therefore, 10 eigenvectors are used for all the experiments performed below.
3.3 Registration performance of RABBIT
Demonstration of whole deformation procedure
To illustrate how RABBIT works, Fig. 8 shows all the intermediate results during the registration for a typical brain scan. The template image is shown in Fig. 8(a), to which the brain scan in Fig. 8(c) is to be registered. Fig. 8(b) shows the initially estimated intermediate template for the brain scan in Fig. 8(c), based on only the similarity with the pre-placed intermediate templates. It can be observed that, compared to the original template, the initially estimated intermediate template is more similar to the given brain scan. Furthermore, with the constructed deformation model, the initially estimated intermediate template can be refined, with the final intermediate template shown in Fig. 8(d). The remaining difference between the final intermediate template and the brain scan is estimated by HAMMER, with the final registration result shown in Fig. 8(e), which is visually very similar to the brain scan in Fig. 8(c). For comparison, the registration result obtained by HAMMER is also shown in Fig. 8(f). These experimental results visually demonstrate the procedure of RABBIT, as well as its comparable performance with HAMMER. More quantitative results will be provided below to demonstrate the performance of RABBIT.
Fig. 8.

The step-by-step demonstration of RABBIT in aligning a template (a) with a new brain scan (c). The initially estimated intermediate template using the pre-generated intermediate templates is shown in (b), while the final estimated intermediate template is given in (d). The final warped template is shown in (e). For comparison, the template warping result by HAMMER is also displayed in (f), which indicates that our final warping result is comparable to the one obtained by HAMMER. The advantage of RABBIT is its significant reduction of the computational time.
In our experiments, HAMMER typically converges after about 30 iterations, and it takes over 4800 seconds on average for registering brain images with a size of 256×256×124. For RABBIT, it takes about 300 seconds for the deformation model to estimate a reasonable intermediate deformation field (or intermediate template), and about 600 seconds for the HAMMER-based refinement. The total computational time for RABBIT is less than 900 seconds. The speed increase by RABBIT is over five times, compared to HAMMER.
Performance on real data
The registration accuracy of RABBIT has also been evaluated based on image data of Non-Rigid Registration Evaluation Project (NIREP) (2006; Christensen et al., 2006). The NIREP database consists of 16 MRI brain images aged 24 to 50. The gray matter region of these images has been manually segmented into 32 ROIs, which can be used to evaluate accuracy of non-rigid registration by measuring the Dice rates between the ROIs of the template image and the registered images, as defined in Equation (10).
To test the registration performance of the registration algorithm, one image from the NIREP database is randomly selected as a template image. To apply the proposed method, a statistical deformation model is built based on the deformation fields obtained by registering 100 brain images of the OASIS database (aged 25 to 50) to the selected template.
The registration performances of both HAMMER and RABBIT are evaluated by registering other 15 brain images onto the selected template, with average Dice rate shown in Fig. 9. Also, the average Dice rate over all 15 aligned subjects can be compute as shown in the last column of Fig. 9. In general, HAMMER and RABBIT have similar registration performance, although the average Dice rates of RABBIT are significantly larger than HAMMER, with p value 0.0078. However, such difference is very small.
Fig. 9.

The average Dice rate and standard deviation for each of 15 subjects, along with the overall performance for all 15 subjects (right column).
3.4 Performance on Brain Atrophy Detection
In this brain atrophy detection experiment, the deformation model is constructed from 50 MR brain images of normal individuals aged from 65 to 80. These images are obtained from our local imaging database.
Detection of simulated brain atrophy
In this experiment, we first select a normal group of 12 subjects aged over 65. Then, we simulate atrophies at both precentral gyrus and superior temporal gyrus of these 12 subjects to generate an atrophy group (Davatzikos et al., 2001). A total 24 images from the normal and atrophy groups are spatially normalized onto a template space by RABBIT and HAMMER, respectively. We then exam the ability of each registration algorithm in detecting simulated atrophy from the tissue density maps computed from the estimated deformation fields. Grey matter (GM) tissue density maps are calculated and smoothed using 8mm full-width at half-maximum (FWHM) smoothing kernel for each of 24 samples. By using SPM software package (http://www.fil.ion.ucl.ac.uk/spm/software/spm5), we perform a paired t-test on GM tissue density maps of the normal and the atrophy groups. Notice that in the paired t-test, smaller p values or larger t values indicate the better separation between two groups. We use an equal p value (p=0.005) to compare the t-score obtained by RABBIRT with that by HAMMER. As a result, differences are detected at both simulated locations of the precentral gyrus and the superior temporal gyrus by RABBIT and HAMMER. Fig. 10 shows those detected differences, superposed on the template image.
Fig. 10.

Atrophy detection results in GM using a simulated atrophy data. The arrows indicate the detected atrophy locations, (a) and (b) show the atrophies detected in the precentral gyrus and the superior temporal gyrus by HAMMER, (c) and (d) show the atrophies detected in the precentral gyrus and the superior temporal gyrus by RABBIT.
Table 2 summarizes the statistical measures obtained at the locations of the precentral gyrus and the superior temporal gyrus. It can be observed that both ppwe and pfdr are smaller and t-values are larger for RABBIT. This indicates that the PCA-based deformation model, combined with HAMMER, in our proposed RABBIT is powerful in brain atrophy detection.
Table 2.
Paired t-test results on simulated brain atrophy detection.
| RABBIT | HAMMER | |||||
|---|---|---|---|---|---|---|
|
|
||||||
| ppwe | pfdr | t_value | ppwe | pfdr | t_value | |
| Cluster 1 (GM, precentral gyrus) | 0.001 | 0.002 | 16.20 | 0.004 | 0.002 | 13.40 |
| Cluster 2 (GM, superior temporal gyrus) | 0.005 | 0.002 | 13.00 | 0.076 | 0.005 | 9.95 |
Detection of Alzheimer’s disease (AD) related brain atrophy
In order to further investigate the performance of RABBIT, we use it to spatially normalize structural MRI brain scans for detecting AD related brain atrophy. Image data from the Open Access Series of Image Studies (OASIS) are used in this paper, which includes 98 healthy elders and 100 early-stage AD patients (Marcus et al., 2007). Each subject has three to four individual T1-weighted MR images acquired on a 1.5T scanner. These images were averaged to create a single image with high contrast to noise ratio. RABBIT and HAMMER are used to spatially normalize these brain scans, respectively. Similarly, from the estimated deformation fields, GM tissue density maps that combine deformation information as well as GM tissue information are computed for voxel-wise comparison between healthy subjects and individuals with early-stage AD. The spatial patterns of AD-related brain atrophy are complex and involved in many brain regions. As shown in Fig. 11, both RABBIT and HAMMER detect the atrophy in temporal lobe structures, including hippocampus, Amygdala, cingulate, precuneus, and insular cortex, with p = 0.05 (false discover rate (FDR) corrected) (Bozzali et al., 2006; Busatto et al., 2003 ; Chetelat and Baron, 2003; Convit et al., 1997; Cuenod et al., 1993; De Santi et al., 2001; Du et al., 2001; Fan et al., 2008; Fox et al., 1996; Frisoni et al., 2007; Grundman et al., 2002; Jack et al., 2000; Jack et al, 1999; Karas et al., 2004; Pennanen et al., 2005; Saykin et al., 2006; Xu et al., 2000).
Fig. 11.

Brain atrophy detected in the GM of early-stage AD subjects by performing t-test on spatially normalized images using HAMMER (left) and RABBIT (right). The color bars indicate the t-value obtained in t-test. The multiple comparison is corrected by false discover rate. Images are shown in radiology convention.
To quantitatively compare the performance of RABBIT and HAMMER, Table 3 summarizes the maximum t-value obtained in regions with significant group difference, i.e., brain atrophy. These results indicate that RABBIT has relatively better performance (paired t-test of t-values with p value 0.03, although negligible with respect to the mean value), compared to HAMMER, in detection of AD-related brain atrophy from the structural MR brain images.
Table 3.
t- values on the detected brain regions with significantly group difference between healthy elders and individuals with early-stage AD.
| HAMMER | RABBIT | |
|---|---|---|
| Uncus right | 8.57 | 8.52 |
| Uncus left | 7.69 | 8.00 |
|
| ||
| Insula right | 5.97 | 6.70 |
| Insula left | 6.53 | 6.34 |
|
| ||
| Cingulated region right | 5.14 | 5.36 |
| Cingulated region left | 5.01 | 5.24 |
|
| ||
| Hippocampal formation right | 8.85 | 8.74 |
| Hippocampal formation left | 7.78 | 7.79 |
|
| ||
| Parahippocampal gyrus right | 6.07 | 5.89 |
| Parahippocampal gyrus left | 5.48 | 5.89 |
|
| ||
| Entorhinal cortex right | 7.90 | 7.44 |
| Entorhinal cortex left | 5.17 | 6.18 |
|
| ||
| Amygdala right | 8.85 | 8.80 |
| Amygdalaa left | 7.76 | 7.97 |
|
| ||
| Precuneus right | 4.82 | 5.15 |
| Precuneus left | 3.76 | 4.74 |
4. Discussion and Conclusion
We have presented a fast elastic brain image registration algorithm, called RABBIT, by using a statistical deformation model to take advantage of prior information of brain deformations, as well as to rapidly estimate a reasonable intermediate template for a given new subject. The employment of the deformation model in registration has two advantages. First, it becomes feasible to achieve the computationally efficient image registration due to the significant deduction of the number of parameters used in the deformation field representation. Second, the deformation field is constrained by the statistical distribution of brain deformations learned from the training samples. To further refine the intermediate deformation field estimated by the deformation model, a registration refinement scheme implemented by HAMMER is also included in the proposed RABBIT algorithm. The experimental results show that RABBIT has potential to achieve accurate deformable image registration with reduced computational cost, and improve the accuracy of image registration implemented by a statistical deformable model (Loeckx et al., 2003; Wouters et al., 2006).
We have examined how the sample data and PCA space sampling affects the registration performance. It shows that the statistical deformation model built on more training data has better ability to represent the deformation fields. When a sufficient number of samples are used for training, the representation power of deformation model is improved slightly with inclusion of more training samples. We also examine how the number of eigenvectors used in the deformation model affects the performance of intermediate template estimation, as well as the overall registration performance of RABBIT. In particular, the deformation models with more eigenvectors can better capture the brain deformations, but their registration accuracy cannot be guaranteed to be improved since the captured deformations from training samples might still not be able to represent the particular deformations of a new individual brain under registration, due to possibly the limited number of the available training samples. Although more sophisticated statistical deformation model can be applied, such as wavelet-PCA (Xue et al., 2006a, b), the dramatically increased parameters needed to represent the deformation fields inevitably increase the complexity and cost of the computation. As demonstrated in the experiments, a simple PCA based deformation model, combined with the refinement scheme, seems to be an overall better way to achieve a fast and robust brain registration. We also examine how the number of training samples affects the final results. Our results show that, when sufficient number of samples is used for training (i.e., 50), the performance of final registration is improved very little even more samples are included as additional training samples.
It is worth indicating that the registration framework proposed in this paper is general enough to adopt other registration algorithms to build a statistical deformation model as well as to perform the registration refinement. In this paper, HAMMER is used as a particular example to refine the registration result obtained from the statistical deformation model.
In conclusion, RABBIT has been applied to the spatial normalization of both simulated and real MR brain images, and its performance has been compared with a particular brain registration algorithm, e.g., HAMMER. The experimental results demonstrate that RABBIT can achieve over five times speedup compared to HAMMER, and it can also improve the statistical power in detection of simulated and real brain atrophies.
Footnotes
Publisher's Disclaimer: This is a PDF file of an unedited manuscript that has been accepted for publication. As a service to our customers we are providing this early version of the manuscript. The manuscript will undergo copy editing, typesetting, and review of the resulting proof before it is published in its final citable form. Please note that during the production process errors may be discovered which could affect the content, and all legal disclaimers that apply to the journal pertain.
References
- Ashburner J, Csernansky JG, Davatzikos C, Fox NC, Frisoni GB, Thompson PM. Computer-assisted imaging to assess brain structure in healthy and diseased brains. The Lancet (Neurology) 2003;2:79–88. doi: 10.1016/s1474-4422(03)00304-1. [DOI] [PubMed] [Google Scholar]
- Ashburner J, Friston KJ. Nonlinear spatial normalization using basis functions. Human Brain Mapping. 1999;7:254–266. doi: 10.1002/(SICI)1097-0193(1999)7:4<254::AID-HBM4>3.0.CO;2-G. [DOI] [PMC free article] [PubMed] [Google Scholar]
- Ashburner J, Friston KJ. Voxel-based morphometry: the methods. Neuroimage. 2000;11:805–821. doi: 10.1006/nimg.2000.0582. [DOI] [PubMed] [Google Scholar]
- Bajcsy R, Kovacic S. Multiresolution elastic matching. Computer Vision, Graphics, and Image Processing. 1989;46:1–21. [Google Scholar]
- Beresford T, Arciniegas D, Alfers J, Clapp L, Martin B, Beresford H, Du Y, Liu D, Shen D, Davatzikos C, Laudenslager M. Hypercortisolism In Alcohol Dependence and Its Relation to Hippocampal Volume Loss. Journal of Studies on Alcohol. 2006;67:861–867. doi: 10.15288/jsa.2006.67.861. [DOI] [PubMed] [Google Scholar]
- Bozzali M, Filippi M, Magnani G, Cercignani M, Franceschi M, Schiatti E, Castiglioni S, Mossini R, Falautano M, Scotti G, Comi G, Falini A. The contribution of voxel-based morphometry in staging patients with mild cognitive impairment. Neurology. 2006;67:453–460. doi: 10.1212/01.wnl.0000228243.56665.c2. [DOI] [PubMed] [Google Scholar]
- Busatto GF, Garrido GEJ, Almeida OP, Castro CC, Camargo CHP, Cid CG, Buchpiguel CA, Furuie S, Bottino CM. A voxel-based morphometry study of temporal lobe gray matter reductions in Alzheimer’s disease. Neurobiology of Aging. 2003;24:221–231. doi: 10.1016/s0197-4580(02)00084-2. [DOI] [PubMed] [Google Scholar]
- Chetelat G, Baron JC. Early diagnosis of alzheimer’s disease: contribution of structural neuroimaging. 2003:525–541. doi: 10.1016/s1053-8119(02)00026-5. [DOI] [PubMed] [Google Scholar]
- Christensen G, Rabbitt RD, Miller MI. Deformable templates using large 19 deformation kinematics. IEEE Transactions on Image Processing. 1996;5:1435–1447. doi: 10.1109/83.536892. [DOI] [PubMed] [Google Scholar]
- Christensen GE, Geng X, Kuhl JG, Bruss J, Grabowski TJ, Pirwani LA, Vannier MW, Allen JS, Damasio H. Introduction to the non-rigid image egistration evaluation project (NIREP). Third International Workshop on Biomedical Image Registration, (WBIR2006).2006. [Google Scholar]
- Chui H, Rangarajan A. A new point matching algorithm for non-rigid registration. Computer Vision and Image Understanding. 2003;89:114–141. [Google Scholar]
- Collins DL, Neelin P, Peters TM, Evans AC. Automatic 3D intersubject registration of MR volumetric data in standardized Talairach space. Journal of Computer Assisted Tomography. 1994;18:192–205. [PubMed] [Google Scholar]
- Convit A, De Leon MJ, Tarshish C, De Santi S, Tsui W, Rusinek H, George A. Specific hippocampal volume reductions in individuals at risk for Alzheimer’s disease. Neurobiology of Aging. 1997;18:131–138. doi: 10.1016/s0197-4580(97)00001-8. [DOI] [PubMed] [Google Scholar]
- Cootes TF, Cooper D, Taylor CJ, Graham J. Active shape models-their training and application. Computer Vision and Image Understanding. 1995;16:38–59. [Google Scholar]
- Cootes TF, Hill A, Taylor CJ, Haslam J. Use of active shape models for locating structures in medical images. Image and Vision Computing. 1994;12:355–365. [Google Scholar]
- Cootes TF, Taylor CJ. Combining point distribution models with shape models based on finite element analysis. Image and Vision Computing. 1995;13:403–409. [Google Scholar]
- Cuenod CA, Denys A, Michot JL, Jehenson P, Forette F, Kaplan D, Syrota A, Boiler F. Amygdala atrophy in Alzheimer’s disease. An in vivo magnetic resonance imaging study. Archives of Neurology. 1993;50:941–945. doi: 10.1001/archneur.1993.00540090046009. [DOI] [PubMed] [Google Scholar]
- Davatzikos C, Gene A, Xu D, Resnick SM. Voxel-Based Morphometry Using the RAVENS Maps: Methods and Validation Using Simulated Longitudinal Atrophy. Neuroimage. 2001;14:1361–1369. doi: 10.1006/nimg.2001.0937. [DOI] [PubMed] [Google Scholar]
- Davatzikos C, Shen DG, Wu X, Lao Z, Hughett P, Turetsky BI, Gur RC, Gur RE. Whole-brain morphometric study of schizophrenia reveals a spatially complex set of focal abnormalities. JAMA Archives of General Psychiatry. 2005;62:1218–1227. doi: 10.1001/archpsyc.62.11.1218. [DOI] [PubMed] [Google Scholar]
- De Santi S, de Leon MJ, Rusinek H, Convit A, Tarshish CY, Roche A, Tsui WH, Kandil E, Boppana M, Daisley K, Wang GJ, Schlyer D, Fowler J. Hippocampal formation glucose metabolism and volume losses in MCI and AD. Neurobiology of Aging. 2001;22:529–539. doi: 10.1016/s0197-4580(01)00230-5. [DOI] [PubMed] [Google Scholar]
- Du AT, Schuff N, Amend D, Laakso MP, Hsu YY, Jagust WJ, Yaffe K, Kramer JH, Reed B, Norman D, Chui HC, Weiner MW. Magnetic resonance imaging of the entorhinal cortex and hippocampus in mild cognitive impairment and Alzheimer’s disease. Journal of Neurology Neurosurgery and Psychiatry. 2001;71:441–447. doi: 10.1136/jnnp.71.4.441. [DOI] [PMC free article] [PubMed] [Google Scholar]
- Evans AC, Dai W, Collins L, Neelin P, Marrett S. Warping of a computerized 3D atlas to match brain image volumes for quantitative neuroanatomical and functional analysis. SPIE Proc, Image Proc Algorithms and Techniques. 1991;1445:236–246. [Google Scholar]
- Fan Y, Batmanghelich N, Clark CM, Davatzikos C. Spatial patterns of brain atrophy in MCI patients, identified via high-dimensional pattern classification, predict subsequent cognitive decline. Neuroimage. 2008;39:1731–1743. doi: 10.1016/j.neuroimage.2007.10.031. [DOI] [PMC free article] [PubMed] [Google Scholar]
- Ferrant M, Warfield S, Nabavi A, Macq B, Kikinis R. Registration of 3D intraoperative MR images of the brain using a finite element biomechanical model. Third International Conference on Medical Image Computing and Computer-assisted Intervention; Pittsburgh, PA. 2000. [Google Scholar]
- Fox NC, Freeborough PA, Rossor MN. Visualisation and quantification of rates of atrophy in Alzheimer’s disease. Lancet. 1996;348:94–97. doi: 10.1016/s0140-6736(96)05228-2. [DOI] [PubMed] [Google Scholar]
- Freeborough PA, Fox NC. Modeling Brain Deformations in Alzheimer’s Disease by Fluid Registration of Serial 3D MR Images. Journal of Computer Assisted Tomography. 1998;22:838–843. doi: 10.1097/00004728-199809000-00031. [DOI] [PubMed] [Google Scholar]
- Frisoni GB, Pievani M, Testa C, Sabattoli F, Bresciani L, Bonetti M, Beltramello A, Hayashi KM, Toga AW, Thompson PM. The topography of grey matter involvement in early and late onset Alzheimer’s disease. Brain. 2007;130:720–730. doi: 10.1093/brain/awl377. [DOI] [PubMed] [Google Scholar]
- Gee JC, Reivich M, Bajcsy R. Elastically deforming 3D atlas to match anatomical brain images. Journal of Computer Assisted Tomography. 1993;17:225–236. doi: 10.1097/00004728-199303000-00011. [DOI] [PubMed] [Google Scholar]
- Goldszal AF, Davatzikos C, Pham D, Yan M, Bryan RN, Resnick SM. An image processing protocol for the analysis of MR images from an elderly population. Journal of Computer Assisted Tomography. 1998;22:827–837. doi: 10.1097/00004728-199809000-00030. [DOI] [PubMed] [Google Scholar]
- Grundman M, Sencakova D, Jack CJ, Petersen R, Kim H, Schultz A, Weiner M, DeCarli C, DeKosky S, van Dyck C, Thomas R, Thai L. Brain MRI hippocampal volume and prediction of clinical status in a mild cognitive impairment trial. Journal of Molecular Neuroscience. 2002;19:23–27. doi: 10.1007/s12031-002-0006-6. [DOI] [PubMed] [Google Scholar]
- Jack CJ, Petersen R, Xu Y, O’Brien P, Smith G, Ivnik R, Boeve B, Tangalos E, Kokmen E. Rates of hippocampal atrophy correlate with change in clinical status in aging and AD. Neurology. 2000;55:484–489. doi: 10.1212/wnl.55.4.484. [DOI] [PMC free article] [PubMed] [Google Scholar]
- Jack CR, Petersen RC, YCX, O’Brien PC, Smith GE, Ivnik RJ, Boeve BF, Waring SC, Tangalos E, Kokmen E. Prediction of AD with MRI-based hippocampal volume in mild cognitive impairment. Neurology. 1999;52:1397–1403. doi: 10.1212/wnl.52.7.1397. [DOI] [PMC free article] [PubMed] [Google Scholar]
- Johnson HJ, Christensen GE. Consistent landmark and intensity-based image registration. IEEE Transactions on Medical Imaging. 2002;21:450–461. doi: 10.1109/TMI.2002.1009381. [DOI] [PubMed] [Google Scholar]
- Kabani N, MacDonald JD, Holmes CJ, Evans AC. A 3D atlas of the human brain. Neuroimage. 1998:7. [Google Scholar]
- Karas GB, Scheltens P, Rombouts SARB, Visser PJ, Schijndel RAv, Fox NC, Barkhof F. Global and local gray matter loss in mild cognitive impairment and Alzheimer’s disease. Neuroimage. 2004;23:708–716. doi: 10.1016/j.neuroimage.2004.07.006. [DOI] [PubMed] [Google Scholar]
- Kelemen A, Szekely G, Gerig G. Elastic model-based segmentation of 3-D neuroradiological data sets. IEEE Transactions on Medical Imaging. 1999;18:828–839. doi: 10.1109/42.811260. [DOI] [PubMed] [Google Scholar]
- Lázaro-Gredilla M, Quiñonero-Candela J, Figueiras-Vidal A. Sparse Spectral Sampling Gaussian Processes. 2007. Technical Report MSR-TR-2007–152, http://www.research.microsoft.com.
- Lilliefors HW. On the Kolmogorov-Smirnov test for the exponential distribution with mean unknown. Journal of the American Statistical Association. 1969;64:387–389. [Google Scholar]
- Loeckx D, Maes F, Vandermeulen D, Suetens P. Non-rigid image registration using a statistical spline deformation model. IPMI 2003. 2003:463–474. doi: 10.1007/978-3-540-45087-0_39. [DOI] [PubMed] [Google Scholar]
- Luan H, Qi F, Xue Z, Chen L, Shen D. Multimodality Image Registration by Maximization of Quantitative-Qualitative Measure of Mutual Information. Pattern Recognition. 2008;41:285–298. [Google Scholar]
- Marcus DS, Wang TH, Parker J, Csernansky JG, Morris JC, Buckner RL. Open Access Series of Imaging Studies (OASIS): Cross-sectional MRI Data in Young, Middle Aged, Nondemented, and Demented Older Adults. Journal of Cognitive Neuroscience. 2007;19:1498–1507. doi: 10.1162/jocn.2007.19.9.1498. [DOI] [PubMed] [Google Scholar]
- Pennanen C, Testa C, Laakso MP, Hallikainen M, Helkala EL, Hanninen T, Kivipelto M, Kononen M, Nissinen A, Tervo S, Vanhanen M, Vanninen R, Frisoni GB, Soininen H. A voxel based morphometry study on mild cognitive impairment. Journal of Neurology Neurosurgery and Psychiatry. 2005;76:11–14. doi: 10.1136/jnnp.2004.035600. [DOI] [PMC free article] [PubMed] [Google Scholar]
- Press W, Teukolsky S, Vetterling W, Flannery B. Numerical Recipes in C. Cambridge University Press.; 1992. [Google Scholar]
- Prima S, Thirion JP, Subsol G, Roberts N. Automatic analysis of normal brain dyssymetry of males and females in MR images. MICCAI. 1998:770–779. [Google Scholar]
- Resnick SM, Pham DL, Kraut MA, Zonderman AB, Davatzikos C. Longitudinal Magnetic Resonance Imaging Studies of Older Adults: A Shrinking Brain. The Journal of Neuroscience. 2003;23:295–301. doi: 10.1523/JNEUROSCI.23-08-03295.2003. [DOI] [PMC free article] [PubMed] [Google Scholar]
- Rueckert D, Sonoda LI, Hayes C, Hill DLG, Leach MO, Hawkes DJ. Non-rigid registration using free-form deformations: Application to breast MR images. IEEE Transactions on Medical Imaging. 1999;18:712–721. doi: 10.1109/42.796284. [DOI] [PubMed] [Google Scholar]
- Saykin AJ, Wishart HA, Rabin LA, Santulli RB, Flashman LA, West JD, McHugh TL, Mamourian AC. Older adults with cognitive complaints show brain atrophy similar to that of amnestic MCI. Neurology. 2006;67:834–842. doi: 10.1212/01.wnl.0000234032.77541.a2. [DOI] [PMC free article] [PubMed] [Google Scholar]
- Shen D, Davatzikos C. HAMMER: Hierarchical attribute matching mechanism for elastic registration. IEEE Transactions on Medical Imaging. 2002;21:1421–1439. doi: 10.1109/TMI.2002.803111. [DOI] [PubMed] [Google Scholar]
- Shen DG, Davatzikos C. Very high resolution morphometry using mass-preserving deformations and HAMMER elastic registration. Neuroimage. 2003;18:28–41. doi: 10.1006/nimg.2002.1301. [DOI] [PubMed] [Google Scholar]
- Thirion JP. Non-rigid matching using deamons. Proceedings of IEEE Conference on Computer Vision and Pattern Recognition.1996. [Google Scholar]
- Thompson P, Toga AW. A surface-based technique for warping three-dimensional images of the brain. IEEE Transactions on Medical Imaging. 1996;15:402–417. doi: 10.1109/42.511745. [DOI] [PubMed] [Google Scholar]
- Thompson P, Vidal C, Giedd J, Gochman P, Blumenthal J, Nicolson R, Toga A, Rapoport J. Mapping adolesent brain change reveals dynamic wave of accelerated gray matter loss in very early-onset schizophrenia. Proceedings of the National Academy of Sciences. 2001;98:11650–11655. doi: 10.1073/pnas.201243998. [DOI] [PMC free article] [PubMed] [Google Scholar]
- Wouters J, D’Agostino E, Maes F, Vandermeulen D, Suetens P. Non-rigid brain image registration using a statistical deformation model. In: Joseph M, Reinhardt JPWP, editors. Medical Imaging 2006: Image Processing. 2006. [Google Scholar]
- Xu Y, Jack CR, Jr, O’Brien PC, Kokmen E, Smith GE, Ivnik RJ, Boeve BF, Tangalos RG, Petersen RC. Usefulness of MRI measures of entorhinal cortex versus hippocampus in AD. Neurology. 2000;54:1760–1767. doi: 10.1212/wnl.54.9.1760. [DOI] [PubMed] [Google Scholar]
- Xue Z, Shen D. Statistically-Constrained Deformable Registration of MR Brain Images. IEEE International Symposium on Biomedical Imaging (ISBI 2007); Arlington, VA, USA. 2007. pp. 25–28. [Google Scholar]
- Xue Z, Shen D, Davatzikos C. Statistical Representation of High-Dimensional Deformation Fields with Application to Statistically-Constrained 3D Warping. Medical Image Analysis. 2006a;10:740–751. doi: 10.1016/j.media.2006.06.007. [DOI] [PubMed] [Google Scholar]
- Xue Z, Shen D, Davatzikos C. Statistically-Constrained High-Dimensional Warping Using Wavelet-Based Priors. Proceedings of IEEE Computer Society Workshop on Mathematical Methods in Biomedical Image Analysis (MMBIA 2006); New York City, NY, USA. 2006b. [Google Scholar]
- Xue Z, Shen D, Karacali B, Stern J, Rottenberg D, Davatzikos C. Simulating deformations of MR brain images for validation of atlas-based segmentation and registration algorithms. Neuroimage. 2006c;33:855–866. doi: 10.1016/j.neuroimage.2006.08.007. [DOI] [PMC free article] [PubMed] [Google Scholar]
- Zacharaki EI, Shen D, Davatzikos CA. Parallel optimization of tumor model parameters for fast registration of brain tumor images. SPIE Medical Imaging; San Diego: 2008. [Google Scholar]
- Zhuang X, Rhode K, Arridge S, Razavi R, Hill D, Hawkes D, Ourselin S. An Atlas-Based Segmentation Propagation Framework Using Locally Affine Registration - Application to Automatic Whole Heart segmentation. Medical Image Computing and Computer-Assisted Intervention - MICCAI 2008 LNCS. 2008;5242:425–432. doi: 10.1007/978-3-540-85990-1_51. [DOI] [PubMed] [Google Scholar]
- Zitova B, Flusser J. Image registration methods: a survey. Image and Vision Computing. 2003;21:977–1000. [Google Scholar]