

Abstract
The bag-of-features method has emerged as a useful and flexible tool that can capture medically relevant image characteristics. In this paper, we study the effect of scale and rotation invariance in the bag-of-features framework for Renal Cell Carcinoma subtype classification. We estimated the performance of different features by linear support vector machine over 10 iterations of 3-fold cross validation. For a very heterogeneous dataset labeled by an expert pathologist, we achieve a classification accuracy of 88% with four subtypes. Our study shows that rotation invariance is more important than scale invariance but combining both properties gives better classification performance.
Keywords: Bag-of-features Method, Texton-based Approach, Image Classification, Computer Aided Diagnosis
1 Introduction
Renal Cell Carcinoma (RCC) accounts for 90–95% of adult malignancies arising from the kidney [1]. The American Cancer Society reported 58,240 new cases and 13,040 deaths in 2010 [1]. RCC occurs in four major subtypes: (i) Clear Cell (CC), (ii) Chromophobe (CH), (iii) Oncocytoma (ON), and (iv) Papillary (PA) [2]. Clinically, each subtype is treated differently. The task of subtype classification is performed by an expert pathologist under a microscope and suffers from subjectivity and observer variability [3]. Computerized histopathological image analysis aims at assisting a pathologist in the decision making process.
Recently, the bag-of-features approach has emerged as a useful tool for medical image classification [4–7]. The bag-of-features framework evolved from the bag-of-words model for text documents [8]. In the bag-of-words model, a dictionary is built from all the text documents and then each document is represented by the frequency of words in that document. The bag-of-features approach applies a similar methodology to image analysis. Images are divided into a collection of small patches, each of which described by a feature vector that encodes texture/content. Feature vectors are combined into a codebook that represents the characteristic patches in a collection of images. Typically, scale and rotation invariant features or raw pixel intensities are used [4–7]. Depending on the application, scenarios may exist where one or both could help or hurt performance. For example, cancer grading based on nucleus size may suffer from scale invariant features. However, there is no study exploring the impact of scale or rotation invariance for histopathological image analysis. In this paper, we perform an analysis of features with combinations of scale and rotation invariance in the bag-of-features framework. We have focused on the scale invariant feature transform (SIFT) to perform the analysis but other features such as speeded-up robust features (SURF) can also be used [9,10].
In histopathological image analysis, medically relevant morphologies can appear anywhere in the image and the spatial arrangement may not be important for decision making. Therefore, we do not consider spatial information preserving methods such as spatial pyramids [11]. In this paper, we evaluate the impact of scale and rotation invariance by studying the following types of features: (i) scale invariant features, (ii) rotation invariant features, (iii) features with both scale and rotation invariance, (iv) features with neither scale nor rotation invariance, and (v) raw pixel intensity based features. We evaluate their effect on histopathological image classification of RCC subtypes. This paper is organized as follows: section 2 provides backround; section 3 provides methodology; section 4 shows the results; and section 5 concludes the analysis.
2 Background
A bag-of-features represents each image as a collection of features or patches. The relative abundance of each feature or patch distinguishes different types of images. These features or patches can be represented as invariant to scale and orientation. In this section, we provide the background of how this scale and rotation invariance is achieved. To achieve scale invariance, keypoints are selected by difference of Gaussian scale space (DoGSS) filtering [9]. The Gaussian scale space (GSS) of an image I(x, y) is constructed by convolving that image with a Gaussian filter tt(x, y, σ) of different scales:
where x and y are pixel coordinates, σi is the standard deviation of the Gaussian filter for scale i. We use previously reported values of σi = kiσ0, σ0 = 1.6, and [9]. Then DoGSS is computed by subtracting two consecutive images in the GSS:
| (1) |
Keypoints are detected by finding the extremas in DoGSS by comparing each pixel at Di with its 3 × 3 neighborhood at scales Di, Di−1 and Di+1 (i.e., 26 comparison in total). These keypoints appear in a single scale and additional scales can be achieved after downsampling and repeating [9]. A patch around each keypoint is encoded using SIFT to get a feature vector that represents the texture. To make the patch rotation invariant, the pixel coordinates x, y in the patch are rotated to align with the maximal gradient direction θ of that patch:
where the pixel coordinates x, y are expressed with respect to the center of that patch. Another approach is to select the keypoints by dense sampling and encode the patch with raw pixel intensities to compute the features [4, 5]. After the features have been extracted from the images, codebook construction, image representation, and classification follows, as explained earlier (Figure 1).
Fig. 1.
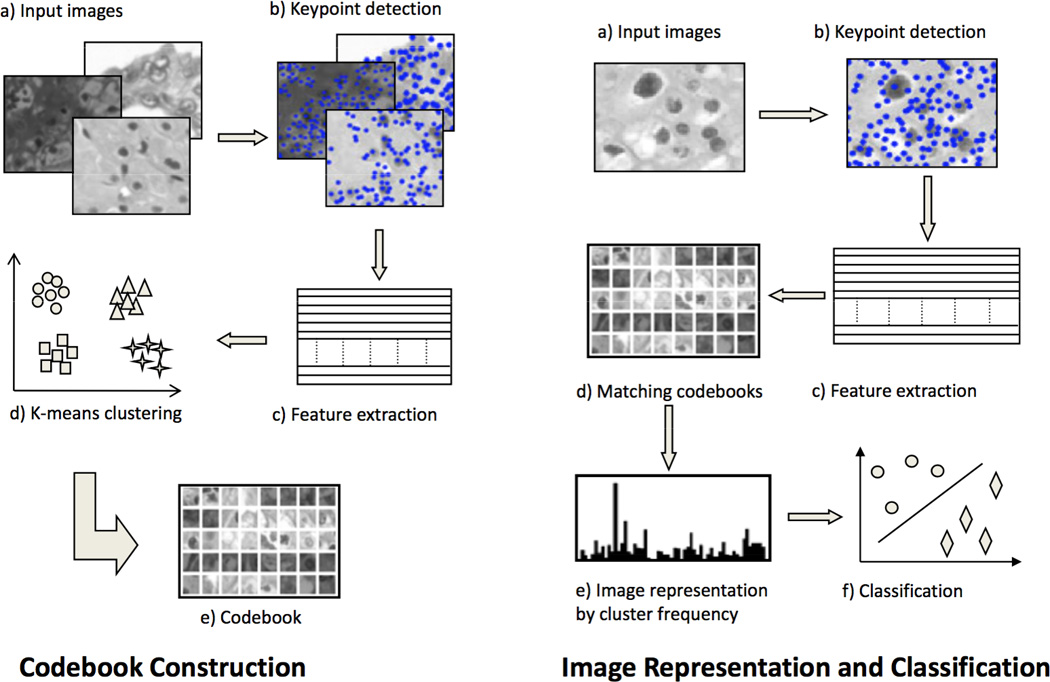
Bag-of-features framework: (left) first, a codebook is constructed using k-means clustering over features extracted from training images only, (right) then, the codebook is used to generate a vector representation of each image using frequency of each cluster
3 Methods
The tissue samples are resected from renal tumors by total nephrectomy. Tissue samples of 3-millimeter thickness are obtained and fixed overnight in 10% neutral buffered formalin. Samples are then embedded in paraffin and microscopic sections of 5 micrometer thickness are prepared by a microtome and stained with hematoxylin and eosin. Photomicrographs of renal tumors are captured with 200× total magnification at 1200 × 1600 pixels per image. A total of 106 images are captured, 32 of Chromophobe, 29 of Clear Cell, 28 of Papillary, and 17 of Oncocytoma. The images were labeled by an expert pathologist.
Figure 1 provides an overview of the bag-of-features approach. First, images are converted to gray scale and keypoints are selected to extract features. Features extracted from all the training images are used for constructing a codebook using k-means clustering (left of Figure 1). Next, a feature vector is constructed for each image by matching all the features from that image with the codebook (right of Figure 1). This feature vector is called a bag-of-features [8]. It represents the distribution of each cluster from the codebook in that image and does not account for their spatial relationship. A support vector machine (SVM) is trained with feature vectors from the training images and is used to classify the test images. Only the training set is used for learning the codebook and training the SVM.
To perform the analysis of scale and rotation invariance of features used in the bag-of-features framework for histopathological image classification, we adopted the following four strategies for keypoint selection and feature extraction based on the SIFT methodology. In the first strategy, we selected keypoints using DoGSS (Eq. 1) and computed SIFT descriptors invariant to orientation (Eq. 2) giving the standard SIFT features [9]. For DoGSS, we included the keypoints detected from scales D−1 to D2 in our analysis. In each image about 6000 to 8000 keypoints were detected, 38% of total keypoints were detected at scale D−1, 37% at scale D0, 13% at scale D1 and, 12% were detected at scale D2. In the second strategy, we again included the keypoints from DOGSS but SIFT descriptors are computed by choosing a fixed orientation θ = 0 in Eq. 2, resulting in only scale invariant features. In the third strategy, we computed the rotation invariant descriptors for a variety of fixed scales D−1 to D2. In the last strategy, we used the keypoints from Difference of Gaussian (DoG) at scale D0 and computed SIFT descriptors using θ = 0, giving features with fixed scale and orientation. Furthermore, we densely sampled 7000 keypoints from each image and computed rotation invariant features (for scales D−1 to D2), features with fixed scale D0 and orientation θ = 0, and raw pixel intensity based features. Raw pixel intensity based features are computed over an area of 9 × 9 around the keypoint (i.e., fixed scale and orientation) [4, 5]. Table 1 summarizes keypoint detection and feature extraction for this paper.
Table 1.
Summary of keypoint detection and feature extraction
| Scale Inv. | Rotation Inv. | Keypoint Detection | Features |
|---|---|---|---|
| Yes | Yes | DoGSS | Scale & Rotation Invariance |
| Yes | No | DoGSS | Scale Invariance |
| No | Yes | DoG | Rotation Invariance |
| No | Yes | Dense sampling | Rotation Invariance |
| No | No | DoG | No Invariance |
| No | No | Dense sampling | No Invariance |
| No | No | Dense sampling | No Invariance (Raw Intensity) |
We used a linear SVM with soft margin parameter C = 1 for classification [12]. Since SVM is a binary classifier, we adopted the “one vs. one with max voting” method to perform multiclass classification [12]. We performed 10 iterations of stratified 3-fold cross validation to estimate the performance.
4 Results and Discussion
Figure 2 illustrates the different types of features extracted with and without scale and rotation invariance. Figure 2a shows image patches with fixed scale D0 and orientation θ = 0. Because these patches have the same size (i.e., scale) and orientation, they don’t have the ability to match similar patches with different scale or orientation. Figure 2b shows patches with different scales but without rotation. Figure 2c shows image patches with rotation at a fixed scale D0. Figure 2d shows image patches with both scale and rotation invariance.
Fig. 2.
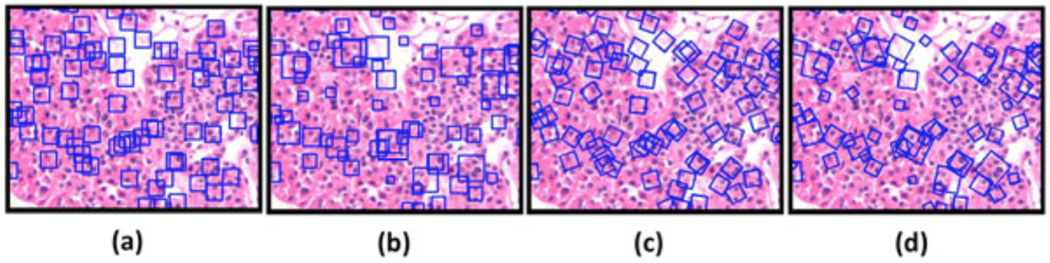
The squares show the image patches selected for descriptor computation: (a) fixed scale D0 and fixed orientation, (b) scale invariant, (c) fixed scale D0 and rotation invariant, and (d) scale and rotation invariant.
Figure 3 shows the performance comparison of different types of features in the bag-of-features framework for histopathological image classification of RCC subtypes. The plot shows that features with both scale and rotation invariance give better performance (top curve). A codebook of size 100 gives a classification accuracy of 88%. Features with rotation invariance also perform very well but features without rotation invariance perform poorly (lower four curves). For both dense sampling and fixed scale keypoint detection, we found that scale D0 provided better top performance across codebook sizes and only plot D0 for scale invariant performance in Figure 3. Specifically, rotation invariant features for dense sampling give a maximum classification accuracy of 84.1% at D−1, 84.3% at D0, 82.9% at D1, and 80% at D2. For DoG keypoint detection, rotation invariant features give a maximum classification accuracy of 83.9%, 84.9%, 82.7%, and 81.2% at scales D−1, D0, D1, and D2, respectively.
Fig. 3.
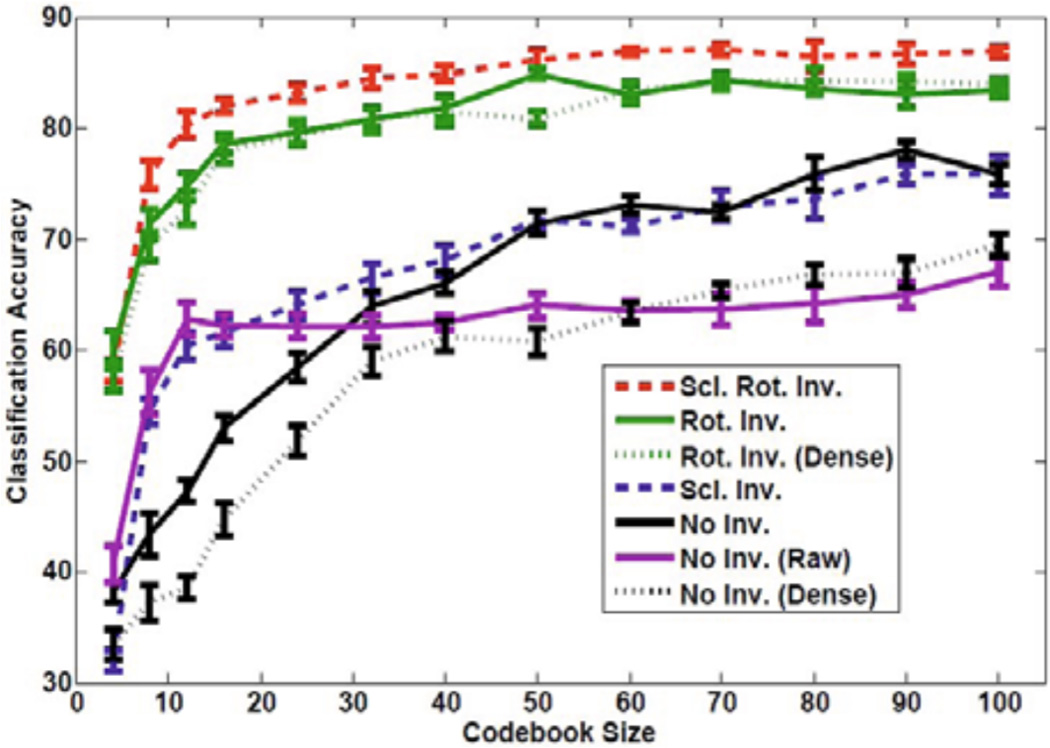
Performance of different features in bag-of-features framework for histopathological image classification of RCC subtypes. Error bars show standard deviation of the means. Legend is in order with the curves in the plot at a codebook of size 45.
Figure 4 illustrates the difference of DoGSS and dense sampling keypoint selection strategies. The keypoints detected by DoGSS are dense in cellular regions and sparse in necrotic regions, whereas dense sampling selects keypoints that are dense in both cellular and necrotic regions. For RCC subtype classification, ignoring necrotic regions can improve classification accuracy [13]. We observe 5–10% improvement for features without scale and rotation invariance, partially confirming this finding. On the other hand, if the features are rotation invariant, we do not observe this effect. We speculate that smooth areas like necrotic regions have essentially random orientation. When the features are rotation invariant, the smooth necrotic regions get assigned to only a few clusters. However, when the features are not rotation invariant, the codebook must allocate a larger fraction of clusters to represent this randomness, thereby degrading performance. Table 2 gives the confusion matrices for each approach. It should be noted that incorporating the rotation invariance improves classification accuracy of each subtype as well as the overall classification accuracy. Furthermore, the confusion matrices for rotation invariant features are also very similar (Table 2d–e), i.e., both keypoint detection methods give similar performance for each subtype.
Fig. 4.
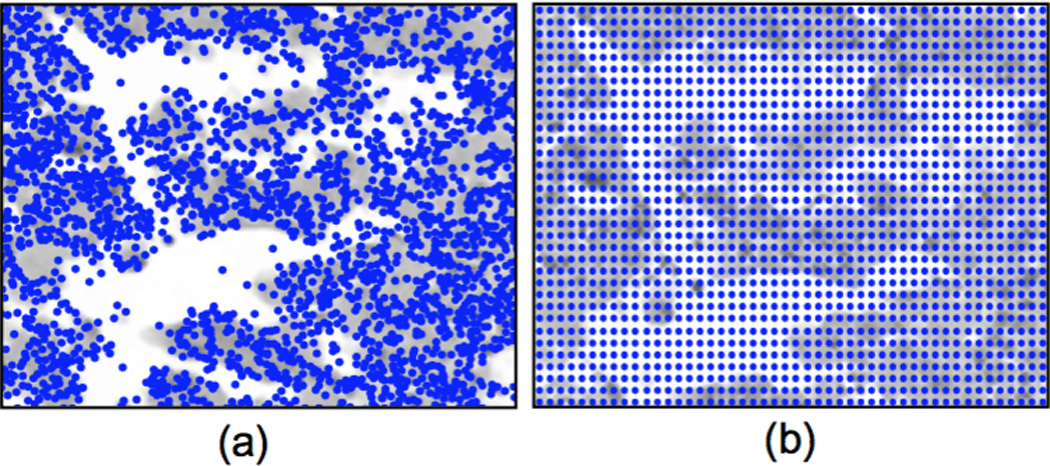
Comparison of keypoint selection: (a) DoGSS, (b) Dense sampling
Table 2.
Average confusion matrices for six types of features over 10 iterations of 3-fold cross-validation for a codebook of size 40 clusters. Each row shows the true class labels and columns show predicted labels. Each row sums to the total number of images in that subtype.
| (a) No Inv. | ||||
|---|---|---|---|---|
| CC | CH | ON | PA | |
| CC | 19.5 | 8.1 | 0.9 | 0.5 |
| CH | 10.0 | 18.2 | 2.9 | 0.9 |
| ON | 1.8 | 5.9 | 8.5 | 0.8 |
| PA | 1.5 | 1.2 | 1.5 | 23.8 |
| (b) No Inv. (dense) | ||||
|---|---|---|---|---|
| CC | CH | ON | PA | |
| CC | 18.3 | 8.6 | 1.6 | 0.5 |
| CH | 8.4 | 18.9 | 3.0 | 1.7 |
| ON | 3.3 | 2.5 | 9.3 | 1.9 |
| PA | 3.6 | 3.2 | 2.8 | 18.4 |
| (c) Scale Inv. | ||||
|---|---|---|---|---|
| CC | CH | ON | PA | |
| CC | 19.5 | 8.4 | 1.1 | 0.0 |
| CH | 8.6 | 19.2 | 3.0 | 1.2 |
| ON | 2.0 | 4.4 | 9.6 | 1.0 |
| PA | 1.3 | 1.0 | 1.9 | 23.8 |
| (d) Rot Inv. | ||||
|---|---|---|---|---|
| CC | CH | ON | PA | |
| CC | 25.0 | 2.9 | 0.7 | 0.4 |
| CH | 5.5 | 25.4 | 1.1 | 0.0 |
| ON | 1.7 | 2.9 | 11.0 | 1.4 |
| PA | 0.7 | 0.1 | 1.8 | 25.4 |
| (e) Rot. Inv. (dense) | ||||
|---|---|---|---|---|
| CC | CH | ON | PA | |
| CC | 25.7 | 1.9 | 1.0 | 0.4 |
| CH | 4.3 | 25.6 | 1.7 | 0.4 |
| ON | 1.4 | 3.0 | 11.4 | 1.2 |
| PA | 1.1 | 0.7 | 2.5 | 23.7 |
| (f) Scale & Rot. Inv. | ||||
|---|---|---|---|---|
| CC | CH | ON | PA | |
| CC | 25.3 | 3.3 | 0.1 | 0.3 |
| CH | 3.5 | 25.9 | 2.1 | 0.5 |
| ON | 0.8 | 1.8 | 13.8 | 0.6 |
| PA | 1.4 | 0.3 | 1.3 | 25.0 |
Another advantage of using scale and rotation invariant features is that the size of the codebook required to achieve good classification accuracy is smaller than codebooks developed by other features. To achieve classification accuracy over 80%, a codebook constructed over scale and rotation invariant features requires 12 types of patches, whereas rotation invariant features require 32 types of patches. Codebooks with just scale invariance require 200 types of patches to achieve 80% classification accuracy but a codebook of up to 300 patches without scale or rotation invariance only achieves 75%. Features based on raw pixel intensities also performs poorly and a codebook of 300 patches gives a classification accuracy of about 70%. This suggest that given a large enough codebook, rotationally fixed features could eventually become equivalent to smaller rotationally invariant ones by encoding all of the possible different orientations an object can take. Figure 5 shows patches relevant to each RCC subtype identified by combining both scale and rotation invariance. Cyan squares show the cell membrane identified at different scales and orientations indicative of the clear cell subtype. Green squares show a complete round nucleus common in the oncocytoma subtype. Blue squares show a full nucleus with a halo around it indicative of the chromophobe subtype. Yellow squares show the streaks of finger-like structures characteristic of the papillary subtype.
Fig. 5.
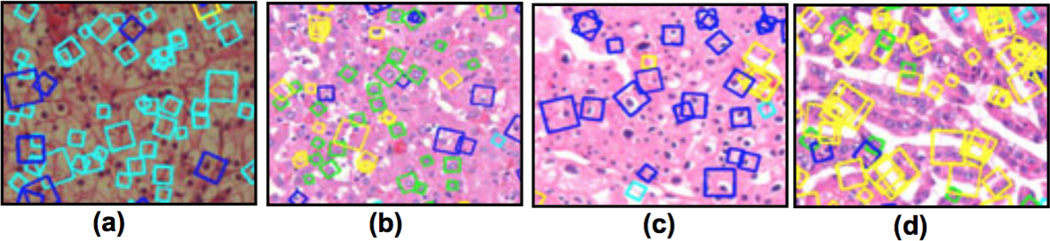
Image patches matched with codebooks constructed over scale and rotation invariant features: (a) a cell membrane in cyan squares, (b) complete round nucleus in green squares, (c) complete nucleus with halo in blue squares, (d) and yellow squares showing finger-like structures
5 Conclusion
We conclude that rotation invariance is more important than scale invariance for histopathology image classification. Rotation invariant features computed at a good choice of fixed scale perform nearly as well as scale and rotation invariant features. Therefore, covering the whole scale space may not be as important as choosing a preferred scale in histopathological image classification. Although rotation invariance combined with scale invariance performs slightly better, other applications may not benefit from this flexibility. For example, in the problem of cancer grading, nucleus size is important, and thus scale invariance may not be desirable. In the case of CT or MRI images, the pixel intensity is an important characteristic and a raw pixel intensity based feature could perform better than image gradient based features like SIFT. In the future, we would like to improve the codebooks by incorporating the class labels during the codebook generation and reduce the false positive matches by improving the distinctiveness of the features within the same codebook.
Acknowledgments
This research has been supported by grants from National Institutes of Health (Bioengineering Research Partnership R01CA108468, P20GM072069, Center for Cancer Nanotechnology Excellence U54CA119338), Georgia Cancer Coalition (Distinguished Cancer Scholar Award to Professor Wang), Hewlett Packard, and Microsoft Research.
References
- 1.National Cancer Institute - Kidney Cancer. http://www.cancer.gov/cancertopics/types/kidney.
- 2.Atlas of Genetics and Cytogenetics in Oncology and Haematology. http://www.AtlasGeneticsOncology.org. [Google Scholar]
- 3.Preti M, Mezzetti M, Robertson C, Sideri M. Inter observer variation in histopathological diagnosis and grading of vulvar intraepithelial neoplasia: results of an European collaborative study. BJOG: An International Journal of Obstetrics & Gynaecology. 2000;107:594–599. doi: 10.1111/j.1471-0528.2000.tb13298.x. [DOI] [PubMed] [Google Scholar]
- 4.Gangeh M, Sørensen L, Shaker S, Kamel M, de Bruijne M, Loog M. A Texton-Based Approach for the Classification of Lung Parenchyma in CT Images. In: Jiang T, Navab N, Pluim JPW, Viergever MA, editors. MICCAI 2010. LNCS. Vol. 6363. Heidelberg: Springer; 2010. pp. 595–602. [DOI] [PubMed] [Google Scholar]
- 5.Avni U, Greenspan H, Sharon M, Konen E, Goldberger J. IEEE International Symposium on Biomedical Imaging: From Nano to Macro. Los Alamitos: IEEE press; 2009. X-ray image categorization and retrieval using patch-based visualwords representation; pp. 350–353. [Google Scholar]
- 6.Caicedo J, Cruz A, González F. Histopathology image classification using bag of features and kernel functions. In: Combi C, Shahar Y, Abu-Hanna A, editors. AIME 2009. LNCS. Vol. 5651. Heidelberg: Springer; 2009. pp. 126–135. [Google Scholar]
- 7.Raza SH, Parry RM, Sharma Y, Chaudry Q, Moffitt RA, Young AN, Wang MD. IEEE International Conference of Engineering in Medicine and Biology Society (EMBC) Los Alamitos: IEEE press; 2010. Automated Classification of Renal Cell Carcinoma Subtypes Using Bag-of-Features; pp. 6749–6752. [DOI] [PMC free article] [PubMed] [Google Scholar]
- 8.Csurka G, Dance C, Fan L, Willamowski J, Bray C. Workshop on Statistical Learning in Computer Vision (ECCV) 01. Citeseer; 2004. Visual categorization with bags of keypoints; p. 22. [Google Scholar]
- 9.Lowe D. Distinctive image features from scale-invariant keypoints. International Journal of Computer Vision. 2004;74:59–73. [Google Scholar]
- 10.Bay H, Tuytelaars T, Gool LV. SURF: Speed Up Robust Features. In: Leonardis A, Bischof H, Pinz A, editors. ECCV 2006. LNCS. Vol. 3951. Heidelberg: Springer; 2006. pp. 404–417. [Google Scholar]
- 11.Liu YY, Chen M, Ishikawa H, Wollstein G, Schuman J, Rehg J. Auto- mated Macular Pathology Diagnosis in Retinal OCT Images Using Multi-Scale Spatial Pyramid with Local Binary Patterns. In: Jiang T, Navab N, Pluim JPW, Viergever MA, editors. MICCAI 2010. LNCS. Vol. 6361. Heidelberg: Springer; 2010. pp. 1–9. [DOI] [PMC free article] [PubMed] [Google Scholar]
- 12.Manning DC, Raghavan P, Schutze H. Introduction to information retrieval. Cambridge: Cambridge University Press; 2008. pp. 328–330. [Google Scholar]
- 13.Chaudry Q, Raza S, Sharma Y, Young A, Wang M. 8th IEEE International Conference on Bioinformatics and Bioengineering (BIBE) Los Alamitos: IEEE press; 2008. Improving renal cell carcinoma classification by automatic region of interest selection; pp. 1–6. [DOI] [PMC free article] [PubMed] [Google Scholar]