

Abstract
Background
The overexpression of transcriptional coactivator with PDZ-binding motif (TAZ), a Hippo pathway effector, was detected in a variety of cancers. However, controversies remain in published studies on the prognostic value of TAZ expression in cancer. We performed a meta-analysis to demonstrate the prognostic significance of TAZ in overall survival (OS) and its association with clinicopathologic characteristics.
Methods
A systematic literature search was performed by using PubMed, EMBASE, and Web of Science databases for eligible studies investigating the association between TAZ and survival. After extracting data, we used hazard ratio (HR), odds ratio (OR) and 95% confidence intervals (95% CIs) for association evaluation, I2 for heterogeneity across studies, and Egger’s test and Begg’s funnel plot for publication bias assessment.
Results
A total of 15 studies including 2,881 patients were analyzed. Pooled results showed that a high TAZ was significantly associated with poor OS (HR =1.82, 95% CI =1.58–2.11; I2=33%; P=0.11). Subgroup analysis indicated significant correlation between TAZ overexpression and OS in patients stratified by ethnicity, sample size, sample source, and staining location. Furthermore, TAZ overexpression was associated with worse OS in hepatocellular carcinoma (HR =2.26, 95% CI =1.43–3.57; P=0.49) and gastrointestinal cancers (HR =2.00, 95% CI =1.54–2.58; P=0.97), but not in non-small-cell lung cancer (HR =1.71, 95% CI =0.93–3.14; P=0.08). TAZ overexpression was also found to be significantly associated with some clinicopathologic characteristics, including TNM stage (OR =2.56, 95% CI =1.60–4.11; P=0.52), tumor differentiation (OR =3.08, 95% CI =1.25–7.63; P=0.01), and lymph node metastasis (OR =2.53, 95% CI =1.81–3.53; P=0.58).
Conclusion
TAZ overexpression is not only a predictive factor of poor prognosis but also associated with advanced TNM stage, poor tumor differentiation, and lymph node metastasis.
Keywords: Hippo pathway, TAZ, cancer, prognosis, meta-analysis, overall survival
Introduction
Transcriptional coactivator with PDZ-binding motif (TAZ; also known by gene name WW domain-containing transcription regulator 1, WWTR1) functions as a key effector in Hippo pathway cascade, which controls the balance between proliferation and apoptosis and regulates organ size through interaction with various transcription factors, particularly TEA domain family members.1 It has been well-documented that TAZ is involved in many cellular progresses, such as induction of proliferation, migration and increased metastatic potential, and inhibition of apoptosis, among others.2,3 Highly expressed TAZ has been observed in a broad range of cancers. Moreover, poor prognostic outcomes seem to be associated with high TAZ expression.4 However, the results are controversial. Some studies also revealed no significant association between TAZ and survival outcomes.5 We conducted this meta-analysis to address limitations of single study, as well as to find the precise significance of TAZ expression in the prognosis of various cancers.
Methods
Search strategy and selection criteria
A comprehensive search in online PubMed, EMBASE, and Web of Science databases was conducted to identify all relevant articles focusing on the association between TAZ expression and cancer prognosis published up to December 1, 2015. We used the following keywords and their combinations to search the databases: “TAZ”, “transcriptional co-activator with PDZ-binding motif”, “WWTR1”, “Hippo”, “cancer”, “carcinoma”, “neoplasm”, “tumor”, “survival”, “prognostic”, and “outcome”. References were also retrieved to find additional eligible studies.
Studies were included in our analysis if they met the following inclusion criteria: 1) the relationship between TAZ expression and prognosis of patients with various cancers was studied; 2) the association between clinicopathologic features and TAZ expression was described; 3) TAZ-positive expression was quantified by immunohistochemistry or other adequate methods; 4) subjects were categorized into high TAZ (or TAZ-positive) group and low TAZ (or TAZ-negative) group for survival analysis; 5) hazard ratio (HR) with 95% confidence intervals (CIs) was reported, or the reported data were sufficient for calculation; 6) when several studies involved the same population, only the most recent or the most comprehensive one was included; and 7) the article was published in English. Studies were excluded if they met any of the following exclusion criteria: 1) systemic review, laboratory study, case report, comment, or letter; 2) published in a language other than English; 3) provided no information on survival outcomes or survival curves; and 4) nonhuman experiments. Two authors (JF and PR) independently evaluated titles and abstracts of the articles to decide whether the full text should be further reviewed. In case of any disagreement, consensus would be reached after discussion. If this failed, the article would be excluded.
Data extraction and quality assessment
Two reviewers (JF and PR) extracted the required information from all eligible studies independently. Documented information included name of the first author, year of publication, country of origin, number of patients, age of patients, cancer type, TAZ measuring method, and HRs and their 95% CIs for survival. If both univariate and multivariate analyses were performed, HRs from multivariate analyses were extracted. For studies providing HRs, we extracted data directly; otherwise, the HRs and CIs were calculated with Tierney’s methods.6
Study quality was assessed using the Newcastle–Ottawa quality assessment scale by two independent investigators. Only studies that scored >5 were included while others were excluded in order to ensure the quality of this meta-analysis. Any disagreement was resolved by discussion. Table S1 summarizes the by-item quality scores of each study.
Statistical analysis
Pooled HRs with 95% CIs were calculated to quantify the predictive value of TAZ level on overall survival (OS). An HR >1.0 indicated poor prognosis. Pooled odds ratios (ORs) with 95% CIs were also calculated to describe the association between TAZ expression and clinicopathologic features. Heterogeneity analysis was performed using chi-square test and expressed in I2 index. Heterogeneity was considered as significant when P-value was <0.1 in chi-square test and/or an I2 measure was >50%, and then a random-effects model would be applied; otherwise, a fixed-effects model was applied. A sensitivity analysis was performed by sequential omission of individual studies. Potential publication bias was assessed using Begg’s funnel plot and Egger’s linear regression. Meta-analysis was performed using Review Manager 5 (version: 5.2, Cochrane Informatics and Knowledge Management Department; http://tech.cochrane.org/revman/download) and STATA (version 12.0, Stata-Corp LP, College Station, TX, USA). Particularly, Egger’s test and sensitivity analysis were performed with STATA. A P-value <0.05 was considered as significant.
Results
Eligible studies
The flow chart for literature search is shown in Figure 1. In brief, 341 articles were identified by primary search strategy. After title and abstract screening, 34 reviews and 270 original studies were excluded because of irrelevance to TAZ or cancer prognosis, or they were animal studies, duplicated, or not in the English language. The full texts of 37 articles were reviewed for more details and an additional 23 studies were excluded for insufficiency of survival data. Finally, 14 articles5,7–19 meeting the inclusion criteria were included. The study by Yuen et al included survival analyses for two different cohorts.12 Thus, a total of 15 studies including 2,881 patients were analyzed in this meta-analysis. All the eligible studies were published from 2012 to 2015, of which 12 were conducted in Asia and two otherwise. Cancer types enrolled in these studies included non-small-cell lung cancer (NSCLC), hepatocellular carcinoma (HCC), colon carcinoma, colorectal carcinoma, oral squamous cell carcinoma, tongue squamous cell carcinoma, adenocarcinoma of the esophagogastric junction, breast cancer (BC), glioblastoma multiforme, and retinoblastoma. Formalin-fixed and paraffin-embedded sample processing method was applied in nine studies, while the other six studies used tissue microarray. Immunohistochemistry was used to detect TAZ expression in all studies. TAZ expression was tested by nuclear staining in two studies or by both nuclear and cytoplasmic stainings (for overall TAZ expression) in 13 studies. Furthermore, the association between TAZ and OS was analyzed in 13 studies; disease-free survival (DFS) in the study by Wang et al;13 and OS and progression-free survival (PFS) in the study by Zhang et al.19 The main characteristics of the enrolled studies are summarized in Table 1.
Figure 1.
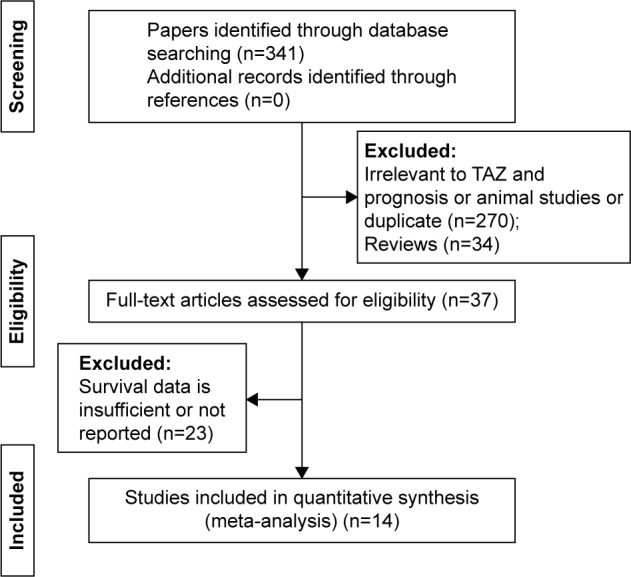
Flow diagram of the inclusion and exclusion of studies.
Table 1.
Main characteristics of the eligible studies included in the meta-analysis
| Author | Cancer types | Year | Country | Age (year) |
Follow-up time (month) | Patient number (TAZ-negative/-positive) | Staining location | Method of detection | Method of HR estimation | HR (95% CI) | Outcome |
|---|---|---|---|---|---|---|---|---|---|---|---|
| Xie et al11 | NSCLC | 2012 | People’s Republic of China | <65 101 ≥65 80 |
Range 8–73 Median 62.1 |
181 (60/121) | Nucleus and cytoplasm | FFPE tissues | Reported | 2.54 (1.30–4.941) | OS |
| Noguchi et al7 | NSCLC | 2014 | Japan | ≤70 233 >70 112 |
.120 | 355 (249/96) | Nucleus and cytoplasm | Microarray | Reported | 1.34 (1.01–1.76) | OS |
| Guo et al10 | HCC | 2015 | People’s Republic of China | <55 95 ≥55 85 |
.60 | 180 (66/114) | Nucleus and cytoplasm | FFPE tissues | Data extrapolated | 1.93 (1.51–3.70) | OS |
| Xiao et al9 | HCC | 2015 | People’s Republic of China | ≤50 23 >50 60 |
.60 | 83 (29/54) | Nucleus and cytoplasm | FFPE tissues | Data extrapolated | 2.89 (1.81–4.38) | OS |
| Han et al5 | HCC | 2014 | People’s Republic of China | <55 23 ≥55 16 |
Median 19.5 | 39 (13/26) | Nucleus and cytoplasm | FFPE tissues | Reported | 1.962 (0.514–7.499) | OS |
| Yuen et al12 | Colon cancer | 2013 | People’s Republic of China | – – |
– – |
226 (111/115) 232 (116/116) |
Nucleus and cytoplasm | Microarray Microarray |
Reported Reported |
2.062 (1.472–3.116) 1.998 (1.245–3.205) |
OS OS |
| Wang et al13 | CRC | 2013 | Singapore | <60 85 ≥60 83 |
Range 1–56 Median 43 |
168 (71/97) | Nucleus and cytoplasm | FFPE tissues | Reported | 1.544 (0.999–2.451) | DFS |
| Li et al14 | OSCC | 2015 | People’s Republic of China | – | .100 | 111 (55/56) | Nucleus and cytoplasm | FFPE tissues | Reported | 2.218 (1.205–4.084) | OS |
| Díaz-Martín et al8 | BC | 2015 | Spain | – | Median 53.7 | – | Nucleus | Microarray | Reported | 2.191 (1.021–4.707) | OS |
| Bartucci et al15 | BC | 2015 | Italy | – | Median 90 | 99 (54/45) | Nucleus | FFPE tissues | Reported | 2.06 (1.01–4.20) | OS |
| Wei et al16 | TSCC | 2013 | People’s Republic of China | ≤60 35 >60 17 |
Range 2–101 Mean 42.3 |
52 (22/30) | Nucleus and cytoplasm | FFPE tissues | Reported | 4.351 (1.477–12.819) | OS |
| Tian et al17 | GBM | 2015 | People’s Republic of China | – | – | 504 (252/252) | Nucleus and cytoplasm | Microarray | Reported | 1.870 (1.216–2.877) | OS |
| Sun et al18 | AEG | 2014 | People’s Republic of China | <60 48 ≥60 87 |
Range 1–81 Median 35 |
135 (80/55) | Nucleus and cytoplasm | FFPE tissues | Reported | 1.879 (1.079–3.218) | OS |
| Zhang et al19 | Retinoblastoma | 2015 | People’s Republic of China | <5 39 ≥5 4 |
.50 | 43 (15/28) | Nucleus and cytoplasm | FFPE tissues | Reported | 0.226 (0.051–0.994) 0.144 (0.037–0.559) |
OS PFS |
Abbreviations: AEG, adenocarcinoma of the esophagogastric junction; BC, breast cancer; CI, confidence interval; CRC, colorectal carcinoma; DFS, disease-free survival; FFPE, formalin-fixed and paraffin-embedded; GBM, glioblastoma multiforme; HCC, hepatocellular carcinoma; HR, hazard ratio; NSCLC, non-small-cell lung cancer; OS, overall survival; OSCC, oral squamous cell carcinoma; PFS, progression-free survival; TSCC, tongue squamous cell carcinoma.
Results of meta-analysis
HRs for OS were available in 14 studies involving 2,713 patients, but only one study reported data on the relationship between TAZ and DFS or PFS. As shown in Figure 2, pooled OS data suggested an increased risk of death in patients with higher TAZ expression (HR =1.82, 95% CI =1.58–2.11, I2=33%, P=0.11). There was no significant heterogeneity in these studies.
Figure 2.

Forest plot for the association of TAZ expression with overall survival in various cancer types.
Abbreviations: CI, confidence interval; df, degrees of freedom; SE, standard error.
Subgroup analyses for OS were conducted by covariates, such as ethnicity, sample size, sample source, staining location, and cancer types. Results of the subgroup analysis for prognosis value of TAZ in different cancer types are shown in Table 2. Subgroup analyses by ethnicity showed a significant association between high TAZ expression and poor OS in both Asian (HR =1.474, 95% CI =1.203–1.807; P=0.729) and non-Asian patients (HR =1.474, 95% CI =1.203–1.807; P=0.729). The results of subgroup analyses by sample size showed that combined HRs were 2.09 (95% CI =1.65–2.64) for studies with <200 cases and 1.69 (95% CI =1.42–2.02) for those with >200 cases. This result indicated that high TAZ expression remained an unfavorable prognostic factor regardless of sample size. Regarding sample source, the results showed that high TAZ expression indicated a poor prognosis in studies using formalin-fixed and paraffin-embedded samples (HR =2.03, 95% CI =1.58–2.62; P=0.16) and tissue microarray samples (HR =1.73, 95% CI =1.46–2.06; P=0.16). Subgroup analyses by staining location found that positive overall (nuclear and cytoplasmic) TAZ expression (HR =1.91, 95% CI =1.54–2.38; P=0.06) and positive nuclear TAZ expression (HR =2.11, 95% CI =1.26–3.55; P=0.91) both indicated poor OS. In subgroup analysis by cancer types, overexpression of TAZ was correlated with poor OS in HCC (HR =2.26, 95% CI =1.43–3.57; P=0.49), gastrointestinal cancer (HR =2.00, 95% CI =1.54–2.58; P=0.97), and BC (HR =2.11, 95% CI =1.26–3.55; P=0.91). But in NSCLC, “1” was within the 95% CI (HR =1.71, 95% CI =0.93–3.14; P=0.08), which indicated that positive TAZ expression may not be a prognostic predictor for OS in NSCLC.
Table 2.
Subgroup analysis of TAZ on overall survival in cancer patients
| Variable | No of studies | Model | Pooled HR (95% CI) | Heterogeneity
|
|
|---|---|---|---|---|---|
| I2 (%) | P-value | ||||
| Ethnicity | |||||
| Asian | 12 | Random | 1.91 (1.54–2.38) | 42.00 | 0.06 |
| Non-Asian | 2 | Fixed | 2.11 (1.26–3.55) | 0.00 | 0.91 |
| Sample size | |||||
| >200 | 5 | Fixed | 1.69 (1.42–2.02) | 20.00 | 0.29 |
| <200 | 9 | Fixed | 2.09 (1.65–2.64) | 36.00 | 0.13 |
| Sample source | |||||
| TMA | 6 | Fixed | 1.73 (1.46–2.06) | 36.00 | 0.16 |
| FFPE | 8 | Fixed | 2.03 (1.58–2.62) | 34.00 | 0.16 |
| Staining location | |||||
| Nucleus | 2 | Fixed | 2.11 (1.26–3.55) | 0.00 | 0.91 |
| Nucleus and cytoplasm | 12 | Random | 1.91 (1.54–2.38) | 42.00 | 0.06 |
| Cancer types | |||||
| NSCLC | 2 | Random | 1.71 (0.93–3.14) | 67.00 | 0.08 |
| HCC | 3 | Fixed | 2.26 (1.43–3.57) | 0.00 | 0.49 |
| Digestive system cancer | 3 | Fixed | 2.00 (1.54–2.58) | 0.00 | 0.97 |
| BC | 2 | Fixed | 2.11 (1.26–3.55) | 0.00 | 0.91 |
| Other | 4 | Random | 1.92 (1.39–2.67) | 71.00 | 0.02 |
Notes: Random-effects model was used when P-value for heterogeneity test <0.1; otherwise, fixed-effects model was used.
Abbreviations: BC, breast cancer; CI, confidence interval; FFPE, formalin-fixed and paraffin-embedded; HCC, hepatocellular carcinoma; HR, hazard ratio; NSCLC, non-small-cell lung cancer; TMA, tissue microarray.
Furthermore, we also analyzed the relationship between TAZ expression and clinicopathologic features. As shown in Figure 3, expression of TAZ was found to be associated with more advanced TNM stage (OR =2.56, 95% CI =1.60–4.11; P=0.52), poor tumor differentiation (OR =3.08, 95% CI =1.25–7.63; P=0.01), and lymph node metastasis (OR =2.53, 95% CI =1.81–3.53; P=0.58), but not with tumor size (HR =1.27, 95% CI =0.26–6.268; P=0.005).
Figure 3.

Forest plots of OR.
Notes: (A) OR for the relation between TAZ expression and TNM stage; (B) OR for the relation between TAZ expression and tumor size; (C) OR for the relation between TAZ expression and tumor differentiation; and (D) OR for the relation between TAZ expression and lymph node metastasis.
Abbreviations: CI, confidence interval; df, degrees of freedom; M–H, Mantel–Haenszel; OR, odds ratio.
Publication bias and sensitivity analysis
Begg’s funnel plot and Egger’s test were performed to evaluate the publication bias of the enrolled studies. As shown in Figure 4, the shape of the funnel plots was of no obvious asymmetry. And the P-value for OS from Egger’s test was 0.343, further confirming the nonexistence of significant publication bias. Meanwhile, the sensitivity analysis for contribution of each individual study on the pooled HRs for OS was performed by sequentially omitting individual studies, and found that no individual study significantly influenced the overall HR, as shown in Figure 5. This confirmed the credibility of this meta-analysis.
Figure 4.
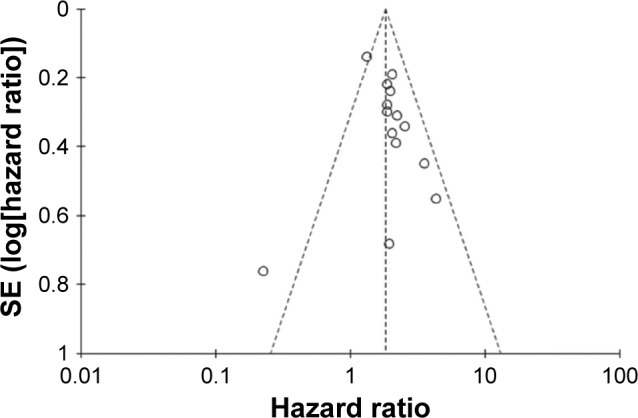
Funnel plot for the TAZ expression with overall survival in cancer patients.
Note: Funnel plot analysis showed no publication bias among the 14 studies included.
Abbreviation: SE, standard error.
Figure 5.

Sensitivity analysis by stepwise omission of one study at a time for overall survival.
Note: The sensitivity analysis showed that no individual study significantly influenced the combined hazard ratio.
Discussion
Cancer is a major global public health problem and is the second leading cause of death in the US with an estimation of 1,700,000 new cases and 600,000 deaths in 2016.20 The more we identify and understand the mechanisms of cancer development and contributing factors of survival outcomes, the more valuable information can be provided to facilitate clinical decision making, optimize treatment and, ultimately, improve survival of cancer patients.
TAZ, structurally homologous to yes-associated protein, functions as a transcriptional coactivator and major effector of Hippo pathway cascade. Generally, this kinase cascade causes cytoplasmic retention of phosphorylated TAZ by 14-3-3 when it is activated. Otherwise, TAZ will be translocated into the nucleus where it interacts with TEA domain family members and drives the transcription process.21 Immunohistochemical analysis in a number of cancers showed that TAZ activation is highly related to cancer progression.4 Importantly, TAZ is involved in the acquisition of some cancer cell phenotypes by means of maintaining stem cell differentiation and self-renewal, and so on.22,23 It also contributes to the epithelial to mesenchymal transition24 and the inhibition of senescence.25 Therefore, TAZ may serve as a promising biomarker for cancer patients. In addition, TAZ has been proved to be responsible for resistance to Taxol in human BC cells26 and a higher recurrence rate in colon cancer.27 These data substantiate that TAZ may be a novel marker in cancer prognosis.
The evidence collected in the present meta-analysis indicated a statistically significant relationship between TAZ overexpression and poor OS (pooled HR =1.82, 95% CI =1.58–2.11). Intriguingly, results of subgroup analyses showed that positive TAZ was significantly correlated with OS in patients regardless of ethnicity, sample source, sample size, or staining location, which further confirmed the prognostic role of TAZ in OS. We also analyzed the combined HRs of different cancer types. Although there were only two or three studies for each cancer type, reliable and consistent conclusions were drawn that higher expression of TAZ indicated worse prognosis in patients with HCC (I2=0%), gastrointestinal cancers (I2=0%), and BC (I2=0%). While in NSCLC, 95% CI contained “1”, meaning the expression of TAZ did not appear to have an overall influence on survival in NSCLC patients. But, we should be extra cautious when interpreting this result, as only two studies for NSCLC were included and therefore the results might be of less power. Further studies are needed to verify our conclusions. In this study, we also assessed the association between TAZ expression and clinicopathologic features in various cancer patients. High TAZ expression was found to be associated with more advanced TNM stage, poor tumor differentiation, and lymphatic metastasis.
This is the first meta-analysis on the association between TAZ expression and survival, but there are still some limitations despite the attempt to make it as comprehensive as possible. First, this meta-analysis only included a limited number of studies covering some, not all, cancer types, and some of the studies did not provide sufficient data for DFS/PFS analysis. As a consequence, the relationship between TAZ and patient outcomes still requires further investigation. Second, we extracted data from Kaplan–Meier curve in some studies due to unavailability of raw data, which may lead to less reliable results. Reanalysis might be performed if we can get the raw data of these studies. Third, many enrolled articles did not describe clinicopathologic features, which may result in biases. Another bias may exist due to language screening process, as positive results tend to be reported in articles written in native languages.28 Moreover, all of the included studies were retrospective, which may have also introduced reporting bias. Therefore, our findings should be interpreted with caution.
In conclusion, this meta-analysis suggested that high expression of TAZ was significantly related to poor OS, more advanced TNM stage, poor tumor differentiation, and lymph node metastasis in cancer patients. But the data were insufficient to determine the role of TAZ in DFS/PFS. To fully understand the clinical utility of TAZ in the prognosis of cancer patients, more well-designed prospective studies based on a larger sample size or larger-scale clinical investigations are awaited.
Supplementary materials
Table S1.
Newcastle–Ottawa quality assessment scale (cohort studies)
| Selection
|
Comparability
|
Outcome
|
Score | ||||||
|---|---|---|---|---|---|---|---|---|---|
| Representativeness of the exposed cohort | Selection of the nonexposed cohort | Ascertainment of exposure | Demonstration that outcome of interest was not present at start of study | Comparability of cohorts on the basis of the design or analysis | Assessment of outcome | Was follow-up long enough for outcomes to occur? | Adequacy of follow-up of cohorts | ||
| a. Truly representative of the average (describe) in the community ✰ b. Somewhat representative of the average in the community ✰ c. Selected group of users, for example, nurses, volunteers d. No description of the derivation of the cohort |
a. Community controls ✰ b. Drawn from a different source c. No description of the derivation of the nonexposed cohort |
a. Secure record (eg, surgical records) ✰ b. Structured interview c. Written self-report d. No description |
a. Yes (endpoint) ✰ b. No |
a. Study controls for (select the most important factor) ✰ b. Study controls for any additional factor. (This criteria could be modified to indicate specific control for a second important factor.) ✰ |
a. Independent blind assessment ✰ b. Record linkage ✰ c. Self-report d. No description |
a. Yes (select an adequate follow-up period for outcome of interest) ✰ b. No |
a. Complete follow-up – all subjects accounted for ✰ b. Subjects lost to follow-up unlikely to introduce bias – small number lost – >80% (select an adequate %) follow-up, or description provided of those lost) ✰ c. Follow-up rate <80% (select an adequate %) and no description of those lost d. No statement |
||
| Noguchi et al1 | b✰ | ✰ | ✰ | ✰ | b✰ | ✰ | 6 | ||
| Xiao et al2 | b✰ | ✰ | ✰ | ✰ | b✰ | ✰ | a✰ | 7 | |
| Guo et al3 | b✰ | ✰ | ✰ | ✰ | b✰ | ✰ | 6 | ||
| Han et al4 | b✰ | ✰ | ✰ | ✰ | b✰ | ✰ | a✰ | 7 | |
| Yuen et al5 | b✰ | ✰ | ✰ | ✰ | b✰ | ✰ | 6 | ||
| Wang et al6 | b✰ | ✰ | ✰ | ✰ | b✰ | ✰ | a✰ | 7 | |
| Li et al7 | b✰ | ✰ | ✰ | ✰ | b✰ | ✰ | 6 | ||
| Bartucci et al8 | b✰ | ✰ | ✰ | ✰ | b✰ | ✰ | 6 | ||
| Wei et al9 | b✰ | ✰ | ✰ | ✰ | b✰ | ✰ | a✰ | 7 | |
| Tian et al10 | b✰ | ✰ | ✰ | ✰ | b✰ | ✰ | 6 | ||
| Sun et al11 | b✰ | ✰ | ✰ | ✰ | b✰ | ✰ | a✰ | 7 | |
| Zhang et al12 | b✰ | ✰ | ✰ | ✰ | b✰ | ✰ | a✰ | 7 | |
| Xie et al14 | b✰ | ✰ | ✰ | ✰ | b✰ | ✰ | a✰ | 7 | |
| Díaz-Martín et al15 | b✰ | ✰ | ✰ | ✰ | b✰ | ✰ | a✰ | 7 | |
Notes: A study can be awarded a maximum of one star for each numbered item within the “selection” and “outcome” categories. A maximum of two stars can be given for “comparability”.
References
- 1.Noguchi S, Saito A, Horie M. An integrative analysis of the tumorigenic role of TAZ in human non-small cell lung cancer. Clin Cancer Res. 2014;20(17):4660–4672. doi: 10.1158/1078-0432.CCR-13-3328. [DOI] [PubMed] [Google Scholar]
- 2.Xiao H, Jiang N, Zhou B, Liu Q, Du C. TAZ regulates cell proliferation and epithelial-mesenchymal transition of human hepatocellular carcinoma. Cancer Sci. 2015;106(2):151–159. doi: 10.1111/cas.12587. [DOI] [PMC free article] [PubMed] [Google Scholar]
- 3.Guo Y, Pan Q, Zhang J, et al. Functional and clinical evidence that TAZ is a candidate oncogene in hepatocellular carcinoma. J Cell Biochem. 2015;116(11):2465–2475. doi: 10.1002/jcb.25117. [DOI] [PubMed] [Google Scholar]
- 4.Han SX, Bai E, Jin GH, et al. Expression and clinical significance of YAP, TAZ, and AREG in hepatocellular carcinoma. J Immunol Res. 2014;2014:261365. doi: 10.1155/2014/261365. [DOI] [PMC free article] [PubMed] [Google Scholar]
- 5.Yuen HF, McCrudden CM, Huang YH, et al. TAZ expression as a prognostic indicator in colorectal cancer. PLoS One. 2013;8(1):e54211. doi: 10.1371/journal.pone.0054211. [DOI] [PMC free article] [PubMed] [Google Scholar]
- 6.Wang L, Shi S, Guo Z, et al. Overexpression of YAP and TAZ is an independent predictor of prognosis in colorectal cancer and related to the proliferation and metastasis of colon cancer cells. PLoS One. 2013;8(6):e65539. doi: 10.1371/journal.pone.0065539. [DOI] [PMC free article] [PubMed] [Google Scholar] [Retracted]
- 7.Li Z, Wang Y, Zhu Y, et al. The Hippo transducer TAZ promotes epithelial to mesenchymal transition and cancer stem cell maintenance in oral cancer. Mol Oncol. 2015;9(6):1091–1105. doi: 10.1016/j.molonc.2015.01.007. [DOI] [PMC free article] [PubMed] [Google Scholar]
- 8.Bartucci M, Dattilo R, Moriconi C, et al. TAZ is required for metastatic activity and chemoresistance of breast cancer stem cells. Oncogene. 2015;34(6):681–690. doi: 10.1038/onc.2014.5. [DOI] [PubMed] [Google Scholar]
- 9.Wei Z, Wang Y, Li Z, et al. Overexpression of Hippo pathway effector TAZ in tongue squamous cell carcinoma: correlation with clinicopathological features and patients’ prognosis. J Oral Pathol Med. 2013;42(10):747–754. doi: 10.1111/jop.12062. [DOI] [PubMed] [Google Scholar]
- 10.Tian T, Li A, Lu H, Luo R, Zhang M, Li Z. TAZ promotes temozolomide resistance by upregulating MCL-1 in human glioma cells. Biochem Biophys Res Commun. 2015;463(4):638–643. doi: 10.1016/j.bbrc.2015.05.115. [DOI] [PubMed] [Google Scholar]
- 11.Sun L, Chen F, Shi W, Qi L, Zhao Z, Zhang J. Prognostic impact of TAZ and beta-catenin expression in adenocarcinoma of the esophagogastric junction. Diagn Pathol. 2014;9:125. doi: 10.1186/1746-1596-9-125. [DOI] [PMC free article] [PubMed] [Google Scholar]
- 12.Zhang Y, Xue C, Cui H, Huang Z. High expression of TAZ indicates a poor prognosis in retinoblastoma. Diagn Pathol. 2015;10:187. doi: 10.1186/s13000-015-0415-9. [DOI] [PMC free article] [PubMed] [Google Scholar]
- 13.Siegel RL, Miller KD, Jemal A. Cancer statistics, 2016. CA Cancer J Clin. 2016;66(1):7–30. doi: 10.3322/caac.21332. [DOI] [PubMed] [Google Scholar]
- 14.Xie M, Zhang L, He CS, et al. Prognostic significance of TAZ expression in resected non-small cell lung cancer. J Thorac Oncol. 2012;7(5):799–807. doi: 10.1097/JTO.0b013e318248240b. [DOI] [PubMed] [Google Scholar]
- 15.Díaz-Martín J, López-García MÁ, Romero-Pérez L, et al. Nuclear TAZ expression associates with the triple-negative phenotype in breast cancer. Endocr Relat Cancer. 2015;22(3):443–454. doi: 10.1530/ERC-14-0456. [DOI] [PubMed] [Google Scholar]
Acknowledgments
This meta-analysis was supported by grants from the Sichuan Youth Foundation of Science of Technology (Grant number: 2015JQ0026). We would like to thank Lisa Tsang for her help in revising the spelling and grammar mistakes.
Footnotes
Disclosure
The authors report no conflicts of interest in this work.
References
- 1.Santucci M, Vignudelli T, Ferrari S, et al. The Hippo pathway and YAP/TAZ-TEAD protein-protein interaction as targets for regenerative medicine and cancer treatment. J Med Chem. 2015;58(12):4857–4873. doi: 10.1021/jm501615v. [DOI] [PubMed] [Google Scholar]
- 2.Zhang H, Liu CY, Zha ZY, et al. TEAD transcription factors mediate the function of TAZ in cell growth and epithelial-mesenchymal transition. J Biol Chem. 2009;284(20):13355–13362. doi: 10.1074/jbc.M900843200. [DOI] [PMC free article] [PubMed] [Google Scholar]
- 3.Hiemer SE, Zhang L, Kartha VK, et al. A YAP/TAZ-regulated molecular signature is associated with oral squamous cell carcinoma. Mol Cancer Res. 2015;13(6):957–968. doi: 10.1158/1541-7786.MCR-14-0580. [DOI] [PMC free article] [PubMed] [Google Scholar]
- 4.Piccolo S, Dupont S, Cordenonsi M. The biology of YAP/TAZ: hippo signaling and beyond. Physiol Rev. 2014;94(4):1287–1312. doi: 10.1152/physrev.00005.2014. [DOI] [PubMed] [Google Scholar]
- 5.Han SX, Bai E, Jin GH, et al. Expression and clinical significance of YAP, TAZ, and AREG in hepatocellular carcinoma. J Immunol Res. 2014;2014:261365. doi: 10.1155/2014/261365. [DOI] [PMC free article] [PubMed] [Google Scholar]
- 6.Tierney JF, Stewart LA, Ghersi D, Burdett S, Sydes MR. Practical methods for incorporating summary time-to-event data into meta-analysis. Trials. 2007;8:16. doi: 10.1186/1745-6215-8-16. [DOI] [PMC free article] [PubMed] [Google Scholar]
- 7.Noguchi S, Saito A, Horie M. An integrative analysis of the tumorigenic role of TAZ in human non-small cell lung cancer. Clin Cancer Res. 2014;20(17):4660–4672. doi: 10.1158/1078-0432.CCR-13-3328. [DOI] [PubMed] [Google Scholar]
- 8.Díaz-Martín J, López-García MÁ, Romero-Pérez L, et al. Nuclear TAZ expression associates with the triple-negative phenotype in breast cancer. Endocr Relat Cancer. 2015;22(3):443–454. doi: 10.1530/ERC-14-0456. [DOI] [PubMed] [Google Scholar]
- 9.Xiao H, Jiang N, Zhou B, Liu Q, Du C. TAZ regulates cell proliferation and epithelial-mesenchymal transition of human hepatocellular carcinoma. Cancer Sci. 2015;106(2):151–159. doi: 10.1111/cas.12587. [DOI] [PMC free article] [PubMed] [Google Scholar]
- 10.Guo Y, Pan Q, Zhang J, et al. Functional and clinical evidence that TAZ is a candidate oncogene in hepatocellular carcinoma. J Cell Biochem. 2015;116(11):2465–2475. doi: 10.1002/jcb.25117. [DOI] [PubMed] [Google Scholar]
- 11.Xie M, Zhang L, He CS, et al. Prognostic significance of TAZ expression in resected non-small cell lung cancer. J Thorac Oncol. 2012;7(5):799–807. doi: 10.1097/JTO.0b013e318248240b. [DOI] [PubMed] [Google Scholar]
- 12.Yuen HF, McCrudden CM, Huang YH, et al. TAZ expression as a prognostic indicator in colorectal cancer. PLoS One. 2013;8(1):e54211. doi: 10.1371/journal.pone.0054211. [DOI] [PMC free article] [PubMed] [Google Scholar]
- 13.Wang L, Shi S, Guo Z, et al. Overexpression of YAP and TAZ is an independent predictor of prognosis in colorectal cancer and related to the proliferation and metastasis of colon cancer cells. PLoS One. 2013;8(6):e65539. doi: 10.1371/journal.pone.0065539. [DOI] [PMC free article] [PubMed] [Google Scholar] [Retracted]
- 14.Li Z, Wang Y, Zhu Y, et al. The Hippo transducer TAZ promotes epithelial to mesenchymal transition and cancer stem cell maintenance in oral cancer. Mol Oncol. 2015;9(6):1091–1105. doi: 10.1016/j.molonc.2015.01.007. [DOI] [PMC free article] [PubMed] [Google Scholar]
- 15.Bartucci M, Dattilo R, Moriconi C, et al. TAZ is required for metastatic activity and chemoresistance of breast cancer stem cells. Oncogene. 2015;34(6):681–690. doi: 10.1038/onc.2014.5. [DOI] [PubMed] [Google Scholar]
- 16.Wei Z, Wang Y, Li Z, et al. Overexpression of Hippo pathway effector TAZ in tongue squamous cell carcinoma: correlation with clinicopathological features and patients’ prognosis. J Oral Pathol Med. 2013;42(10):747–754. doi: 10.1111/jop.12062. [DOI] [PubMed] [Google Scholar]
- 17.Tian T, Li A, Lu H, Luo R, Zhang M, Li Z. TAZ promotes temozolomide resistance by upregulating MCL-1 in human glioma cells. Biochem Biophys Res Commun. 2015;463(4):638–643. doi: 10.1016/j.bbrc.2015.05.115. [DOI] [PubMed] [Google Scholar]
- 18.Sun L, Chen F, Shi W, Qi L, Zhao Z, Zhang J. Prognostic impact of TAZ and beta-catenin expression in adenocarcinoma of the esophagogastric junction. Diagn Pathol. 2014;9:125. doi: 10.1186/1746-1596-9-125. [DOI] [PMC free article] [PubMed] [Google Scholar]
- 19.Zhang Y, Xue C, Cui H, Huang Z. High expression of TAZ indicates a poor prognosis in retinoblastoma. Diagn Pathol. 2015;10:187. doi: 10.1186/s13000-015-0415-9. [DOI] [PMC free article] [PubMed] [Google Scholar]
- 20.Siegel RL, Miller KD, Jemal A. Cancer statistics, 2016. CA Cancer J Clin. 2016;66(1):7–30. doi: 10.3322/caac.21332. [DOI] [PubMed] [Google Scholar]
- 21.Hansen CG, Moroishi T, Guan KL. YAP and TAZ: a nexus for Hippo signaling and beyond. Trends Cell Biol. 2015;25(9):499–513. doi: 10.1016/j.tcb.2015.05.002. [DOI] [PMC free article] [PubMed] [Google Scholar]
- 22.Varelas X, Sakuma R, Samavarchi-Tehrani P, et al. TAZ controls Smad nucleocytoplasmic shuttling and regulates human embryonic stem-cell self-renewal. Nat Cell Biol. 2008;10(7):837–848. doi: 10.1038/ncb1748. [DOI] [PubMed] [Google Scholar]
- 23.Cordenonsi M, Zanconato F, Azzolin L, et al. The Hippo transducer TAZ confers cancer stem cell-related traits on breast cancer cells. Cell. 2011;147(4):759–772. doi: 10.1016/j.cell.2011.09.048. [DOI] [PubMed] [Google Scholar]
- 24.Lei QY, Zhang H, Zhao B, et al. TAZ promotes cell proliferation and epithelial-mesenchymal transition and is inhibited by the hippo pathway. Mol Cell Biol. 2008;28(7):2426–2436. doi: 10.1128/MCB.01874-07. [DOI] [PMC free article] [PubMed] [Google Scholar]
- 25.Pelissier FA, Garbe JC, Ananthanarayanan B, et al. Age-related dysfunction in mechanotransduction impairs differentiation of human mammary epithelial progenitors. Cell Rep. 2014;7(6):1926–1939. doi: 10.1016/j.celrep.2014.05.021. [DOI] [PMC free article] [PubMed] [Google Scholar]
- 26.Lai D, Ho KC, Hao Y, Yang X. Taxol resistance in breast cancer cells is mediated by the hippo pathway component TAZ and its downstream transcriptional targets Cyr61 and CTGF. Cancer Res. 2011;71(7):2728–2738. doi: 10.1158/0008-5472.CAN-10-2711. [DOI] [PubMed] [Google Scholar]
- 27.Sebio A, Matsusaka S, Zhang W. Germline polymorphisms in genes involved in the Hippo pathway as recurrence biomarkers in stages II/III colon cancer. Pharmacogenomics J. 2015 Sep 15; doi: 10.1038/tpj.2015.64. Epub. [DOI] [PMC free article] [PubMed] [Google Scholar]
- 28.Egger M, Zellweger-Zähner T, Schneider M, Junker C, Lengeler C, Antes G. Language bias in randomised controlled trials published in English and German. Lancet. 1997;350(9074):326–329. doi: 10.1016/S0140-6736(97)02419-7. [DOI] [PubMed] [Google Scholar]
Associated Data
This section collects any data citations, data availability statements, or supplementary materials included in this article.
Supplementary Materials
Table S1.
Newcastle–Ottawa quality assessment scale (cohort studies)
| Selection
|
Comparability
|
Outcome
|
Score | ||||||
|---|---|---|---|---|---|---|---|---|---|
| Representativeness of the exposed cohort | Selection of the nonexposed cohort | Ascertainment of exposure | Demonstration that outcome of interest was not present at start of study | Comparability of cohorts on the basis of the design or analysis | Assessment of outcome | Was follow-up long enough for outcomes to occur? | Adequacy of follow-up of cohorts | ||
| a. Truly representative of the average (describe) in the community ✰ b. Somewhat representative of the average in the community ✰ c. Selected group of users, for example, nurses, volunteers d. No description of the derivation of the cohort |
a. Community controls ✰ b. Drawn from a different source c. No description of the derivation of the nonexposed cohort |
a. Secure record (eg, surgical records) ✰ b. Structured interview c. Written self-report d. No description |
a. Yes (endpoint) ✰ b. No |
a. Study controls for (select the most important factor) ✰ b. Study controls for any additional factor. (This criteria could be modified to indicate specific control for a second important factor.) ✰ |
a. Independent blind assessment ✰ b. Record linkage ✰ c. Self-report d. No description |
a. Yes (select an adequate follow-up period for outcome of interest) ✰ b. No |
a. Complete follow-up – all subjects accounted for ✰ b. Subjects lost to follow-up unlikely to introduce bias – small number lost – >80% (select an adequate %) follow-up, or description provided of those lost) ✰ c. Follow-up rate <80% (select an adequate %) and no description of those lost d. No statement |
||
| Noguchi et al1 | b✰ | ✰ | ✰ | ✰ | b✰ | ✰ | 6 | ||
| Xiao et al2 | b✰ | ✰ | ✰ | ✰ | b✰ | ✰ | a✰ | 7 | |
| Guo et al3 | b✰ | ✰ | ✰ | ✰ | b✰ | ✰ | 6 | ||
| Han et al4 | b✰ | ✰ | ✰ | ✰ | b✰ | ✰ | a✰ | 7 | |
| Yuen et al5 | b✰ | ✰ | ✰ | ✰ | b✰ | ✰ | 6 | ||
| Wang et al6 | b✰ | ✰ | ✰ | ✰ | b✰ | ✰ | a✰ | 7 | |
| Li et al7 | b✰ | ✰ | ✰ | ✰ | b✰ | ✰ | 6 | ||
| Bartucci et al8 | b✰ | ✰ | ✰ | ✰ | b✰ | ✰ | 6 | ||
| Wei et al9 | b✰ | ✰ | ✰ | ✰ | b✰ | ✰ | a✰ | 7 | |
| Tian et al10 | b✰ | ✰ | ✰ | ✰ | b✰ | ✰ | 6 | ||
| Sun et al11 | b✰ | ✰ | ✰ | ✰ | b✰ | ✰ | a✰ | 7 | |
| Zhang et al12 | b✰ | ✰ | ✰ | ✰ | b✰ | ✰ | a✰ | 7 | |
| Xie et al14 | b✰ | ✰ | ✰ | ✰ | b✰ | ✰ | a✰ | 7 | |
| Díaz-Martín et al15 | b✰ | ✰ | ✰ | ✰ | b✰ | ✰ | a✰ | 7 | |
Notes: A study can be awarded a maximum of one star for each numbered item within the “selection” and “outcome” categories. A maximum of two stars can be given for “comparability”.