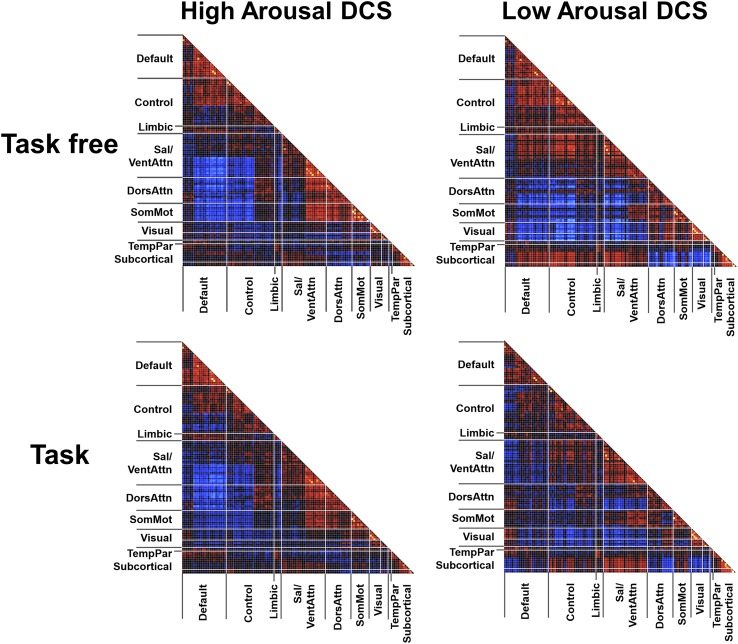
Significance
Functionally connected brain networks exhibit recurring connectivity fluctuations. Although such dynamic connectivity states (DCS) can be expected to have behavioral correlates, linking fluctuating connectivity with behavioral state is hampered by the use of mental probes that themselves perturb observed behavior. Using the degree of eyelid closure as a proxy for vigilance state, we were able to continuously assay behavior and constrain the myriad of possible DCS to two relevant states denoting arousal in sleep-deprived persons. Intriguingly, these two DCS had counterparts in task-based data that predicted interindividual differences in the frequency of behavioral lapsing and intraindividual fluctuations in response speed. The replication of these findings in an independent dataset should encourage further investigations into the network dynamics of mental states.
Keywords: dynamic connectivity states, resting-state fMRI, vigilance, eyelid closure, sleep deprivation
Abstract
Fluctuations in resting-state functional connectivity occur but their behavioral significance remains unclear, largely because correlating behavioral state with dynamic functional connectivity states (DCS) engages probes that disrupt the very behavioral state we seek to observe. Observing spontaneous eyelid closures following sleep deprivation permits nonintrusive arousal monitoring. During periods of low arousal dominated by eyelid closures, sliding-window correlation analysis uncovered a DCS associated with reduced within-network functional connectivity of default mode and dorsal/ventral attention networks, as well as reduced anticorrelation between these networks. Conversely, during periods when participants’ eyelids were wide open, a second DCS was associated with less decoupling between the visual network and higher-order cognitive networks that included dorsal/ventral attention and default mode networks. In subcortical structures, eyelid closures were associated with increased connectivity between the striatum and thalamus with the ventral attention network, and greater anticorrelation with the dorsal attention network. When applied to task-based fMRI data, these two DCS predicted interindividual differences in frequency of behavioral lapsing and intraindividual temporal fluctuations in response speed. These findings with participants who underwent a night of total sleep deprivation were replicated in an independent dataset involving partially sleep-deprived participants. Fluctuations in functional connectivity thus appear to be clearly associated with changes in arousal.
The existence of large-scale functional brain networks is evidenced by well-defined spatial patterns of correlated blood-oxygenation level-dependent (BOLD) signal fluctuation in fMRI data (1). Recent work has shown that functional connectivity (FC) within and between brain networks is dynamic, corresponding to the observation that even while we are performing a task, our mental focus fluctuates (2). Fluctuation of fMRI-based FC occurs over tens of seconds (3, 4) and exhibits different patterns across conscious and unconscious states (5, 6). Furthermore, just as interindividual differences in stationary FC relate to variation in human behavior and cognition (7–10), it seems likely that recurring patterns (11) of fluctuating FC have behavioral significance.
Temporal fluctuations in FC can arise from conscious mental activity (12), episodes of random synchrony (3), or simply time-varying levels of physiological noise (13, 14). The association between BOLD signal fluctuation in the default mode network (DMN) and mind-wandering episodes (15–17) has prompted investigations into the behavioral correlates of spontaneous resting-state FC fluctuations (11, 18). Although these fluctuations in FC have been shown to correlate with several physiological markers, such as electroencephalogram (EEG) power, magnetoencephalography (MEG) power, and heart rate variability (19–21), their behavioral significance remains unclear.
A key obstacle to elucidating clear FC–behavioral state relationships is the difficulty in evaluating mental state without the use of an intrusive stimulus or behavioral probe. For example, in mind-wandering experiments, the experience sampling technique used to identify such epochs involves periodically probing (and interrupting) participants for meta-awareness of mental drifting (22).
To circumvent having to use probes to evaluate mental microstates, spontaneous eyelid closures (SEC) were used as a proxy for vigilance state. In sleep-deprived persons, the degree of SEC is an excellent marker of reduced responsiveness to auditory signals (23). Pronounced SEC, referring to epochs when the eyelids are closed or almost completely closed, correspond to periods when participants are less likely to respond to standardized auditory stimuli. SEC so robustly foreshadow behavioral lapses that they are commercially used for drowsiness detection (24, 25).
We recently found that time-locking FC estimation to the onset of pronounced SEC reveals accentuated forms of the stationary FC shifts observed in sleep-deprived healthy young adults compared with when they are well rested (26). These FC changes involve decreased within-DMN and within-dorsal attention network (DAN) connectivity, as well as reduced anticorrelation between DMN and DAN (27–30). In the present work, we sought to demonstrate that spontaneous FC fluctuations in sleep-deprived persons correspond to fluctuations in arousal that coincide with pronounced SEC. Motivating this approach are the twin observations that: (i) psychomotor vigilance in sleep-deprived persons shows pronounced moment-to-moment fluctuation (31), giving rise to sufficient state variance needed for reliable state classification; and (ii) prolonged SEC are more likely in the sleep-deprived state. We anticipated that spontaneous SEC in the sleep-deprived state would be associated with dynamic FC (DFC) changes in the DMN and DAN, incurring both within- and between-network shifts. We additionally expected that such dynamic connectivity patterns corresponding to “low-arousal” SEC epochs would coincide with behavioral lapses during an auditory vigilance task, and that this could be demonstrated within and across participants. We tested the reproducibility of our findings with an independent dataset involving partially sleep-deprived participants. Taken together, these predictions, if true, would support to the notion that specific patterns of DFC fluctuation correspond to variations in arousal level.
Results
Fluctuations in FC at Rest Are Associated with SEC in Sleep-Deprived Participants.
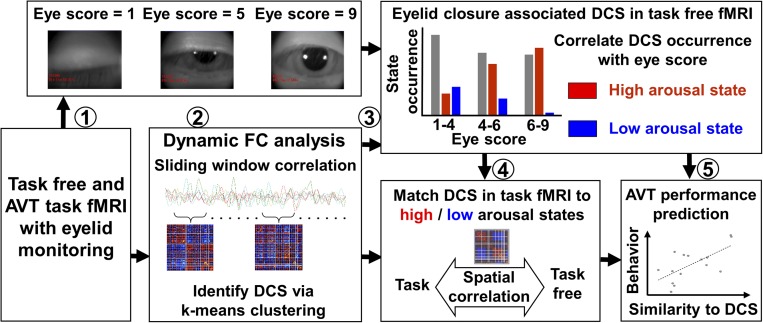
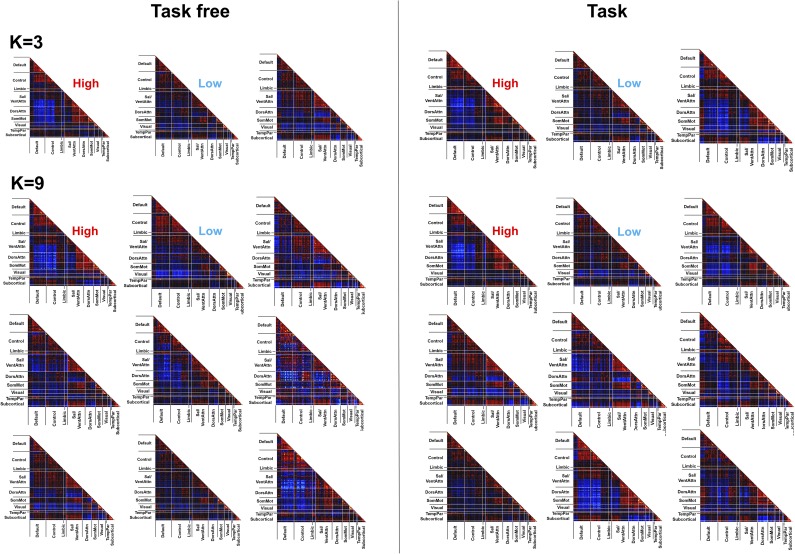
To elucidate the different time-varying patterns of whole-brain FC, we used a sliding-window approach to compute windowed covariance matrices from BOLD time courses extracted from the 126 predefined regions of interest (ROIs) in each participant (Fig. 1, step 1; details in Materials and Methods). Each was computed over a 40-s sliding window, shifted in 2-s increments (32). To estimate recurring DFC patterns, we performed k-means clustering on the aforesaid windowed covariance matrices pooled across all of the participants (Fig. 1, step 2). Each resulting cluster centroid was taken to be the exemplary FC pattern associated with each of several dynamic connectivity states (DCS) (Fig. S1, Left). Each frame in successive time windows was thus assigned with membership to one of these distinct DCS.
Fig. 1.
Graphic overview of the study. (Step 1) Task-free and AVT fMRI scans were collected following total sleep deprivation. The degree of SEC was rated. (Step 2) DFC analysis was performed to extract DCS. (Step 3) DCS corresponding to a high- and low-arousal state associated with eyelid closure were derived. (Step 4) DCS derived from the AVT task fMRI dataset were matched to their counterpart templates in the task-free condition. (Step 5) High- and low-arousal DCS thus derived had intersubject and within-subject behavioral correlates.
Fig. S1.
Cluster centroids derived from task-free (Right) and task-based (Left) fMRI datasets using k-means clustering with number of clusters k = 3 and 9. Control, executive control network; Default, DMN; DorsAttn, dorsal attention network; Limbic, limbic system; Sal/VentAtten, salience/ventral attention network; SomMot, somatosensory and motor network; Subcortical, subcortical regions (hippocampus, amygdala, striatum and thalamus); TempPar, temporal parietal network; Visual, visual network.
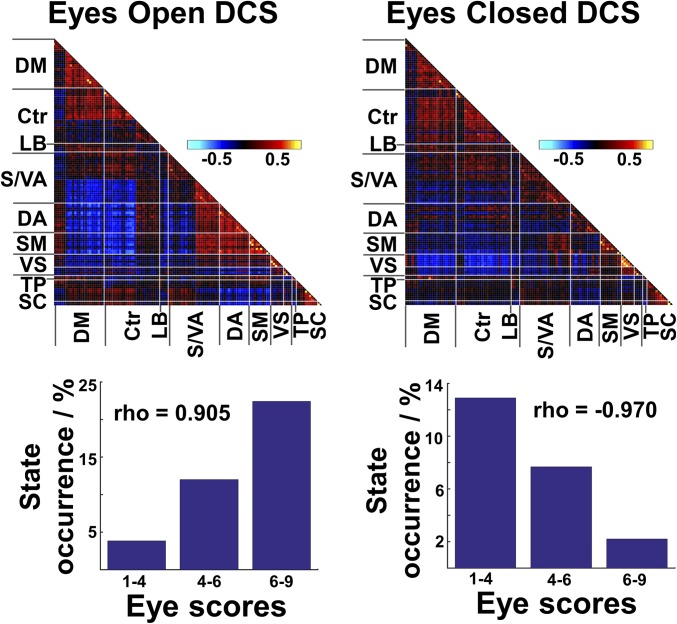
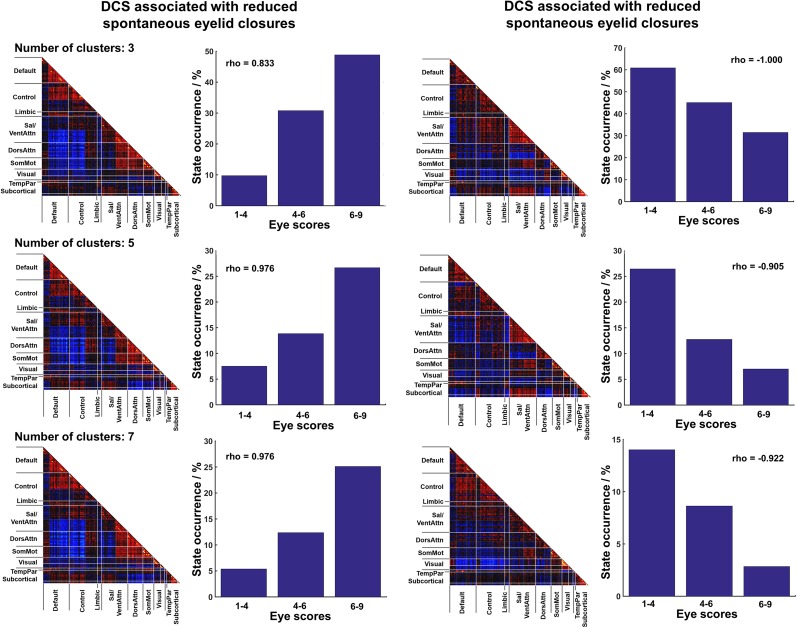
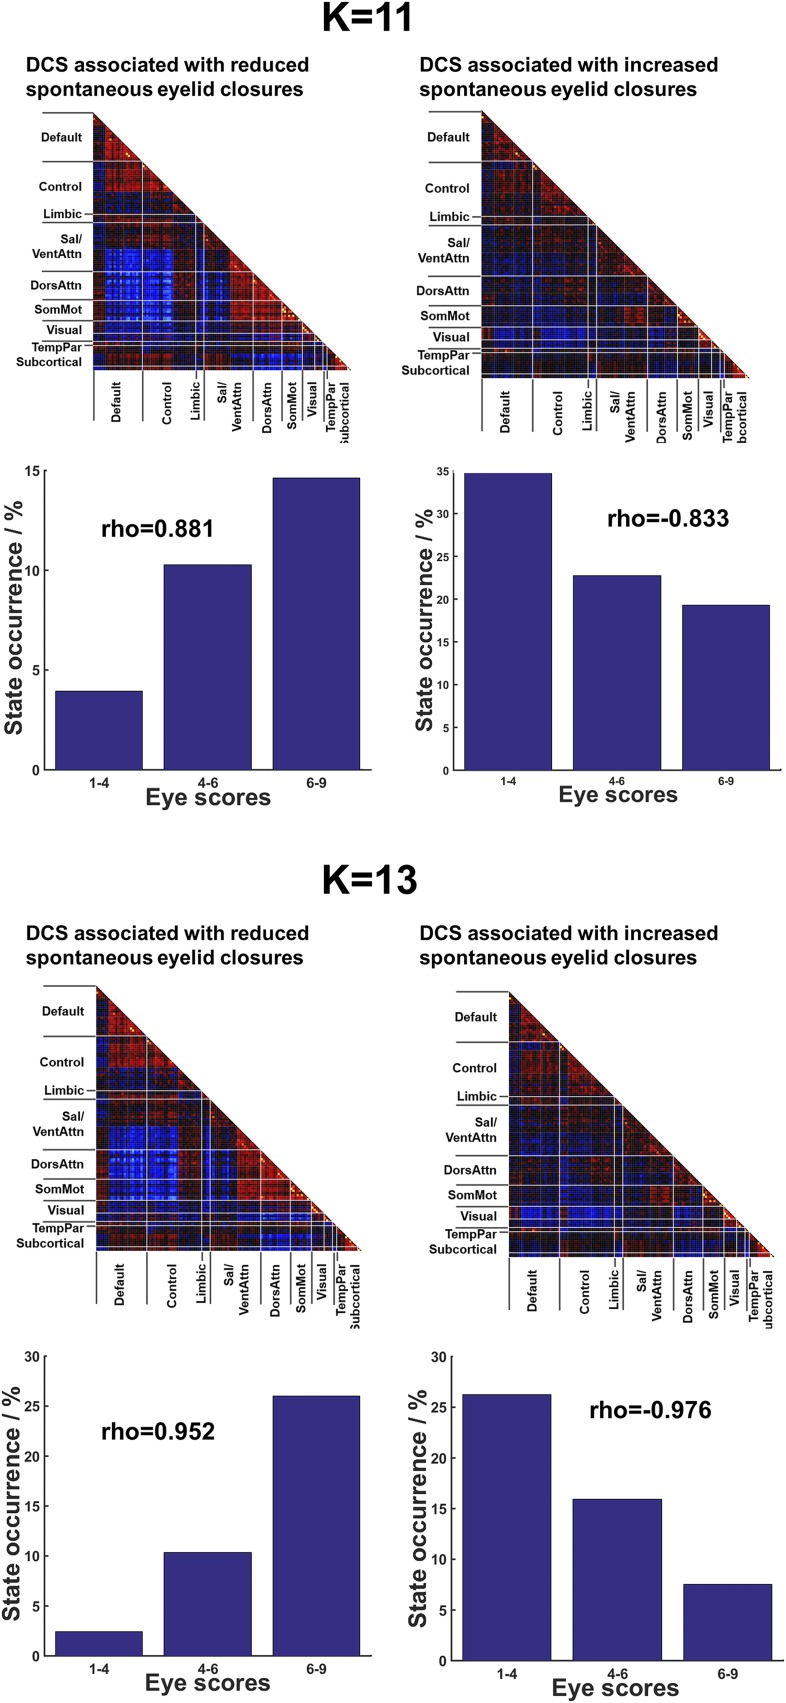
We next correlated the occurrence probability of each DCS with the SEC score (1, closed; 9, open) at corresponding time windows (Fig. 1, step 3). The occurrence probability of each DCS was based on the membership of each window as determined using k-means clustering at different degrees of SEC. We found two DCS that were either positively (Fig. 2, Left) (Spearman’s ρ = 0.905, P = 0.005) or negatively (Fig. 2, Right) (Spearman’s ρ = −0.970, P < 0.001) associated with SEC scores [P < 0.05 family-wise error rate (FWE) -corrected] (see Table S1 for the state distribution of these two DCS across subjects). No other DCS were associated with SEC. A random-effects group-level analysis showed that this SEC–DCS association was significant in most subjects (P = 0.028, t = 2.20; mean Spearman’s ρ = 0.372 ± 0.535 and P < 0.001, t = −4.63 and mean Spearman’s ρ = 0.461 ± 0.373 for positive and negative SEC–DCS correlations, respectively). This finding remained robust even with different numbers of clusters k = 3, 5, and 7 and with different sliding-window lengths (SI Results and Figs. S2 and S3). Additional analyses involving a high number of clusters (k = 11 and 13) showed largely the same results (SI Results and Fig. S4).
Fig. 2.
DCS associated with predominantly eyes-open and eyes-closed states in the task-free condition. FC matrices of the two DCS associated with higher (eyelids open) and lower (eyelids closed) eye scores. For clearer illustration here, eye scores are binned into three levels. Spearman’s ρ was computed with eye scores binned into eight levels (Fig. S8). Cool and hot colors denote negative and positive correlations respectively. Bars denote the frequency of occurrence of each DCS at different SEC ratings. Ctr, executive control network; DA, dorsal attention network; DM, default mode network; LB, limbic system; SC, subcortical regions; SM, somatosensory and motor network; S/VA, salience/ventral attention network; TP, temporal parietal network; VS, visual network.
Table S1.
Distribution of high- and low-arousal DCSs across subjects in the task-free condition
| k | High-arousal state | Low-arousal state | ||||
| Mean | SD | No. of subjects | Mean | SD | No. of subjects | |
| 3 | 71 | 66 | 16 | 160 | 57 | 18 |
| 5 | 60 | 61 | 14 | 60 | 45 | 17 |
| 7 | 33 | 41 | 11 | 33 | 43 | 12 |
| 9 | 29 | 39 | 10 | 30 | 37 | 14 |
Presented are the mean and SD of the number of times (of 312 windows) that each identified high- and low-arousal DCS occurred during the 12-min task-free condition across individuals. The number of subjects (of 18 subjects) entering specific high- and low-arousal states are also indicated.
Fig. S2.
Distinct DCS associated with SEC were consistently identified despite using different numbers of clusters. In the task-free data, high- (reduced SEC) and low- (increased SEC) arousal states were derived from k-means clustering using different number of clusters (k = 3, 5, and 7). All analyses showed similar FC patterns to the results reported in the main text (k = 9).
Fig. S3.
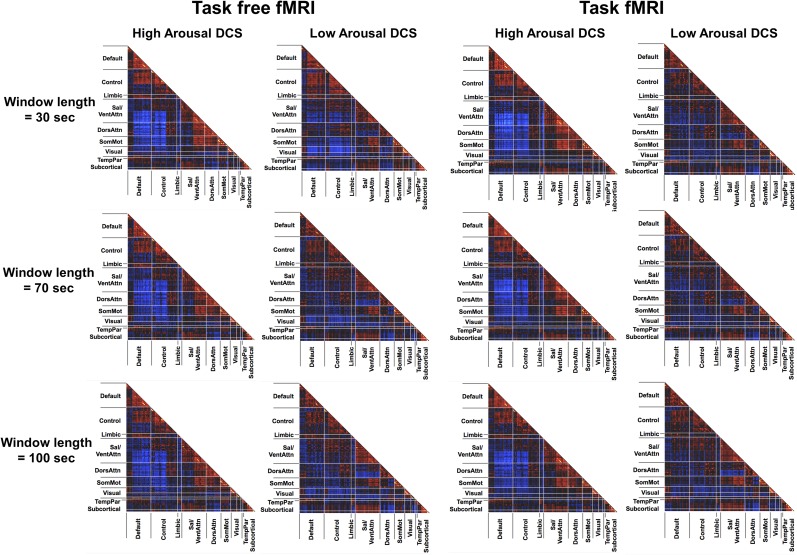
DCS at high and low arousal derived using different window lengths. We repeated the same DCS analyses using different window lengths (30, 70, and 100 s). Highly similar FC patterns of high- and low-arousal states were observed in both task-free and task conditions.
Fig. S4.
SEC-associated DCS at task-free condition revealed by k-means clustering at k = 11 (Upper) and 13 (Lower). Within each panel the top row represents the high- and low-arousal DCS associated with SEC in the task-free condition and the bottom row indicates the occurrence of corresponding DCS at different SEC ratings (three bins). Spearman’s rank correlation coefficients were computed between state occurrences and SEC scores (eight bins).
Fig. S8.
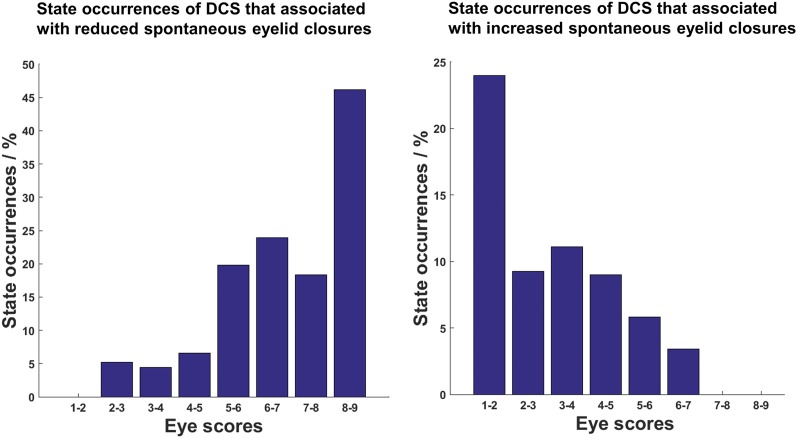
Occurrence of high- (Left) and low- (Right) arousal DCS across spontaneous eyelid closure ratings binned into eight levels.
High- and Low-Arousal States Exhibit Within-Network and Between-Network Differences in FC.
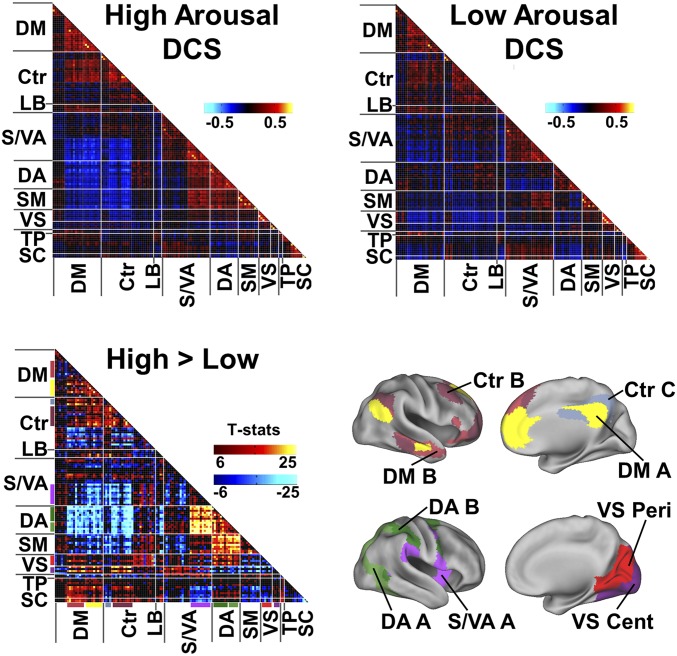
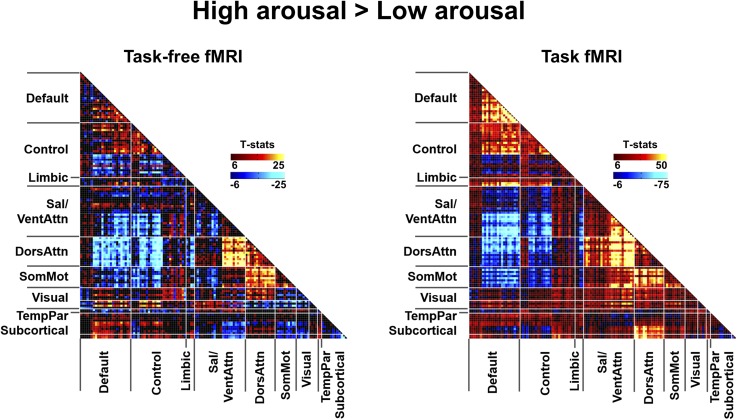
Having determined how different DCS relate to eyelid closure (SEC scores), we next characterized how FC patterns differed between high- and low-arousal DCS. To this end, we gathered a pair of windowed covariance matrices from each participant corresponding to the high- and low-arousal DCS. To minimize the effects of noise and clustering error, only windows corresponding to DCS identified as “high-“ or “low-“ arousal in more than 50% of the clustering results, and with different k values, were used. Averaged covariance matrices for high- and low-arousal DCS were thus obtained (Fig. 3, Upper, and SI Materials and Methods). Comparison between the two groups of matrices, using two-sample t tests on Fisher’s Z-transformed Pearson correlation coefficients, revealed FC differences between these DCS (P < 1E-6 FWE-corrected) (Fig. 3, Lower).
Fig. 3.
Distinct patterns of within- and between-network FC in high- and low-arousal DCS in the task-free condition. (Upper) Averaged FC patterns associated with high- (Left) and low- (Right) arousal states. (Lower) Matrix of two-sample t test results related to FC differences between high- and low-arousal states, thresholded at P < 1E-6 few-corrected (Left). Networks showing significant FC differences across arousal state are color coded on the brain surface maps (SI Materials and Methods) (Right). Cent, central; Peri, peripheral; other abbreviations are as in Fig. 2.
Compared with the low-arousal DCS, the high-arousal DCS displayed higher within-network connectivity (Fig. 3, Lower Left matrix, diagonal cells) involving the DMN, control network, ventral attention/salience network (SN), and DAN. Higher between-network connectivity (Fig. 3, Lower Left matrix, off-diagonal cells) was also observed between the DMN and control network, between the SN and DAN, and between somatosensory networks and DAN. High arousal was accompanied by greater anticorrelation between the DMN (extending to control network) and DAN/SN. In contrast, the low-arousal DCS featured decoupling (lower correlation) between the visual network and higher-order cognitive networks, including the DMN, control, and DAN. Furthermore, in the low-arousal DCS, subcortical regions, specifically the thalamus and striatum, showed increased FC with SN and greater anticorrelation with DAN.
DFC States Derived from Task-Based fMRI Resemble Those Derived from Task-Free fMRI.
To examine if DCS derived from task-free fMRI data could be mapped to low-arousal DCS derived during task performance, we ran the identical sliding-window analysis on data collected from the same participants as they performed an auditory vigilance task after total sleep deprivation (26). An additional step was taken to regress out task-related activation from BOLD time courses (Fig. 1, step 4). From the resulting FC cluster centroids (DCS derived from task-based fMRI data) (Fig. S1, Right), we found distinct DCSs that closely resembled the high- and low-arousal DCS derived from the task-free dataset. The resemblance between task-free and task-based DCS patterns was stronger in the high-arousal state. The low-arousal DCS matrices were spatially similar, particularly in on-diagonal elements. In the off-diagonal elements, differences between the states were clearer in the task-free data, and could represent an interaction between task performance and connectivity.
Importantly, high spatial similarity (r > 0.85) between the DCS was found regardless of the window length (Fig. S3) or the number of clusters used. We then used the same approach to summarize the clustering results across different k’s (as described above) to produce averaged windowed covariance matrices associated with high- and low-arousal DCS in the task condition (Fig. 4, Left). Similar within- and between-network FC differences were observed compared with the task-free analysis (Fig. S5).
Fig. 4.
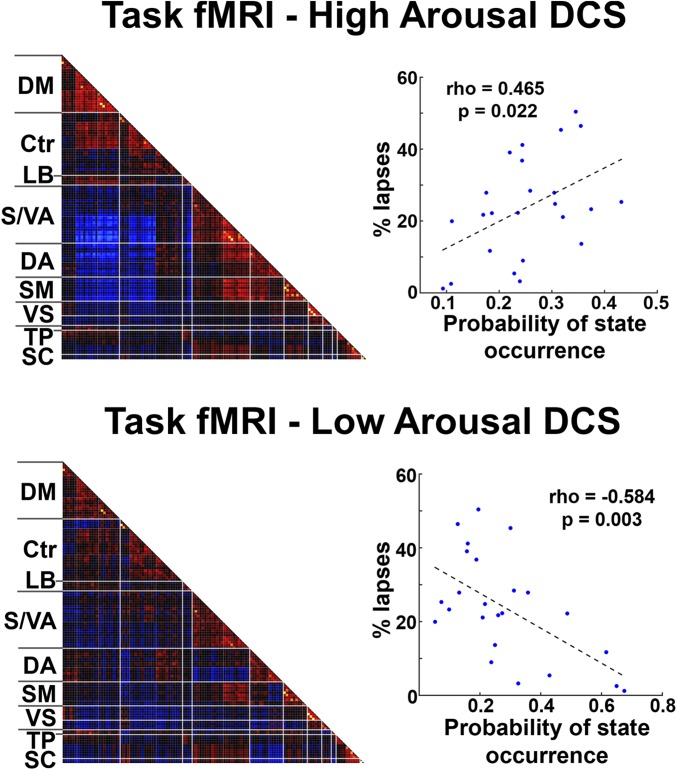
Occurrence of high and low DCS correlated with individual differences in AVT task performance. (Left) The high- and low-arousal states derived from AVT task data exhibited similar patterns as those derived from task-free data (compare with Fig. 3). (Right) Participants with fewer instances of the high-arousal state and more occurrences of the low-arousal state had a higher proportion of lapses in relation to total trials. Abbreviations as in Fig. 2.
Fig. S5.
FC differences between high- and low-arousal states identified from task-free and task-based fMRI data. Matrix of two-sample t test results related to FC differences between high- and low-arousal states derived from task-free (Left) and task (Right) condition, thresholded at P < 1E-6 FWE corrected.
DCS Predict Interindividual Differences in Behavioral Performance.
We next investigated if arousal-associated DCS could predict interindividual differences in vigilance performance. To answer this question, we specified an individual’s auditory vigilance task (AVT) performance using the proportion of behavioral lapses across all trials (60 min). An individual’s lapse frequency was positively correlated with dwell time in the low-arousal DCS (ρ = 0.465, P = 0.022) and negatively correlated with her dwell time in the high-arousal DCS (ρ = −0.584, P = 0.003) (Fig. 4, Right). The third DCS, the one identified as neither low- nor high-arousal DCS, did not significantly correlate with an individual’s AVT task performance (r = 0.118, P = 0.583). These findings were obtained using cluster number k = 3, but were also largely replicated using other k values (values 5, 7, and 9) (SI Results and Fig. S6).
Fig. S6.
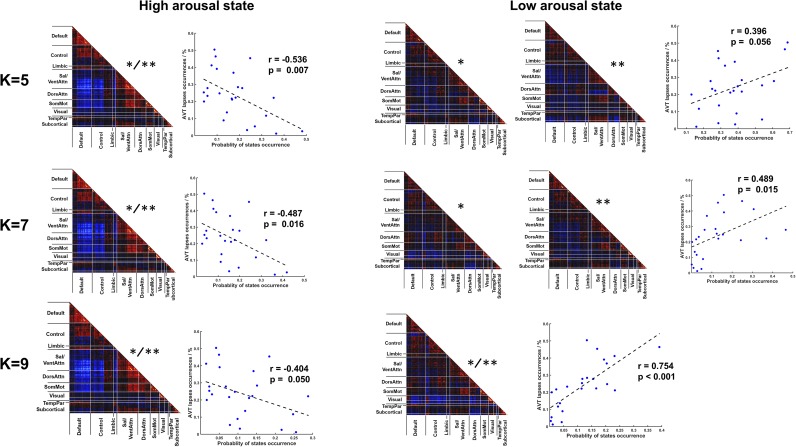
Occurrence of high- and low- DCS correlated with individual differences in AVT task performance. Results obtained using k-means clustering at k = 5, 7, and 9. Two asterisks (**) represent task-based DCS best matched to high- or low-arousal DCS derived from task-free fMRI; a single asterisk (*) represents task-based DCS that predicted intersubject AVT performance.
Fluctuations in Dynamic Connectivity and Vigilance Are Linked.
In addition to predicting individual differences in vigilance across the entire experiment, we wondered whether fluctuations in FC patterns could inform us about intraindividual fluctuation in AVT response times. To quantify fluctuations in FC with respect to the identified high- and low-arousal DCS, we computed the spatial similarity of each windowed covariance matrix to these states using partial correlation. We used the rank-ordered mean reaction time of all trials within each successive sliding window to quantify temporal variation in arousal (Materials and Methods).
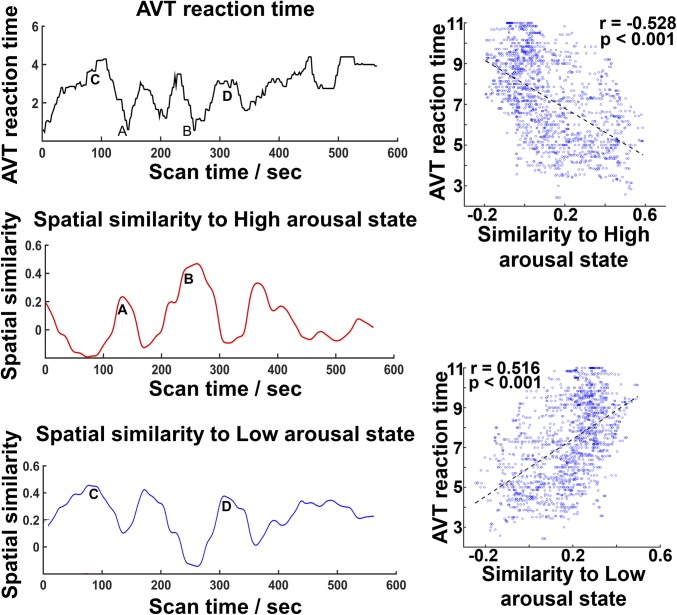
For each participant, faster responses corresponded to periods of greater spatial similarity to the FC pattern associated with high arousal. Conversely, when there was high spatial similarity to the FC pattern associated with low arousal, participants either responded more slowly or not at all (Fig. 5). Across participants, the correlation between the similarity of DCS expression to either high- or low-arousal state, and reaction time was r = −0.325 ± 0.208 (t = −7.60, P < 0.001) for high-arousal state and r = 0.298 ± 0.187 (t = 7.72, P < 0.001) for the low-arousal state. These findings remained significant after accounting for the number of stimuli presented in each time window and autocorrelation (SI Results). Moreover, the correlation between the similarity of DCS expression to the non-SEC–associated state and reaction time was not significant (r = 0.047 ± 0.146, one-sample t tests P = 0.129) (SI Materials and Methods).
Fig. 5.
Fluctuations in DCS correlated with response-time fluctuations. (Left) Time courses of AVT reaction time (Top), spatial similarity scores with the high-arousal DCS (Middle), and low-arousal DCS (Bottom) in a representative participant. “A” and “B” mark time points of fast AVT performance. Conversely, “C” and “D” mark time points of slow AVT performance. (Right) Time windows exhibiting high spatial similarity to the high-arousal DCS were associated with shorter reaction times. Time windows exhibiting high spatial similarity to the low DCS were associated with slower responses or lapses.
Replication of Key Findings Using an Independent Dataset Involving Partial Sleep Deprivation.
To test the robustness of our findings, we analyzed another independent dataset of partially sleep-deprived participants using the identical steps outlined for participants who underwent a single night of total sleep deprivation. Earlier findings were replicated at all levels of analyses, including the SEC–DCS association in the task-free data and the DCS–vigilance relationship associated with AVT task performance (both interindividual difference and intraindividual temporal fluctuations) (SI Results, Replication Study, and Fig. S7).
Fig. S7.
DCS associated with high- and low-arousal following partial sleep deprivation. Analyses using the partial sleep deprivation dataset largely replicated findings based on the main dataset. Patterns of high- (Left) and low- (Right) arousal states at both task-free and AVT task conditions derived from the replication dataset were highly similar to those reported in the main dataset (Figs 3 and 4).
SI Results
DFC Analyses Using Different Parameters.
We evaluated the elbow criteria as the cluster validity index when varying the number of clusters (k) from 2 to 10. The optimal k was found to be 9, which was reported in the main text and Fig. 2. However, we acknowledge that, because of the high dimensionality of the current dataset, identifying the global minimum solution is challenging. To ensure our findings were not significantly influenced by k, we repeated the clustering analysis using three other k values: 3, 5, and 7. This range corresponded to the range of k values frequently used in most dynamic FC studies that showed consistent and reliable brain states estimations (6, 11). The same SEC–DCS relationship was detected when analyzed using different number of clusters, k = 3, 5, and 7 (Fig. S2). Exploratory analysis using higher numbers of clusters k = 11 and 13 also produced very similar findings, except that at k = 11 the correlation between low-arousal state and eye scores did not pass FWE correction for multiple comparisons (P = 0.015) (Fig. S4). Replication analyses were also performed using other window lengths, ranging from 30 to 100 s, and all analyses showed consistent findings for both task-free and task-based fMRI data (Fig. S3).
DFC and Its Relationship with Vigilance.
It is worthwhile to point out that the theoretical “optimal number” of clusters for task fMRI datasets is expected to be very large because of its high-dimensional nature (40,608 data points compared with 5,616 data points in task-free fMRI). Instead of searching for the “optimal k” in task fMRI datasets, which might not be computationally feasible, we performed the k-means clustering over a range of behaviorally meaningful k values (i.e., from 3 to 9), corresponding to the range of k-values in task-free DCS estimation as well as other published fMRI dynamic FC studies (6, 11). The DCS–vigilance relationship largely remained significant over the range of k values (P < 0.05). The dwell time of the task-based DCS that most closely-matched the high-arousal DCS template derived from task-free fMRI was negatively correlated with AVT lapses, regardless of k value (k = 3, 5, 7, and 9 used in the k-means clustering). No other task-based DCS was superior in predicting good task performance (Fig. S6, Left).
DCS–vigilance relationships were also observed for task-based DCS matched to the low arousal state (i.e., dwell time of these DCSs predicted more lapses). However, when k = 5, we found two states that were closely matched to the task-free low-arousal DCS template (Fig. S6, Right): r = 0.895 (marked with two asterisks in Fig. S6) and r = 0.883 (marked with one asterisk in Fig. S6). The latter state (*) but not the former state (**) predicted the lapse frequency (Fig. S6, Right). A similar observation was true with k = 7. The reason for the latter inconsistency could be twofold. First, the low-arousal state could be more heterogeneous compared with the high-arousal state, containing more subject-specific features. As a result, it could have split into subclusters among the subjects. Second, the state matching score between the task-free defined template and task-based data were calculated using spatial correlation between two matrices. It takes the whole-brain FC features into consideration equally, whereas the FC features defining low-arousal state could be more regionally specific. Spatial correlations may not be sensitive enough to differentiate two spatially similar states or identify the best matching states. Future work on intelligent state matching methods based on specific FC features may improve state matching and behavior prediction accuracy.
Number of Stimuli Presented in Each Sliding Window and Temporal Autocorrelation Do Not Affect Intrasubject Task Performance Prediction.
We reran the intrasubject correlation analysis, controlling for the number of stimuli presented in each time window. Our findings remained the same. Across all participants, the mean correlation between spatial similarity to arousal-associated states and task reaction time was r = −0.324 ± 0.207 for the high-arousal state and r = 0.293 ± 0.185 for the low-arousal state (one-sample t test P values were < 0.001 for both).
To minimize the possible effects of autocorrelation on intrasubject correlation analysis, we reran the analysis using the residuals after fitting the data (both AVT reaction time and the similarity scores to high- and low-arousal states) with a first-order autoregressive model. The association between moment-to-moment DFC patterns and intrasubject vigilance performance remained significant (r = −0.300 ± 0.199 for high-arousal state and r = 0.265 ± 0.179 for the low-arousal state, one-sample t tests P < 0.001 for both).
Replication Study.
To test the robustness of our findings, we performed replication analysis using an independent dataset involving partially sleep-deprived participants. The differences between the two datasets are described in Materials and Methods.
We found that the results from the main dataset (total sleep deprivation) and the replication dataset (partial sleep deprivation) were highly similar. Specifically, the high- and low-arousal states in both task-free and task conditions from partially sleep-deprived participants (Fig. S7) closely resembled those derived from participants who underwent total sleep deprivation (main dataset). In the task-free condition, the high-arousal state was associated with increased SEC ratings (k = 9, ρ = 1.000, P < 0.001), whereas the low-arousal state corresponded to decreased SEC ratings (k = 9, ρ = −0.976, P < 0.001). These observations remained the same using different numbers of clusters (ranging from 3 to 9) and were largely consistent across all subjects (group level random effects analysis, P < 0.05).
During the AVT, the association between-state occurrence and task performance was similar to the original experiment. Individuals who spent more time in the high-arousal state were faster on the AVT (ρ = 0.509, P = 0.044), whereas those who evidenced a longer duration in the low arousal state were slower (ρ = −0.582, P = 0.018). With regard to vigilance changes over time, we found that the spatial similarity of transient FC to high- and low-arousal states predicted moment-to-moment task response time (r = −0.346, P < 0.001 for high-arousal state and r = 0.290, P < 0.001 for low-arousal state).
SI Materials and Methods
Participants.
Twenty-nine healthy, young adults from the National University of Singapore were selected from respondents to a web-based questionnaire [see details in our previous work (26)]. These respondents: (i) were between 18 and 35 y of age; (ii) were nonsmokers; (iii) had no history of psychiatric, neurological, or sleep disorders; (iv) consumed no more than two caffeinated drinks per day; (v) had good habitual sleep between 6.5 and 9 h daily (i.e., sleeping before 12:30 AM and getting up before 9:00 AM); and (vi) were not of an extreme chronotype as assessed by a reduced version of the Horne-Östberg Morningness–Eveningness questionnaire (61). All participants were paid for their involvement. Sleep patterns of each participant were monitored throughout the entire duration of the study and only those whose actigraphy (Actiwatch, Philips Respironics) data indicated habitual good sleep (i.e., sleeping no later than 12:30 AM and waking no later than 9:00 AM) were recruited following informed consent.
Participants were instructed not to consume alcohol or caffeinated beverages 24 h before the start of the study. They reported to the laboratory at 7:00 PM and were kept awake overnight under the constant supervision of a research assistant. During this period, the participants were allowed to engage in light activities, such as reading. All subjects were scanned at 6:00 AM the following morning. Of 29 participants, 5 were excluded because of incomplete data collection or failing image quality control, 5 were excluded because of problems with the eye-monitoring camera, and 1 because of excessively frequent eye closures (>70%).
Functional Imaging Data Acquisition.
Two sets of task-free functional fMRI data were acquired, once before and once after an AVT on a 3T Tim Trio scanner (Siemens). A gradient echo-planar imaging (EPI) sequence (TR: 2,000 ms; TE: 30 ms; FA: 90°; FOV: 192 × 192 mm; matrix size: 64 × 64; and voxel size: 3.0 × 3.0 × 3.0 mm3) was used. Thirty-six oblique axial slices (slice thickness: 3 mm) parallel to the AC–PC line were obtained. One-hundred eighty volumes were collected for each of two 6-min task-free fMRI runs. During the task-free scan, the participants were instructed to keep their eyes open in darkness. Prerecorded wake-up calls (e.g., “open your eyes”) were delivered whenever the participants closed their eyes for more than 10 s. It is highly unlikely that subjects would fall into stages other than stage 1 in a short ∼10-s window (i.e., before a wake-up call was delivered). In independent EEG datasets, N2 sleep latency (time to sleep-stage 2) in a sleep-deprived individual is in the order of minutes (e.g., 8–20 min on average in ref. 62). Time to sleep-stage 3 following stage 2 sleep onset would be an additional 8–10 min. No more than 10 reminders per run were allowed to reduce disruption of resting-state connectivity. Concurrent videos of the right eye were acquired using an MR compatible camera (NNL EyeTracking Camera, NordicNeuroLab).
Structural images for coregistration and normalization were acquired using a T1-weighted magnetization-prepared rapid gradient-echo (MP-RAGE) sequence (TR: 2,300 ms; TE: 2.98 ms; FA: 9°; FOV: 256 × 240 mm; matrix size: 256 × 256; and voxel size: 1.0 × 1.0 × 1.0 mm3).
AVT Paradigm.
In the AVT, subjects heard a low-frequency auditory tone and were instructed to respond as quickly as possible by pressing a response grip with the right index finger (Nordic Neurolab). Details have been previously described (23). Briefly, the tones were delivered binaurally via pneumatic headphones and lasted 200 ms (10-ms onset and offset ramps). To eliminate foreperiod effects that can modulate response times based on trial history, we sampled 28 stimulus onset intervals ranging from 4 to 12 s (mean = 6 s) from an exponential distribution (decay constant, τ = 2.03), such that trials with shorter foreperiods would occur more frequently than those with longer ones. A total of 600 such tones were presented across six 10-min runs, separated by 1-min breaks during which data were not collected. We collected 300 fMRI data volumes in each of the 6 auditory vigilance runs (total 60 min).
Functional Imaging Data Preprocessing.
Task-free fMRI data were preprocessed (63) according to the following procedure: (i) the first four EPI volumes were discarded; (ii) motion correction was performed; (iii) time series de-spiking was performed, spatial smoothing (FWHM = 6 mm), and grand mean scaling followed; (iv) temporal band-pass filtering (0.01–0.1 Hz); (v) linear and quadratic trends were removed; (vi) functional and structural images were aligned using Boundary-Based Registration (64); (vii) structural images were normalized to the Montreal Neurological Institute (MNI) 152 standard space using a nonlinear registration (FNIRT); (viii) nonlinear deformations were applied to warp the functional data into MNI 152 space; and (ix) eight nuisance signals were regressed out [i.e., white matter (WM), cerebrospinal flouid (CSF) signals, and six motion parameters]. Conservative WM and CSF compartment masks were defined to cover core regions only in the standard space based on tissue priors [i.e., WM/CSF/gray matter (GM) boundary regions were excluded] to minimize the effects of intersubject anatomical variability. These masks were then registered to each individual’s fMRI space to calculate mean WM and CSF signals for regression. The global brain signal, calculated as the mean fMRI signal of total brain volume, including GM and WM, but excluding CSF, was regressed out from the imaging data (65). The rationale for including this step relates to a dramatic increase in whole-brain fMRI signal following total sleep deprivation as reported in our previously published work (29), as well as in prior work related to drowsiness/reduced vigilance (50, 66). As a result, there will be significantly enhanced functional FC between most pairwise brain regions, masking the smaller, region–signal fluctuations, which are relevant in differentiating distinct time-varying FC patterns across arousal states.
The AVT fMRI data were preprocessed similarly to that of task-free fMRI data, including global signal regression. In addition, to reduce FC that emerged solely as a result of auditory stimuli-related neural coactivations, we removed the task-related BOLD signal activation from the data via general linear modeling using a boxcar regressor (500 ms per stimulus) convolved with a canonical hemodynamic response function (26).
Eye Video Scoring.
Eye video clips (30 frames per second) during task-free fMRI runs were edited into 4-s segments and rated by a trained observer, as previously described (26) (Fig. 1, step 2). Each segment was assigned an eye score value between 1 (eyes fully closed) and 9 (eyes fully open). To ensure that there was no systematic bias in the detection of time-on-task effects on eye-closure events, the video segments of each subject were randomly shuffled during the review process such that the rater was blinded to when the segment under review occurred. For each participant, 180 segments were scored for the 12-min of task-free fMRI data and were up-sampled to 0.5 Hz (one score every 2 s) to match the response time of task-free fMRI data.
Identification of High- and Low-Arousal DCS at Task-Free Condition.
Although findings at different k values were highly similar (Fig. S2), small and subtle differences could exist between them. To estimate the high- and low-arousal DCS that are robust across different clustering parameters, we generated averaged high- and low-arousal DCS templates summed over different k values according to the steps outlined here.
First, from all windowed FC matrices of the entire task-free fMRI dataset, we selected matrices belonging to the identified clusters (i.e., low- and high-arousal states). To more confidently identify the FC features associated with arousal, we specified that the selected matrices had to be consistently labeled as “high” or “low” arousal in at least two of four runs of clustering results obtained with different k values (3, 5, 7, 9).
Second, we performed two-sample t tests between the two groups of selected windowed connectivity matrices (high vs. low arousal) to examine FC differences between every pairwise functional connection. This is preferred to first averaging matrices within each subject and then performing two-sample t tests between subjects, as the high- and low-arousal states were not uniformly distributed across subjects. Group averaging would result in disproportionately heavier weighting from subjects with fewer high-/low-arousal states.
Third, statistical thresholding was performed at P < 1E-6 with FWE Bonferroni correction; that is, corrected for the total number of edges in the matrices (mathematically: P < 1E-6 divided 7,875). The t-statistic matrix in Fig. 3, Lower Left) is a Bonferroni thresholded matrix that was used as the basis to identify major differences in the intranetwork connections (diagonal cells) and the internetwork connections (off-diagonal cells) between the high- and low-arousal states. To visualize the anatomical locations of brain regions that showed FC differences between the high- and low-arousal states (Fig. 3, Lower Right), these brain regions were projected and displayed on the inflated population-average, landmark- and surface-based cortical surface using Caret software, following the same approach as described in a previous work (57).
Non-SEC Related DCS.
In the task-free condition, non-SEC related DCS was identified as the aggregate DCS that was not significantly associated with SEC. This DCS was produced in accordance to the procedure outlined above except for the use of windowed connectivity matrices belonging to any DCS not identified as belonging to either high- or low-arousal states.
Discussion
We studied time-varying whole-brain FC under task-free and task conditions in healthy young adults undergoing a single night of total sleep deprivation. Using degree of SEC as a proxy for level of arousal, we identified recurring FC patterns in the task-free data that conformed to high- and low-arousal DCS, respectively. These states showed systematic differences in FC. The high-arousal state was associated with greater intranetwork connectivity involving the DMN, control, and attention networks, as well as greater anticorrelation between the DMN and attention networks. Visual network, striatal, and thalamic connectivity also differed between the two states. The same two DCS could be identified after regressing out task-related signals associated with performing an AVT. Critically, we found that high- and low-arousal DCS could independently predict interindividual differences in frequency of behavioral lapsing as well as intraindividual fluctuation in response speed. Attesting to their robustness, these findings were replicated using an independent dataset involving partially sleep-deprived participants.
Linking Fluctuations in FC and Behavioral State.
Brain activity during task-free fMRI experiments does not remain in a stationary resting state (33, 34). It has been established that spontaneous fluctuations in intrinsic FC are not simply noise (35) and can be correlated with physiological markers, such as EEG or MEG power at different frequency bands (19, 20), as well as with heart rate variability (21). Shifts in EEG power in the α- and θ-bands correspond to changes in arousal (36–38). Although these results are of physiological relevance, they only indirectly link FC fluctuation and behavioral state, require the use of technically demanding and expensive simultaneous EEG–fMRI methodology, and are difficult to deploy for real-time behavioral assessment. In contrast, monitoring eyelid closure is simple to implement and predicts an increased likelihood of behavioral lapses (23–25, 39). As such, SEC provides readily implementable measure to connect FC fluctuation with behavioral state.
We previously showed that prolonged SEC (distinct from blinks in awake persons) in the sleep-deprived state likely represent brief sleep intrusions (microsleeps) during which responses to auditory stimuli are slow or absent. Sensory threshold elevation during sleep (40) results from reduced transmission of sensory information to higher cortical areas. Specifically, higher cortical processing of sensory inputs, necessary for speedy responses to target stimuli, is attenuated as sleep deepens and higher cortical areas become progressively more isolated from brainstem, subcortical, or primary sensory cortical inputs (41).
Sleep deprivation (27–29) and falling asleep (42, 43) have both been associated with reduced FC within the DMN, as well as reduced anticorrelation between task-positive networks and the DMN. These alterations in FC have also been observed during periods of mind-wandering in the absence of meta-awareness (33) and during eyes-closed rest compared with eyes-opened rest (44). It has been proposed that “descent to sleep” is facilitated by both reduced thalamocortical connectivity at sleep onset (45) and a breakdown of general connectivity associated with deeper, slow-wave sleep (30). Both of these processes reduce the brain’s capacity to integrate information across functional modules (30, 43, 46, 47). Anticorrelation between the DMN and task-positive networks in particular, is thought to reflect the competitive balance between internally and externally oriented cognition and is weakened in conditions of reduced consciousness (48, 49). Indeed, persons evidencing stronger anticorrelation between the DMN and attention networks in the well-rested state appear to be more resilient to sleep deprivation (29).
These observations notwithstanding, the relationship between FC and behavior remains enigmatic. For example, although on the average decline in the DMN and DAN FC with sleep deprivation is associated with increased lapsing, the extent to which stationary FC is altered does not correlate with the frequency of behavioral lapsing (28, 29).
The current strategy of selecting polar DFC states by constraining them with a continuously observable but proxy of behavioral state (SEC) allowed us to transcend the limitations of using static FC of limited networks to uncover FC and behavior mappings. The utility of using SEC in the context of fMRI recordings was recently explored in two studies. The first study documented differences in resting-state fMRI global signal amplitude between eyes-open and eyes-closed states to EEG vigilance (50), and the second study documented fMRI BOLD signal fluctuations to eye-closure and invasive electrophysiological recordings in primates (51). Although relevant and buttressing the claims made here, these studies did not specifically address the triune relationship between fMRI DFC, eyelid status, and vigilance behavior documented here.
Broader Implications of DCS Identification.
A recent meta-analysis of resting-state FC studies found that when using sophisticated fMRI signal analysis methods, epochs containing sleep are present in up to a third of awake studies (5). Because falling asleep modulates FC, proper characterization of awake resting-state FC requires consideration of how frequently such sleep epochs occur. The present work begs the questions: What if, apart from voluntary sleep deprivation, a participant has increased dwell time in the low-arousal state? Would post hoc editing of sleepy epochs using machine-learning techniques be beneficial or would it also remove informative connectivity patterns? Patients with attention-deficit hyperactivity disorder, for example, show increased variance in response times (52) that could be mirrored in increased dwell time in our low-arousal state.
Whereas the present results show an unequivocal link between specific DCS and arousal/vigilance, the high dimensionality of DFC data are such that depending on the behavioral metric used, different states may be uncovered. As such, it is important to point out that although we focused specifically on vigilance, pegging a pattern classifier to other interesting mental states should be feasible, the key challenge being to find a physiological proxy for mental state of interest that can be observed without interrupting the natural flow of thought. A particularly fertile ground to explore would be heterogeneous mind-wandering states (53). Future work could also lend fresh meaning to the metaphor “changing mental gears” when speaking of transitions in mental effort.
Conclusion
By using SECs as a proxy, we tracked temporal fluctuations in behavioral states without relying on potentially disruptive mental probes. We established a direct association between two patterns of FC fluctuations and arousal.
Materials and Methods
Participants, Data Acquisition, and Preprocessing.
Data from 18 participants (9 males; aged 22 ± 2 y) were included in the analyses. All participants provided informed consent in compliance with a protocol approved by the National University of Singapore Institutional Review Board. They were screened for regular sleeping habits and their sleep patterns were monitored 1 wk before the scan (SI Materials and Methods). All participants were scanned at 6:00 AM following 1 night of ∼22-h sleep deprivation (Fig. 1, step 1). Each session comprised two 6-min task-free fMRI runs, once before and once after six 10-min AVT runs (SI Materials and Methods). An eye-tracking camera (NordicNeuroLab) was used to monitor spontaneous eyelid closures throughout the session. fMRI data were preprocessed following our previously described procedures (54) using the FMRIB Software Library (55) and the AFNI software (56) (SI Materials and Methods).
Identifying SEC-Associated DFC States at Rest.
DFC analyses were performed based on a predefined set of 126 ROIs, which included 114 cortical regions derived from an independent analysis of whole-brain functional organization in a large sample of 1,000 subjects (57) and 12 subcortical structures from the Automated Anatomical Labeling template (58). The 114 cortical regions were further grouped into eight intrinsic connectivity networks: the DMN, control, limbic, visual, somatosensory, temporal-parietal, ventral attention, and DAN (57).
DFC between the 126 ROIs was estimated using a sliding-window approach (11). Specifically, tapered time windows were created by convolving a rectangle (width = 40 s) with a Gaussian window (window α = 6 s). The covariance matrices of the windowed fMRI data were estimated from a regularized precision matrix using graphical LASSO methods (59, 60). L1 norm penalties were applied on the precision matrices to promote sparsity and were the group mean of individually optimized L1 penalties based on the log-likelihood of unobserved data, as previously described (11). This was repeated successively along the fMRI time course in steps of 1 repetition time (TR; 2 s), resulting in 156 windowed covariance matrices per 6-min run. We also repeated the analyses using 30-, 70-, and 100-s window lengths to ensure the robustness of our findings.
To derive distinct DCS, a k-means clustering algorithm was applied to all windowed covariance matrices (18 subjects × 2 runs × 156 windows per runs = 5,616 windows) using city block distance as the similarity measure. To reduce redundancy between time windows and to reduce computational load, we performed subsampling along the temporal dimension to identify windowed covariance matrices with local maxima in FC variance. This resulted in a subset of 334 windows that were clustered using k-means. The optimal number of clusters (k) was determined to be nine based on elbow criterion, computed as the ratio of within-cluster to between-cluster distances, after searching a range of k from 2 to 10. Clustering was repeated 10 times with random initialization of starting centroid locations. The resulting centroids from the subsamples were then used as the starting point for clustering of all data (5,616 windows) (Fig. 1, step 2). We repeated the same procedure for different numbers of clusters k = 3, 5, and 7.
To identify SEC-related DCS, we correlated the probabilities of DCS occurrence with SEC scores using Spearman’s rank correlation. The same tapered time window used previously for fMRI data analysis was applied to the time courses of SEC scores to derive SEC ratings per window. These windowed SEC scores were subsequently binned into 8 (1-2-8-9) to estimate the probability of DCS occurrences for each SEC bin (Fig. 1, step 3). The occurrence probability of each DCS at each SEC bin was estimated as the proportion of time each windowed connectivity matrix was assigned to that DCS cluster.
Deriving High- and Low-Arousal DFC States from Task-Based fMRI and Correlating These with AVT Performance.
The sliding-window analysis and k-means clustering performed on task-based fMRI data followed the same steps as task-free fMRI data described above. We regressed out task-related activation from BOLD time courses before sliding-window analysis (SI Materials and Methods). We used the FC patterns of high- and low-arousal DCS derived from task-free data as state templates. The DCS obtained from the task condition matched to these state templates were identified based on a pairwise matching method using Pearson’s correlation coefficients as the spatial similarity index (Fig. 1, step 4). We also repeated the template matching procedure using city block distances between paired matrices.
Individual differences in AVT performance were correlated with probability of occurrence of the matching task DCS using Spearman’s rank correlation coefficient. The proportion of AVT lapses was defined as the ratio between trials of no response or with reaction time greater than 800 ms (2× mean reaction time) to the total number of trials administered (Fig. 1, step 5).
Intrasubject moment-to-moment AVT performance was correlated with the arousal-associated DCS profiles over time. We computed the spatial similarity of the FC pattern of each window to the patterns in high- and low-arousal DCS, respectively. To control the shared information between the two arousal states, partial correlations were used. To characterize the brain–behavior relationship across all AVT trials, including those with no response, we first categorized reaction times of all responded trials into 10 ranks (e.g., the rank of 1 corresponds to the fastest 10% of trials). Trials with no response were assigned the rank of 11. For each participant, the mean rank of all trials within each window was calculated and then correlated with its spatial similarity index to high- and low-arousal states using Pearson’s correlation. To test if these brain–behavior relationships were consistent across all subjects, each individual’s correlation coefficients were Fisher Z-transformed and tested using a one-sample t test.
Replication Analyses Based on Partial Sleep-Deprivation Data.
The partial sleep-deprivation dataset comprised of 17 participants (age = 22.2 ± 1.8, 9 males) was acquired from an independent study (SI Results, Replication Study). The participant selection criteria and experimental set-up were similar to the main dataset, except for the following: (i) subjects were restricted to 5 h of nocturnal sleep on the previous night and underwent scans at 3:00 PM, (ii) the two 6-min task-free fMRI scans were performed back-to-back at the beginning, and (iii) concurrent EEG data were collected. Both task-free and task-based imaging data were preprocessed and analyzed using the same DFC method as those in the total sleep-deprivation dataset.
Acknowledgments
The study was supported by grants from National Medical Research Council, Singapore (NMRC/STaR/0004/2008 and NMRC/STaR/0015/2013) and the Far East Organization (to M.W.L.C.); Biomedical Research Council, Singapore Grant BMRC 04/1/36/372 (to J.Z.); National Medical Research Council, Singapore Grant CBRG/0088/2015 (to J.Z.); and Duke-National University of Singapore Medical School Signature Research Program, funded by the Ministry of Health, Singapore (to J.Z.).
Footnotes
The authors declare no conflict of interest.
This article is a PNAS Direct Submission.
This article contains supporting information online at www.pnas.org/lookup/suppl/doi:10.1073/pnas.1523980113/-/DCSupplemental.
References
- 1.Fox MD, Raichle ME. Spontaneous fluctuations in brain activity observed with functional magnetic resonance imaging. Nat Rev Neurosci. 2007;8(9):700–711. doi: 10.1038/nrn2201. [DOI] [PubMed] [Google Scholar]
- 2.Sonuga-Barke EJ, Castellanos FX. Spontaneous attentional fluctuations in impaired states and pathological conditions: A neurobiological hypothesis. Neurosci Biobehav Rev. 2007;31(7):977–986. doi: 10.1016/j.neubiorev.2007.02.005. [DOI] [PubMed] [Google Scholar]
- 3.Handwerker DA, Roopchansingh V, Gonzalez-Castillo J, Bandettini PA. Periodic changes in fMRI connectivity. Neuroimage. 2012;63(3):1712–1719. doi: 10.1016/j.neuroimage.2012.06.078. [DOI] [PMC free article] [PubMed] [Google Scholar]
- 4.Hutchison RM, et al. Dynamic functional connectivity: Promise, issues, and interpretations. Neuroimage. 2013;80:360–378. doi: 10.1016/j.neuroimage.2013.05.079. [DOI] [PMC free article] [PubMed] [Google Scholar]
- 5.Tagliazucchi E, Laufs H. Decoding wakefulness levels from typical fMRI resting-state data reveals reliable drifts between wakefulness and sleep. Neuron. 2014;82(3):695–708. doi: 10.1016/j.neuron.2014.03.020. [DOI] [PubMed] [Google Scholar]
- 6.Barttfeld P, et al. Signature of consciousness in the dynamics of resting-state brain activity. Proc Natl Acad Sci USA. 2015;112(3):887–892. doi: 10.1073/pnas.1418031112. [DOI] [PMC free article] [PubMed] [Google Scholar]
- 7.Hampson M, Driesen NR, Skudlarski P, Gore JC, Constable RT. Brain connectivity related to working memory performance. J Neurosci. 2006;26(51):13338–13343. doi: 10.1523/JNEUROSCI.3408-06.2006. [DOI] [PMC free article] [PubMed] [Google Scholar]
- 8.Di Martino A, et al. Relationship between cingulo-insular functional connectivity and autistic traits in neurotypical adults. Am J Psychiatry. 2009;166(8):891–899. doi: 10.1176/appi.ajp.2009.08121894. [DOI] [PMC free article] [PubMed] [Google Scholar]
- 9.Seeley WW, et al. Dissociable intrinsic connectivity networks for salience processing and executive control. J Neurosci. 2007;27(9):2349–2356. doi: 10.1523/JNEUROSCI.5587-06.2007. [DOI] [PMC free article] [PubMed] [Google Scholar]
- 10.Rosenberg MD, et al. A neuromarker of sustained attention from whole-brain functional connectivity. Nat Neurosci. 2016;19(1):165–171. doi: 10.1038/nn.4179. [DOI] [PMC free article] [PubMed] [Google Scholar]
- 11.Allen EA, et al. Tracking whole-brain connectivity dynamics in the resting state. Cereb Cortex. 2014;24(3):663–676. doi: 10.1093/cercor/bhs352. [DOI] [PMC free article] [PubMed] [Google Scholar]
- 12.Shirer WR, Ryali S, Rykhlevskaia E, Menon V, Greicius MD. Decoding subject-driven cognitive states with whole-brain connectivity patterns. Cereb Cortex. 2012;22(1):158–165. doi: 10.1093/cercor/bhr099. [DOI] [PMC free article] [PubMed] [Google Scholar]
- 13.Birn RM, Diamond JB, Smith MA, Bandettini PA. Separating respiratory-variation-related fluctuations from neuronal-activity-related fluctuations in fMRI. Neuroimage. 2006;31(4):1536–1548. doi: 10.1016/j.neuroimage.2006.02.048. [DOI] [PubMed] [Google Scholar]
- 14.Chang C, Glover GH. Effects of model-based physiological noise correction on default mode network anti-correlations and correlations. Neuroimage. 2009;47(4):1448–1459. doi: 10.1016/j.neuroimage.2009.05.012. [DOI] [PMC free article] [PubMed] [Google Scholar]
- 15.Smallwood J, et al. Escaping the here and now: Evidence for a role of the default mode network in perceptually decoupled thought. Neuroimage. 2013;69:120–125. doi: 10.1016/j.neuroimage.2012.12.012. [DOI] [PubMed] [Google Scholar]
- 16.Mason MF, et al. Wandering minds: The default network and stimulus-independent thought. Science. 2007;315(5810):393–395. doi: 10.1126/science.1131295. [DOI] [PMC free article] [PubMed] [Google Scholar]
- 17.Andrews-Hanna JR. The brain’s default network and its adaptive role in internal mentation. Neuroscientist. 2012;18(3):251–270. doi: 10.1177/1073858411403316. [DOI] [PMC free article] [PubMed] [Google Scholar]
- 18.Calhoun VD, Miller R, Pearlson G, Adalı T. The chronnectome: Time-varying connectivity networks as the next frontier in fMRI data discovery. Neuron. 2014;84(2):262–274. doi: 10.1016/j.neuron.2014.10.015. [DOI] [PMC free article] [PubMed] [Google Scholar]
- 19.Chang C, Liu Z, Chen MC, Liu X, Duyn JH. EEG correlates of time-varying BOLD functional connectivity. Neuroimage. 2013;72:227–236. doi: 10.1016/j.neuroimage.2013.01.049. [DOI] [PMC free article] [PubMed] [Google Scholar]
- 20.de Pasquale F, et al. Temporal dynamics of spontaneous MEG activity in brain networks. Proc Natl Acad Sci USA. 2010;107(13):6040–6045. doi: 10.1073/pnas.0913863107. [DOI] [PMC free article] [PubMed] [Google Scholar]
- 21.Chang C, et al. Association between heart rate variability and fluctuations in resting-state functional connectivity. Neuroimage. 2013;68:93–104. doi: 10.1016/j.neuroimage.2012.11.038. [DOI] [PMC free article] [PubMed] [Google Scholar]
- 22.Smallwood J, et al. Subjective experience and the attentional lapse: Task engagement and disengagement during sustained attention. Conscious Cogn. 2004;13(4):657–690. doi: 10.1016/j.concog.2004.06.003. [DOI] [PubMed] [Google Scholar]
- 23.Ong JL, Asplund CL, Chia TT, Chee MW. Now you hear me, now you don’t: Eyelid closures as an indicator of auditory task disengagement. Sleep. 2013;36(12):1867–1874. doi: 10.5665/sleep.3218. [DOI] [PMC free article] [PubMed] [Google Scholar]
- 24.Dinges DF, Mallis MM, Maislin G, Powell JW. Evaluation of Techniques for Ocular Measurement as an Index of Fatigue and the Basis for Alertness Management, NHTSA report no. DOT HS 808 762. National Highway Traffic Safety Administration; Washington, DC: 1998. [Google Scholar]
- 25.Johns MW, Tucker A, Chapman R, Crowley K, Michael N. Monitoring eye and eyelid movements by infrared reflectance oculography to measure drowsiness in drivers. Somnologie (Berl) 2007;11(4):234–242. [Google Scholar]
- 26.Ong JL, et al. Co-activated yet disconnected—Neural correlates of eye closures when trying to stay awake. Neuroimage. 2015;118:553–562. doi: 10.1016/j.neuroimage.2015.03.085. [DOI] [PubMed] [Google Scholar]
- 27.Sämann PG, et al. Increased sleep pressure reduces resting state functional connectivity. MAGMA. 2010;23(5-6):375–389. doi: 10.1007/s10334-010-0213-z. [DOI] [PubMed] [Google Scholar]
- 28.De Havas JA, Parimal S, Soon CS, Chee MW. Sleep deprivation reduces default mode network connectivity and anti-correlation during rest and task performance. Neuroimage. 2012;59(2):1745–1751. doi: 10.1016/j.neuroimage.2011.08.026. [DOI] [PubMed] [Google Scholar]
- 29.Yeo BT, Tandi J, Chee MW. Functional connectivity during rested wakefulness predicts vulnerability to sleep deprivation. Neuroimage. 2015;111:147–158. doi: 10.1016/j.neuroimage.2015.02.018. [DOI] [PubMed] [Google Scholar]
- 30.Spoormaker VI, et al. Development of a large-scale functional brain network during human non-rapid eye movement sleep. J Neurosci. 2010;30(34):11379–11387. doi: 10.1523/JNEUROSCI.2015-10.2010. [DOI] [PMC free article] [PubMed] [Google Scholar]
- 31.Doran SM, Van Dongen HP, Dinges DF. Sustained attention performance during sleep deprivation: Evidence of state instability. Arch Ital Biol. 2001;139(3):253–267. [PubMed] [Google Scholar]
- 32.Leonardi N, Van De Ville D. On spurious and real fluctuations of dynamic functional connectivity during rest. Neuroimage. 2015;104:430–436. doi: 10.1016/j.neuroimage.2014.09.007. [DOI] [PubMed] [Google Scholar]
- 33.Christoff K, Gordon AM, Smallwood J, Smith R, Schooler JW. Experience sampling during fMRI reveals default network and executive system contributions to mind wandering. Proc Natl Acad Sci USA. 2009;106(21):8719–8724. doi: 10.1073/pnas.0900234106. [DOI] [PMC free article] [PubMed] [Google Scholar]
- 34.Richiardi J, Eryilmaz H, Schwartz S, Vuilleumier P, Van De Ville D. Decoding brain states from fMRI connectivity graphs. Neuroimage. 2011;56(2):616–626. doi: 10.1016/j.neuroimage.2010.05.081. [DOI] [PubMed] [Google Scholar]
- 35.Fox MD, et al. The human brain is intrinsically organized into dynamic, anticorrelated functional networks. Proc Natl Acad Sci USA. 2005;102(27):9673–9678. doi: 10.1073/pnas.0504136102. [DOI] [PMC free article] [PubMed] [Google Scholar]
- 36.Strijkstra AM, Beersma DG, Drayer B, Halbesma N, Daan S. Subjective sleepiness correlates negatively with global alpha (8–12 Hz) and positively with central frontal theta (4–8 Hz) frequencies in the human resting awake electroencephalogram. Neurosci Lett. 2003;340(1):17–20. doi: 10.1016/s0304-3940(03)00033-8. [DOI] [PubMed] [Google Scholar]
- 37.Klimesch W. EEG alpha and theta oscillations reflect cognitive and memory performance: A review and analysis. Brain Res Brain Res Rev. 1999;29(2-3):169–195. doi: 10.1016/s0165-0173(98)00056-3. [DOI] [PubMed] [Google Scholar]
- 38.Makeig S, Jung TP. Tonic, phasic, and transient EEG correlates of auditory awareness in drowsiness. Brain Res Cogn Brain Res. 1996;4(1):15–25. doi: 10.1016/0926-6410(95)00042-9. [DOI] [PubMed] [Google Scholar]
- 39.Tijerina LGM, Stoltzfus D, Johnston S, Goodman MJ, Wierwille WW. A Preliminary Assessment of Algorithms for Drowsy and Inattentive Driver Detection on the Road. National Highway Traffic Safety Administration; Washington, DC: 1998. [Google Scholar]
- 40.Portas CM, et al. Auditory processing across the sleep-wake cycle: Simultaneous EEG and fMRI monitoring in humans. Neuron. 2000;28(3):991–999. doi: 10.1016/s0896-6273(00)00169-0. [DOI] [PubMed] [Google Scholar]
- 41.Massimini M, et al. Breakdown of cortical effective connectivity during sleep. Science. 2005;309(5744):2228–2232. doi: 10.1126/science.1117256. [DOI] [PubMed] [Google Scholar]
- 42.Larson-Prior LJ, et al. Cortical network functional connectivity in the descent to sleep. Proc Natl Acad Sci USA. 2009;106(11):4489–4494. doi: 10.1073/pnas.0900924106. [DOI] [PMC free article] [PubMed] [Google Scholar]
- 43.Horovitz SG, et al. Decoupling of the brain’s default mode network during deep sleep. Proc Natl Acad Sci USA. 2009;106(27):11376–11381. doi: 10.1073/pnas.0901435106. [DOI] [PMC free article] [PubMed] [Google Scholar]
- 44.Van Dijk KR, et al. Intrinsic functional connectivity as a tool for human connectomics: Theory, properties, and optimization. J Neurophysiol. 2010;103(1):297–321. doi: 10.1152/jn.00783.2009. [DOI] [PMC free article] [PubMed] [Google Scholar]
- 45.Poudel GR, Innes CR, Bones PJ, Watts R, Jones RD. Losing the struggle to stay awake: Divergent thalamic and cortical activity during microsleeps. Hum Brain Mapp. 2014;35(1):257–269. doi: 10.1002/hbm.22178. [DOI] [PMC free article] [PubMed] [Google Scholar]
- 46.Tononi G, Massimini M. Why does consciousness fade in early sleep? Ann N Y Acad Sci. 2008;1129:330–334. doi: 10.1196/annals.1417.024. [DOI] [PubMed] [Google Scholar]
- 47.Sämann PG, et al. Development of the brain’s default mode network from wakefulness to slow wave sleep. Cereb Cortex. 2011;21(9):2082–2093. doi: 10.1093/cercor/bhq295. [DOI] [PubMed] [Google Scholar]
- 48.Boveroux P, et al. Breakdown of within- and between-network resting state functional magnetic resonance imaging connectivity during propofol-induced loss of consciousness. Anesthesiology. 2010;113(5):1038–1053. doi: 10.1097/ALN.0b013e3181f697f5. [DOI] [PubMed] [Google Scholar]
- 49.Hannawi Y, Lindquist MA, Caffo BS, Sair HI, Stevens RD. Resting brain activity in disorders of consciousness: A systematic review and meta-analysis. Neurology. 2015;84(12):1272–1280. doi: 10.1212/WNL.0000000000001404. [DOI] [PMC free article] [PubMed] [Google Scholar]
- 50.Wong CW, DeYoung PN, Liu TT. Differences in the resting-state fMRI global signal amplitude between the eyes open and eyes closed states are related to changes in EEG vigilance. Neuroimage. 2016;124(Pt A):24–31. doi: 10.1016/j.neuroimage.2015.08.053. [DOI] [PubMed] [Google Scholar]
- 51.Chang C, et al. Tracking brain arousal fluctuations with fMRI. Proc Natl Acad Sci USA. 2016;113(16):4518–4523. doi: 10.1073/pnas.1520613113. [DOI] [PMC free article] [PubMed] [Google Scholar]
- 52.Castellanos FX, et al. Varieties of attention-deficit/hyperactivity disorder-related intra-individual variability. Biol Psychiatry. 2005;57(11):1416–1423. doi: 10.1016/j.biopsych.2004.12.005. [DOI] [PMC free article] [PubMed] [Google Scholar]
- 53.Fox KC, Spreng RN, Ellamil M, Andrews-Hanna JR, Christoff K. The wandering brain: Meta-analysis of functional neuroimaging studies of mind-wandering and related spontaneous thought processes. Neuroimage. 2015;111:611–621. doi: 10.1016/j.neuroimage.2015.02.039. [DOI] [PubMed] [Google Scholar]
- 54.Ng KK, Lo JC, Lim JK, Chee MW, Zhou J. Reduced functional segregation between the default mode network and the executive control network in healthy older adults: A longitudinal study. Neuroimage. 2016;133:321–330. doi: 10.1016/j.neuroimage.2016.03.029. [DOI] [PubMed] [Google Scholar]
- 55.Jenkinson M, Beckmann CF, Behrens TE, Woolrich MW, Smith SM. FSL. Neuroimage. 2012;62(2):782–790. doi: 10.1016/j.neuroimage.2011.09.015. [DOI] [PubMed] [Google Scholar]
- 56.Cox RW. AFNI: Software for analysis and visualization of functional magnetic resonance neuroimages. Comput Biomed Res. 1996;29(3):162–173. doi: 10.1006/cbmr.1996.0014. [DOI] [PubMed] [Google Scholar]
- 57.Yeo BT, et al. The organization of the human cerebral cortex estimated by intrinsic functional connectivity. J Neurophysiol. 2011;106(3):1125–1165. doi: 10.1152/jn.00338.2011. [DOI] [PMC free article] [PubMed] [Google Scholar]
- 58.Tzourio-Mazoyer N, et al. Automated anatomical labeling of activations in SPM using a macroscopic anatomical parcellation of the MNI MRI single-subject brain. Neuroimage. 2002;15(1):273–289. doi: 10.1006/nimg.2001.0978. [DOI] [PubMed] [Google Scholar]
- 59.Smith SM, et al. Network modelling methods for FMRI. Neuroimage. 2011;54(2):875–891. doi: 10.1016/j.neuroimage.2010.08.063. [DOI] [PubMed] [Google Scholar]
- 60.Friedman J, Hastie T, Tibshirani R. Sparse inverse covariance estimation with the graphical lasso. Biostatistics. 2008;9(3):432–441. doi: 10.1093/biostatistics/kxm045. [DOI] [PMC free article] [PubMed] [Google Scholar]
- 61.Horne JA, Ostberg O. A self-assessment questionnaire to determine morningness-eveningness in human circadian rhythms. Int J Chronobiol. 1976;4(2):97–110. [PubMed] [Google Scholar]
- 62.Ong JL, Lo JC, Gooley JJ, Chee MW. EEG across multiple nights of sleep restriction and recovery in adolescents: The Need for Sleep study. Sleep. 2016;39(6):1233–1240. doi: 10.5665/sleep.5840. [DOI] [PMC free article] [PubMed] [Google Scholar]
- 63.Zuo XN, et al. Reliable intrinsic connectivity networks: Test-retest evaluation using ICA and dual regression approach. Neuroimage. 2010;49(3):2163–2177. doi: 10.1016/j.neuroimage.2009.10.080. [DOI] [PMC free article] [PubMed] [Google Scholar]
- 64.Greve DN, Fischl B. Accurate and robust brain image alignment using boundary-based registration. Neuroimage. 2009;48(1):63–72. doi: 10.1016/j.neuroimage.2009.06.060. [DOI] [PMC free article] [PubMed] [Google Scholar]
- 65.Geerligs L, Renken RJ, Saliasi E, Maurits NM, Lorist MM. A brain-wide study of age-related changes in functional connectivity. Cereb Cortex. 2015;25(7):1987–1999. doi: 10.1093/cercor/bhu012. [DOI] [PubMed] [Google Scholar]
- 66.Fukunaga M, et al. Large-amplitude, spatially correlated fluctuations in BOLD fMRI signals during extended rest and early sleep stages. Magn Reson Imaging. 2006;24(8):979–992. doi: 10.1016/j.mri.2006.04.018. [DOI] [PubMed] [Google Scholar]


