

Abstract
Background
The Senior Walking Environmental Assessment Tool (SWEAT), an instrument for measuring built environmental features associated with physical activity of older adults, was revised to create an easier-to-use tool for use by practitioners and community members.
Methods
Inter-rater and intra-rater reliability of the modified instrument (SWEAT-R) was assessed in Portland, Oregon in 2007. Five trained observers audited street segments in 12 neighborhoods, resulting in 361 pairs of audits, including 63 repeated audits.
Results
Overall, 88% and 75% of items assessed had good or excellent inter-rater and intra-rater reliability, respectively. The revised instrument required less time to complete than the original instrument, while obtaining more information.
Conclusion
SWEAT-R provides easy to gather, reliable data for use in community-based audits of built environment in relation to walking among older adults.
Keywords: Older adults, Environment, Residence characteristics, Research design, Instrumentation, Walking, Reproducibility of results
Introduction
A substantial body of evidence indicates that regular, moderate-intensity physical activity, such as brisk walking, is sufficient for older adults to achieve positive health outcomes (Paterson et al., 2007) and is correlated with neighborhood design (Nagel et al, 2008).
Senior pedestrians have unique built-environmental needs, such as smooth sidewalk surfaces and curb cuts to reduce falls, sidewalk width sufficient to accommodate a walker, and benches available for resting (Michael et al, 2006). The Senior Walking Environmental Audit Tool (SWEAT) was developed to assist researchers in analyzing data collected in the service of understanding the influence of the physical environment on physical activity of older adults (Cunningham et al, 2005). SWEAT is organized into four domains: (a) functionality (structural aspects of the environment, such as building types and sidewalks); (b) safety, including personal and traffic safety attributes; (c) aesthetics (quality of micro-scale urban design and visual appeal of streetscape); and (d) destinations (availability of resources and services, such as transportation). SWEAT’s inter- and intra-rater reliability ranged from good to excellent, with functionality and destinations being less reliable than other categories (Cunningham et al, 2005).
However, SWEAT is time consuming to complete and not user-friendly for older adults and practitioners interested in assessing neighborhood built environment in order to recommend environmental improvements or design health promotion programs. As part of a planned revision of SWEAT, the Irvine-Minnesota Inventory (IMI) was identified as a useful model based on ease of use (Day et al, 2006) and excellent reliability (Boarnet et al, 2006). The IMI was designed to measure a wide range of built environment features that are potentially linked to active living, especially walking, but was not designed to be specific to older adults. The IMI used standardized rating scales and instructions for observers as compared to more free-response questions in SWEAT and included items related to design (e.g., big box stores and gathering places such as coffee shops) not captured in SWEAT.
In a series of conference calls, the developers of SWEAT and the developers of the IMI (YLM, KD), as well as two experts in aging and environment (AM, HC) and two graduate research assistants in public health and gerontology (EK, AS) developed a modified version of SWEAT (referred to as SWEAT-R hereafter). SWEAT-R integrated items from the IMI, as well as additional items related to older adults’ needs (e.g., senior housing) that had been missing from the original version of SWEAT. The tool was also reorganized to reduce time required for observers to complete the audit while walking the segment. The modified version contains 162 items, compared to 92 in the original version. A simple and easy to use training module was developed based on IMI materials. This paper presents results of reliability tests of SWEAT-R.
Methods
Twelve neighborhoods in the Portland metropolitan region were audited using SWEAT-R in August and September 2007. Neighborhoods were selected based on residences of participants in an on-going study of community-dwelling older adults. The neighborhoods were geographically evenly distributed within the region, representing traditional urban and suburban areas. Five neighborhoods had median annual household incomes greater than $50,000. The number of intersections per square mile, a measure of street connectivity, ranged from 138 to 795. Land use mix, adapted from Frank et al., 2004, ranged from 0.17 to 0.70 (where 0=uniform land use and 1=equal proportion of uses). Street segments, defined as a section of road between two intersections (Pikora et al, 2002), in each neighborhood were obtained from Metro, the planning agency for the Portland metropolitan region. Up to 30 street segments per neighborhood were randomly selected for audits, for a total of 321 observed segments.
Five observers were trained in two 4-hour classroom sessions and one 4-hour field session. In the classroom sessions, each audit item was discussed using a PowerPoint training protocol to illustrate items when appropriate. In the field session, observers collected data as a group on pre-identified segments and following data collection discussed appropriate coding decisions with trainers. Observers met with study staff weekly to discuss issues or questions. Observers worked in pairs, but performed independent audits and were instructed not to discuss coding. Forty-two segments in three neighborhoods were randomly selected to be re-audited by one or both of the original observers. Segments were re-audited on average 10 days (standard deviation=4.8) after the initial observation. Audits were conducted over seven weeks. The average temperature on days of observation was 68 °F; it was raining during less than 1% of audits. During data cleaning, items were recoded according to the appropriate skip pattern (i.e., if observers indicated no crossing area, all crossing-area items were automatically set to ‘not applicable’).
Statistical analyses
Inter-rater reliability was assessed by comparing the audits of paired observers. Intra-rater reliability was assessed by comparing an observer’s first and second audits of the same segment. Kappa scores were calculated for categorical variables. Levels of reproducibility correspond to: poor (k<0.4), fair (0.4–0.59), good (0.6–0.74), and excellent (≥0.75) (Rosner, 2006). Intraclass correlation coefficients were calculated for continuous variables using the same reproducibility levels (Rosner, 2006). Items with no variability (i.e., all segments observed had the same value) were excluded. Analysis was performed in SAS (SAS Institute Inc., Cary NC, 2003).
Results
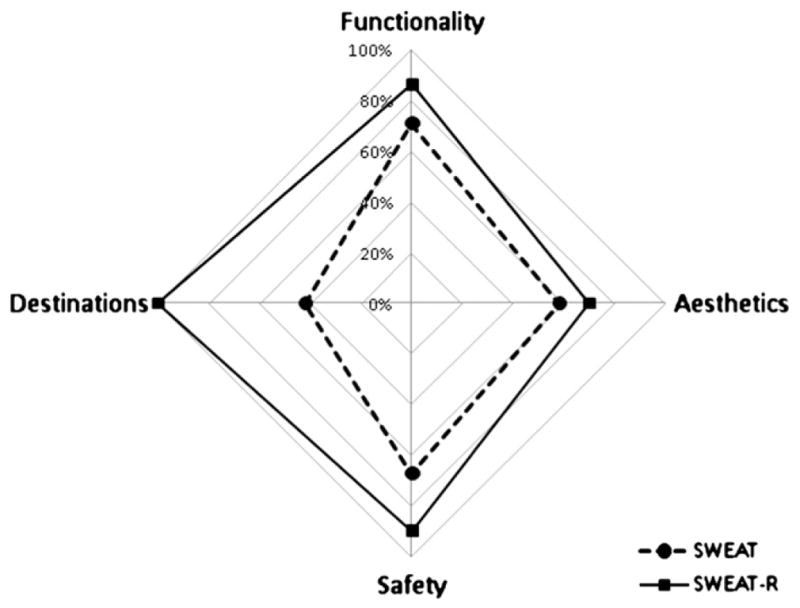
We analyzed 361 pairs of audits, including 63 repeated audits. Overall, 88% and 75% of items assessed had good or excellent inter-rater and intra-rater reliability, respectively. Table 1 summarizes reliability by domain. At least 60% of items within each domain were reliable across and within observers. Reliability of SWEAT-R was improved from the original instrument on all domains (Fig. 1). Observers spent an average of 7.4 minutes per segment, as compared to 17 for the original instrument (Cunningham et al, 2005).
Table 1.
Inter-rater and intra-rater reliability of the revised Senior Walking Environmental Assessment Tool (SWEAT-R) by domain (Portland, Oregon, 2007)
| No. of items | Inter-Rater
|
Intra-Rater
|
|||||||
|---|---|---|---|---|---|---|---|---|---|
| Included itemsa | Excellent | Good | Percent reliable | Included itemsa | Excellent >0.75 | Good >0.60 | Percent reliable | ||
| Functionality | 80 | 66 | 49 | 8 | 86% | 51 | 28 | 10 | 75% |
| Buildingsb | 51 | 40 | 26 | 7 | 28 | 12 | 6 | ||
| Sidewalksc | 14 | 13 | 11 | 1 | 12 | 9 | 1 | ||
| Streetd | 6 | 4 | 3 | 0 | 2 | 1 | 0 | ||
| Street Lifee | 9 | 9 | 9 | 0 | 9 | 6 | 3 | ||
| Aestheticsf | 10 | 10 | 6 | 1 | 70% | 10 | 4 | 2 | 60% |
| Safety | 59 | 58 | 49 | 3 | 90% | 41 | 17 | 13 | 73% |
| Personalg | 48 | 47 | 45 | 1 | 32 | 12 | 11 | ||
| Traffich | 11 | 11 | 4 | 2 | 9 | 5 | 2 | ||
| Destinationsi | 13 | 11 | 9 | 2 | 100% | 9 | 5 | 4 | 100% |
Excellent is defined as Kappa score≥0.75; Good is defined as Kappa score 0.6–0.74.
Items with no variability were excluded from analysis.
Categorical: land uses present, predominant building height, vertical mixed-use presence, distinctive building types present. Continuous: none.
Categorical: sidewalk presence, continuity, material, condition, slope, obstructions, cover. Continuous: sidewalk width.
Categorical: traffic direction, street condition, street material. Continuous: none.
Categorical: bench features, buffer zone presence, porch presence, outdoor dining presence. Continuous: bench count.
Categorical: bench condition, building condition, yard condition, bars on windows, litter present, abandoned buildings present, quality of public space. Continuous: tree count.
Categorical: intended crossing, marked crossing curb cuts present, curb cut features, stop sign present, yield sign present, pedestrian crossing sign present, pedestrian activated signal present, pedestrian overpass/underpass present, light at transit stop. Continuous: street light count, buffer zone width, curb height.
Categorical: lanes of traffic, bike lane presence, traffic calming devices present. Continuous: none.
Categorical: transit stop presence, dead-end street, public parking presence, gathering places present, senior housing presence, senior activity/service present, public restroom presence. Continuous: none.
Fig. 1.
Discussion
These results demonstrate that revisions to SWEAT resulted in improved reliability, and reduced time in using the audit tool to gather a similar or greater amount of data. Observers had good-to-excellent agreement on 88% of items, compared to 67% using the original instrument (Cunningham et al, 2005). The reduction in time is attributable to the removal of most open-ended responses, and to reordering items to require fewer walks along the segment. Similar to the original instrument, SWEAT-R exhibits lower inter- and intra-rater reliability on aesthetic items requiring subjective assessment (e.g., litter presence, public-space quality) compared to other domains. Difficulty assessing aesthetic qualities of the physical environment has also been observed with other audit instruments (Pikora et al, 2002), but greater reliability reported by researchers using the IMI (Boarnet et al, 2006) suggests that additional training may improve agreement on subjective items. For example, the classroom session could be augmented to include additional photos examples and additional segments selected to have specific aesthetic attributes could be added to the field training.
Reviewing reliability scores for individual items revealed that observers had difficulty determining whether a traffic control device was present, indicating that additional training materials specific to this area is needed. A new item assessing street condition also exhibited low agreement.
Study limitations and strengths
Although the observed neighborhoods represented both urban and suburban areas within the Portland metro area, the audit results indicate less variability between neighborhoods in certain characteristics (i.e., land uses and street material) than expected. Due to lack of variability, 10% and 31% of items could not be assessed for inter-rater and intra-rater reliability, respectively. For example, no observed segments were reported to have a post office or gas station, and all re-audited segments had hard-surface streets. Strengths of this study include a larger sample size and greater variety in the age and geography of audit neighborhoods than was achieved in the original SWEAT reliability analysis.
Conclusion
Revisions expanded the scope and improved the reliability of SWEAT while making it easier to complete, making SWEAT-R more useful for community-based research to understand the influence of the built environment on physical activity of older adults.
Supplementary Material
Acknowledgments
This work was supported in part by funding from the Oregon Roybal Center for Translation Research on Aging (P30 AG024978-03), Oregon Alzheimer Disease Center (AG008017-18), Canadian Institutes of Health Research, and Intel Corp. We thank Beth Goralski and Mark Bosworth at Metro, and Tracy Dodge, Laura Gardner, Mary Sepulveda, Chelsea Zamudio, and Miao Zhao for their contribution to data collection.
Appendix A. Supplementary data
Supplementary data associated with this article can be found, in the online version, at doi:10.1016/j.ypmed.2008.12.008.
Footnotes
Conflict of interest statement
The authors declare that there are no conflicts of interest.
References
- Boarnet MG, Day K, Alfonzo M, Forsyth A, Oakes M. The Irvine–Minnesota Inventory to measure built environments: reliability tests. Am J Prev Med. 2006;30:153–159. doi: 10.1016/j.amepre.2005.09.018. [DOI] [PubMed] [Google Scholar]
- Cunningham GO, Michael YL, Farquhar SA, Lapidus J. Developing a reliable senior walking environmental assessment tool. Am J Prev Med. 2005;29:215–217. doi: 10.1016/j.amepre.2005.05.002. [DOI] [PubMed] [Google Scholar]
- Day K, Boarnet MG, Alfonzo M, Forsyth A. The Irvine–Minnesota Inventory to measure built environments: development. Am J Prev Med. 2006;30:144–152. doi: 10.1016/j.amepre.2005.09.017. [DOI] [PubMed] [Google Scholar]
- Frank LD, Andresen MA, Schmid TL. Obesity relationships with community design, physical activity, and time spent in cars. Am J Prev Med. 2004;27:87–96. doi: 10.1016/j.amepre.2004.04.011. [DOI] [PubMed] [Google Scholar]
- Michael YL, Green MK, Farquhar SA. Neighborhood design and active aging. Health and Place. 2006;12:734–740. doi: 10.1016/j.healthplace.2005.08.002. [DOI] [PMC free article] [PubMed] [Google Scholar]
- Nagel CL, Carlson NE, Bosworth M, Michael YL. The relation between neighborhood built environment and walking activity among older adults. Am J Epidemiol. 2008;168:461–468. doi: 10.1093/aje/kwn158. [DOI] [PMC free article] [PubMed] [Google Scholar]
- Paterson DH, Jones GR, Rice CL. Ageing and physical activity: evidence to develop exercise recommendations for older adults. Can J Public Health. 2007;(Suppl 2):S69–108. [PubMed] [Google Scholar]
- Pikora T, Giles-Corti B, Bull F, Jamrozik K, Donovan R. Developing a framework for assessment of the environmental determinants of walking and cycling. Soc Sci Med. 2002;56:1693–1703. doi: 10.1016/s0277-9536(02)00163-6. [DOI] [PubMed] [Google Scholar]
- Rosner B. Fundamentals of biostatistics. 6. Duxbury Press; Belmont, California: 2006. p. 445.p. 614. [Google Scholar]
Associated Data
This section collects any data citations, data availability statements, or supplementary materials included in this article.