

Abstract
Long-term depression (LTD) between cortical layer 4 spiny stellate cells and layer 2/3 pyramidal cells requires the activation of NMDA receptors (NMDARs). In young rodents, this form of LTD has been repeatedly reported to require presynaptic NMDARs for its induction. Here we show that at this synapse in the somatosensory cortex of 2 to 3 week old rats and mice, postsynaptic, not presynaptic NMDARs are required for LTD induction. First, we find no evidence for functional NMDARs in L4 neuron axons using 2 photon laser scanning microscopy and 2 photon glutamate uncaging. Second, we find that genetic deletion of postsynaptic, but not presynaptic NMDARs prevents LTD induction. Finally, the pharmacology of the NMDAR requirement is consistent with a non-ionic signaling mechanism.
INTRODUCTION
There is mounting evidence that NMDA receptors (NMDARs) can be expressed presynaptically, as well as postsynaptically1. Presynaptic NMDAR activation is thought to enhance neurotransmitter release and to be essential for the induction of spike timing dependent forms of long term depression (t-LTD) in a number of brain regions1. Consistent with presynaptic expression of NMDARs, bath application of NMDAR agonists and antagonists increase and decrease, respectively, the frequency of miniature post synaptic currents in several neuronal cell types2,3. However, the activation of postsynaptic NMDARs can result in neuronal depolarizations that spread passively out the axon, opening voltage gated calcium channels (VGCC; refs. 4, 5), and resulting in increased vesicular release5-7. In several neuronal cell types where presynaptic NMDAR activity has been reported, including cerebellar stellate cells, cerebellar basket cells, hippocampal CA3 pyramidal cells and cortical layer 5 cells, attempts to image NMDAR activation in axons using calcium sensitive fluorescent dyes and local NMDAR agonist application have been met with mixed results: some papers report calcium excursions8-10 while others do not5-7,11.
Presynaptic NMDARs have also been implicated in certain forms of plasticity, with strong, though indirect, evidence for their involvement in the induction of t-LTD, which entails the repeated pairing of a postsynaptic action potential (AP) followed within a few tens of milliseconds by a presynaptic AP. In particular, t-LTD has been extensively studied at the cortical synapse between layer 4 spiny stellate cells and layer 2/3 pyramidal cells3,12-14. This form of long term plasticity disappears in rodents older than about three weeks and is thought to be involved in the formation of receptive fields in visual, auditory and somatosensory cortex1. Recently, t-LTD has been extended or restored in visual cortex of older animals by dark rearing or placing animals in the dark for several days. This reestablishment of t-LTD was prevented by genetically down-regulating NMDARs in the presynaptic neurons15.
At the L4-L2/3 synapse, bath application of the NMDAR antagonist D-AP5 blocks induction of t-LTD12,13,16, but blocking only postsynaptic NMDAR current with intracellular MK-80112, does not12,13,17,18. This implies that the relevant NMDARs are located in the presynaptic membrane. Indeed, inclusion of MK-801 in presynaptic L4 neurons is reported to block the induction of t-LTD17,18. We attempted to image NMDAR-mediated calcium signals in the presynaptic L4 axons elicited by focal, 2-photon uncaging of MNI-glutamate onto presynaptic varicosities in L2/3 of rodent somatosensory cortex but found no evidence for functional presynaptic NMDARs. By genetically deleting NMDARs in either the pre- or postsynaptic neurons, we find that the relevant NMDARs for inducing t-LTD at this synapse are postsynaptic, not presynaptic. Our pharmacological experiments indicate that only glutamate binding, and not glycine/D-serine binding or ionic flux, is required for t-LTD induction, similar to recent reports for LTD at hippocampal synapses between Schaffer collaterals and CA1 pyramidal cells19,20.
RESULTS
No evidence for presynaptic NMDARs in L4 axons
To study the signaling mechanism of presynaptic NMDARs in L4 spiny stellate cell axons for t-LTD induction, we attempted to measure presynaptic NMDAR activity using 2-photon laser uncaging (2PLU) of MNI-glutamate and calcium measurements with 2-photon laser scanning microscopy (2PLSM). Layer 4 neurons in acute slices containing barrel cortex from juvenile rats (P14-P21) were patch clamped and filled with the calcium sensitive fluorescent indicator Fluo5F (200 μM) and the calcium insensitive fluorescent dye Alexa 594 (10 μM) and simultaneously imaged with 840 nm laser light. In the absence of extracellular Mg2+, 2PLU of MNI-glutamate (2.5 mM) with 0.5 ms pulses of 720 nm light next to dendritic spines led to large increases in calcium through NMDARs (Fig. 1ab). The uncaging laser power was adjusted by the depth in the slice to levels that were previously determined to cause ~30% photobleaching of the Alexa 594 signal21. Calcium signals were quantified by the change in green fluorescence relative to the red fluorescence (ΔG/R, Fig. 1b). In every spine tested, large increases in calcium signals were seen in response to glutamate uncaging (Fig. 1bc). Interleaved trials without the uncaging laser pulse showed no change in the ΔG/R signal (Fig. 1bc). In the same neurons, the axon was traced towards the pial surface of the slice and varicosities, presumed boutons, were chosen to test for presynaptic NMDARs by uncaging glutamate. The radial distance of the varicosities chosen ranged from 36-383 μm from the soma (mean distance: 163.9 μm, SD: 89.6 μm, N=44 varicosities). Two uncaging pulses, one on each side of an axonal varicosity, each 2 ms long were used to release glutamate (Fig. 1d). No change in ΔG/R signal was observed in any of the axonal varicosities when uncaging, and there was no difference in the ΔG/R signal in interleaved trials without uncaging laser pulses (Fig. 1ef; p=0.57).
Figure 1.
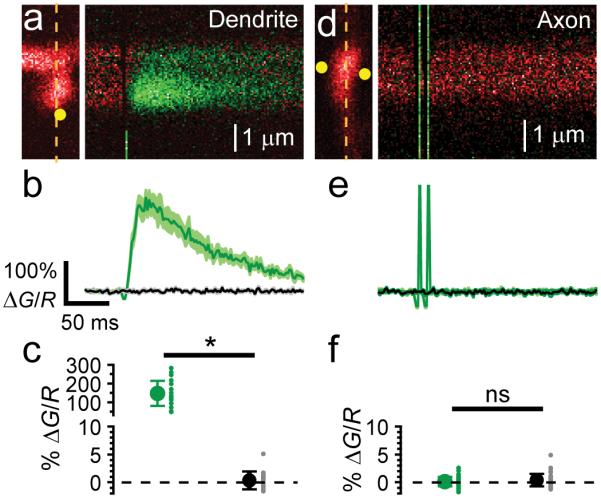
2PLU of MNI-glutamate and calcium influx in L4 neuronal axonal varicosities and dendritic spines. (a) left, 2PSLM image of a dendritic spine and shaft from a L4 neuron showing linescan position (dashed line) and uncaging spot (yellow circle). Right, fluorescence transients of the spine and dendrite evoked with a 0.5 ms uncaging pulse of MNI-glutamate. (b) average fluorescence transient (ΔG/R) from the spine in (a) (green trace, mean ± SEM) interleaved with blank trials (no uncaging laser pulse, black trace). (c) summary of calcium signals in dendritic spines with and without 2PLU (n=19 spines from 7 cells from 7 slices from 3 animals, mean ± SEM uncaging: 148 ± 15, blank: 0.37 ± 0.36, Wilcoxon sign-rank test z-score=3.803, p=3.8E-6). (d) left, 2PLSM image of axonal varicosity showing the linescan position (dashed line) and two uncaging spots (yellow circles). Right, fluorescence transients in axon varicosity evoked with two 2 ms uncaging pulses. (e) average fluorescence transients of interleaved traces with and without 2PLU. (f) summary of calcium signals in axonal varicosities with and without 2PLU (n=44 varicosities from 6 cells from 6 slices from 3 animals, mean ± SEM uncaging: 0.16 ± 0.13, blank: 0.38 ± 0.17, Wilcoxon sign-rank test z-score=0.566, p=0.57).
Sensitivity to detect single calcium channels
If there is just one NMDAR in the presynaptic structure, calcium influx may be difficult to detect and our failure to observe a calcium signal in response to glutamate uncaging onto axonal varicosities could result from an insufficient sensitivity of our microscope. Calcium signals arising from single NMDARs have been observed in dendritic spines22, however dendritic spines may be structurally unique in their ability to prevent calcium diffusion, enhancing detection of small calcium transients with fluorescent dyes23. Because we did not observe NMDAR calcium signals in the L4 axonal varicosities, we tested the sensitivity of our microscope to detect calcium transients in axonal varicosities by adapting the technique used by Sabatini and Svoboda24 to count VGCCs activated by APs.
Assuming that an axonal varicosity contains N VGCCs that open independently with a probability popen, the number of channels that are opened by an AP follows the binomial distribution. Measurement of the rate of failures for VGCCs to open, P(0)=(1-popen)N, and measurement of the coefficient of variation due to VGCC activity CV2=(1-popen)/Npopen can be used to estimate the two parameters N and popen24. We measured calcium transients in response to APs in neighboring axonal varicosities of L4 neurons (Fig. 2a). In control conditions, there were no failures in axonal varicosities (Fig. 2b). Adding 1 μM ω-conotoxin MVIIC to the bath to block the majority of N/P/Q-type calcium channels25 decreased the size of the calcium signals and led to instances of failure of channels to open (Fig. 2bc). Imaging two varicosities simultaneously ensured that a trial identified as a failure in one varicosity did not result from AP failure because the calcium signal in the second varicosity did not fail (Fig. 2d). Trials were counted as failures if the calcium signal measured just after the action potential was less than 2 standard deviations from the baseline calcium signal measured just before the action potential. As described previously24, failures are accompanied by a slow rise in ΔG/R signal, which results from diffusion of calcium bound dye from neighboring structures. The coefficient of variation of channel opening was estimated from the fluorescence traces by measuring the mean fluorescent signal and the trial-to-trial variance (Fig. 2ef). The variance due to VGCC activity was isolated by subtracting the dark noise and photon shot noise from the total variance (Fig. 2ef). In the example shown in figure 2, the estimated number of VGCCs contributing to the AP-evoked calcium signal in the presence of ω-conotoxin MVIIC in varicosity 1 was 2.55 channels, and in varicosity 2 was 0.79 channels, and the probabilities of channel opening during an action potential were 0.76 and 0.79, respectively. Figure 2g shows estimates of N (1.8 ± 1.2, mean ± SD) and p (0.83 ± 0.11, mean ± SD) from 15 varicosities. Because the estimation of the number of failures using a criteria of 2 SD above the baseline noise is arbitrary, we also estimated the number of failures using either 1 or 3 SD above the baseline noise as a cutoff for inclusion as a failure. This led to estimates of 3.0 ± 2.25 channels with a popen of 0.72 ± 0.21 (for 1 SD cutoff, N=11) and 1.3 ± 0.96 channels with a popen of 0.87 ± 0.10 (for 3 SD cutoff, N=18).
Figure 2.

Counting voltage gated calcium channels in axonal varicosities. (a) fluorescence transients evoked by an action potential in two neighboring axonal varicosities from an L4 neuron (left). (b) ΔG/R measurements from each varicosity just after the action potential (filled symbols) and the baseline signal (open symbols) before and during application of 1 µM ω-conotoxin MVIIC. (c) average (± SEM) AP-evoked ΔG/R signal in each varicosity before and after ω-conotoxin MVIIC application. (d) in ω-conotoxin MVIIC, trials representing failures of calcium channel opening (blue traces) in varicosity 2 were not failures of AP propagation as they did not fail in varicosity 1 (blue traces). (e) measuring the variance (red) of the fluorescent calcium signal and comparing it to the variance (blue trace) predicted from the dark noise and shot noise calculated from the mean fluorescent signal in varicosity 2 (black, bottom). (f) variance vs mean fluorescence plot. Dashed line is the background, dark noise, blue symbols are shot noise measurements at different mean fluorescent intensities, and the variance-mean relationship of each varicosity measured over 6 ms just before and just after the action potential (mean ± SD, varicosity 1, black, and varicosity 2, red). The variance due to calcium channels is the difference between the measured and predicted variance. (g) estimated number of channels (left) and probability of channel opening (right) in 15 boutons using this technique (mean ± SD).
Axonal boutons in cortical neurons are thought to contain N, P/Q, and R-type high-voltage activated calcium channels4,26, which have a calcium conductance between 5-10 pS26, and, during an AP, the channels are expected to be open for <1 ms27. NMDARs have a comparable calcium conductance (~10% of 50 pS; refs. 28, 29), but are expected to be open for >10 ms30. Because we have the sensitivity to detect calcium arising from a single VGCC in an axonal varicosity, we should be able to detect calcium from single NMDARs.
t-LTD at L4-L2/3 synapses
Although we did not find evidence for NMDAR calcium influx in the axons of L4 neurons in response to 2PLU, we repeated the t-LTD experiments that have suggested the existence of presynaptic NMDARs. Figure 3a shows an example time course of EPSPs recorded in ACSF from a L2/3 neuron while stimulating in L4 at 0.1 Hz. After a baseline period, L4 stimulation was paired with a postsynaptic AP (25 ms before L4 stimulation; a protocol shown to induce t-LTD16). This pairing was repeated 100 times at 0.2 Hz, and the EPSP was monitored for ~60 minutes after pairing. In ACSF, this protocol led to t-LTD (EPSP slope reduced to 47 ± 9 % after pairing, mean ± SEM, n=15, p=1.8E-4). As others have reported12,13, blocking NMDARs with 50 μM D-AP5 prevented t-LTD (EPSP slope 101 ± 6 % after pairing, n=10, p=0.56) but including 1 mM MK-801 in the internal pipette solution did not block t-LTD (EPSP slope 62 ± 7 % after pairing, n=20, p=1.3E-4, Fig. 3bc).
Figure 3.

t-LTD of L4-L2/3 synapses. (a) EPSP slope measurements from a L2/3 neuron while stimulating L4 at 0.1 Hz. After 100 pairings of APs preceding stimulation by 25 ms at 0.2 Hz, EPSP slope was depressed. Average traces before and after t-LTD paring are shown on right. (b) average (± SEM) time course of EPSP slope during t-LTD experiments normalized to baseline values in ACSF (black symbols, 47 ± 9 %, n=15 cells from 14 slices from 12 animals, Wilcoxon sign-rank test z-score=3.266, p=1.8E-4), with 1 mM intracellular MK-801 (blue symbols, 62 ± 7 %, n=20 cells from 12 slices from 4 animals, Wilcoxon sign-rank test z-score=3.453, p=1.3E-4), and with bath application of 50 µM D-AP5 (red symbols, 101 ± 6%, n=10 cells from 8 slices from 4 animals, Wilcoxon sign-rank test z-score=0.6116, p=0.56). (c) Summary of EPSP slope measurements in t-LTD experiments (mean ± SEM).
NMDAR pharmacology of t-LTD at L4-L2/3 synapses
Evidence has recently emerged that the function of NMDARs in generating hippocampal LTD depends on glutamate binding the receptor but is independent of both glycine/D-serine binding and ion flux through the receptor’s channel19,20. t-LTD at the L4-L2/3 synapse is consistent with this mechanism, as D-AP5, a competitive antagonist at the glutamate binding site, prevented t-LTD, but the open channel blocker MK-801 did not. Figure 4 shows summary experiments for t-LTD induction in the presence of several other NMDAR antagonists. R-CPP (10 μM, Fig. 4a), a competitive antagonist at the glutamate binding site, blocked both NMDAR current recorded in voltage clamp experiments and t-LTD (EPSP slope 99 ± 6 % after pairing, n=7, p=0.69). Bath application of MK-801 (100 μM, Fig. 4b) blocked NMDAR currents, but did not block t-LTD (EPSP slope 58 ± 9% after pairing, n=12, p=9.8E-4). The NMDAR glycine site competitive antagonists 7-CK (100 μM, Fig. 4c) and 5,7-DCKA (50 μM, Fig. 4d) both blocked NMDAR currents, but did not block t-LTD (EPSP slope in 7-CK 76 ± 3 %, n=11, p=9.8E-4; EPSP slope in DCKA 77 ± 9 %, n=7, p=3.1E-2). This pharmacological profile of t-LTD is consistent with activation of NMDARs that is dependent on glutamate binding but not ion flux.
Figure 4.

Pharmacology of t-LTD. (a-d) left, initial EPSP slope measurements before and after t-LTD induction protocol, middle, time course of block of the NMDA EPSC recorded at +40 mV by the addition of the NMDAR antagonist followed by the addition of D-AP5, inset are example traces in control (black), drug (color) and D-AP5 (red), right, summary of NMDAR EPSC amplitudes in the antagonist and with the addition of D-AP5. (a) effects of R-CCP (10 μM; t-LTD: 100 ± 6 %, n=7 cells from 5 slices from 3 animals, Wilcoxon sign-rank test z-score=0.423, p=0.69; NMDAR EPSCs: n=10 pathways from 5 cells from 5 slices from 1 animal, Wilcoxon sign-rank test z-score=2.752, p=2E-3; inset scale bars 50 ms and 200 pA). (b) extracellular MK-801 (100 μM; t-LTD: 58 ± 9 %, n=12 cells from 9 slices from 5 animals, Wilcoxon sign-rank test z-score=2.942, p=9.8E-4; NMDAR EPSCs: n=8 pathways from 5 cells from 5 slices from 1 animal, Wilcoxon sign-rank test z-score=2.451, p=7.8E-3; inset scale bars 50 ms and 100 pA). (c) 7-chlorokynurenate (100 μM; t-LTD: 76 ± 3 %, n=11 cells from 6 slices from 3 animals, Wilcoxon sign-rank test z-score=2.889, p=9.8E-4; NMDAR EPSCs: n=7 pathways from 4 cells from 4 slices from 1 animal, Wilcoxon sign-rank test z-score=2.282, p=1.6E-2; inset scale bars 50 ms and 100 pA). (d) 5,7-dichlorokynurenate (50 μM; t-LTD: 77 ± 9 %, n=7 cells from five slices from 1 animal, Wilcoxon sign-rank test z-score=2.113, p=3.1E-2; NMDAR EPSCs: n=7 pathways from 4 cells from 4 slices from 1 animal, Wilcoxon sign-rank test z-score=2.282, p=1.6E-2; inset scale bars 50 ms and 25 pA).
Genetic deletion of postsynaptic NMDARs
Because blocking NMDAR ion flux globally using extracellular MK-801 or glycine-site antagonists did not block t-LTD induction, the same result obtained with intracellular MK-801 in the postsynaptic cell cannot be used to exclude either pre- or postsynaptic NMDARs as the relevant receptors. To determine if postsynaptic NMDARs receptors are involved in t-LTD, we deleted NMDARs in a sparse subset of L2/3 neurons by injecting an AAV virus that expresses Cre and EGFP into the ventricles of homozygous, E15-16 Grin1fx/fx mouse embryos31. Cre expression in the cells of these mice deletes the NMDAR GluN1 subunit that is required for functional channels to traffic to the membrane32,33.
Figure 5a shows an example 2PLSM image of sparse infection of L2/3 neurons (green) in barrel cortex from a Grin1fx/fx mouse by AAV–Cre-EGFP injection at E16 with two neighboring neurons, one GFP+ and one GFP−, filled with Alexa 594 from the patch pipettes (red). The cells were voltage-clamped and L4 was stimulated to evoke synaptic currents. While holding at −75 mV, both GFP+ and GFP− cells showed large, rapid, NBQX-sensitive inward currents (Fig. 5b). D-AP5-sensitive NMDAR currents were measured at a holding potential of +40 mV, and were only present in GFP− neurons (Fig. 5bc). We next tested whether t-LTD could be induced in GFP+ and GFP− cells (Fig. 5de). t-LTD could be induced in GFP− neurons (EPSP slope 53 ± 7 % after t-LTD pairing, n=19, p=1.9E-5) while t-LTD was absent in GFP+ neurons (EPSP slope 109 ± 14 % after pairing, n=20, p=0.55). These results indicate that activation of postsynaptic NMDARs are required for t-LTD. Combined with our pharmacological results (Fig. 3 and 4), we suggest that t-LTD requires postsynaptic NMDAR signaling but not ion flux through the NMDAR channel.
Figure 5.

Postsynaptic NMDARs are required for t-LTD. (a) 2PLSM image of Grin1fx/fx mouse cortex that was infected with AAV1-Cre-EGFP virus in utero showing neighboring L2/3 neurons filled with Alexa594, one of which is GFP+. (b) voltage clamp recordings of NBQX-sensitive currents recorded at −75 mV (downward currents) and D-AP5-sensitive currents recorded at +40 mV (upward currents) from neighboring GFP−(gray traces) and GFP+ neurons (green traces). (c) summary of D-AP5-sensitive NMDA currents in GFP− neurons (n=7 cells from 7 slices from 2 animals, 199 ± 76 pA, mean ± SEM) and GFP+ neurons (n=8 cells from 6 slices from 2 animals, 7.9 ± 5.5 pA, mean ± SEM, Mann-Whitney U test U=55, n1=7,n2=8, p=6.2E-4). (d) average (± SEM) time course of t-LTD in GFP+ neurons (green, n=20 cells from 18 slices from 11 animals) and GFP− neurons (gray, n=19 cells from 17 slices from 9 animals) from Grin1fx/fx mice. (e) summary (mean ± SEM) of EPSP slope measurements during t-LTD experiments in GFP− neurons (left, gray traces, 53 ± 7 %, n=19, Wilcoxon sign-rank test z-score=3.682, p=1.9E-5) and GFP+ neurons (right, green traces, 109 ± 14 %, n=20, Wilcoxon sign-rank test z-score=0.616, p=0.55).
Genetic deletion of presynaptic NMDARs
Although our inability to observe NMDAR-mediated calcium transients in axon varicosities suggests the absence of presynaptic NMDARs, we nonetheless tested whether t-LTD could be induced when NMDARs were deleted in the presynaptic L4 neurons. To preferentially target the viral infection to L4 neurons, we injected AAV-Cre-EGFP in Grin1fx/fx mice at E14. While this led to sparse labeling of L4 neurons, it was difficult to find connected pairs of GFP+ L4 and GFP− L2/3 neurons. To circumvent this difficulty, we crossed the Grin1fx/fx mice with Ai32 mice that have channelrhodopsin2(H134R) (ChR2) preceded by a loxP-flanked STOP cassette34. In these double homozygous mice, ChR2 expression should be restricted to those neurons in which NMDARs are deleted.
Figure 6a shows an example 2PLSM image of a L2/3 neuron filled with Alex 594 and GFP+ L4 neurons in an Ai32/Grin1fx/fx mouse that was infected with AAV1-Cre-EGFP at E14. NMDA receptor currents were recorded in GFP− neurons, but absent in 8 out of 9 neighboring GFP+ neurons (Fig. 6b). EPSPs recorded in L2/3 neurons could be evoked by brief (1-5 ms) flashes of 473 nm laser light that was focused over L4, and t-LTD was tested by pairing postsynaptic action potentials with laser flashes. t-LTD was present in Ai32 mice (Fig. 6c, EPSP slope 85 ± 12 %, n=12, p=1.2E-2), and could be evoked in the presence of DCKA (Fig. 6c, EPSP slope 68 ± 13 %, n=8, p=2.3E-2). t-LTD was intact in double homozygous Ai32/Grin1fx/fx mice (Fig. 6d, AxG, EPSP slope 54 ±6 %, n=9, p=3.9E-3), and with 1 mM MK-801 in the postsynaptic pipette (Fig. 6d, EPSP slope 56 ± 8 %, n=7, p=1.6E-2). These results suggest that presynaptic NMDARs are not required for the expression of t-LTD at the L4-L2/3 synapse. Taken together, our results indicate that postsynaptic NMDARs, acting through a non-ionic mechanism, are required for the induction of t-LTD.
Figure 6.

Presynaptic NMDARs are not required for t-LTD. (a) 2PLSM image of double homozygous Ai32/Grin1fx/fx (AxG) mouse cortex injected in utero AAV1-Cre-EGFP virus at E14. (b) top, voltage clamp recordings of NBQX-sensitive currents recorded at −75 mV (downward currents) and D-AP5-sensitive currents recorded at +40 mV (upward currents) from neighboring GFP− and GFP+ neurons, bottom, summary of AP5-sensitive NMDAR current in GFP− (n=9 cells 9 slices from 5 animals, 176 ± 62 pA, mean ± SEM) and GFP+ neurons (n=9 cells from 9 slices from 5 animals, 23 ± 19 pA, mean ± SEM, Mann-Whitney U-test U=79, n1=9, n2=9, p=1.6E-4). (c) t-LTD in Ai32 mice (85 ± 12 %, n=12 cells from 9 slices from 6 animals, Wilcoxon sign-rank test z-score=2.393, p=1.2E-2), Ai32 mice in the presence of 50 µM DCKA (69 ± 13 %, n=8 cells from 8 slices from 5 animals, Wilcoxon sign-rank test z-score=2.170, p=2.3E-2). (d) t-LTD in AxG mice (54 ± 6%, n=9 cells from 6 slices from 3 animals, Wilcoxon sign-rank test z-score=2.606, p=3.9E-3) and in AxG mice with intracellular MK-801 (56 ± 8 %, n=7 cells from 7 slices from 5 animals, Wilcoxon sign-rank test z-score=2.282, p=1.6E-2).
DISCUSSION
NMDARs are required for many forms of plasticity in the brain. In addition to their function in the postsynaptic membrane, NMDARs have been suggested to function in presynaptic, axonal membranes in cortex10,12-18, cerebellum2,35, hippocampus8, striatum36. We attempted to detect functional NMDARs in L4 neuronal axons by measuring calcium transients in response to 2PLU. In contrast to robust calcium signals evoked in dendritic spines, no responses were seen in axon varicosities. Revisiting the pharmacology of t-LTD at this synapse that led to the suggestion of presynaptic NMDARs, we found that glutamate binding to NMDARs was required, but ion flux through the channels was not, similar to recent findings in hippocampal LTD19,20. Because non-ionic signaling through NMDARs was not blocked by MK-801, the insensitivity of t-LTD induction to postsynaptic intracellular MK-801 does not implicate a presynaptic location of the relevant receptors. We found that genetic deletion of NMDARs in postsynaptic L2/3 neurons prevented t-LTD. Conversely, deletion of NMDARs in the presynaptic L4 neurons in conjunction with expression of ChR2 to stimulate only presynaptic, NMDAR-lacking neurons did not prevent t-LTD.
Explanation of lack of calcium imaging results
We tested the sensitivity of our microscope and could detect calcium excursions from single VGCCs activated by APs in the presynaptic neuron. Because the calcium conductance of VGCCs26 is similar to the calcium conductance of NMDARs28,29, and the open time of NMDARs is >10 times that of AP gated VGCCs, we should be able to detect calcium influx through NMDARs if they were in the axonal structures. It has been suggested that in layer 5 neurons of visual cortex, the expression of presynaptic NMDARs is specific to the target cell type10. Because we did not identify the postsynaptic cell in our axonal uncaging experiments, it is possible that we could have missed the boutons in L2/3 region that express NMDARs in our 44 recordings. However, t-LTD that has been attributed to presynaptic NMDARs in this region seems to be fairly ubiquitous. Another possibility for our lack of detection of calcium signals could be that the presynaptic NMDARs contain NR3A subunits37 that have a lower calcium permeability and less voltage-dependent Mg2+ block38 than more standard NMDARs. Kunz et al.39 suggested that these receptors could function by depolarizing the terminals which would lead to activation of VGCCs. If this were the case, we would still expect to see calcium excursions because we are able to detect calcium signals from single VGCCs. However, our pharmacological and genetic manipulations suggest that it is the postsynaptic NMDARs acting through a non-ionic signaling mechanism that is required for t-LTD, which is consistent with the lack of axonal calcium signals in response to glutamate uncaging.
Inconsistencies with the literature
Axonal NMDARs have been identified in a number of cultured neuronal preparations by both calcium indicators and electrical recording8,40,41. However, in acute slice preparations, the search for and lack of direct evidence of NMDAR activity in axons6,7,11,42 has led to alternative explanations for the perceived presynaptic NMDAR effects. In cerebellar stellate and basket cells, the lack of NMDAR calcium signals in response to NMDAR agonists applied either iontophoretically or by 2PLU led to the proposal that somato-dendritic NMDARs could be causing axonal release through the electrotonic spread of depolarization4-7. In cortical layer 5 neurons, NMDAR agonists did not affect axonal excitability, did not cause calcium increases, and the antagonist did not affect AP calcium signaling11 (but see ref. 10).
Non-ionic signaling through NMDARs has been described in several preparations19,20,43-46. Recent work in hippocampus has indicated that non-ionic signaling through NMDARs is essential in the induction of LTD19,20, and the downstream signaling mechanism has been proposed to be either through P38/MAPK activity or to be a direct interaction with the C-terminal domains of NMDAR subunits and PP1 and CAMKII46. Future studies will be required to dissect the nature of the NMDAR signal at the L4-L2/3 synapse. t-LTD requires a postsynaptic AP which back-propagates through the dendritic arbor of the L2/3 neuron, providing a source for calcium which, when blocked by VGCC antagonists or chelated by BAPTA, prevents t-LTD induction12,13. Additionally, mGluR activation of PLC leads to IP3 production which induces release of calcium from internal stores that also seems to be required for t-LTD12. The NMDAR signal could be required in concert with these other signals to generate endocannabinoids, although some experiments suggest that NMDAR signaling is downstream of endocannabinoid release12. Consistent with this view, Min and Nevian47 suggest that endocannabinoid release activates astrocytes to release glutamate, which they interpreted to be the source of glutamate for signaling to presynaptic NMDARs. However, postsynaptic NMDARs could be responding to this astrocytic release of glutamate if that is the important signal for t-LTD.
Rodriguez-Moreno et al.17 have reported that that t-LTD at the L4-L2/3 synapse was disrupted when 1 mM intracellular MK-801 was introduced selectively to the presynaptic neuron and suggest that ion flux through presynaptic NMDARs is required for t-LTD induction. These results are at odds with both our calcium measurements and our genetic deletion of presynaptic NMDARs. Although it is possible that millimolar concentrations of MK-801 block t-LTD via off-target effects48, we have no evidence to support this and, as such, we have no explanation for the contradictory results.
t-LTD at the L4-L2/3 synapse is developmentally regulated1,3. In the visual cortex, for example, t-LTD in animals older than about 3 weeks becomes sensitive to postsynaptic MK8013. In addition, when animals are dark reared or, as adults, returned to darkness for a period of days, t-LTD induction in the visual cortex reverts to a mechanism that is eliminated by genetic knockdown of L4 neuronal NMDARs15. The explanation for the differences between our results and those in the visual cortex15 is unclear but may depend on the use of different cortical regions or developmental stages. In the somatosensory cortex of P14-21 animals, we find no evidence for functional NMDAR expression in the axons of L4 neurons and we find that knocking out NMDARs in postsynaptic but not presynaptic neurons prevents t-LTD induction.
METHODS
Animals
Unweaned juvenile (postnatal day 14-21) Sprague Dawley rats of either sex were used in most experiments. Animals were anesthetized with isoflurane and decapitated, and the brain was rapidly removed into ice cold ACSF consisting of (in mM): 119 NaCl, 2.5 KCl, 1 NaH2PO4, 25 NaHCO3, 1 MgCl2, 2 CaCl2, 10 Glucose, 3 Na-Pyruvate, 1.3 Na-Ascorbate, equilibrated with 95% O2 and 5% CO2 (chemicals from Sigma). The brain was blocked ~35° from the coronal plane to leave the barrel columns intact49, and 300 μm thick slices were prepared with a Leica 1200 Vibratome. Slices were incubated in 37°C ACSF for 30 minutes and then kept at room temperature (22-25°C) until use. All experiments were performed at 32-35°C. Animal handling and procedures followed OHSU IACUC approved protocols.
In utero viral injection
For sparse genetic manipulation of NMDARs and ChR2, Cre-EGFP was delivered intraventricularly in utero to Grin1fx/fx mice (Jackson labs #005246 B6.129S4-Grin1tm2Stl/J37), Ai32 mice (Jackson labs #012569 B6;129S-Gt(ROSA)26Sortm32(CAG-COP4*H134R/EYFP)Hze/J33), and double homozygous Grin1fx/fx /Ai32 mice. In utero viral injections were performed in accordance with OHSU IACUC approved protocols. Timed-pregnant mice were anesthetized with isoflurane and approximately 1 μL AAV solution (containing ~1012 particles/μL AAV1-Cre-EGFP (UNC Viral Core31), and fast green) was injected into the ventricles of the embryos using a picospritzer. AAV was injected at either embryonic day 15-16 for preferential expression in L2/3 neurons, or embryonic day 14 for preferential expression in L4 neurons.
Electrophysiology
t-LTD experiments were performed using whole-cell current clamp recordings in L2/3 neurons while stimulating with a glass electrode in a visually identified L4 barrel. Internal pipette solutions consisted of: (in mM) 128 K-Gluconate, 10 NaCl, 10 HEPES, 4 MgCl2, 14 Na-phosphocreatine, 4 ATP, 0.4 GTP, 0.5 EGTA, pH adjusted to 7.3 with KOH. Synaptic strength was monitored by stimulating at 0.1 Hz, and EPSP slope was measured. t-LTD was induced by 100 pairings at 0.2 Hz of an action potential in the postsynaptic L2/3 neuron generated by brief current injections (1-3 nA, 0.5-3 ms) and L4 stimulation, 25 ms after the postsynaptic action potential. Recordings in which the membrane voltage changed or membrane resistance changed by more than 20% were discarded.
ChR2-expressing L4 neurons from Ai32 and Grin1fx/fx/Ai32 mice were stimulated with brief (1-5 ms) flashes of 473 nm laser focused through the objective over GFP+ L4 neurons while recording from L2/3 neurons. t-LTD was induced with the same protocol as in experiments using electrical stimulation.
Voltage-clamp recordings to assay NMDAR current and pharmacology were performed using a Cs-based internal pipette solution with Cs-Gluconate and CsOH replacing K-Gluconate and KOH respectively. AMPAR currents were recorded at −75 mV and isolated by subtraction with traces recorded in 5 μM NBQX and 50 µM picrotoxin. NMDAR currents were measured at +40 mV in picrotoxin and NBQX and isolated by subtraction of traces in 50 µM D-AP5, 10 µM R-CPP, 100 µM MK-801, 100 µM 7-CK, or 50 µM 5,7-DCKA (drugs from Tocris). Reported membrane potentials have not been corrected for the pipette junction potential.
Two-photon laser scanning microscopy
Imaging was performed on a custom two-photon laser scanning microscope using an Olympus BX-51 microscope and an Olympus 60X 1.0 NA water-immersion objective. Two Ti:sapphire lasers (Coherent Chameleon) were used for imaging (840 nm) and uncaging MNI-glutamate (720 nm). Line scans were collected at 500 Hz and monitored in both epi- and transfluorescence pathways using photomultipiers (H8224PA-40 or H10770PA-40, Hamamatsu) placed after 565 nm dichroic mirror and 525/50 and 620/60 bandpass filters (Chroma and Semrock). ScanImage software was used for microscope control and data acquisition50. Physiology data was collected at 10 kHz and filtered at 4 kHz using a Multiclamp 700B amplifier (Molecular Devices). Pipettes were wrapped with parafilm to reduce capacitance and had open tip resistances ranging from 2.5-5 MΩ.
Calcium imaging
Cells were filled with the red fluorescent dye Alexa 594 (10 μM) and the green fluorescent, calcium sensitive dye Fluo-5F (200 μM) through the patch electrode for >15 minutes before imaging. Fluorescent dyes were purchased from Life technologies. In glutamate uncaging experiments (Fig. 1), fluorescence was measured as the average ΔG/R fluorescent signal over 20 ms at the peak of the calcium signal in control traces and the same time window was used to analyze interleaved traces without uncaging glutamate. For calcium channel counting experiments (Fig. 2), we adapted the method used by Sabatini and Svoboda24 to count calcium channels in dendritic spines. For action potential calcium signals (Fig. 2), baseline ΔG/R signal was measured as the average of 6 ms before the action potential, and the peak ΔG/R signal was measured as the average of 6 ms after the action potential. Failures of calcium channels to open were counted if the peak signal was within 2 (or 1 or 3) standard deviations from the baseline signal. The mean and variance of the green fluorescent signal was calculated for each time point, and the predicted variance, σ2predicted, was estimated as the sum of the background (shutter closed) variance and photon shot noise (measured using a dye filled pipette). The variance due to calcium channel activity was then calculated σ 2CaV= σ 2total− σ 2predicted, and the coefficient of variation of the calcium signal due to calcium channel activity can be calculated CV2CaV= σ 2CaV /mean2. The two measurements, failure rate for channels opening and CV2CaV, can then be used to solve for the two parameters N and Popen.
Statistical analysis
Unless otherwise noted, values reported are Mean ± SEM. For paired data, one-way comparisons were made using the nonparametric Wilcoxon sign-rank test. For unpaired data, one-way comparisons were made using the nonparametric Mann-Whitney U test. Data collection and analysis were not performed blind to the conditions of the experiments. Randomization was not used. No statistical methods were used to pre-determine sample sizes but our sample sizes are similar to those generally employed in the field.
Supplementary Material
ACKNOWLEDGMENTS
We thank D. Chiu and W. Sun for their helpful discussions and comments on the manuscript. This work was supported by US National Institutes of Health grant NS066037 (C.E.J.).
Footnotes
AUTHOR CONTRIBUTIONS
B.C.C. and C.E.J. designed the experiments and wrote the manuscript.
B.C.C. conducted and analyzed the experiments.
COMPETING FINANCIAL INTERESTS
The authors declare no competing financial interests.
Data availability. All relevant data are available from the authors.
A Supplementary Methods Checklist is available.
References
- 1.Bouvier G, Bidoret C, Casado M, Paoletti P. Presynaptic NMDA receptors: roles and rules. Neuroscience. 2015;311:322–340. doi: 10.1016/j.neuroscience.2015.10.033. [DOI] [PubMed] [Google Scholar]
- 2.Glitsch M, Marty A. Presynaptic effects of NMDA in cerebellar Purkinje cells and interneurons. J. Neurosci. 1999;19:511–519. doi: 10.1523/JNEUROSCI.19-02-00511.1999. [DOI] [PMC free article] [PubMed] [Google Scholar]
- 3.Corlew R, Wang Y, Ghermazien H, Erisir A, Philpot BD. Developmental switch in the contribution of presynaptic and postsynaptic NMDA receptors to long-term depression. J. Neurosci. 2007;27:9835–9845. doi: 10.1523/JNEUROSCI.5494-06.2007. [DOI] [PMC free article] [PubMed] [Google Scholar]
- 4.Yu Y, Maureira C, Liu X, McCormick D. P/Q and N channels control baseline and spike-triggered calcium levels in neocortical axons and synaptic boutons. J. Neurosci. 2010;30:11858–11869. doi: 10.1523/JNEUROSCI.2651-10.2010. [DOI] [PMC free article] [PubMed] [Google Scholar]
- 5.Christie JM, Chiu DN, Jahr CE. Ca(2+)-dependent enhancement of release by subthreshold somatic depolarization. Nat. Neurosci. 2011;14:62–68. doi: 10.1038/nn.2718. [DOI] [PMC free article] [PubMed] [Google Scholar]
- 6.Christie JM, Jahr CE. Dendritic NMDA receptors activate axonal calcium channels. Neuron. 2008;60:298–307. doi: 10.1016/j.neuron.2008.08.028. [DOI] [PMC free article] [PubMed] [Google Scholar]
- 7.Pugh JR, Jahr CE. NMDA receptor agonists fail to alter release from cerebellar basket cells. J. Neurosci. 2011;31:16550–16555. doi: 10.1523/JNEUROSCI.3910-11.2011. [DOI] [PMC free article] [PubMed] [Google Scholar]
- 8.McGuinness L, et al. Presynaptic NMDARs in the hippocampus facilitate transmitter release at theta frequency. Neuron. 2010;68:1109–1127. doi: 10.1016/j.neuron.2010.11.023. [DOI] [PubMed] [Google Scholar]
- 9.Rossi B, et al. Current and calcium responses to local activation of axonal NMDA receptors in developing cerebellar molecular layer interneurons. PLoS One. 2012;7 doi: 10.1371/journal.pone.0039983. [DOI] [PMC free article] [PubMed] [Google Scholar]
- 10.Buchanan KA, et al. Target-specific expression of presynaptic NMDA receptors in neocortical microcircuits. Neuron. 2012;75:451–466. doi: 10.1016/j.neuron.2012.06.017. [DOI] [PMC free article] [PubMed] [Google Scholar]
- 11.Christie JM, Jahr CE. Selective expression of ligand-gated ion channels in L5 pyramidal cell axons. J. Neurosci. 2009;29:11441–11450. doi: 10.1523/JNEUROSCI.2387-09.2009. [DOI] [PMC free article] [PubMed] [Google Scholar]
- 12.Bender VA, Bender KJ, Brasier DJ, Feldman DE. Two coincidence detectors for spike timing-dependent plasticity in somatosensory cortex. J. Neurosci. 2006;26:4166–4177. doi: 10.1523/JNEUROSCI.0176-06.2006. [DOI] [PMC free article] [PubMed] [Google Scholar]
- 13.Nevian T, Sakmann B. Spine Ca2+ signaling in spike timing-dependent plasticity. J. Neurosci. 2006;26:11001–11013. doi: 10.1523/JNEUROSCI.1749-06.2006. [DOI] [PMC free article] [PubMed] [Google Scholar]
- 14.Banerjee A, et al. Double dissociation of spike timing-dependent potentiation and depression by subunit-preferring NMDA receptor antagonists in mouse barrel cortex. Cereb. Cortex. 2009;19:2959–2969. doi: 10.1093/cercor/bhp067. [DOI] [PMC free article] [PubMed] [Google Scholar]
- 15.Larsen RS, et al. Synapse-specific control of experience-dependent plasticity by presynaptic NMDA receptors. Neuron. 2014;83:879–893. doi: 10.1016/j.neuron.2014.07.039. [DOI] [PMC free article] [PubMed] [Google Scholar]
- 16.Feldman DE. Timing-based LTP and LTD at vertical inputs to layer II/III pyramidal cells in rat barrel cortex. Neuron. 2000;27:45–56. doi: 10.1016/s0896-6273(00)00008-8. [DOI] [PubMed] [Google Scholar]
- 17.Rodriguez-Moreno A, Paulsen O. Spike timing-dependent long-term depression requires presynaptic NMDA receptors. Nat. Neurosci. 2008;11:744–745. doi: 10.1038/nn.2125. [DOI] [PubMed] [Google Scholar]
- 18.Rodriguez-Moreno A, et al. Presynaptic induction and expression of timing-dependent long-term depression demonstrated by compartment-specific photorelease of a use-dependent NMDA receptor antagonist. J. Neurosci. 2011;31:8564–8569. doi: 10.1523/JNEUROSCI.0274-11.2011. [DOI] [PMC free article] [PubMed] [Google Scholar]
- 19.Nabavi S, et al. Metabotropic NMDA receptor function is required for NMDA receptor-dependent long-term depression. Proc. Natl. Acad. Sci. U.S.A. 2013;110:4027–4032. doi: 10.1073/pnas.1219454110. [DOI] [PMC free article] [PubMed] [Google Scholar]
- 20.Stein IS, Gray JA, Zito K. Non-ionotropic NMDA receptor signaling drives activity-induced dendritic spine shrinkage. J. Neurosci. 2015;35:12303–12308. doi: 10.1523/JNEUROSCI.4289-14.2015. [DOI] [PMC free article] [PubMed] [Google Scholar]
- 21.Bloodgood BL, Sabatini BL. Nonlinear regulation of unitary synaptic signals by CaV2.3 voltage-sensitive calcium channels located in dendritic spines. Neuron. 2007;53:249–260. doi: 10.1016/j.neuron.2006.12.017. [DOI] [PubMed] [Google Scholar]
- 22.Nimchinsky EA, Yasuda R, Oertner TG, Svoboda K. The number of glutamate receptors opened by synaptic stimulation in single hippocampal spines. J. Neurosci. 2004;24:2054–2064. doi: 10.1523/JNEUROSCI.5066-03.2004. [DOI] [PMC free article] [PubMed] [Google Scholar]
- 23.Sabatini BL, Oertner TG, Svoboda K. The life cycle of Ca(2+) ions in dendritic spines. Neuron. 2002;33:439–452. doi: 10.1016/s0896-6273(02)00573-1. [DOI] [PubMed] [Google Scholar]
- 24.Sabatini BL, Svoboda K. Analysis of calcium channels in single spines using optical fluctuation analysis. Nature. 2000;408:589–593. doi: 10.1038/35046076. [DOI] [PubMed] [Google Scholar]
- 25.McDonough SI, Swartz KJ, Mintz IM, Boland LM, Bean BP. Inhibition of calcium channels in rat central and peripheral neurons by omega-conotoxin MVIIC. J. Neurosci. 1996;16:2612–2623. doi: 10.1523/JNEUROSCI.16-08-02612.1996. [DOI] [PMC free article] [PubMed] [Google Scholar]
- 26.Sheng J, et al. Calcium-channel number critically influences synaptic strength and plasticity at the active zone. Nat. Neurosci. 2012;15:998–1006. doi: 10.1038/nn.3129. [DOI] [PMC free article] [PubMed] [Google Scholar]
- 27.Borst JG, Sakmann B. Calcium influx and transmitter release in a fast CNS synapse. Nature. 1996;383:431–434. doi: 10.1038/383431a0. [DOI] [PubMed] [Google Scholar]
- 28.Jahr CE, Stevens CF. Calcium permeability of the N-methyl-D-aspartate receptor channel in hippocampal neurons in culture. Proc. Natl. Acad. Sci. U.S.A. 1993;90:11573–11577. doi: 10.1073/pnas.90.24.11573. [DOI] [PMC free article] [PubMed] [Google Scholar]
- 29.Burnashev N, Zhou Z, Neher E, Sakmann B. Fractional calcium current through recombinant GluR channels of the NMDA, AMPA and kainite receptor subtypes. J. Physiol. 1995;485:403–418. doi: 10.1113/jphysiol.1995.sp020738. [DOI] [PMC free article] [PubMed] [Google Scholar]
- 30.Lester RA, Clements JD, Westbrook GL, Jahr CE. Channel kinetics determine the time course of NMDA receptor-mediated synaptic currents. Nature. 1990;346:565–567. doi: 10.1038/346565a0. [DOI] [PubMed] [Google Scholar]
- 31.Adesnik H, Li G, During MJ, Pleasure SJ, Nicoll RA. NMDA receptors inhibit synapse unsilencing during brain development. Proc. Natl. Acad. Sci. U.S.A. 2008;105:5597–5602. doi: 10.1073/pnas.0800946105. [DOI] [PMC free article] [PubMed] [Google Scholar]
- 32.Fukaya M, Kato A, Lovett C, Tonegawa S, Watanabe M. Retention of NMDA receptor NR2 subunits in the lumen of endoplasmic reticulum in targeted NR1 knockout mice. Proc. Natl. Acad. Sci. U.S.A. 2003;100:4855–4860. doi: 10.1073/pnas.0830996100. [DOI] [PMC free article] [PubMed] [Google Scholar]
- 33.Tsien JZ, Huerta PT, Tonegawa S. The essential role of hippocampal CA1 NMDA receptor-dependent synaptic plasticity in spatial memory. Cell. 1996;27:1327–1338. doi: 10.1016/s0092-8674(00)81827-9. [DOI] [PubMed] [Google Scholar]
- 34.Madisen L, et al. A toolbox of Cre-dependent optogenetic transgenic mice for light-induced activation and silencing. Nat. Neurosci. 2012;15:793–802. doi: 10.1038/nn.3078. [DOI] [PMC free article] [PubMed] [Google Scholar]
- 35.Casado M, Isope P, Ascher P. Involvement of presynaptic N-methyl-D-aspartate receptors in cerebellar long-term depression. Neuron. 2002;33:123–130. doi: 10.1016/s0896-6273(01)00568-2. [DOI] [PubMed] [Google Scholar]
- 36.Park H, Popescu A, Poo MM. Essential role of presynaptic NMDA receptors in activity-dependent BDNF secretion and corticostriatal LTP. Neuron. 2014;84:1009–1022. doi: 10.1016/j.neuron.2014.10.045. [DOI] [PMC free article] [PubMed] [Google Scholar]
- 37.Larsen RS, et al. NR3A-containing NMDARs promote neurotransmitter release and spike timing-dependent plasticity. Nat. Neurosci. 2011;14:338–344. doi: 10.1038/nn.2750. [DOI] [PMC free article] [PubMed] [Google Scholar]
- 38.Sasaki YF, et al. Characterization and comparison of the NR3A subunit of the NMDA receptor in recombinant systems and primary cortical neurons. J. Neurophysiol. 2002;87:2052–2063. doi: 10.1152/jn.00531.2001. [DOI] [PubMed] [Google Scholar]
- 39.Kunz PA, Roberts AC, Philpot BD. Presynaptic NMDA receptor mechanisms for enhancing spontaneous neurotransmitter release. J. Neurosci. 2013;33:7762–7769. doi: 10.1523/JNEUROSCI.2482-12.2013. [DOI] [PMC free article] [PubMed] [Google Scholar]
- 40.Fiszman ML, et al. NMDA receptors increase the size of GABAergic terminals and enhance GABA release. J. Neuosci. 2005;25:2024–2031. doi: 10.1523/JNEUROSCI.4980-04.2005. [DOI] [PMC free article] [PubMed] [Google Scholar]
- 41.Wang PY, Petralia RS, Wang YX, Wenthold RJ, Brenowitz SD. Functional NMDA receptors at axonal growth cones of young hippocampal neurons. J. Neurosci. 2011;31:9289–9297. doi: 10.1523/JNEUROSCI.5639-10.2011. [DOI] [PMC free article] [PubMed] [Google Scholar]
- 42.Clark BA, Cull-Candy SG. Activity-dependent recruitment of extrasynaptic NMDA receptor activation at an AMPA receptor-only synapse. J. Neurosci. 2002;22:4428–4436. doi: 10.1523/JNEUROSCI.22-11-04428.2002. [DOI] [PMC free article] [PubMed] [Google Scholar]
- 43.Vissel B, Krupp JJ, Heinemann SF, Westbrook GL. A use-dependent tyrosine dephosphorylation of NMDA receptors is independent of ion flux. Nat. Neuorsci. 2001;4:587–596. doi: 10.1038/88404. [DOI] [PubMed] [Google Scholar]
- 44.Krapivinsky G, et al. The NMDA receptor is coupled to the ERK pathway by a direct interaction between NR2B and RasGRF1. Neuron. 2003;40:775–784. doi: 10.1016/s0896-6273(03)00645-7. [DOI] [PubMed] [Google Scholar]
- 45.Weilinger NL, et al. Metabotropic NMDA receptor signaling couples Src family kinases to pannexin-1 during excitotoxicity. Nat. Neurosci. 2016;19:432–442. doi: 10.1038/nn.4236. [DOI] [PubMed] [Google Scholar]
- 46.Aow J, Dore K, Malinow R. Conformational signaling required for synaptic plasticity by the NMDA receptor complex. Proc. Natl. Acad. Sci. U.S.A. 2015;112:14711–14716. doi: 10.1073/pnas.1520029112. [DOI] [PMC free article] [PubMed] [Google Scholar]
- 47.Min R, Nevian T. Astrocyte signaling controls spike timing-dependent depression at neocortical synapses. Nat. Neurosci. 2012;15:746–753. doi: 10.1038/nn.3075. [DOI] [PubMed] [Google Scholar]
- 48.Rothman S. Noncompetitive N-methyl-D-aspartate antagonists affect multiple ionic currents. J. Pharmacol. Exp. Ther. 1988;246:137–142. [PubMed] [Google Scholar]
- 49.Agmon A, Connors BW. Thalamocortical responses of mouse somatosensory (barrel) cortex in vitro. Neuroscience. 1991;41:365–379. doi: 10.1016/0306-4522(91)90333-j. [DOI] [PubMed] [Google Scholar]
- 50.Pologruto TA, Sabatini BL, Svoboda K. ScanImage: flexible software for operating laser scanning microscopes. Biomed. Eng. Online. 2003;2:13. doi: 10.1186/1475-925X-2-13. [DOI] [PMC free article] [PubMed] [Google Scholar]
Associated Data
This section collects any data citations, data availability statements, or supplementary materials included in this article.