

Abstract
Background
Cerebral cavernous malformations (CCMs) are hemorrhagic brain lesions, where murine models allow major mechanistic discoveries, ushering genetic manipulations and preclinical assessment of therapies. Histology for lesion counting and morphometry is essential yet tedious and time consuming. We herein describe the application and validations of X-ray micro-computed tomography (micro-CT), a nondestructive technique allowing three-dimensional CCM lesion count and volumetric measurements, in transgenic murine brains.
New Method
We hereby describe a new contrast soaking technique not previously applied to murine models of CCM disease. Volumetric segmentation and image processing paradigm allowed for histologic correlations and quantitative validations not previously reported with the micro-CT technique in brain vascular disease.
Results
Twenty-two hyper-dense areas on micro-CT images, identified as CCM lesions, were matched by histology. The inter-rater reliability analysis showed strong consistency in the CCM lesion identification and staging (K=0.89, p<0.0001) between the two techniques. Micro-CT revealed a 29% greater CCM lesion detection efficiency, and 80% improved time efficiency.
Comparison with Existing Method
Serial integrated lesional area by histology showed a strong positive correlation with micro-CT estimated volume (r2= 0.84, p<0.0001).
Conclusions
Micro-CT allows high throughput assessment of lesion count and volume in pre-clinical murine models of CCM. This approach complements histology with improved accuracy and efficiency, and can be applied for lesion burden assessment in other brain diseases.
Keywords: Cerebral cavernous malformation, Micro-CT, Iodine contrast, Morphometry
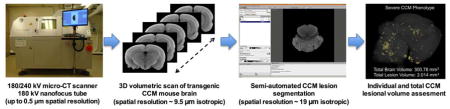
Graphical Abstract
1. Introduction
Cerebral cavernous malformation (CCM) is a common disease, with a prevalence of 0.5 % in neurologically asymptomatic people (Vernooij et al., 2007). CCM patients have a highly unpredictable clinical course that manifests as a lifetime risk of hemorrhagic stroke, seizures and other neurologic sequelae. This results in major morbidity and mortality with currently no treatment for CCM disease aside from neurosurgery to resect symptomatic lesions (Al-Shahi Salman et al., 2012; Batra et al., 2009). CCM lesions are characterized by clusters of dilated sinusoids lined by a single layer of endothelium filled with red blood cells (RBCs) (McDonald et al., 2011; Shenkar et al., 2008). These are prone to chronic blood leakage related to vascular hyperpermeability resulting from RhoA kinase activation in endothelial cells (Mikati et al., 2015; Whitehead et al., 2009).
Molecular and genetics discoveries reported in recent literature suggest that the pathogenesis of the disease is linked to a mutation in one of the three CCM genes, KRIT1 (CCM1), CCM2 and PDCD10 (CCM3) (Batra et al., 2009). However, translating laboratory discoveries of pathogenesis and therapeutic agents (Li and Whitehead, 2010; Maddaluno et al., 2013; McDonald et al., 2012) into clinical trials has been restrained by the highly variable lesion behavior and the low rate of de novo lesion formation in patients (Al-Shahi Salman et al., 2012, 2008; Kondziolka et al., 2013).
Murine models of disease have allowed major mechanistic discoveries and ushered genetic manipulations and preclinical assessment of therapies. Indeed, the development of transgenic murine models mimicking human CCM lesions partially elucidated the molecular and genetic pathways associated with CCM disease genesis, penetrance and progression at various stages over time (McDonald et al., 2011).
Histology is currently considered the gold standard in comparative assessment of lesion burden in response to genetic manipulations and preclinical testing of novel therapies (McDonald et al., 2011; Shenkar et al., 2015, 2008). Lesion assessment by histology is a time-consuming process that involves serial sectioning of the entire brain with staining of the full series of sections (Shenkar et al., 2008). While previous studies have proven the high fidelity of magnetic resonance imaging (MRI) in lesion detection in transgenic CCM murine models (McDonald et al., 2011; Shenkar et al., 2008), the use of MRI remains costly in both time and money. Additionally, the paramagnetic effects of hemorrhage in lesions can distort volumetric assessment, particularly at high magnetic fields necessary for imaging murine brains. Hence, MRI has remained unfit to replace histological procedures in a cost-effective or accurate way (Anderson and Maga, 2015; Shenkar et al., 2008).
Over the past thirty years, X-ray micro-computed tomography (micro-CT) imaging has rapidly emerged as a suitable alternative to micro-MRI (Schambach et al., 2010b). Micro-CT imaging has been used widely for the 3D-morphological characterization, examination and quantification -at an isotropic spatial resolution as high as 0.5 μm of diverse tissues in vivo and ex vivo, including the brain (Anderson and Maga, 2015; de Crespigny et al., 2008; Saito and Murase, 2012; Saito et al., 2012). When applied to brain, the technique has been shown to approach the requisite resolution of optical and electron microscopy in imaging neuronal networks and synapses (Mikula and Denk, 2015).
Nevertheless, micro-CT has been mainly applied to the imaging of radiopaque tissues, since soft tissues provide low intrinsic X-ray attenuation limiting contrast resolution in the images (Metscher, 2009b; Degenhardt et al., 2010). It has not to date been systematically applied nor validated against histologic controls in the assessment of lesion burden in murine models of brain disease.
The advent of diffusible iodine-based contrast-enhanced computerized tomography (DiceCT) has greatly alleviated these limitations (Gignac et al., 2016). Several studies have demonstrated the ability to increase the differential attenuation of X-rays among soft tissues in order to obtain higher relative image contrast by soaking samples in solutions containing iodine for its low cellular toxicity and non-destructive element of high atomic number (Anderson and Maga, 2015; Cox and Jeffery, 2011; Metscher, 2009a, 2009b). Iodine is able to diffuse throughout brain parenchyma and has a high affinity for blood (Anderson and Maga, 2015). Unlike osmium tetroxide and other contrast agents (Metscher, 2009a; White et al., 1976), the iodine technique (Metscher, 2009b; Wong et al., 2013) does not render the tissue unusable after the staining thus allowing continuation of investigation with histology on the same tissue.
The micro-CT technique has previously been utilized to image brain diseases (Dobrivojevic et al., 2013; Engelhorn et al., 2009; Park et al., 2014) including recent report with our group showing feasibility in imaging CCM in murine models (Zhou et al., 2016). However, those studies did not include direct validation in relation to histologic morphometry, in part because the osmium staining techniques applied previously do not preserve the histologic structure for direct correlations. We hereby describe a new contrast soaking technique not previously applied to CCM, and a segmentation and image processing paradigm allowing us to conduct novel histologic correlations and quantitative validations never previously published with the micro-CT technique in brain vascular disease. By using CCM as a model, we demonstrated an efficient and non-destructive imaging protocol with high inter-observer reliability, and a strong correlation with histologic morphometry. This is proposed as an accurate and high throughput paradigm shift in the gold standard of lesion burden assessment in murine models of brain diseases.
2. Material and methods
2.1. CCM murine models
All animal protocols were approved by the Duke University Institutional Animal Care and Use Committee (IACUC). Guidelines stated in the National Institutes of Health Guide for the Care and Use of Laboratory Animals (NIH Publications No. 8023, revised 1978) have been followed, and all animal studies have complied with the ARRIVE guidelines. In this retrospective study, a cohort of 26 mice (19 females, 7 males) has been analyzed, including three different transgenic strains that exhibit a range of lesion burden: 3 Ccm3+/−Rock1+/− (3 females), 4 Ccm3+/−Rock2+/− (2 females, 2 males) and 19 Ccm3+/− (14 females, 5 males). Ccm3+/− mice were obtained from Yale University (Louvi et al., 2011). These were crossed with Rock1+/− and Rock2+/− mice, obtained from James Liao (University of Chicago). All animal breeding was conducted at Duke University. Following brain extraction and fixation, the specimens were shipped overnight to the University of Chicago for imaging and histological analysis.
2.2. Brain extraction and fixation
Mice were euthanized at approximately 4 months of age using carbon dioxide (Airgas, Radnor Township, Pennsylvania, USA) delivered in an acrylic chamber at a flow-rate of 2 liters per minute, in agreement with Division of Laboratory Animal Resources/IACUC guidelines. Subsequently, mouse brains were removed from the heads, immersed in the fixative (10% neutral buffered formalin, Azer Scientific, Morgantown, Pennsylvania, USA). Specimens were immersed rather than perfused to best preserve intravascular lesion morphology, which features intralesional accumulation of RBCs.
2.3. Iodine soaking of brains
In order to provide contrast for the micro-CT imaging, the brains were immersed into 5% weight/volume (w/v) aqueous stock solution of Lugol’s iodine (5% w/v I2, 10% w/v KI) (Thermo Fisher Scientific, Waltham, Massachusetts, USA), diluted in deionized water to achieve a solution with 1.25% of w/v I2 (1:3 ratio by volume). Each specimen was soaked in 50 ml of the iodine solution for 96 hours (Saito and Murase, 2012), stored in a dark place at room temperature in a 100 ml Samco™ specimen container (Thermo Fisher Scientific, Waltham, Massachusetts, USA). Upon soaking completion, the specimen was removed and lightly blotted with a paper towel to remove excess Lugol’s staining solution and placed into a 1.7 ml microcentrifuge tube (Corning Incorporated, Corning, New York, USA). The brain was wedged with parafilm (Bemis Flexible Packaging, Neenah, Wisconsin, USA) to restrict sample movements during micro-CT acquisition. After the microcentrifuge tube top was closed, the tube was sealed with parafilm to prevent volume loss during the scan due to evaporation.
2.4. Micro-CT scanner and acquisition parameters
The iodine-soaked CCM mouse brains were scanned with a micro-CT system (General Electric, Fairfield, Connecticut, USA) (Fig. 1A). Data acquired with a transmission 180 kV nanofocus X-ray tube using a diamond anode allows for a higher spatial resolution in small and soft tissue samples as well as high power on a small focal spot (Kerckhofs et al., 2014, 2013; Schambach et al., 2010a, 2010b). After the initial routine X-ray tube calibration procedure, a microcentrifuge tube containing a mouse brain was clamped to a computerized numerical control (CNC) rotating gantry. The sample was aligned (X = 0 mm in XYZ reference frame) and centered at the 0° rotational position. After the source–sample and sample–detector distances were adjusted to achieve isotropic reconstructions with voxel size around 9.5 μm (Z axis), the sample was positioned using a live-image mode to allow the acquisition of the entire mouse brain (Y axis) (Fig. 1C).
Fig. 1.

Micro-CT setup. (A) The Phoenix v|tome|x s 240 scanner with a mouse brain in ‘live-image’ mode. (B) Mouse brain in a parafilm-sealed eppendorf tube, mounted on top of a hollow tube. (C) The setup described in (B) is clamped to a computerized numerical control (CNC) rotating gantry and positioned between the detector and source.
For each sample, 1000 images were generated by averaging of three back-projections taken after one skipped exposure with an exposure time of 500ms/projection. For protocol optimization, we acquired our data with two separate sets, different only in the voltage (kV) and current (mA) set-up. The 26 Ccm3+/− non-sensitized mouse brains were scanned using kV = 90 and mA = 110. Among all brains, 11 were randomly chosen and scanned a second time with another acquisition set-up: kV=100 and mA=91.
After acquisition, all reconstruction processes used the modules implemented in datos|x reconstruction software (General Electric, Fairfield, Connecticut, USA). The reconstructed area was reoriented and pre-selected by cropping in the four compass points (0°, 90°, 180° and 270°). An automatic computerized correction of translational sample shifts throughout the acquisition was performed by co-registering 9 pairs of scan and pre-scan images, using the AutoScan Optimizer module. The same parameter of beam hardening correction was applied on all mice brains, using the BHC+ module. Since the raw micro-CT imaging data processing exceeded our hardware memory capability, the spatial resolution of this dataset was half-down sampled from the original isotropic voxel size of approximately 9.5 μm to 19 μm. Given the average lesion volume of 0.3588 mm3, the decrease of resolution here did not have any significant impact on the final lesion volume estimation.
Finally, the micro-CT dataset was reconstructed by processing the multiple projections using an optimized Feldkamp backprojection reconstruction algorithm. The reconstructed micro-CT images were then exported as DICOM format, using Volume Graphics Studio Max version 2.2 (Volume Graphics GmbH, Heidelberg, Germany). For more details about micro-CT scanner specifications and acquisition parameters refer to Table 1.
Table 1.
Micro-CT scan acquisition protocol
| Micro-CT scanner model | Phoenix v|tome|x s 180/240 (dual tubes) |
| X-ray tube | Phoenix 180kV/15W high-power nanofocus tube |
| Detector | Temperature stabilized digital GE DXR detector array |
| X-ray source target | Diamond |
| Isotropic voxel size (spatial resolution) | Approx. 9.5μm |
| Detector panel resolution (width x height) in pixels (in inches) | 2024 × 2024 (16″×16″) |
| Field of view (width x height) in mm | 11.4 ×19.2 |
| Rotation | 360° in 33 min 22 sec |
| Projections | 1000 |
| Number of exposures (projections) | 3 |
| Exposure time | 500 msec/projection |
| Voltage (kV)/current (mA) | 90/110 and 100/91 |
| Staining (soaking) agent | Lugol’s Iodine, 1.25% w/v I2 and 2.5% w/v KI in deionized water |
2.5. Post-processing imaging and lesional volume segmentation
The post-processing of the micro-CT DICOM images and the volumetric segmentation of the iodine-stained CCM lesions were performed using AMIRA 5.5 software platform (FEI, Hillsboro, Oregon, USA) accessible via a shared resource computer cluster, the Research Computing Center at the University of Chicago (Chicago, Illinois, USA). The raw DICOM stack was first registered to be perpendicular to established sagittal and horizontal reference planes (Valverde, 1998). The interhemispheric fissure was defined as the sagittal plane (Supp. Fig. 1A), while the horizontal was parallel to the tangent of the brain base (Supp. Fig. 1B). The reoriented volume (Supp. Fig. 1C) was then de-noised and smoothed using a non-local means method. For each target pixel, this filtering algorithm-type computes a weighted average value of all pixels included in the image based on the similarity with pre-defined neighborhood clusters of pixels (Buades et al., 2005; Xu and Mueller, 2010). The volumetric segmentation of the CCM lesions (Supp. Video 1, 2, 3 and 4) was performed on the filtered CT-volume stack with the segmentation editor module. To achieve a reproducible method for lesion segmentation, the micro-CT image contrast was adjusted by narrowing the visualization data window on the intensity distribution histogram to the two margins of the peak intensity corresponding to brain soft tissue. Finally, the CCM lesions on the micro-CT images were segmented using the magic wand tool; a pixel-based image segmentation method that iteratively merges, as a set of clusters, similar pixels in terms of deviation from the mean intensity of the target region. Suspected CCM lesions were identified and counted. A Stage 1 CCM lesion was defined as an isolated single ballooned capillary (cavern) with a minimum diameter of 100 μm. Stage 2 CCM lesions were contiguous multicavernous lesions with at least one of the caverns having a diameter of 100 μm or more (Supp. Fig. 2) (McDonald et al., 2012). The lesional volume was estimated by the Material Statistics module. For a comprehensive step-by-step protocol, explaining the different stage of the post-processing and CCM lesions segmentation, refer to Appendix in the supplementary material.
2.6. Contrast and signal-to-noise values assessment
For the purposes of micro-CT parameter optimization, the signal-to-noise ratio (SNR) and contrast were calculated for acquired imaging protocols. Image intensities were obtained by region-of-interest (ROI) selection using ImageJ software (National Institutes of Health, Bethesda, Maryland, USA). SNR was computed as:
| [1] |
where Sμ,Brain is the mean signal intensity of the whole brain region, and σref is the standard deviation of the reference background region (air) (Supp. Fig. 3) (Magnotta et al., 2006). Contrast resolution was defined as a variation of the Weber fraction definition of contrast as:
| [2] |
where Sa, Sb, and Sref are the mean signal intensities of the lesion ROI, surrounding tissue, and reference background, respectively (Supp. Fig. 3) (Peli, 1990). This definition differs from the Weber fraction that the difference computed in the numerator reflects the contrast between the lesion and surrounding tissue, rather than between the lesion and background.
2.7. Histology protocol
2.7.1. Iodine reduction in brains
Since Lugol’s iodine leaves soft tissue structure intact and imparts upon it a yellow hue (Anderson and Maga, 2015), we optically destained the specimens, after the micro-CT data acquisition, in order to perform histological validation. Each stained mouse brain was immersed individually in a 50-ml conical centrifuge tube (Denville Scientific, Holliston, Maryland, USA) filled with 25 ml of the 2.5% w/v solution of sodium thiosulfate (ratio 1:2 relative to Lugol’s solution concentration) (Thermo Fisher Scientific, Waltham, Massachusetts, USA) and agitated for 96 hours with a shaker at room temperature. Sodium thiosulfate does not remove the stain but rather reduces the iodine and triiodide species to iodide, which is colorless. The samples were then stored in a 10% neutral buffered Harleco® formalin solution (EMD Millipore, Darmstadt, Germany) until the histology procedure.
2.7.2. CCM mouse brain tissue blocking
The CCM mouse brains were aligned in a rodent brain matrix mold (ASI Instrument, Warren, Michigan, USA). Coronal slices of 1-mm thicknesses were generated, placed into Histosette® histology cassettes (Simport Scientific Inc, Beloeil, Quebec, Canada) with blue biopsy foam pads (Spectrum Chemicals & Laboratory Products, New Brunswick, New Jersey, USA) and immersed into 70% ethanol.
2.7.3. CCM mouse brain tissue processing
The brain slices within histology cassettes were processed using an automated routine program on a Sakura Tissue-Tek VIP Tissue Processor (Sakura Finetek U.S.A., Inc., Torrance, California, USA), embedded in molten paraffin with a metal embedding mold using a Sakura Tissue-Tek TEC embedding center (Sakura Finetek U.S.A., Inc.) and solidified on a cold plate at the University of Chicago Human Tissue Research Center. In order to rehydrate the brain tissue for sectioning, the paraffin-embedded mouse brain tissues were opened up and placed face down overnight on Kimwipes task wipers (Kimberly-Clark, Irving, Texas, USA) soaked with a tissue hydrating solution constituted of 10% glycerol (Thermo Fisher Scientific) filled with 90% HyClone Dulbecco’s phosphate buffered saline (General Electric Healthcare, Little Chalfont, United Kingdom).
The paraffin blocks were sectioned at 5-μm thicknesses using a rotary microtome (Leica Biosystems Inc., Buffalo Grove, Illinois, USA) with an ultra-sharp blade (Sakura Finetek U.S.A., Inc.). Individual sections were floated in a heated water bath and picked up on a 25×75×1.0 mm Fisherbrand™ Superfrost™ Plus microscope slides (Thermo Fisher Scientific). The sections were viewed with a microscope and assessed for quality and presence of CCM lesions. If a lesion was present, the block was sectioned until a representative visualization (maximum diameter) was encountered by the histotechnicians (TM and RL), with a minimum of 10 sections collected, and dried at room temperature overnight. When multiple CCM lesions were encountered on the same 1-mm thick slice, each lesion was considered individually. All 5-μm thick sections were reviewed for CCM lesions by two independent observers (RS and TM), with findings further adjudicated by a third observer (IAA) as previously reported by our group (McDonald et al., 2012, 2011).
2.7.4. Hematoxylin and eosin staining of sections
The slides containing the paraffin-embedded sections were placed in a slide holder and the paraffin was melted on the slides for 30 minutes at 60°C in an oven (Thermo Fisher Scientific). The sections were deparaffinized using xylene (Thermo Fisher Scientific). This was followed by the rehydration of brain sections in a graduated sequence, beginning with 100% ethanol (Decon Laboratories Inc., King of Prussia, Pennsylvania, USA), 95% ethanol (Decon Laboratories Inc.) and 80% ethanol (Thermo Fisher Scientific). All sections were stained using an adapted hematoxylin and eosin protocol with Mayer’s hematoxylin (Agilent Technologies, Santa Clara, California, USA) and eosin 0.5% (Polysciences Inc., Warrington, Pennsylvania, USA). The complete staining timeline is presented in Supplementary Table 1.
Finally, the stained sections were coverslipped (Richard-Allan Scientific Co., Kalamazoo, Michigan, USA) using Cytoseal 60 ™ mounting medium (Richard-Allan Scientific Co.).
2.8. CCM lesional area assessment
After staining with hematoxylin and eosin, the sections were assessed for lesion burden. Stage 1 and 2 CCM lesions (as defined in Section 2.5) (McDonald et al., 2012) were identified and catalogued on the respective coronal tissue sections. The lesional area was segmented by defining the borders encompassing the entire CCM lesion using the polygon area function of a microscope digital camera DP21 (Olympus America Inc., Center Valley, Pennsylvania, USA). If the same lesion spanned more than one 1-mm slice, the total area of the lesion was calculated from the sum of the areas in sections (representative visualization) containing the lesion.
2.9. Localization of iodine within the CCM cavern
To determine the localization of iodine in CCM lesion, one of the sections of the mouse brain was heated in the oven for 30 minutes at 60°C, deparaffinized and rehydrated as per the hematoxylin and eosin method, then stained with Lugol’s Iodine 1.25% solution for 6 minutes. Following this, the section was dehydrated with 95 and 100% ethanol and then cleared with xylene.
2.10. Statistics
The consistency between the CCM lesional volumes estimated through computational segmentation and the lesional area assessed using histologic morphometry were calculated using a Pearson correlation coefficient (r) analysis (Hunt, 1986), as previously reported (Wang et al., 2012). Lesional volumes were estimated through computational segmentation by an imaging scientist and engineer (RG and NH). These assessors had no other special training except for the operation of Micro-CT instrument under the supervision of senior scientist Z-X L. The two sets of micro-CT acquisition parameters were also tested using a Pearson correlation coefficient and Bland-Altman analysis (Bland and Altman, 1999, 1986). The consistency between the lesional staging classified by the two observers and then by histology was assessed by the Kappa test. The Kappa coefficient (K) was calculated and used to quantify inter-rater consistency (McHugh, 2012; Sim and Wright, 2005) and interpreted based on Landis and Koch criteria (Landis and Koch, 1977; Rigby, 2000). Kappa is a concordance index ranging from zero to one, with the maximum value of one indicating perfect consistency, and zero corresponding to a complete absence of consistency. Finally, a two-tail paired Student’s t-test analysis was used to the SNR and the contrast image between the two sets of micro-CT acquisition parameters. Statistical analyses were performed using R statistical software (R Foundation for Statistical Computing, Vienna, Austria), GraphPad Prism 4.0 (GraphPad Software Inc., La Jolla, CA) and SAS 9.4 (SAS Institute Inc., Cary, NC, USA).
2.11. Assessment of relative efficiency of novel and classical techniques
Scientists involved in micro-CT processing (TM, RG and HZ) were requested to log the time needed to process and image the 26 fixed brains, and scientists involved in the lesion segmentation and micro-CT volumetrics (NH, HZ and RG) were asked to log the time involved in the assessment of lesion burden by the new method. Histotechnicians processing the same brains (TM and RL) and scientists involved in lesion adjudication and histologic morphometry (RS and TM) were asked to log the time in hours needed to assess lesion burden by the traditional method. Time involved in protocol optimization, in destaining the brains after micro-CT data acquisition, and in comparative analyses or respective lesion burden by the two techniques were not considered in these analyses.
3. Results
3.1. Histological validation of micro-CT measurements
The computational volumetric assessment was performed on 26 transgenic mouse brains (3 Ccm3+/−Rock1+/−; 4 Ccm3+/−Rock2+/− and 19 Ccm3+/−). A total of 35 potential hyperintense non-surface CCM lesions (in 17 mice) were identified on micro-CT images (Fig. 2), segmented and their volumes computationally estimated. We excluded from the analysis potential lesions at the surface of the brain, as the brain surface is more liable to be damaged during brain extraction and lesion borders may be difficult to delineate during histological assessment. The 26 CCM mouse brains were then processed for lesion assessment by histology on serial 1-mm increment coronal sections.
Fig. 2.

Identification of small and large CCM lesions in a transgenic murine model of cerebral cavernous malformation. (A, D) Coronal section of a micro-CT generated image showing a hyper-dense stage 2 CCM lesion. (B, E) Following micro-CT acquisition, the corresponding gross slice (1-mm thickness) was examined at 1.5x magnification using a dissecting microscope (Olympus SZ61 mounted with an Olympus DP21 camera) to assess the presence of CCM lesions. (C, F) The hyper-dense structure was validated to be a CCM lesion using histology. (D–F) Illustration of a Ccm3+/−Trp53−/− murine model (not included in our analysis) highlighting the difficulty of assessing lesion burden in large complex stage 2 CCM lesions on single cross sectional histologic section. This limitation is overcome by using volumetric micro-CT analysis of lesion burden.
Twenty-five suspected CCM lesions (from 12 mice) were identified on histology. Eleven potential lesions identified on micro-CT were not proved by histology, likely due to the limitations of the serial 1-mm increment coronal sections histologic sampling method (McDonald et al., 2012). Two other hyperdense structures identified as CCM lesions on micro-CT images could not be confirmed histologically, as areas corresponding to the lesions were damaged during histologic sectioning. Three CCM lesions (from 3 mice) were identified by histology only. These lesions were defined on micro-CT imaging as normal vessels because of their tubular shape through the image stack. Respective lesion detection by the two techniques is summarized in Table 2. The detection rate of brain areas recognized as CCM lesions was 29% greater in micro-CT than histologic images.
Table 2.
Lesional count and staging of the 26 transgenic CCM mice
| Micro-CT technique | Histological morphometry | |||
|---|---|---|---|---|
|
| ||||
| Genotype | #Stage 1 lesion | #Stage 2 lesion | #Stage 1 lesion | #Stage 2 lesion |
| Ccm3+/− | 2 | 2 | 1 | 2 |
| Ccm3+/− | 0 | 1 | 0 | 1 |
| Ccm3+/− | 0 | 1 | 0 | 1 |
| Ccm3+/− | 0 | 0 | 0 | 0 |
| Ccm3+/− | 1 | 1 | 0 | 0 |
| Ccm3+/− | 0 | 0 | 1 | 0 |
| Ccm3+/− | 0 | 0 | 0 | 1 |
| Ccm3+/− | 1 | 0 | 1 | 0 |
| Ccm3+/− | 1 | 0 | 1 | 0 |
| Ccm3+/− | 0 | 0 | 0 | 0 |
| Ccm3+/− | 2 | 0 | 0 | 0 |
| Ccm3+/− | 0 | 3 | 0 | 2 |
| Ccm3+/− | 0 | 1 | 0 | 0 |
| Ccm3+/− | 1 | 0 | 0 | 0 |
| Ccm3+/− | 1 | 6 | 2 | 5 |
| Ccm3+/− | 0 | 1 | 0 | 0 |
| Ccm3+/− | 1 | 0 | 0 | 0 |
| Ccm3+/− | 2 | 3 | 2 | 3 |
| Ccm3+/− | 0 | 0 | 0 | 0 |
| Ccm3+/−Rock1+/−Rock2+/+ | 1 | 0 | 0 | 0 |
| Ccm3+/−Rock1+/−Rock2+/+ | 0 | 1 | 0 | 1 |
| Ccm3+/−Rock1+/−Rock2+/+ | 0 | 0 | 0 | 0 |
| Ccm3+/−Rock1+/+Rock2+/− | 0 | 0 | 0 | 0 |
| Ccm3+/−Rock1+/+Rock2+/− | 0 | 0 | 0 | 0 |
| Ccm3+/−Rock1+/+Rock2+/− | 0 | 2 | 0 | 0 |
| Ccm3+/−Rock1+/+Rock2+/− | 0 | 0 | 0 | 1 |
Twenty-two CCM lesions (from 9 mice) matched on histology and micro-CT images were analyzed. The inter-rater consistency analysis showed strong consistency in the CCM lesion staging (K =0.89, p<0.0001) between the two techniques; only 2 CCM lesions were not categorized identically. Moreover, a significant correlation was observed between the lesional area estimated through histology and the volume using the computational approach (r2=0.99 and p<0.0001) (Fig. 3A). Since the 2 largest lesions can cause bias in the correlation result, an analysis omitting these lesions was performed and demonstrated a robust correlation with the remaining 20 lesions with volumes < 0.1 mm3 in size (r2=0.84 and p<0.0001) (Fig. 3B). Moreover, there was a strong and significant correlation between the total CCM lesional burden integrated area/mouse and the total CCM lesion volume/mouse (r2=0.99 and p<0.0001) (Supp. Fig. 4).
Fig. 3.

Micro-CT assessed CCM lesional volume correlates significantly with CCM lesional area assessed by histologic morphometry on serial sections cut from coronal 1-mm slices of the same brains. The CCM lesional area by histology showed significant consistency with the volume assessed by micro-CT imaging for (A) all lesions (n=22, r2=0.99 and p<0.0001). (B) lesions with volumes <0.1 mm3 (n=20, r2=0.84 and p<0.0001).
3.2. Iodine within the CCM cavern
To determine the localization of iodine in CCM lesion, one of the sections of the mouse brain was heated, deparaffinized and rehydrated (Fig. 4A and B), then stained with Lugol’s Iodine before dehydration. Iodine was observed to stain throughout the brain parenchyma albeit with different intensity and concentration (Fig. 4C and D). RBCs (Fig. 4E and F) appeared more intensely stained than the plasma within the caverns. The degree of iodine binding visually correlated with the density of the material observed on micro-CT images.
Fig. 4.

Iodine in blood-filled caverns of CCM lesions. (A) 10X and (B) 40X magnification of unstained 5-μm histological sections showing the CCM lesion. (C) 10X and (D) 40X magnification of an iodine-stained section demonstrating the higher concentration of iodine in the blood-filled cavern relative to surrounding parenchyma. (E) 10X and (F) 40X magnification of the H&E stained section of the corresponding lesion showing the morphology of the blood filled cavern with surrounding parenchyma.
3.3. Validity of lesional volume assessment via different observers
Repeated lesional segmentation and volumetric quantification of 49 CCM lesions observed on micro-CT imaging by two independent observers blinded for mice genotype showed no significant difference (Bland-Altman analysis, Bias=−0.002, 95% CI=[−0.005, 0.005]) (Fig. 5A) and good consistency in the lesional volume estimated (r2=1, p<0.0001) (Fig 5B). Three lesions (6.1%) were identified by only one of the two observers. Furthermore, the two observers’ morphological staging of CCM lesions identified on micro-CT images had strong consistency (K=0.91, p<0.0001). Two lesions (4.1%) were not categorized identically by the two observers.
Fig. 5.

Inter-observer consistency of CCM lesional volumes assessed by the micro-CT technique. (A) Bland-Altman analysis of the lesional volumes assessed by two different observers showed no differences (Bias=−0.002, 95% CI=[−0.005, 0.005]). (B) The two volumes assessed had perfect consistency (r2=1, p<0.0001).
3.4. Reliability in acquisition parameters
Eleven Ccm3+/− mouse brains were acquired twice with different sets of micro-CT acquisition parameters. The contrast resolution and SNR were affected by the modulation of the acquisition parameters (McCollough et al., 2009; Nakayama et al., 2005). The overall image contrast (p=0.005) and SNR (p<0.001) were significantly higher with the first set of acquisition parameter (kV=100; μA=91; Electrical Power=9.1 Watts). Within the deep CCM lesions, the contrast resolution (p<0.002) and SNR (p<0.0001) were also significantly higher, allowing a better discrimination between lesion and healthy brain tissue.
Moreover, the two observers identified the CCM lesions on both sets of images acquired with different imaging protocols. Fifteen radiopaque lesions (from 7 mice) were identified in both micro-CT images by both observers. The Bland-Altman analysis showed no difference between the two CCM lesional volumes estimated through computational segmentation with the two sets of acquisition parameters for both observers (First observer: bias=0.0001, 95% CI=[−0.007, 0.007]; Second observer: bias=0.001, 95% CI=[−0.008, 0.01]) and good consistency (r=0.86, p<0.0001).
3.5 Time efficiency of micro-CT volumetrics versus histologic morphometry
Two histotechnicians spent approximately 98 person-hours each (85 hours for brain tissue processing and 13 for histology section reading and area measurements) of bench work time to process the 26 brains by conventional histologic morphometry. Conversely, 20 person-hours (9 hours of data acquisition and 11 for data post-processing and lesional segmentation) were each logged by two technicians using micro-CT scan protocol. Our micro-CT imaging protocol showed a time efficiency improvement of 80% compared to the gold standard histology method.
4. Applications and Discussion
Developing murine models of CCM gives investigators the opportunity to better understand the pathogenesis of disease in response to genetic and pharmacologic manipulations. Assessing CCM lesions in these models involves parameters such as lesion counts and areas that depend largely on histological procedures that are time-consuming and destructive processes. With the wide use of micro-CT imaging in animal models of brain diseases including tumors, demyelinating disease, traumatic lesions and stroke among others and the ability of DiceCT to resolve soft tissue structure (Engelhorn et al., 2009; Gignac et al., 2016; Schambach et al., 2010a, 2010b), we aimed to test and validate this technique in pre-clinical murine models of CCM.
Our protocol was able to detect and localize CCM lesions in a transgenic murine model, mimicking lesions observed in humans (McDonald et al., 2011; Shenkar et al., 2015). Lesions identified on micro-CT were adjudicated on histology demonstrating a high reliability in lesions identified by differentiating them from normal brain anatomy. Furthermore, the computer-based lesional volumetric quantification had a strong correlation with the integrated lesional areas assessed by the current gold standard histology. The significant correlation persists in log transformed data correlation (minimizing the impact of large lesions) and when considering small lesions alone. Given the biological advantages in using the lesional volume in micro-CT in lieu of serial cross sectional areas, the precision in comparing lesional border on individual cross sections to the respective histologic sections becomes less relevant in micro-CT, as measurement of area per se is not the direct measure of micro-CT in its current application. Over- or underestimation of lesional size, if at all, would therefore be a systematic error consistent among all mice models studied, and reflected in the correlations we presented.
More potential CCM lesions were identified using micro-CT compared to histology due to the sampling technique limitation inherent to the 1-mm increment serial sections chosen for histologic serial lesion survey. While the sensitivity of histologic morphometry could be improved by narrower serial slice selection, this would add further time and labor to the process, and would not altogether avoid damage of tissue during sectioning. Finally, the micro-CT technique was validated using two observers and demonstrated high reliability. While there exist techniques for imaging cerebral vasculature using micro-CT (Ghanavati et al., 2014; Starosolski et al., 2015) as well as techniques to preserve tissue for histological analysis (Dobrivojevic et al., 2013; Hopkins et al., 2015), this study is the first to implement, optimize and validate a quantitative volumetric assessment of a model of cerebral vascular disease, in comparison to classical morphometry.
We demonstrated using classic histological procedures that the hyper-density associated to CCM lesions observed on micro-CT images reflects a higher concentration of iodine in CCM lesions. Iodine has a high affinity to lipids and glycogen (Li et al., 2015), both of which are components of RBCs (Moses et al., 1972) which are densely present in CCM caverns. The passive diffusion process through capillary endothelium and accumulation of iodine-based contrast agent in lesions may be facilitated by the hyperpermeability associated with CCM disease (Mikati et al., 2015; Whitehead et al., 2009).
The micro-CT technique saves substantial amount of time in comparison to classical histologic morphometry, potentially by as much as 80%, as was demonstrated in the respective logs of time spent on the assessment of lesion burden by our technical team. The savings in costs in comparison to MRI volumetrics at our institution are even more considerable (ex vivo micro-CT charges for instrument use per brain was approximately $22, compared to $600 typical rate charged for MRI at 9.4 T for a mouse brain during the same period), notwithstanding other limitations of “blooming” paramagnetic effects limiting accurate MRI volumetrics of hemorrhagic lesions (Shenkar et al., 2008). These high throughput and cost efficiencies have allowed our laboratory to apply the technique for assessment of lesion burden in other models of CCM (collaboration with MLK), involving postnatal induced homozygous loss of Ccm genes, where lesions develop exclusively in the hindbrain (added in proof in Supplementary Material, Supplementary Figure 1 and Videos 3 and 4).
This study adds CCM to the line of diseases utilizing micro-CT as an imaging technology (Schambach et al., 2010b). The use of combined DiceCT and micro-CT in pre-clinical murine models of CCM allows the high-throughput and accurate assessment of lesion count and volume that are essential for the evaluation of therapeutics or genetic manipulation. With the advent of different potential therapeutic agents (Gibson et al., 2015; Li and Whitehead, 2010) along with a handful of genes implicated in CCM signaling (Zhou et al., 2015) and phenotypic variations (Choquet et al., 2014), a sensitive, reliable and rapid way of determining their impact on CCM genesis and progression is desirable. The use of the micro-CT technique to assess therapeutic interventions is already being applied in other disease states (Bougioukli et al., 2015; Rusckowski et al., 2016). Similarly, micro-CT imaging is already being relied on in pre-clinical transgenic models involving genetic alterations and transcriptional modifications (Huesa et al., 2015; Keller et al., 2013). This novel technology provides high sensitivity in lesion detection with a spatial resolution of 19-μm isotropic voxel size. Micro-CT imaging added the benefit of a volumetric quantification rather than an integrated serial two-dimensional (2D) analysis provided by histologic morphometry. Three-dimensional reconstructions and volumetric measurements, provided by micro-CT post-processed images, are not biased by 2D interpolation assumptions or geometric distortion of histologic slices (Supp. Fig. 2). Importantly, our protocol with micro-CT preserves the integrity of the brain for subsequent standard conventional histology and immunohistochemistry as reported previously (Hopkins et al., 2015). Advantages and disadvantages of the two techniques are summarized in Supplementary Table 2.
We have optimized and validated the use of combined DiceCT and micro-CT in murine model of CCM. Further development and modifications of the technique by our group and others, are likely to address the technical challenges for wider and improved applicability. Iodine-induced dehydration and shrinkage of samples is well reported. To overcome this effect some groups advocated stabilizing the samples in hydrogel before soaking in iodine or using a structural stabilization method, to retain the brain volume (Wong et al., 2013). In our ongoing studies using micro-CT, we have shifted towards analyzing the lesional volume as a function of total brain volume as opposed to the absolute lesional volume in order to correct for the shrinkage-effect.
Another major limitation of the current technique is the use of excised postmortem fixed and dye-soaked brain, hence the inability to repeatedly image the brain pathology over time. Other techniques such as high field MRI (Shenkar et al., 2008) and second generation optical coherence tomography (optical frequency domain imaging allowing visualization of the live brain at depths greater than 2 mm) (Lin et al., 2014; Srinivasan et al., 2015) can certainly be applied to image blood vessel pathologies in vivo. In its current use, micro-CT is limited in its ex vivo applications, lacking the possibility of longitudinal monitoring of each single murine model, compared to in vivo MRI. However, micro-CT imaging has the advantages of requiring less expertise and competencies of researchers, hence better availability and cost efficiency. There is no specific technical obstacle barring the potential adaptation of current micro-CT instruments to accommodate anesthetized murine models. It remains unclear however, whether conventional computed tomography contrast, without dye immersion will allow sufficient quantification of lesions burden in transgenic CCM murine models, or whether intravenous contrast or other technical modifications might be required. These areas will be natural frontiers of further research in this field, applying our early validations as benchmarks.
The use of this protocol may be extended to other neurovascular malformations such as telangiectasia (Sayama et al., 2010), and diseases involving dysangiogenesis and brittle vessels such as hemorrhagic microangiopathy (Viswanathan and Chabriat, 2006), traumatic brain injury (Jungner et al., 2015) and brain tumors (Jain et al., 2007).
Supplementary Material
HIGHLIGHTS.
DiceCT was utilized to image lesions while preserving histologic validation.
Novel soaking technique in CCM murine model using micro-CT imaging.
CCM lesion burden identified on micro-CT images was verified with histology.
Micro-CT volumetric analysis of lesion burden correlated with histologic area.
Micro-CT can complement histology to optimize workflow and maximize information.
Acknowledgments
The authors are grateful to Ashley Morhardt, M.S. for her assistance with developing the sodium thiosulfate destaining protocol. This work was partially supported by NIH grants P01 NS092521-01 to IAA, DAM and MLK; T32 HD009007 to CO; R01HL094326 to MLK; T32HL07439 to ATT; the National Center for Advancing Translational Sciences UL1 TR000430 to the University of Chicago and the University of Chicago Medicine Comprehensive Cancer Center Support Grant P30 CA14599. Further partial support was from the William and Judith Davis Fund in Neurovascular Surgery Research to IAA, the Safadi Translational Fellowship to RG and funding from Biological Sciences Division of the University of Chicago to ZXL. The funding sources had no involvement in the study design; in the collection, analysis and interpretation of data; in the writing of the report; and in the decision to submit the article for publication.
ABBREVIATIONS
- CCM
cerebral cavernous malformation
- RBCs
red blood cells
- MRI
magnetic resonance imaging
- micro-CT
micro-computed tomography
- DiceCT
diffusible iodine-based contrast-enhanced computed tomography
- IACUC
Institutional Animal Care and Use Committee
- w/v
weight/volume
- CNC
computerized numerical control
- SNR
signal-to-noise ratio
- ROI
region of interest
Footnotes
Publisher's Disclaimer: This is a PDF file of an unedited manuscript that has been accepted for publication. As a service to our customers we are providing this early version of the manuscript. The manuscript will undergo copyediting, typesetting, and review of the resulting proof before it is published in its final citable form. Please note that during the production process errors may be discovered which could affect the content, and all legal disclaimers that apply to the journal pertain.
References
- Al-Shahi Salman R, Berg MJ, Morrison L, Awad IA Angioma Alliance Scientific Advisory B. Hemorrhage from cavernous malformations of the brain: Definition and reporting standards. Angioma alliance scientific advisory board. Stroke. 2008;39:3222–30. doi: 10.1161/STROKEAHA.108.515544. [DOI] [PubMed] [Google Scholar]
- Al-Shahi Salman R, Hall JM, Horne MA, Moultrie F, Josephson CB, Bhattacharya JJ, Counsell CE, Murray GD, Papanastassiou V, Ritchie V, Roberts RC, Sellar RJ, Warlow CP Scottish Audit of Intracranial Vascular Malformations collaborators. Untreated clinical course of cerebral cavernous malformations: A prospective, population-based cohort study. Lancet neurol. 2012;11:217–24. doi: 10.1016/S1474-4422(12)70004-2. [DOI] [PMC free article] [PubMed] [Google Scholar]
- Anderson R, Maga AM. A novel procedure for rapid imaging of adult mouse brains with microct using iodine-based contrast. PLoS One. 2015;10:e0142974. doi: 10.1371/journal.pone.0142974. [DOI] [PMC free article] [PubMed] [Google Scholar]
- Batra S, Lin D, Recinos PF, Zhang J, Rigamonti D. Cavernous malformations: Natural history, diagnosis and treatment. Nat Rev Neurol. 2009;5:659–70. doi: 10.1038/nrneurol.2009.177. [DOI] [PubMed] [Google Scholar]
- Bland JM, Altman DG. Measuring agreement in method comparison studies. Stat Methods Med Res. 1999;8:135–60. doi: 10.1177/096228029900800204. [DOI] [PubMed] [Google Scholar]
- Bland JM, Altman DG. Statistical methods for assessing agreement between two methods of clinical measurement. Lancet. 1986;1:307–10. [PubMed] [Google Scholar]
- Bougioukli S, Jain A, Sugiyama O, Tinsley BA, Tang AH, Tan MH, Adams DJ, Kostenuik PJ, Lieberman JR. Combination therapy with bmp-2 and a systemic rankl inhibitor enhances bone healing in a mouse critical-sized femoral defect. Bone. 2015;84:93–103. doi: 10.1016/j.bone.2015.12.052. [DOI] [PMC free article] [PubMed] [Google Scholar]
- Buades A, Coll B, Morel J-M. IEEE Computer Society Conference on Computer Vision and Pattern Recognition. IEEE; 2005. A non-local algorithm for image denoising; pp. 60–5. [Google Scholar]
- Choquet H, Pawlikowska L, Nelson J, McCulloch CE, Akers A, Baca B, Khan Y, Hart B, Morrison L, Kim H Brain Vascular Malformation Consortium S. Polymorphisms in inflammatory and immune response genes associated with cerebral cavernous malformation type 1 severity. Cerebrovasc Dis. 2014;38:433–40. doi: 10.1159/000369200. [DOI] [PMC free article] [PubMed] [Google Scholar]
- Cox PG, Jeffery N. Reviewing the morphology of the jaw-closing musculature in squirrels, rats, and guinea pigs with contrast-enhanced microct. Anat Rec (Hoboken) 2011;294:915–28. doi: 10.1002/ar.21381. [DOI] [PubMed] [Google Scholar]
- de Crespigny A, Bou-Reslan H, Nishimura MC, Phillips H, Carano RA, D’Arceuil HE. 3d micro-ct imaging of the postmortem brain. J Neurosci Methods. 2008;171:207–13. doi: 10.1016/j.jneumeth.2008.03.006. [DOI] [PMC free article] [PubMed] [Google Scholar]
- Degenhardt K, Wright AC, Horng D, Padmanabhan A, Epstein JA. Rapid 3d phenotyping of cardiovascular development in mouse embryos by micro-ct with iodine staining. Circ Cardiovasc Imaging. 2010;3:314–22. doi: 10.1161/CIRCIMAGING.109.918482. [DOI] [PMC free article] [PubMed] [Google Scholar]
- Dobrivojevic M, Bohacek I, Erjavec I, Gorup D, Gajovic S. Computed microtomography visualization and quantification of mouse ischemic brain lesion by nonionic radio contrast agents. Croat Med J. 2013;54:3–11. doi: 10.3325/cmj.2013.54.3. [DOI] [PMC free article] [PubMed] [Google Scholar]
- Engelhorn T, Eyupoglu IY, Schwarz MA, Karolczak M, Bruenner H, Struffert T, Kalender W, Doerfler A. In vivo micro-ct imaging of rat brain glioma: A comparison with 3t mri and histology. Neurosci Lett. 2009;458:28–31. doi: 10.1016/j.neulet.2009.04.033. [DOI] [PubMed] [Google Scholar]
- Ghanavati S, Yu LX, Lerch JP, Sled JG. A perfusion procedure for imaging of the mouse cerebral vasculature by x-ray micro-ct. J Neurosci Methods. 2014;221:70–7. doi: 10.1016/j.jneumeth.2013.09.002. [DOI] [PubMed] [Google Scholar]
- Gibson CC, Zhu W, Davis CT, Bowman-Kirigin JA, Chan AC, Ling J, Walker AE, Goitre L, Delle Monache S, Retta SF, Shiu YT, Grossmann AH, Thomas KR, Donato AJ, Lesniewski LA, Whitehead KJ, Li DY. Strategy for identifying repurposed drugs for the treatment of cerebral cavernous malformation. Circulation. 2015;131:289–99. doi: 10.1161/CIRCULATIONAHA.114.010403. [DOI] [PMC free article] [PubMed] [Google Scholar]
- Gignac PM, Kley NJ, Clarke JA, Colbert MW, Morhardt AC, Cerio D, Cost IN, Cox PG, Daza JD, Early CM, Echols MS, Henkelman RM, Herdina AN, Holliday CM, Li Z, Mahlow K, Merchant S, Muller J, Orsbon CP, Paluh DJ, Thies ML, Tsai HP, Witmer LM. Diffusible iodine-based contrast-enhanced computed tomography (dicect): An emerging tool for rapid, high-resolution, 3-d imaging of metazoan soft tissues. J Anat. 2016 doi: 10.1111/joa.12449. [DOI] [PMC free article] [PubMed] [Google Scholar]
- Hopkins TM, Heilman AM, Liggett JA, LaSance K, Little KJ, Hom DB, Minteer DM, Marra KG, Pixley SK. Combining micro-computed tomography with histology to analyze biomedical implants for peripheral nerve repair. J Neurosci Methods. 2015;255:122–30. doi: 10.1016/j.jneumeth.2015.08.016. [DOI] [PMC free article] [PubMed] [Google Scholar]
- Huesa C, Ortiz AC, Dunning L, McGavin L, Bennett L, McIntosh K, Crilly A, Kurowska-Stolarska M, Plevin R, van ‘t Hof RJ, Rowan AD, McInnes IB, Goodyear CS, Lockhart JC, Ferrell WR. Proteinase-activated receptor 2 modulates oa-related pain, cartilage and bone pathology. Ann Rheum Dis. 2015 doi: 10.1136/annrheumdis-2015-208268. [DOI] [PMC free article] [PubMed] [Google Scholar]
- Hunt RJ. Percent agreement, pearson’s correlation, and kappa as measures of inter-examiner reliability. J Dent Res. 1986;65:128–30. doi: 10.1177/00220345860650020701. [DOI] [PubMed] [Google Scholar]
- Jain RK, di Tomaso E, Duda DG, Loeffler JS, Sorensen AG, Batchelor TT. Angiogenesis in brain tumours. Nat Rev Neurosci. 2007;8:610–22. doi: 10.1038/nrn2175. [DOI] [PubMed] [Google Scholar]
- Jungner M, Siemund R, Venturoli D, Reinstrup P, Schalen W, Bentzer P. Blood-brain barrier permeability following traumatic brain injury. Minerva Anestesiol. 2015 [PubMed] [Google Scholar]
- Keller A, Westenberger A, Sobrido MJ, Garcia-Murias M, Domingo A, Sears RL, Lemos RR, Ordonez-Ugalde A, Nicolas G, da Cunha JE, Rushing EJ, Hugelshofer M, Wurnig MC, Kaech A, Reimann R, Lohmann K, Dobricic V, Carracedo A, Petrovic I, Miyasaki JM, Abakumova I, Mae MA, Raschperger E, Zatz M, Zschiedrich K, Klepper J, Spiteri E, Prieto JM, Navas I, Preuss M, Dering C, Jankovic M, Paucar M, Svenningsson P, Saliminejad K, Khorshid HR, Novakovic I, Aguzzi A, Boss A, Le Ber I, Defer G, Hannequin D, Kostic VS, Campion D, Geschwind DH, Coppola G, Betsholtz C, Klein C, Oliveira JR. Mutations in the gene encoding pdgf-b cause brain calcifications in humans and mice. Nat Genet. 2013;45:1077–82. doi: 10.1038/ng.2723. [DOI] [PubMed] [Google Scholar]
- Kerckhofs G, Sainz J, Marechal M, Wevers M, Van de Putte T, Geris L, Schrooten J. Contrast-enhanced nanofocus x-ray computed tomography allows virtual three-dimensional histopathology and morphometric analysis of osteoarthritis in small animal models. Cartilage. 2014;5:55–65. doi: 10.1177/1947603513501175. [DOI] [PMC free article] [PubMed] [Google Scholar]
- Kerckhofs G, Sainz J, Wevers M, Van de Putte T, Schrooten J. Contrast-enhanced nanofocus computed tomography images the cartilage subtissue architecture in three dimensions. Eur Cell Mater. 2013;25:179–89. doi: 10.22203/ecm.v025a13. [DOI] [PubMed] [Google Scholar]
- Kondziolka D, Monaco EA, 3rd, Lunsford LD. Cavernous malformations and hemorrhage risk. Prog Neurol Surg. 2013;27:141–6. doi: 10.1159/000341774. [DOI] [PubMed] [Google Scholar]
- Landis JR, Koch GG. The measurement of observer agreement for categorical data. Biometrics. 1977;33:159–74. [PubMed] [Google Scholar]
- Li DY, Whitehead KJ. Evaluating strategies for the treatment of cerebral cavernous malformations. Stroke. 2010;41:S92–4. doi: 10.1161/STROKEAHA.110.594929. [DOI] [PMC free article] [PubMed] [Google Scholar]
- Li Z, Clarke JA, Ketcham RA, Colbert MW, Yan F. An investigation of the efficacy and mechanism of contrast-enhanced x-ray computed tomography utilizing iodine for large specimens through experimental and simulation approaches. BMC physiology. 2015;15:5. doi: 10.1186/s12899-015-0019-3. [DOI] [PMC free article] [PubMed] [Google Scholar]
- Lin AJ, Liu G, Castello NA, Yeh JJ, Rahimian R, Lee G, Tsay V, Durkin AJ, Choi B, LaFerla FM, Chen Z, Green KN, Tromberg BJ. Optical imaging in an alzheimer’s mouse model reveals amyloid--dependent vascular impairment. Neurophotonics. 2014;1:011005. doi: 10.1117/1.NPh.1.1.011005. [DOI] [PMC free article] [PubMed] [Google Scholar]
- Louvi A, Chen L, Two AM, Zhang H, Min W, Gunel M. Loss of cerebral cavernous malformation 3 (ccm3) in neuroglia leads to ccm and vascular pathology. PNAS. 2011;108:3737–42. doi: 10.1073/pnas.1012617108. [DOI] [PMC free article] [PubMed] [Google Scholar]
- Maddaluno L, Rudini N, Cuttano R, Bravi L, Giampietro C, Corada M, Ferrarini L, Orsenigo F, Papa E, Boulday G, Tournier-Lasserve E, Chapon F, Richichi C, Retta SF, Lampugnani MG, Dejana E. Endmt contributes to the onset and progression of cerebral cavernous malformations. Nature. 2013;498:492–6. doi: 10.1038/nature12207. [DOI] [PubMed] [Google Scholar]
- Magnotta VA, Friedman L, First B. Measurement of signal-to-noise and contrast-to-noise in the fbirn multicenter imaging study. J Digit Imaging. 2006;19:140–7. doi: 10.1007/s10278-006-0264-x. [DOI] [PMC free article] [PubMed] [Google Scholar]
- McCollough CH, Primak AN, Braun N, Kofler J, Yu L, Christner J. Strategies for reducing radiation dose in ct. Radiol Clin North Am. 2009;47:27–40. doi: 10.1016/j.rcl.2008.10.006. [DOI] [PMC free article] [PubMed] [Google Scholar]
- McDonald DA, Shenkar R, Shi C, Stockton RA, Akers AL, Kucherlapati MH, Kucherlapati R, Brainer J, Ginsberg MH, Awad IA, Marchuk DA. A novel mouse model of cerebral cavernous malformations based on the two-hit mutation hypothesis recapitulates the human disease. Hum Mol Genet. 2011;20:211–22. doi: 10.1093/hmg/ddq433. [DOI] [PMC free article] [PubMed] [Google Scholar]
- McDonald DA, Shi C, Shenkar R, Stockton RA, Liu F, Ginsberg MH, Marchuk DA, Awad IA. Fasudil decreases lesion burden in a murine model of cerebral cavernous malformation disease. Stroke. 2012;43:571–4. doi: 10.1161/STROKEAHA.111.625467. [DOI] [PMC free article] [PubMed] [Google Scholar]
- McHugh ML. Interrater reliability: The kappa statistic. Biochem Med (Zagreb) 2012;22:276–82. [PMC free article] [PubMed] [Google Scholar]
- Metscher BD. Microct for comparative morphology: Simple staining methods allow high-contrast 3d imaging of diverse non-mineralized animal tissues. BMC Physiology. 2009a;9:11. doi: 10.1186/1472-6793-9-11. [DOI] [PMC free article] [PubMed] [Google Scholar]
- Metscher BD. Microct for developmental biology: A versatile tool for high-contrast 3d imaging at histological resolutions. Dev Dyn. 2009b;238:632–40. doi: 10.1002/dvdy.21857. [DOI] [PubMed] [Google Scholar]
- Mikati AG, Khanna O, Zhang L, Girard R, Shenkar R, Guo X, Shah A, Larsson HB, Tan H, Li L, Wishnoff MS, Shi C, Christoforidis GA, Awad IA. Vascular permeability in cerebral cavernous malformations. J Cereb Blood Flow Metab. 2015;35:1632–9. doi: 10.1038/jcbfm.2015.98. [DOI] [PMC free article] [PubMed] [Google Scholar]
- Mikula S, Denk W. High-resolution whole-brain staining for electron microscopic circuit reconstruction. Nat Methods. 2015;12:541–6. doi: 10.1038/nmeth.3361. [DOI] [PubMed] [Google Scholar]
- Moses SW, Bashan N, Gutman A. Glycogen metabolism in the normal red blood cell. Blood. 1972;40:836–43. [PubMed] [Google Scholar]
- Nakayama Y, Awai K, Funama Y, Hatemura M, Imuta M, Nakaura T, Ryu D, Morishita S, Sultana S, Sato N, Yamashita Y. Abdominal ct with low tube voltage: Preliminary observations about radiation dose, contrast enhancement, image quality, and noise. Radiology. 2005;237:945–51. doi: 10.1148/radiol.2373041655. [DOI] [PubMed] [Google Scholar]
- Park JY, Lee SK, Kim JY, Je KH, Schellingerhout D, Kim DE. A new micro-computed tomography-based high-resolution blood-brain barrier imaging technique to study ischemic stroke. Stroke. 2014;45:2480–4. doi: 10.1161/STROKEAHA.114.006297. [DOI] [PubMed] [Google Scholar]
- Peli E. Contrast in complex images. J Opt Soc Am A Opt Image Sci Vis. 1990;7:2032–40. doi: 10.1364/josaa.7.002032. [DOI] [PubMed] [Google Scholar]
- Rigby AS. Statistical methods in epidemiology. V. Towards an understanding of the kappa coefficient. Disabil Rehabil. 2000;22:339–44. doi: 10.1080/096382800296575. [DOI] [PubMed] [Google Scholar]
- Rusckowski M, Wang Y, Blankenberg FG, Levashova Z, Backer MV, Backer JM. Targeted scvegf/(177)lu radiopharmaceutical inhibits growth of metastases and can be effectively combined with chemotherapy. EJNMMI Research. 2016;6:4. doi: 10.1186/s13550-016-0163-1. [DOI] [PMC free article] [PubMed] [Google Scholar]
- Saito S, Mori Y, Yoshioka Y, Murase K. High-resolution ex vivo imaging in mouse spinal cord using micro-ct with 11.7t-mri and myelin staining validation. Neurosci Res. 2012;73:337–40. doi: 10.1016/j.neures.2012.05.004. [DOI] [PubMed] [Google Scholar]
- Saito S, Murase K. Ex vivo imaging of mouse brain using micro-ct with non-ionic iodinated contrast agent: A comparison with myelin staining. Br J Radiol. 2012;85:e973–8. doi: 10.1259/bjr/13040401. [DOI] [PMC free article] [PubMed] [Google Scholar]
- Sayama CM, Osborn AG, Chin SS, Couldwell WT. Capillary telangiectasias: Clinical, radiographic, and histopathological features. Clinical article J Neurosurg. 2010;113:709–14. doi: 10.3171/2009.9.JNS09282. [DOI] [PubMed] [Google Scholar]
- Schambach SJ, Bag S, Groden C, Schilling L, Brockmann MA. Vascular imaging in small rodents using micro-ct. Methods. 2010a;50:26–35. doi: 10.1016/j.ymeth.2009.09.003. [DOI] [PubMed] [Google Scholar]
- Schambach SJ, Bag S, Schilling L, Groden C, Brockmann MA. Application of micro-ct in small animal imaging. Methods. 2010b;50:2–13. doi: 10.1016/j.ymeth.2009.08.007. [DOI] [PubMed] [Google Scholar]
- Shenkar R, Shi C, Rebeiz T, Stockton RA, McDonald DA, Mikati AG, Zhang L, Austin C, Akers AL, Gallione CJ, Rorrer A, Gunel M, Min W, Marcondes de Souza J, Lee C, Marchuk DA, Awad IA. Exceptional aggressiveness of cerebral cavernous malformation disease associated with pdcd10 mutations. Genet Med. 2015;17:188–96. doi: 10.1038/gim.2014.97. [DOI] [PMC free article] [PubMed] [Google Scholar]
- Shenkar R, Venkatasubramanian PN, Wyrwicz AM, Zhao JC, Shi C, Akers A, Marchuk DA, Awad IA. Advanced magnetic resonance imaging of cerebral cavernous malformations: Part ii. Imaging of lesions in murine models. Neurosurgery. 2008;63:790–8. doi: 10.1227/01.NEU.0000315862.24920.49. [DOI] [PMC free article] [PubMed] [Google Scholar]
- Sim J, Wright CC. The kappa statistic in reliability studies: Use, interpretation, and sample size requirements. Phys Ther. 2005;85:257–68. [PubMed] [Google Scholar]
- Srinivasan VJ, Yu E, Radhakrishnan H, Can A, Climov M, Leahy C, Ayata C, Eikermann-Haerter K. Micro-heterogeneity of flow in a mouse model of chronic cerebral hypoperfusion revealed by longitudinal doppler optical coherence tomography and angiography. J Cereb Blood Flow Metab. 2015;35:1552–60. doi: 10.1038/jcbfm.2015.175. [DOI] [PMC free article] [PubMed] [Google Scholar]
- Starosolski Z, Villamizar CA, Rendon D, Paldino MJ, Milewicz DM, Ghaghada KB, Annapragada AV. Ultra high-resolution in vivo computed tomography imaging of mouse cerebrovasculature using a long circulating blood pool contrast agent. Sci Rep. 2015;5:10178. doi: 10.1038/srep10178. [DOI] [PMC free article] [PubMed] [Google Scholar]
- Valverde F. Golgi atlas of the postnatal mouse brain. Springer Vienna; Vienna: 1998. Material and methods; pp. 3–7. [Google Scholar]
- Vernooij MW, Ikram MA, Tanghe HL, Vincent AJ, Hofman A, Krestin GP, Niessen WJ, Breteler MM, van der Lugt A. Incidental findings on brain mri in the general population. N Engl J Med. 2007;357:1821–8. doi: 10.1056/NEJMoa070972. [DOI] [PubMed] [Google Scholar]
- Viswanathan A, Chabriat H. Cerebral microhemorrhage. Stroke. 2006;37:550–5. doi: 10.1161/01.STR.0000199847.96188.12. [DOI] [PubMed] [Google Scholar]
- Wang MY, Cheng JL, Han YH, Li YL, Dai JP, Shi DP. Measurement of tumor size in adult glioblastoma: Classical cross-sectional criteria on 2d mri or volumetric criteria on high resolution 3d mri? Eur J Radiol. 2012;81:2370–4. doi: 10.1016/j.ejrad.2011.05.017. [DOI] [PubMed] [Google Scholar]
- White DL, Andrews SB, Faller JW, Barrnett RJ. The chemical nature of osmium tetroxide fixation and staining of membranes by x-ray photoelectron spectroscopy. Biochim Biophys Acta. 1976;436:577–92. doi: 10.1016/0005-2736(76)90442-9. [DOI] [PubMed] [Google Scholar]
- Whitehead KJ, Chan AC, Navankasattusas S, Koh W, London NR, Ling J, Mayo AH, Drakos SG, Jones CA, Zhu W, Marchuk DA, Davis GE, Li DY. The cerebral cavernous malformation signaling pathway promotes vascular integrity via rho gtpases. Nat Med. 2009;15:177–84. doi: 10.1038/nm.1911. [DOI] [PMC free article] [PubMed] [Google Scholar]
- Wong MD, Spring S, Henkelman RM. Structural stabilization of tissue for embryo phenotyping using micro-ct with iodine staining. PLoS One. 2013;8:e84321. doi: 10.1371/journal.pone.0084321. [DOI] [PMC free article] [PubMed] [Google Scholar]
- Xu W, Mueller K. Nuclear Science Symposium Conference Record (NSS/MIC), 2010 IEEE. IEEE; 2010. Evaluating popular non-linear image processing filters for their use in regularized iterative ct; pp. 2864–5. [Google Scholar]
- Zhou Z, Rawnsley DR, Goddard LM, Pan W, Cao XJ, Jakus Z, Zheng H, Yang J, Arthur JS, Whitehead KJ, Li D, Zhou B, Garcia BA, Zheng X, Kahn ML. The cerebral cavernous malformation pathway controls cardiac development via regulation of endocardial mekk3 signaling and klf expression. Dev Cell. 2015;32:168–80. doi: 10.1016/j.devcel.2014.12.009. [DOI] [PMC free article] [PubMed] [Google Scholar]
- Zhou Z, Tang AT, Wong WY, Bamezai S, Goddard LM, Shenkar R, Zhou S, Yang J, Wright AC, Foley M, Arthur JS, Whitehead KJ, Awad IA, Li DY, Zheng X, Kahn ML. Cerebral cavernous malformations arise from endothelial gain of mekk3-klf2/4 signalling. Nature. 2016 doi: 10.1038/nature17178. [DOI] [PMC free article] [PubMed] [Google Scholar]
Associated Data
This section collects any data citations, data availability statements, or supplementary materials included in this article.