

Abstract
Objective
Exercise and diet impact body composition, but their age-related brain effects are unclear at the molecular imaging level. To address these issues, we determined whether body mass index (BMI), physical activity, and diet relate to brain positron emission tomography (PET) of amyloid plaques and tau tangles using 2-(1-(6-[(2-[F-18]fluoroethyl)(methyl)amino]-2-naphthyl)ethylidene)malononitrile (FDDNP).
Methods
Volunteers (n = 44, mean age = 62.6 ± 10.7 years) with subjective memory impairment (n = 24) or mild cognitive impairment (MCI; n = 20) were recruited by soliciting for memory complaints. Levels of physical activity and extent of following a Mediterranean-type diet were self-reported. FDDNP-PET scans assessed plaque/tangle binding in Alzheimer’s disease (AD)-associated regions (frontal, parietal, medial and lateral temporal, posterior cingulate). Mixed models controlling for known covariates examined BMI, physical activity, and diet in relation to FDDNP-PET.
Results
MCI subjects with above normal BMI (>25) had higher FDDNP-PET binding compared to those with normal BMI (1.11(.03) vs 1.08(.03), ES=1.04, t(35)=3.3, p=.002). Greater physical activity was associated with lower FDDNP-PET binding in MCI subjects (1.07(.03) vs 1.11(.03), ES=1.13, t(35) =−3.1, p=.004) but not in subjects with subjective memory impairment (1.07 (.03) vs 1.07(.03), ES=.02, t(35)=−0.1, p=.9). Healthier diet related to lower FDDNP-PET binding, regardless of cognitive status (1.07(.03) vs 1.09(.02), ES=0.72, t(35)=−2.1, p = .04).
Conclusion and Relevance
These preliminary findings are consistent with a relationship between risk modifiers and brain plaque/tangle deposition in non-demented individuals and supports maintenance of normal body weight, regular physical activity, and healthy diet adherence to protect the brain during aging.
Keywords: Alzheimer’s disease, Exercise, PET
OBJECTIVE
The Alzheimer’s Association estimates that 5.2 million Americans currently suffer from Alzheimer’s disease (AD) and related dementias at a total healthcare cost of over $200 billion per year (1). By 2050, AD cases in the U.S. are expected to rise to 13.8 million at an annual cost of $1.2 trillion (in 2014 dollars). Previous estimates indicate that up to half of AD cases are attributable to modifiable dementia risk factors (low educational achievement, smoking, physical inactivity, depression, hypertension, diabetes, and obesity) and that a 10–25% reduction of these risks could potentially prevent nearly 500,000 cases in the U.S. and 1–3 million cases worldwide (2). To support efforts of such modifiable risk factor reduction, there is a growing interest in establishing the extent to which lifestyle factors impact AD pathology in pre-dementia states (3, 4).
Increasing evidence supports the hypothesis that physical activity improves brain health through modifications in brain structure and function. When laboratory animals exercise regularly they acquire new neurons in the hippocampus, which then form functional connections with other brain cells (5). Physical activity may also increase cerebral blood flow, which in turn promotes nerve cell growth and expression of the plasticity molecule brain derived neurotrophic factor (6). Neuropsychological examinations of healthy adults ages 60 to 75 found that involvement in an aerobic exercise program improved performance on mental tasks involved in frontal lobe function (monitoring, scheduling, planning, inhibition, and memory) when compared to a control group (7). Aerobic exercise and regular physical activity have also more recently been shown to increase total hippocampal volume and relate to superior spatial memory in older adults (8, 9).
Similar to exercise, the contribution of a healthy diet relating to normal BMI over time is well established. Moreover, healthy diet and lower dementia risk has been documented in prior work, though not specifically with PET imaging of AD neuropathology. For example, adherence to a Mediterranean-type diet reduced cognitive decline, especially with exercise, in several large cohort studies (10, 11). In these studies, a Mediterranean-type diet in U.S. populations has been defined as containing higher than average amounts of beneficial dietary components (fruits, vegetables, legumes, cereals, and fish), lower than average detrimental components (meat and dairy), a ratio of monounsaturated fats to saturated fats above the median, and mild to moderate alcohol consumption (>0 to <30 grams/day). Previous work suggests that specific components of a Mediterranean-type diet that add to reduced risk for AD include the antioxidant and/or anti-inflammatory actions of monounsaturated fatty acids, olive oil, red wine, and fish (12).
In middle-aged and older adults, obesity has been associated with increased risk of cognitive decline and conversion to dementia (13–16). Body Mass Index (BMI), a measure of human body shape based on an individual’s weight and height (kg/m2), is thought to reflect how much an individual’s body weight departs from what is normal for a particular height. BMI is used in a wide variety of contexts as a simple method to assess body composition, adiposity, and as a proxy for health-related behaviors such as physical exercise and diet (17). Though not all experts agree, the most widely adopted upper limit of normal for BMI is 25 (18).
Magnetic resonance imaging (MRI) studies relating BMI to brain structure have found that obesity is linked to lower brain volume in subjects diagnosed with MCI and AD (19). Similar results have been found for cognitively normal older adults, who demonstrate selective patterns of gray and white matter atrophy that include memory relevant areas (e.g., frontal and temporal lobes) (20). An arterial spin labeling technique established that increased BMI selectively relates to decreased cerebral blood flow in frontal but not parietal or global grey matter of older adults (21).
Data relating BMI to AD neuropathology is limited. A small neuropathology report that focused on obese, cognitively intact, older adults demonstrated significant increases in brain deposition of amyloid-β plaques and tau-neurofibrillary tangles at autopsy (22). By contrast, in vivo positron emission tomography (PET) using the amyloid plaque PET-ligand Pittsburgh Compound B (PiB) found an inverse relationship with higher BMI associated with lower PiB-PET signal in both demented and non-demented subjects (23, 24). To date, there is no PET data relating tau tangles to BMI in non-demented adult subjects with memory loss.
Here we examine how BMI, level of physical activity, and degree of following a healthy Mediterranean-type diet are associated with a PET ligand that binds to and provides a measure of both amyloid and tau, namely 2-(1-(6-[(2-[F-18]fluoroethyl)(methyl)amino]-2-naphthyl)ethylidene)malononitrile (FDDNP). Global and regional (e.g., frontal, temporal, parietal) FDDNP-PET binding levels have previously been shown to correlate with mood and cognitive function in older adults (25–27) and to predict cognitive decline (28). FDDNP-PET binding, however, has not been analyzed in relation to these modifiable risk factors. In the present study, our objective was to assess the extent to which BMI, physical activity, and adherence to a Mediterranean-type diet relate to combined levels of plaques and tangles as measured by FDDNP-PET in a sample of community dwelling non-demented middle-aged and older adults with memory complaints.
DESIGN AND METHODS
Participants
A total of 44 non-demented subjects (mean age = 62.6 ± 10.7 years, range 40–85 years) underwent FDDNP-PET scans, neuropsychological testing, and BMI assessment and were drawn from a larger, longitudinal study of predictors of cognitive decline described elsewhere in detail (27, 29). Briefly, volunteers were recruited through advertisements, media coverage, and referrals from physicians and families. Subjects received neurological and psychiatric evaluations, routine screening laboratory tests for reversible causes of memory loss (e.g., TSH, Vitamin B-12 level), and 3-dimensional magnetic resonance imaging (MRI) or computed tomography (CT) to rule out other causes of cognitive impairment (e.g., tumor or stroke) or potential cognitive confounding factors (e.g., severe sensory deficits or medication interactions). Subjects with reversible causes of memory loss and/or evidence of stroke on MRI or CT were excluded from the study. All subjects were proficient in English and underwent comprehensive clinical and cognitive assessment to characterize cognitive status. All clinical assessments were performed blinded to the results of FDDNP-PET scans. Written informed consent was obtained in accordance with the approved University of California, Los Angeles institutional review board protocol. Cumulative radiation dosimeter levels for all scans were below the mandated maximum annual dose and in compliance with state and federal regulations.
Clinical and Neuropsychological Assessment
The clinical examination for volunteers included a psychiatric and medical history, physical exam (including measurement of BMI), mental status exam, and comprehensive neuropsychological testing. The neuropsychological test battery was administered to quantify cognitive performance and to confirm the diagnostic category of each study subject – subjective memory impairment, MCI, or dementia. Subjects were categorized as having subjective memory impairment if they had subjective memory complaints but neither objective deficits on neuropsychological test measures after correction for age and education nor functional deficits in daily functioning. We used the following diagnostic criteria for MCI: (1) patient awareness of a memory problem, preferably confirmed by another person such as a family member; (2) cognitive impairment detected with standardized assessment tests; and (3) ability to perform normal daily activities (30). To increase specificity for detecting impairment, we included subjects who scored less than one standard deviation below the mean on at least two tests and whose diagnosis was corroborated by clinical assessment (31). Because the current study focused only on non-demented persons, subjects with deficits on neuropsychological testing and functional deficits meeting DSM-IV TR criteria for dementia were excluded from the analysis. The Hamilton Rating Scales for both Depression and Anxiety were administered to assess mood and anxiety, respectively. Subjects meeting DSM-IV TR criteria for depression or anxiety disorders were excluded.
Physical Activity, Mediterranean-Type Diet, and BMI Assessments
Level of physical activity was determined using the International Physical Activity Questionnaire modified for older adults (IPAQ-E) and subjects were dichotomized into either “higher” or “lower” activity groups using a standard metabolic equivalent (MET) cutoff of 600 MET-min/week (32, 33). Adherence to a Mediterranean-type diet was assessed using a previously validated single-item response method (34). Using a 5-point Likert scale (never, not often, sometimes, often, all the time), subjects reported the extent to which they follow a healthy Mediterranean-type diet (for example, a diet with rich in fruits and vegetables, fish or shellfish twice weekly, olive oil, and moderate amounts of red wine). Subjects were dichotomized into adherence groups of either “rarely” (never, not often, sometimes) or “often” (often, all the time); further sub-grouping of Mediterranean-type diet adherence was not attempted due to the relatively small study sample size. BMI greater than 25 was used as an indication of being overweight or obese. Of the 44 individuals in the study, 24 subjects had BMI within a normal range (mean BMI 22.4 (SD=2.0)) and 20 subjects had above normal BMI (mean BMI 29.7 (4.4)). Of the 20 above normal BMI individuals, five had BMI greater than 30 (the most commonly used cut-off for obesity), hence we did not consider obese subjects separately from overweight subjects.
Imaging
Imaging AD neuropathology with FDDNP-PET imaging is fully described in prior work (35). Briefly, FDDNP was prepared at very high specific activities (>37 GBq/mol). All scans were performed with the ECAT HR or EXACT HR+ tomograph (Siemens-CTI, Knoxville, TN) with subjects supine and the imaging plane parallel to the orbito-meatal line. A bolus of FDDNP (320 – 550 MBq) was administered intravenously and consecutive dynamic PET scans were performed for two hours. Scans were decay corrected and reconstructed using filtered back-projection (Hann filter, 5.5 mm FWHM) with scatter and measured attenuation correction. The resulting images contained 47 contiguous slices with plane separation of 3.37 mm (ECAT HR) or 63 contiguous slices with plane separation of 2.42 mm (EXACT HR+).
To quantify FDDNP binding, Logan graphical analysis was performed with cerebellum as the reference region for time points between 30 and 125 minutes (36). The slope of the linear portion of the Logan plot is the relative distribution volume (DVR), which is equal to the distribution volume of the tracer in a region of interest (ROI) divided by that in the reference region. DVR parametric images were generated and analyzed using ROIs drawn manually on the co-registered MRI scans, or on an image obtained in the first 5 minutes after injection (perfusion image), bilaterally on parietal, medial temporal (limbic regions, including hippocampus, parahippocampal areas, and entorhinal cortex), lateral temporal, posterior cingulate, parietal and frontal regions. Each regional DVR or binding value was expressed as an average of left and right regions. Rules for region of interest drawing were based on the standard identification of gyral and sulcal landmarks with respect to the atlas of Talairach and Tournoux. The atlas provided a visual guide and reference for identifying the important landmarks needed in delineating the ROI. ROI determinations were performed by individuals blinded to the clinical assessments.
Anatomical brain MRI scans were obtained using a 3-Tesla magnet (General Electric-Signa, Milwaukee, WI) scanner. Fifty-four transverse planes were collected throughout the brain, superior to the cerebellum, using a double-echo, fast-spin echo series with a 24-cm field of view and 256 × 256 matrix with 3 mm/0 gap (TR = 6000 [3T] and 2000 [1.5T]; TE = 17/85 [3T] and 30/90 [1.5T]). MRI scans were co-registered to PET scans for the following brain regions: medial and lateral temporal, posterior cingulate, parietal, and frontal regions.
Data Analysis
Data were initially screened for outliers and normality assumptions. Demographic and clinical characteristics were compared between the two cognitive groups (subjective memory impairment vs. MCI) using t-tests and chi-square statistics. Imaging characteristics were compared between subjective memory impairment and MCI groups using a mixed model using regional FDDNP-PET binding levels as dependent variables, region as the within-subject factor and cognitive group as the independent variable. We also examined all pair-wise associations between BMI, physical activity and diet groups using chi-square tests and found that none of these were significant (BMI-physical activity groups: χ2(1) = .43, p =.51; BMI-diet groups: χ2(1) = .51, p = .47; physical activity-diet groups: χ2(1) = .0, p = .95). In addition, we compared the continuous BMI values for the two physical activity groups (higher: 25.7(3.6) vs. lower: 25.9(5.5); t(42) = 0.14, p = 0.9) as well as the two Mediterranean-type diet groups (often: 25.4 (5.7) vs. rarely: 26.2(3.7); t(42) = 0.53, p = 0.6). Thus, BMI, physical activity and diet groups were not confounded with each other in this sample of subjects.
Mixed models were then estimated to determine whether BMI (normal vs. above normal BMI), physical activity (lower vs. higher), and adherence to Mediterranean-type diet (rarely vs. often) were related to FDDNP-PET binding levels, and whether the associations differed for the two cognitive groups (subjective memory impairment vs. MCI). Regional FDDNP-PET binding values were used as dependent variables with region as the within-subject factor; BMI, physical activity, and diet groups were used as independent (between-subject) variables. Interaction terms of cognitive group with each of the above independent variables were also included in the model and retained in the final model if significant. The effects of age, sex, educational level and E4 status (E4 carrier or not) were all initially included as covariates, but only age was retained in the final model since the others variables were not statistically significant. We also explored including the interaction terms of age by BMI group and region by BMI group in the mixed model estimations. A significance level of 0.05 was used for all inferences. In addition to the standard statistics, effect size (ES) estimates (Cohen’s d for group differences and correlation coefficients) are also presented.
RESULTS
Demographic and clinical characteristics of the two cognitive groups indicated that the subjective memory impairment and MCI groups did not differ in any of the variables except the MMSE score (t(42) = −2.7, p = .01; Table 1). BMI, physical activity and Mediterranean-type diet measures, as well as the regional FDDNP-PET binding levels for the two cognitive groups, are shown in Table 2. The BMI, physical activity and Mediterranean-type diet measures were comparable between the subjective memory impairment and MCI groups, but the regional brain FDDNP-PET binding levels for MCI subjects were significantly higher than those for the subjective memory impairment group (F(1,42) = 5.73, p = .02), consistent with our previous results (Table 2) (29).
Table 1.
Demographic and clinical characteristics
| MCI (n=20) |
SMI (n=24) |
|
|---|---|---|
| Age | 62.0 (9.8) | 63.1 (11.6) |
| Female | 65.0% | 66.7% |
| Caucasian | 80.0% | 95.8% |
| Education | 16.6 (3.2) | 16.8 (3.0) |
| APOE-4 | 55.0% | 33.3% |
| MMSE# | 28.9 (1.0) | 29.5 (0.6) |
| HAM-D | 1.3 (2.0) | 2.2 (3.0) |
| HAM-A | 3.0 (2.4) | 4.0 (3.7) |
Figures indicate mean with standard deviation (SD) or percentage of subjects (%).
Abbreviations: MCI = Mild Cognitive Impairment; APOE-4 = Apolipoprotein E-4; Education = years of education; HAM-A = Hamilton Anxiety Inventory; HAM-D = Hamilton Depression Scale; MMSE = Mini-Mental Status Exam; SMI = Subjective Memory Impairment.
MCI and SMI groups significantly different in MMSE: t(42) = −2.7, p = .01.
Table 2.
Lifestyle and imaging characteristics
| MCI (n=20) |
SMI (n=24) |
|
|---|---|---|
|
| ||
| BMI | 25.6 (5.5) | 25.9 (4.5) |
| BMI groups | ||
| Normal (BMI ≤25) | 63.2% | 45.8% |
| Above normal (BMI >25) | 36.8% | 54.2% |
|
| ||
| IPAQ-E groups | ||
| Higher | 30.0% | 41.7% |
| Lower | 70.0% | 58.3% |
|
| ||
| Mediterranean-type diet | ||
| Often | 55.0% | 58.3% |
| Rarely | 45.0% | 41.7% |
|
| ||
| FDDNP-PET binding levels# | ||
| Medial temporal | 1.12 (.05) | 1.11 (.04) |
| Lateral temporal | 1.10 (.04) | 1.08 (.04) |
| Parietal | 1.09 (.05) | 1.07 (.03) |
| Posterior Cingulate | 1.10 (.06) | 1.10 (.04) |
| Frontal | 1.05 (.04) | 1.04 (.03) |
Figures indicate mean with standard deviation (SD) or percentage of subjects (%).
Abbreviations: MCI = Mild Cognitive Impairment; BMI = Body Mass Index; IPAQ-E = International Physical Activity Scale for Elderly; FDDNP: 2-(1-(6-[(2-[F18]fluoroethyl)(methyl)amino]-2-naphthyl)ethylidene)malononitrile; PET: positron emission tomography.
MCI and SMI groups significantly different in FDDNP-PET binding levels: F(1.42) = 5.73, p = .02.
The initial model included the independent variables of BMI group (‘normal BMI’ vs. ‘above normal BMI’), physical activity (‘higher’ vs. ‘lower’), diet (current level of adherence to a Mediterranean-type diet, grouped as ‘often’ vs. ‘rarely’), cognitive status (subjective memory impairment vs. MCI) and the interaction terms of each of the first three measures with cognitive status. Only the interaction terms of BMI and physical activity with cognitive status were statistically significant. Consequently, the interaction term of Mediterranean-type diet and cognitive status (F(1,34) = 0.1, p = .7) was excluded. The final model thus included, in addition to age and cognitive status, BMI group, physical activity group, Mediterranean-type diet group (F(1,35) = 4.6, p = .04), and the interaction of BMI and physical activity with cognitive status (BMI interaction: (F(1,35) = 5.6, p = .02; physical activity interaction: F(1,35) = 5.7, p = .02).
Degree of Mediterranean-type diet adherence was associated with global FDDNP-PET brain binding, regardless of cognitive status (1.07(.03) vs. 1.09(.02), ES = 0.72, t(35)=−2.1, p = .04) (Figure 1A). Higher levels of current physical activity were associated with lower levels of FDDNP-PET binding in MCI (1.07(.03) vs. 1.11(.03), ES = 1.13, t(35) = −3.1, p = .004) but not in subjective memory impairment (1.07 (.03) vs. 1.07(.03), ES = .02, t(35) = −0.1, p = .9) (Figure 1B). MCI individuals with above normal BMI had significantly higher FDDNP-PET binding levels compared to MCI subjects with normal BMI (1.11(.03) vs. 1.08(.03), ES =1.04, t(35) = 3.3, p = .002) but this effect was not observed in the subjective memory impairment group (1.08(.03) vs. 1.08(.03), ES = .08, t(35) = −0.2, p = .8) (Figure 1C).
Figure 1. Relation of FDDNP-PET Binding Levels to Diet, Physical Activity, and Body Mass Index Groups.
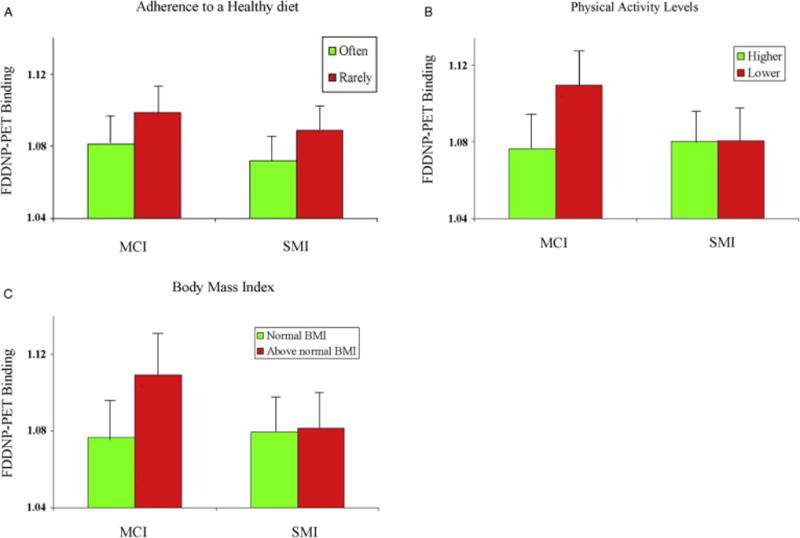
Histograms represent mean FDDNP-PET binding levels (with standard deviation bars) in relation to lifestyle measures in MCI and subjective memory impairment groups. Lower FDDNP-PET binding was present in both MCI and subjective memory impairment subjects adhering ‘often’ to a healthy diet (A) when compared to those ‘rarely’ adherent to a healthy diet. In contrast, MCI but not subjective memory impairment subjects differed in FDDNP-PET binding levels based on categorization of both higher vs. lower physical activity levels (B) and normal BMI vs. above normal BMI status (C).
Abbreviations: MCI: mild cognitive impairment; FDDNP: 2-(1-(6-[(2-[F18]fluoroethyl)(methyl)amino]-2-naphthyl)ethylidene)malononitrile; PET: positron emission tomography; SMI: subjective memory impairment.
DISCUSSION
To our knowledge this is the first report to determine the relationship of BMI, physical activity, and diet to in vivo brain plaque and tangle levels as measured by FDDNP-PET in non-demented middle-aged older adults. We found moderate but significant associations between these three factors and FDDNP-PET binding levels. MCI volunteers who engaged in more physical activity, and were of normal BMI had lower FDDNP binding levels than MCI subjects who reported being less active and who had above normal BMI. Adherence to a healthy diet was associated with lower FDDNP-PET binding levels across all participants. These findings are consistent with those derived from other imaging and non-imaging studies that lifestyle behaviors affecting BMI influence AD and related dementia risk, and multifactorial health strategies might delay onset of AD symptoms. Successful medical and lifestyle-based efforts to treat overweight and obese individuals in order to normalize body composition could result in lower levels of AD neuropathology in pre-dementia states, thus, decreasing risk of developing subsequent dementia.
Our finding that higher BMI values were associated with high FDDNP binding values is consistent with other studies indicating a link between being overweight or obese and neurodegeneration. Prior work from the Cardiovascular Health Study and the Alzheimer’s Disease Neuroimaging Initiative indicates that being overweight or obese are independent predictors of brain atrophy (19, 20). Both being overweight and obesity at midlife independently increase risk for dementia, AD, and vascular dementia (16), and a higher BMI in mid-life has been shown to be associated with greater cognitive decline after 5 years (37). Our finding of increased AD neuropathology with higher BMI in pre-dementia states is in agreement with the limited available neuropathology data (22).
Lifestyle strategies to normalize BMI over time have been shown to impact memory and brain health. Physical exercise is a well-established component of lifestyle programs geared towards normalizing BMI, and multiple studies have demonstrated the potential brain effects of normalizing body composition via increased physical activity. In a seminal work, neuropsychological examinations of healthy adults ages 60 to 75 found that involvement in an aerobic exercise program improved performance on mental tasks involved in frontal lobe function (monitoring, scheduling, planning, inhibition, and memory) when compared to a control group (7). Aerobic fitness also predicts hippocampal volume with aging (8) and increased exercise can reverse volume loss and improve memory (9).
Advantages of this study include application of an AD neuropathology specific imaging tracer to a well-characterized cohort with BMI, physical activity, and dietary measures to assess health related lifestyle habits. The modeling of interactions and inclusion of covariates further ensured the statistical rigor needed to draw the observed association between lifestyle factors and plaque and tangle binding levels.
However, this preliminary study has several limitations. Although we found the predicted, statistically significant associations between modifiable risk factors and brain amyloid and tau binding levels, the magnitude of these differences were modest. Several factors could have contributed to these modest findings. First, this study included a small sample size of subjects with relatively mild cognitive symptoms. A larger sample with older (age > 65) cognitively normal subjects and more advanced cognitive symptoms might have yielded more robust group differences. Second, our weight-related results are based upon BMI. Some individuals with greater than average lean body mass but normal adiposity levels can have a high BMI despite being at a healthy weight. Others may have a normal BMI despite having greater than average body fat from central obesity (38). Despite such exceptions, BMI has been widely used as a measure associated with overweight and obesity, including investigations of non-demented middle-aged and older adults, particularly in the epidemiologic literature and has been shown to be a consistent predictor of obesity-related medical conditions (39). Third, diet and physical activity assessments were based on self-reports. While this approach is commonly used in multiple studies of non-demented middle-aged and older adults, particularly in the epidemiologic literature, future work may benefit from relating more objective physiologic measures such as waist circumference and those derived from tests of maximal aerobic capacity, accelerometer data, or structured longitudinal dietary assessment. Also, it should be noted that while we demonstrate statistically significant associations, our data do not prove causal relationships between body composition and AD neuropathology measured with molecular imaging.
Taken together with prior literature, these findings are consistent with the hypothesis that some modifiable risk factors are associated with in vivo brain measures of amyloid and tau. Given that body composition and lifestyle factors are interrelated, increased adherence to one factor may promote adoption of additional healthy lifestyle activities. A recent large representative survey of 18,552 respondents across the United States suggested that engaging in more than one healthy lifestyle behavior reduced the likelihood of experiencing memory difficulties in a dose-dependent manner: the greater number of healthy behaviors reported, the less likely respondents were to report memory problems (40). Such results suggest that summation of effects from multiple lifestyle factors may promote a lower risk for AD than application of any one factor alone. Future work should integrate such information into an overall clinical and lifestyle strategy to reduce risk for and potentially delay the onset of AD symptoms.
Acknowledgments
Dr. David A. Merrill and Dr. Prabha Siddarth had full access to all of the data in the study and take responsibility for the integrity of the data and the accuracy of the data analysis. The authors thank Ms. Jacqueline Martinez and Ms. Colin Shinn for help in subject recruitment, data management, and study coordination. The authors thank Dr. Jeanne Kim for her neuropsychological testing of subjects, and Dr. Vladimir Kepe for his image analysis and manuscript critique.
Sources of support: The following agencies supported the design and conduct of the study; collection, management, analysis, and interpretation of the data; and preparation of the manuscript: NIH grants MH077650, AT003480, P01-AG024831, AG13308, P50 AG 16570, MH/AG58156, AG10123, M01-RR00865, DOE contract DE-FC03-87-ER60615, the Larry L. Hillblom Foundation, Fran and Ray Stark Foundation Fund for Alzheimer’s Disease Research, Ahmanson Foundation, Lovelace Foundation, the Science Foundation, the UCLA Claude Pepper Older Americans Independence Center funded by the National Institute on Aging (5P30AG028748), AFAR, the John A. Hartford Foundation and the Centers of Excellence National Program, NIH/National Center for Advancing Translational Science (NCATS) UCLA CTSI Grant Number UL1TR000124. These agencies were not involved in the approval and review of the manuscript nor in the decision to submit the manuscript for publication. The content is solely the responsibility of the authors and does not necessarily represent the official views of the NIH. Jorge R. Barrio is a thankful recipient of the Elizabeth and Thomas Plott endowed chair in Gerontology.
Footnotes
Publisher's Disclaimer: This is a PDF file of an unedited manuscript that has been accepted for publication. As a service to our customers we are providing this early version of the manuscript. The manuscript will undergo copyediting, typesetting, and review of the resulting proof before it is published in its final citable form. Please note that during the production process errors may be discovered which could affect the content, and all legal disclaimers that apply to the journal pertain.
Financial Disclosures: Dr. Merrill reports having received lecture fees from Assurex Health. Dr. Barrio and Dr. Small co-inventors of FDDNP-PET, which UCLA has licensed to TauMark, LLC. Dr. Barrio and Dr. Small have a financial interest in TauMark, LLC. Dr. Small reports having served as a consultant and/or having received lecture fees from Novartis, Forum Pharmaceuticals, Lily and Herbalife; grants from POM Wonderful; and writing fees from Herbalife, Newsmax Media, and Workman Publishing. Dr. Lavretsky reports having received grant support from Forest Research Institute and the Alzheimer’s Research and Prevention Foundation and consulting fees from Eli Lilly. Drs. Siddarth, Raji, Ercoli, Miller, Harris, Burggren, Bookheimer, Mrs. Emerson, and Ms. Rueda have no financial conflicts of interest.
Clinical Trial Registration: clinicaltrials.gov registration identifier NCT00355498.
References
- 1.Thies W, Bleiler L. 2014 Alzheimer’s disease facts and figures. Alzheimers Dement. 2014;10:e47–92. doi: 10.1016/j.jalz.2014.02.001. [DOI] [PubMed] [Google Scholar]
- 2.Barnes DE, Yaffe K. The projected effect of risk factor reduction on Alzheimer’s disease prevalence. Lancet neurology. 2011;10:819–828. doi: 10.1016/S1474-4422(11)70072-2. [DOI] [PMC free article] [PubMed] [Google Scholar]
- 3.Merrill DA, Small GW. Prevention in psychiatry: effects of healthy lifestyle on cognition. Psychiatr Clin North Am. 2011;34:249–261. doi: 10.1016/j.psc.2010.11.009. [DOI] [PubMed] [Google Scholar]
- 4.Williams JW, Plassman BL, Burke J, et al. Preventing Alzheimer’s Disease and Cognitive Decline. Rockville, MD: Agency for Healthcare Research and Quality; 2010. (Evidence Report/Technology Assessment No. 193 (Prepared by the Duke Evidence-based Practice Center under Contract No. HHSA 290-2007-10066-I.) AHRQ Publication No. 10-E005). [Google Scholar]
- 5.Gage FH. Neurogenesis in the adult brain. J Neurosci. 2002;22:612–613. doi: 10.1523/JNEUROSCI.22-03-00612.2002. [DOI] [PMC free article] [PubMed] [Google Scholar]
- 6.Nagahara AH, Merrill DA, Coppola G, et al. Neuroprotective effects of brain-derived neurotrophic factor in rodent and primate models of Alzheimer’s disease. Nat Med. 2009;15:331–337. doi: 10.1038/nm.1912. [DOI] [PMC free article] [PubMed] [Google Scholar]
- 7.Kramer AF, Hahn S, Cohen NJ, et al. Ageing, fitness and neurocognitive function. Nature. 1999;400:418–419. doi: 10.1038/22682. [DOI] [PubMed] [Google Scholar]
- 8.Erickson KI, Prakash RS, Voss MW, et al. Aerobic fitness is associated with hippocampal volume in elderly humans. Hippocampus. 2009;19:1030–1039. doi: 10.1002/hipo.20547. [DOI] [PMC free article] [PubMed] [Google Scholar]
- 9.Erickson KI, Voss MW, Prakash RS, et al. Exercise training increases size of hippocampus and improves memory. Proceedings of the National Academy of Sciences of the United States of America. 2011;108:3017–3022. doi: 10.1073/pnas.1015950108. [DOI] [PMC free article] [PubMed] [Google Scholar]
- 10.Scarmeas N, Luchsinger JA, Schupf N, et al. Physical activity, diet, and risk of Alzheimer disease. JAMA. 2009;302:627–637. doi: 10.1001/jama.2009.1144. [DOI] [PMC free article] [PubMed] [Google Scholar]
- 11.Tangney CC, Kwasny MJ, Li H, et al. Adherence to a Mediterranean-type dietary pattern and cognitive decline in a community population. Am J Clin Nutr. 2011;93:601–607. doi: 10.3945/ajcn.110.007369. [DOI] [PMC free article] [PubMed] [Google Scholar]
- 12.Panza F, D’Introno A, Colacicco AM, et al. Lipid metabolism in cognitive decline and dementia. Brain research reviews. 2006;51:275–292. doi: 10.1016/j.brainresrev.2005.11.007. [DOI] [PubMed] [Google Scholar]
- 13.Elias MF, Elias PK, Sullivan LM, et al. Obesity, diabetes and cognitive deficit: The Framingham Heart Study. Neurobiology of aging. 2005;26(Suppl 1):11–16. doi: 10.1016/j.neurobiolaging.2005.08.019. [DOI] [PubMed] [Google Scholar]
- 14.Fitzpatrick AL, Kuller LH, Lopez OL, et al. Midlife and late-life obesity and the risk of dementia: cardiovascular health study. Arch Neurol. 2009;66:336–342. doi: 10.1001/archneurol.2008.582. [DOI] [PMC free article] [PubMed] [Google Scholar]
- 15.Wolf PA, Beiser A, Elias MF, et al. Relation of obesity to cognitive function: importance of central obesity and synergistic influence of concomitant hypertension. The Framingham Heart Study. Curr Alzheimer Res. 2007;4:111–116. doi: 10.2174/156720507780362263. [DOI] [PubMed] [Google Scholar]
- 16.Xu WL, Atti AR, Gatz M, et al. Midlife overweight and obesity increase late-life dementia risk: a population-based twin study. Neurology. 2011;76:1568–1574. doi: 10.1212/WNL.0b013e3182190d09. [DOI] [PMC free article] [PubMed] [Google Scholar]
- 17.Taylor RW, Keil D, Gold EJ, et al. Body mass index, waist girth, and waist-to-hip ratio as indexes of total and regional adiposity in women: evaluation using receiver operating characteristic curves. Am J Clin Nutr. 1998;67:44–49. doi: 10.1093/ajcn/67.1.44. [DOI] [PubMed] [Google Scholar]
- 18.Human USDoAaUSDoHa, Services. Dietary Guidelines for Americans. 7th. Washington, DC: U.S. Government Printing Ofice; 2010. [Google Scholar]
- 19.Ho AJ, Raji CA, Becker JT, et al. Obesity is linked with lower brain volume in 700 AD and MCI patients. Neurobiology of aging. 2010;31:1326–1339. doi: 10.1016/j.neurobiolaging.2010.04.006. [DOI] [PMC free article] [PubMed] [Google Scholar]
- 20.Raji CA, Ho AJ, Parikshak NN, et al. Brain structure and obesity. Human brain mapping. 2010;31:353–364. doi: 10.1002/hbm.20870. [DOI] [PMC free article] [PubMed] [Google Scholar]
- 21.Zimmerman B, Sutton BP, Low KA, et al. Cardiorespiratory fitness mediates the effects of aging on cerebral blood flow. Frontiers in aging neuroscience. 2014;6:59. doi: 10.3389/fnagi.2014.00059. [DOI] [PMC free article] [PubMed] [Google Scholar]
- 22.Mrak RE. Alzheimer-type neuropathological changes in morbidly obese elderly individuals. Clinical neuropathology. 2009;28:40–45. doi: 10.5414/npp28040. [DOI] [PubMed] [Google Scholar]
- 23.Toledo JB, Toledo E, Weiner MW, et al. Cardiovascular risk factors, cortisol, and amyloid-beta deposition in Alzheimer’s Disease Neuroimaging Initiative. Alzheimers Dement. 2012;8:483–489. doi: 10.1016/j.jalz.2011.08.008. [DOI] [PMC free article] [PubMed] [Google Scholar]
- 24.Vidoni ED, Townley RA, Honea RA, et al. Alzheimer disease biomarkers are associated with body mass index. Neurology. 2011;77:1913–1920. doi: 10.1212/WNL.0b013e318238eec1. [DOI] [PMC free article] [PubMed] [Google Scholar]
- 25.Chen ST, Siddarth P, Saito NY, et al. Psychological well-being and regional brain amyloid and tau in mild cognitive impairment. Am J Geriatr Psychiatry. 2014;22:362–369. doi: 10.1016/j.jagp.2012.09.002. [DOI] [PMC free article] [PubMed] [Google Scholar]
- 26.Merrill DA, Siddarth P, Kepe V, et al. Vascular risk and FDDNP-PET influence cognitive performance. Journal of Alzheimer’s disease: JAD. 2013;35:147–157. doi: 10.3233/JAD-121903. [DOI] [PMC free article] [PubMed] [Google Scholar]
- 27.Merrill DA, Siddarth P, Saito NY, et al. Self-reported memory impairment and brain PET of amyloid and tau in middle-aged and older adults without dementia. International psychogeriatrics/IPA. 2012;24:1076–1084. doi: 10.1017/S1041610212000051. [DOI] [PMC free article] [PubMed] [Google Scholar]
- 28.Small GW, Siddarth P, Kepe V, et al. Prediction of cognitive decline by positron emission tomography of brain amyloid and tau. Archives of neurology. 2012;69:215–222. doi: 10.1001/archneurol.2011.559. [DOI] [PMC free article] [PubMed] [Google Scholar]
- 29.Small GW, Kepe V, Ercoli LM, et al. PET of brain amyloid and tau in mild cognitive impairment. N Engl J Med. 2006;355:2652–2663. doi: 10.1056/NEJMoa054625. [DOI] [PubMed] [Google Scholar]
- 30.Smith GE, Petersen RC, Parisi JE, et al. Definition, course and outcome of mild cognitive impairment. Aging Neuropsychol Cognition. 1996;3:141–147. [Google Scholar]
- 31.de Jager CA, Budge MM. Stability and predictability of the classification of mild cognitive impairment as assessed by episodic memory test performance over time. Neurocase. 2005;11:72–79. doi: 10.1080/13554790490896820. [DOI] [PubMed] [Google Scholar]
- 32.Hurtig-Wennlof A, Hagstromer M, Olsson LA. The International Physical Activity Questionnaire modified for the elderly: aspects of validity and feasibility. Public Health Nutr. 2010;13:1847–1854. doi: 10.1017/S1368980010000157. [DOI] [PubMed] [Google Scholar]
- 33.Craig CL, Marshall AL, Sjostrom M, et al. International physical activity questionnaire: 12-country reliability and validity. Med Sci Sports Exerc. 2003;35:1381–1395. doi: 10.1249/01.MSS.0000078924.61453.FB. [DOI] [PubMed] [Google Scholar]
- 34.Loftfield E, Yi S, Immerwahr S, et al. Construct Validity of a Single-Item, Self-Rated Question of Diet Quality. Journal of nutrition education and behavior. 2014 doi: 10.1016/j.jneb.2014.09.003. [DOI] [PubMed] [Google Scholar]
- 35.Liu J, Kepe V, Zabjek A, et al. High-yield, automated radiosynthesis of 2-(1-{6-[(2-[18F]fluoroethyl)(methyl)amino]-2-naphthyl}ethylidene)malononi trile ([18F]FDDNP) ready for animal or human administration. Mol Imaging Biol. 2007;9:6–16. doi: 10.1007/s11307-006-0061-4. [DOI] [PubMed] [Google Scholar]
- 36.Logan J, Fowler JS, Volkow ND, et al. Distribution volume ratios without blood sampling from graphical analysis of PET data. J Cereb Blood Flow Metab. 1996;16:834–840. doi: 10.1097/00004647-199609000-00008. [DOI] [PubMed] [Google Scholar]
- 37.Cournot M, Marquie JC, Ansiau D, et al. Relation between body mass index and cognitive function in healthy middle-aged men and women. Neurology. 2006;67:1208–1214. doi: 10.1212/01.wnl.0000238082.13860.50. [DOI] [PubMed] [Google Scholar]
- 38.Thomas EL, Frost G, Taylor-Robinson SD, et al. Excess body fat in obese and normal-weight subjects. Nutr Res Rev. 2012;25:150–161. doi: 10.1017/S0954422412000054. [DOI] [PubMed] [Google Scholar]
- 39.Willett K, Jiang R, Lenart E, et al. Comparison of bioelectrical impedance and BMI in predicting obesity-related medical conditions. Obesity (Silver Spring) 2006;14:480–490. doi: 10.1038/oby.2006.63. [DOI] [PubMed] [Google Scholar]
- 40.Small GW, Siddarth P, Ercoli LM, et al. Healthy behavior and memory self-reports in young, middle-aged, and older adults. International psychogeriatrics/IPA. 2013;25:981–989. doi: 10.1017/S1041610213000082. [DOI] [PubMed] [Google Scholar]