

Abstract
Objective
To assess the use of the Medicare Obesity coverage benefit (MOB) by a licensed physician or associate provider in an outpatient setting in older adults.
Methods
We used a serial cross-sectional analysis of fee-for-service Medicare claims (2012 and 2013) to assess the use of the MOB. Number and proportion of Medicare beneficiaries over age 65 using the benefit were assessed. Correlation between state-obesity rates and MOB uptake was determined based on state-specific obesity prevalence data from the Behavioral Risk Factor Surveillance System.
Results
There were 27,338 (0.10%) Medicare beneficiaries over age 65 in 2012 using the MOB, slightly more in 2013 (n=46,821 [0.17%]). Mean age of MOB users in both years was 73 years and 62% were females. Use declined with older age and was highest in the Northeast and lowest in the Midwest. High state obesity prevalence was not correlated with higher uptake of the MOB. Estimated proportion of persons with obesity using the MOB was 0.35% and 0.60% in successive years. We observed a mean of 1.99 and 2.16 claims/MOB user.
Conclusions
While the rate of MOB use increased in the second full year of its implementation, few are availing themselves of this benefit.
Keywords: obesity, Medicare, weight loss, primary care
INTRODUCTION
Prevalence rates of obesity in the United States continue to be high, approaching 35% in the general population(1). The risks associated with obesity have been well documented and include cardiometabolic(2), functional(3) and mortality risks(4) that are critically important public health concerns. Primary care practitioners are well positioned to deliver important lifestyle interventions as front-line clinicians yet barriers of insurance reimbursement, time and inadequate skills have plagued the ability to intervene at this level(5, 6).
In November 2011, the Centers for Medicare and Medicaid Services (CMS) decided to cover counseling for obesity in eligible Medicare beneficiaries whose body mass index (BMI) was ≥30kg/m2. Clinicians, defined as physicians, associate providers (nurse practitioners, physician assistants), or clinical nurse specialists, can provide 22 targeted, 15-minute intensive behavioral therapy counseling visits in a continuous 12 month period. The goal of this benefit is to achieve a mean weight loss of 3kg in participating Medicare beneficiaries. Medicare based their coverage determination on a number of targeted clinical lifestyle intervention trials(7, 8, 9, 10, 11, 12, 13, 14).
The diagnosis and care of persons with obesity and the delivery of intensive behavioral therapy in a primary care setting is rare, providing a considerable opportunity for treatment(15, 16). While the MOB was considered a success in recognizing the importance of obesity as a disease, others have argued a number of shortcomings(17). Practice management barriers lead to challenges in fee-for-service reimbursement models, including providing the intensity of visits in busy primary care practices and relatively poor reimbursement levels(18, 19). The aim of this current study was to use national Medicare claims data to assess the uptake of the benefit over the first two years of implementation and to test whether the uptake was associated with state-level obesity rates. We hypothesized that we would observe higher use in areas with higher obesity rates.
METHODS
A cross-sectional analysis of fee-for-service Medicare claims was used to report on the first two years (2012 and 2013) of implementation of the Medicare Obesity Benefit (MOB) covered under Medicare Part B. We included 100% fee-for-service Medicare beneficiaries aged 65 and older enrolled in Parts A and B. Use of the MOB was assessed in two different manners: a) the presence of at least one visit in the Carrier file billed for a Common Procedural Treatment code of G0477 (the MOB); or b) the presence of the G0477 code with an ICD-9 code of Obesity (278.00, 278.01, 278.03, 278.01, V85.3-V85.4), which is consistent with the regulatory requirements. As the MOB reimburses up to 22 visits, as an exploratory analysis, we determined the average number of MOB visits per person per year. All demographic data was obtained from the Medicare denominator file including sex, race/ethnicity and age on January 1st of each respective year. Results were aggregated nationally and stratified by age, sex, ethnicity and region (Northeast, South, West, Midwest). The number of beneficiaries using the MOB and the number of MOB claims per MOB user were also determined.
We then ascertained the rate of MOB using prevalence rates of obesity using data from the 2012 Behavior Risk Factor Surveillance System (http:www.cdc.gov/brfss). This dataset is coordinated and managed by the Centers for Disease Control that collects state data from US residents regarding their health-related risk behaviors, chronic health conditions and use of preventive services using telephone surveys. National obesity rates were determined using the crude individual state rates to determine the proportion of Medicare beneficiaries eligible for the MOB, nationally. We estimated the number of beneficiaries with obesity per state as the product of the state-specific prevalence rate and the total number of fee for service Medicare beneficiaries in the state. The rate of MOB uptake among potentially eligible beneficiaries was determined as the ratio of the number of beneficiaries availing themselves of the benefit to the estimated state prevalence of obesity in eligible Medicare beneficiaries. Data was suppressed for states with fewer than 11 observations and indicated in the text or figure accordingly. As BRFSS data was only available in aggregate for those over the age of 65 years, we estimated the prevalence rate of obesity to equal this across all age categories (<70 to 85+). The correlation between state-specific obesity rates and the rate of MOB uptake was determined. All data analyses were performed using SAS (version 9.4, Cary, NC) and Microsoft Excel 2013 (Redmond, WA); the map was made with ESRI ArcGIS 10.0. The study was approved by the Committee for the Protection of Human Subjects at Dartmouth.
RESULTS
In 2012, there were 27,338 (0.10%) Medicare beneficiaries using the MOB which increased slightly to 46,821 (0.17%) in 2013 (Table 1) using any G0477 coding. If one used the G0477 code in combination with an ICD-9 code for obesity, as should occur according to the billing rules, the number of users was 75-80% lower (Supplementary Table S1). In the remainder of the analyses, we report the use of the G0477 code without regard to accompanying ICD-9 code. In those using the MOB, mean age was 75.6 years. MOB users were more likely female (62%) or Black (10.0%), as compared to the overall population (57% and 8%, respectively) in both years. Overall, sex, race, age, and region-specific uptake increased in 2013. In those using the MOB benefit, there was a higher proportion of eligible older adults aged <70 years old using the benefit (0.42%) than those aged ≥85 years old (0.15%) in 2012. There were similar trends observed in 2013 (0.74% and 0.24%).
Table 1.
Medicare Obesity Benefit Utilization for All G0477 billed in the Years 2012 and 2013
| Calendar Year 2012 | Calendar Year 2013 | ||||||||||
|---|---|---|---|---|---|---|---|---|---|---|---|
| Overall Medicare Beneficiaries |
# MOB Users |
# claims | # claims / MOB User |
Estimated MOB Uptake (%) |
Overall Medicare Beneficiaries |
# MOB Users |
# claims | # claims / MOB User |
Estimated MOB Uptake (%) |
Absolute Δ in # beneficiaries |
|
| Overall Counts | 27,971,740 | 27,338 | 54,330 | 1.99 | 0.35 | 28,146,952 | 46,821 | 101,290 | 2.16 | 0.60 | +19,483 |
| <70years | 8,043,005 (28.8) | 8,846 | 17,841 | 2.02 | 0.42 | 8,208,782 (29.2) | 15,831 | 34,865 | 2.20 | 0.74 | +6,985 |
| 70-75 | 6,380,430 (22.8) | 7,868 | 15,956 | 2.03 | 0.48 | 6,510,248 (23.1) | 13,916 | 31,496 | 2.26 | 0.82 | +6,048 |
| 75-80 | 4,943,729 (17.7) | 5,509 | 11,113 | 2.02 | 0.43 | 4,983,066 (17.7) | 9,199 | 19,396 | 2.11 | 0.71 | +3,690 |
| 80-85 | 3,979,413 (14.2) | 3,278 | 6,286 | 1.92 | 0.32 | 3,845,629 (13.7) | 5,043 | 10,176 | 2.02 | 0.51 | +1,765 |
| 85+ | 4,625,163 (16.5) | 1,837 | 3,134 | 2.02 | 0.15 | 4,599,227 (16.3) | 2,832 | 5,357 | 2.20 | 0.24 | +6,985 |
| Sex | |||||||||||
| Females | 15,904,103 (56.9) | 16,894 | 34,758 | 2.06 | 0.39 | 15,920,574 (56.6) | 29,195 | 65,534 | 2.24 | 0.67 | +12,301 |
| Males | 12,067,637 (43.1) | 10,444 | 19,572 | 1.87 | 0.31 | 12,226,378 (43.4) | 17,626 | 35,756 | 2.03 | 0.51 | +7,182 |
| Race* | |||||||||||
| Black | 2,162,392 (7.7) | 2,588 | 4,893 | 1.89 | 0.31 | 2,179,152 (7.7) | 4,682 | 9,764 | 2.09 | 0.55 | +2,094 |
| Non-Black | 25,809,348 (92.3) | 24,750 | 49,437 | 2.00 | 0.36 | 25,967,800 (92.3) | 42,139 | 91,526 | 2.17 | 0.61 | +17,389 |
| Region | |||||||||||
| Northeast | 5,127,681 (18.3) | 7,789 | 15,145 | 1.94 | 0.60 | 5,157,096 (18.3) | 12,377 | 25,852 | 2.09 | 0.95 | +4,588 |
| Midwest | 6,428,706 (23.4) | 2,837 | 6,027 | 2.12 | 0.15 | 6,557,383 (23.3) | 5,858 | 13,304 | 2.27 | 0.30 | +3,021 |
| South | 10,584,971 (37.8) | 11,642 | 22,197 | 1.91 | 0.38 | 10,572,918 (37.6) | 19,828 | 42,007 | 2.12 | 0.65 | +8,186 |
| West | 5,716,475 (20.4) | 4,717 | 10,383 | 2.20 | 0.31 | 5,857,140 (20.8) | 8,453 | 17,679 | 2.09 | 0.55 | +3,736 |
Categorical values are represented as counts (percent where indicated) relative to the overall counts for that stratum
Absolute change in beneficiaries represents a difference from the counts in years 2012 to 2013
Percent counts, Absolute Change in Beneficiaries and claims by region may not add up to the overall count due to individual states having suppressed data
G0477: CPT billing code for the Medicare Obesity Benefit
Estimated MOB uptake is defined as the ratio of the number of beneficiaries using the MOB benefit to the product of the estimated prevalence of obesity based on 2012 BRFSS data and the overall Medicare beneficiary population in the given stratum
Proportion of MOB users with obesity that are classified are black do not include certain states in BRFSS due to cell suppression
# claims per MOB user represents the ratio of the overall number of any G0477 claims and the number of beneficiaries using the MOB benefit.
Regions:
Northeast: Connecticut, Maine, Massachusetts, New Hampshire, New Jersey, New York, Pennsylvania, Rhode Island, and Vermont.
Midwest: Illinois, Indiana, Iowa, Kansas, Michigan, Minnesota, Missouri, Nebraska, North Dakota, Ohio, South Dakota, and Wisconsin.
South: Alabama, Arkansas, Delaware, District of Columbia, Florida, Georgia, Kentucky, Louisiana, Maryland, Mississippi, North Carolina, Oklahoma, South Carolina, Tennessee, Texas, Virginia, and West Virginia.
West: Alaska, Arizona, California, Colorado, Hawaii, Idaho, Montana, Nevada, New Mexico, Oregon, Utah, Washington, and Wyoming.
Abbreviations: Δ – change; MOB – Medicare Obesity Benefit
We present in Figure 1 a map of the proportion of MOB users by state in the 2013 year. Estimated proportion of individuals with obesity using the MOB nationally increased from 0.17% to 0.60%. The number of MOB claims in the 2012 and 2013 years were 54,330 and 101,290, respectively. Our exploratory analysis of demonstrated that there was a mean of 1.99 claims/person in 2012 that increased to 2.16 in the calendar year 2013. In both years, there was a higher proportion of beneficiaries and claims using the MOB in the Northeast; fewer were using the benefit in the Midwest. There were only 6 states that had mean number of visits of 3 or more claims. We did not observe a relationship between rate of state obesity and MOB uptake rate.
Figure 1. Map of Relative Uptake of Medicare Obesity Benefit, by state, 2013.
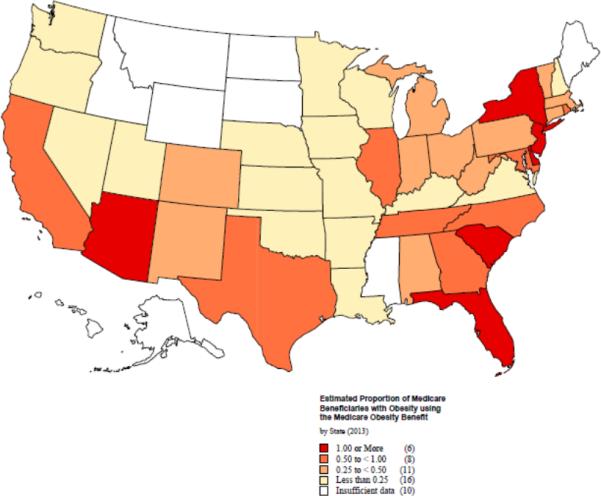
The proportion of number of beneficiaries using the Medicare Obesity Benefit and the number of estimated beneficiaries with obesity eligible for the benefit by state in the United States in the year 2013. Data was suppressed in 10 states.
DISCUSSION
In the first two years of CMS Obesity benefit, an estimated 0.35-0.60% of eligible Medicare beneficiaries with obesity used this service. We observed variability in our results depending on the manner the provider billed this benefit. Use of MOB increased in the second year, but remained low. The use of the benefit did not appear to be related to the prevalence of obesity in each state. On average, MOB users had 2 MOB visits per year when the benefit covers a maximum of 22 sessions.
The increasing trend in beneficiaries using the MOB is consistent with what has been observed when other regulatory coverage determinations have been implemented. The Medicare hospice benefit was enacted in August 1982 for coverage starting in November 1983. During the fiscal year 1984, there were 2,000 beneficiaries electing the benefit, a number that tripled during the second year of the program, reaching more than 11,000 in the third fiscal year(20). The Welcome to Medicare Visit was first introduced in 2005. In 2006, approximately 2.9% of beneficiaries took advantage of this benefit (21), which increased to 3.2% in 2007. Lastly, even in a large health system, fewer than 3.2% of beneficiaries used the Medicare Annual Wellness Visit following implementation of Affordable Care(22). If the MOB follows the pattern of previous new benefits, we expect that the rates will continue to rise over time. Yet providers may not be integrating MOB visits within their practice due to the high frequency of visits expected or because of the complexity of the documentation requirements.
We did not observe a relationship between MOB uptake and the number of Medicare beneficiaries eligible to use this benefit nor did we observe a strong relationship between regional or state obesity prevalence rates with number of MOB beneficiaries or number of claims. One reason could be that the counts were too low to detect whether a correlation existed. Such variation has been observed in other studies examining cardiovascular health which may be partially impacted by individual and state level factors(23, 24). In fact, a previous study has demonstrated variation in prevalence of obesity and medical practice patterns regarding weight management advice(25). The delivery of IBT and care of persons with obesity can be challenging in primary care along with the manner in which obesity is diagnosed and documented likely causing, in part the low counts observed. Integrating frequent visits into busy practices may be impractical and physicians receive little formal training on provision of weight counseling. For instance, if a primary care provider delivered the service to half of thei Medicare patients with obesity (n=90 estimated based on ~30% with obesity in a panel of 2,000 patients of whom 30% are Medicare beneficiaries), it would require 495 hours of counseling using IBT (15 minutes × 22 visits × 90 patients) per year. An alternative model structuring the use of allied-health staff, including nurses and dieticians, that can provide such services may increase the possibility for wide-spread dissemination in primary care
An important finding in our analysis was that the G0477 code was billed in different manners. The regulatory coverage determination put forth by Medicare stated that the G0477 code must be billed together with an ICD-9 code of obesity. Our results reflect that should we have based our results on this combination of G0477/ICD-9 documentation, only a small fraction of individuals would have been covered. Even more important is that the incorrect billing may account for the provider to believe that is too low. These preliminary findings suggest an opportunity for using the electronic health record to set up prompts and alerts to support correct billing procedures.
The proportion of beneficiaries using the MOB was lower in higher age groups. While we cannot determine why this occurs with this data, a number of factors are possible. Primary care clinicians are ill-equipped at counseling and managing obesity in younger populations(26); their abilities may be even further challenged in recommending weight loss in older adults due to the limited, large randomized controlled trial evidence available, none of which are in a primary care setting (14, 27, 28, 29, 30). Providers may resist counseling older adults toward weight loss because of concern over conflicting reports suggesting a relationship between weight loss and mortality(31, 32, 33) and concern about potential effects on loss of muscle and bone loss that can lead to an increased risk of disability(14, 34, 35). Women avail themselves of the MOB more so than men. Woman are known to report higher levels of body image dissatisfaction, more depression and are more likely to seek weight loss therapy(36, 37) and we suspect that our findings may be, in part, due to these phenomena.
We acknowledge a number of limitations of this study. Our results may underestimate the overall uptake of all visits for obesity counseling. For the MOB claim to be reimbursed, an ICD-9 code of obesity along with the G0477 code must be documented on the claim. Our analysis attempted to integrate beneficiaries with a G0477 code in their billing history and presented the data in aggregate. As the number of beneficiaries across the country increase in the use of the MOB, future analyses will eliminate this problem. Second, patients with obesity may receive care and/or counseling for their weight that is integrated into other visits which would not be captured in administrative data. We acknowledge that we may have missed a small percentage of cases in physician visits that are present only in the hospital outpatient file (ie: federally qualified and rural health centers) but these visits account for ~2% of all visits nationally. Third, our data on claims per beneficiary is subject to bias as we would not have a full calendar year following 2013 to capture all the required visits. However, we would expect the first visit to occur evenly across the year and that beneficiaries would be getting more frequent visits. A mean of 2 visits/beneficiary, while exploratory, suggests that the benefit is underutilized. Fourth, our data on obesity uptake rate was based on obesity prevalence rates in the general population, not specific to older adults, although prevalence rates in a geriatric population is known to approximate that of the general population(1). Last, while we present data on the uptake by non-black/black, our results do not accurately allow for further delineation by other ethnicities.
As our society ages, the number of people with obesity will continue to increase dramatically. There is a great value in understanding the true scope of using this important benefit, particularly in the primary care setting where obesity management predominantly occurs. Such a federal policy measure is important from a public health standpoint. However, the paucity of cases and claims provide evidence that individuals are not taking advantage of the benefit. The lack of uptake may be due to a lack of provider knowledge, need for more time for diffusion into practice, or the way in which the MOB benefit is structured is needed. If the MOB continues to be poorly used in practice, other strategies such as incorporating telemedicine or allowing allied health staff to deliver intensive behavioral therapy, could be considered to increase use of interventions to reduce obesity. A greater understanding of encouraging older individuals with obesity is needed to use this benefit. Whether this IBT benefit is effective at reducing obesity, its clinical outcomes and its consequences in clinical practice are important areas of future research. In particular, little is known about the integration of IBT into existing geriatric care models. Establishing the relationship of weight loss counseling by primary care providers to health promotion and long-term obesity outcomes is needed in older adults with obesity.
Conclusion
While there has been a small, steady rise in the use of the CMS Medicare Obesity benefit, utilization and uptake across the United States remains very low, and is not correlated with high obesity rates. Future use of the MOB in beneficiaries is needed prior to assessing a meaningful impact in older adults with obesity.
Supplementary Material
What is known?
Obesity in Older Adults is an important public health concern that impacts functional impairment, morbidity and mortality;
The Centers for Medicare & Medicaid Services introduced a benefit for treating older adults with obesity within a primary care setting;
While Intensive Behavioral Therapy is effective in promoting weight loss, its delivery is rare in a primary care setting.
What this study adds?
The number of beneficiaries using the Medicare Obesity Benefit is low in successive years following implementation;
While the use of the benefit is not higher in states with higher obesity rates, it rose slightly in 2013;
Rates of use are lower in the older adult age group.
ACKNOWLEDGEMENTS
We thank Scott Savioli and Stephanie Tomlin for their data analytical skills, and Kristen Bonner for assisting with creating the national map. All authors had full access to all of the data in the study and take responsibility for the integrity of the data and the accuracy of the data analysis
FINANCIAL DISCLOSURE
Dr. Batsis received funding from the Department of Medicine, Dartmouth-Hitchcock Medical Center, and the Dartmouth Centers for Health and Aging. Research reported in this publication was supported by The Dartmouth Clinical and Translational Science Institute, under award number UL1TR001086 from the National Center for Advancing Translational Sciences (NCATS) of the National Institutes of Health (NIH). The content is solely the responsibility of the author(s) and does not necessarily represent the official views of the NIH. This work was also supported by the Dartmouth Health Promotion and Disease Prevention Research Center (Cooperative Agreement Number U48DP005018) from the Centers for Disease Control and Prevention. The findings and conclusions in this journal article are those of the authors and do not necessarily represent the official position of the Centers for Disease Control and Prevention.
ABBREVIATIONS
- BMI
Body mass index
- CMS
Centers for Medicare and Medicaid Services
- MOB
Medicare Obesity Benefit
Footnotes
Work to be presented at the 2016 American Geriatrics Society Annual Meeting, Long Beach, CA
There are no conflicts of interest pertaining to this manuscript
REFERENCES
- 1.Yang L, Colditz GA. Prevalence of Overweight and Obesity in the United States, 2007-2012. JAMA Internal Medicine. 2015;175:1412. doi: 10.1001/jamainternmed.2015.2405. [DOI] [PMC free article] [PubMed] [Google Scholar]
- 2.Gregg EW, Cheng YJ, Cadwell BL, Imperatore G, Williams DE, Flegal KM, et al. Secular trends in cardiovascular disease risk factors according to body mass index in US adults. JAMA. 2005;293:1868–1874. doi: 10.1001/jama.293.15.1868. [DOI] [PubMed] [Google Scholar]
- 3.Dowd JB, Zajacova A. Long-term obesity and physical functioning in older Americans. Int J Obes (Lond) 2014 doi: 10.1038/ijo.2014.150. [DOI] [PubMed] [Google Scholar]
- 4.Flegal KM, Graubard BI, Williamson DF, Gail MH. Excess deaths associated with underweight, overweight, and obesity. JAMA. 2005;293:1861–1867. doi: 10.1001/jama.293.15.1861. [DOI] [PubMed] [Google Scholar]
- 5.Abbo ED, Zhang Q, Zelder M, Huang ES. The increasing number of clinical items addressed during the time of adult primary care visits. J Gen Intern Med. 2008;23:2058–2065. doi: 10.1007/s11606-008-0805-8. [DOI] [PMC free article] [PubMed] [Google Scholar]
- 6.Mohr DC, Benzer JK, Young GJ. Provider workload and quality of care in primary care settings: moderating role of relational climate. Med Care. 2013;51:108–114. doi: 10.1097/MLR.0b013e318277f1cb. [DOI] [PubMed] [Google Scholar]
- 7.Franz MJ, VanWormer JJ, Crain AL, Boucher JL, Histon T, Caplan W, et al. Weight-loss outcomes: a systematic review and meta-analysis of weight-loss clinical trials with a minimum 1-year follow-up. J Am Diet Assoc. 2007;107:1755–1767. doi: 10.1016/j.jada.2007.07.017. [DOI] [PubMed] [Google Scholar]
- 8.Leblanc ES, O'Connor E, Whitlock EP, Patnode CD, Kapka T. Effectiveness of primary care-relevant treatments for obesity in adults: a systematic evidence review for the U.S. Preventive Services Task Force. Ann Intern Med. 2011;155:434–447. doi: 10.7326/0003-4819-155-7-201110040-00006. [DOI] [PubMed] [Google Scholar]
- 9.McTigue KM, Hess R, Ziouras J. Obesity in older adults: a systematic review of the evidence for diagnosis and treatment. Obesity (Silver Spring) 2006;14:1485–1497. doi: 10.1038/oby.2006.171. [DOI] [PubMed] [Google Scholar]
- 10.Mozaffarian D, Hao T, Rimm EB, Willett WC, Hu FB. Changes in diet and lifestyle and long-term weight gain in women and men. N Engl J Med. 2011;364:2392–2404. doi: 10.1056/NEJMoa1014296. [DOI] [PMC free article] [PubMed] [Google Scholar]
- 11.Park Y, Subar AF, Hollenbeck A, Schatzkin A. Dietary fiber intake and mortality in the NIH-AARP diet and health study. Arch Intern Med. 2011;171:1061–1068. doi: 10.1001/archinternmed.2011.18. [DOI] [PMC free article] [PubMed] [Google Scholar]
- 12.Shea MK, Houston DK, Nicklas BJ, Messier SP, Davis CC, Miller ME, et al. The effect of randomization to weight loss on total mortality in older overweight and obese adults: the ADAPT Study. J Gerontol A Biol Sci Med Sci. 2010;65:519–525. doi: 10.1093/gerona/glp217. [DOI] [PMC free article] [PubMed] [Google Scholar]
- 13.Sui X, Laditka JN, Hardin JW, Blair SN. Estimated functional capacity predicts mortality in older adults. J Am Geriatr Soc. 2007;55:1940–1947. doi: 10.1111/j.1532-5415.2007.01455.x. [DOI] [PMC free article] [PubMed] [Google Scholar]
- 14.Villareal DT, Chode S, Parimi N, Sinacore DR, Hilton T, Armamento-Villareal R, et al. Weight loss, exercise, or both and physical function in obese older adults. N Engl J Med. 2011;364:1218–1229. doi: 10.1056/NEJMoa1008234. [DOI] [PMC free article] [PubMed] [Google Scholar]
- 15.Kraschnewski JL, Sciamanna CN, Stuckey HL, Chuang CH, Lehman EB, Hwang KO, et al. A silent response to the obesity epidemic: decline in US physician weight counseling. Med Care. 2013;51:186–192. doi: 10.1097/MLR.0b013e3182726c33. [DOI] [PubMed] [Google Scholar]
- 16.Talwalker A, McCarty F. NCHS Data Brief. National Center for Health Statistics; Hyattsville, MD: 2016. Characteristics of physician office visits for obesity by adults aged 20 and over: United States, 2012. [PubMed] [Google Scholar]
- 17.Batsis JA, Huyck KL, Bartels SJ. Challenges with the Medicare obesity benefit: practical concerns & proposed solutions. J Gen Intern Med. 2015;30:118–122. doi: 10.1007/s11606-014-3031-6. [DOI] [PMC free article] [PubMed] [Google Scholar]
- 18.Alexander SC, Cox ME, Boling Turer CL, Lyna P, Ostbye T, Tulsky JA, et al. Do the five A's work when physicians counsel about weight loss? Fam Med. 2011;43:179–184. [PMC free article] [PubMed] [Google Scholar]
- 19.Digenio AG, Mancuso JP, Gerber RA, Dvorak RV. Comparison of methods for delivering a lifestyle modification program for obese patients: a randomized trial. Ann Intern Med. 2009;150:255–262. doi: 10.7326/0003-4819-150-4-200902170-00006. [DOI] [PubMed] [Google Scholar]
- 20.Health Care Financing Administration: Medicare Hospice Manual. US Government Printing Office; Washington, DC: 1983. [Google Scholar]
- 21.Salloum RG, Jensen GA, Biddle AK. The “Welcome to Medicare” visit: a missed opportunity for cancer screening among women? J Womens Health (Larchmt) 2013;22:19–25. doi: 10.1089/jwh.2012.3777. [DOI] [PMC free article] [PubMed] [Google Scholar]
- 22.Hu J, Jensen GA, Nerenz D, Tarraf W. Medicare's Annual Wellness Visit in a Large Health Care Organization: Who Is Using It? Ann Intern Med. 2015;163:567–568. doi: 10.7326/L15-5145. [DOI] [PubMed] [Google Scholar]
- 23.Slack T, Myers CA, Martin CK, Heymsfield SB. The geographic concentration of US adult obesity prevalence and associated social, economic, and environmental factors. Obesity (Silver Spring) 2014;22:868–874. doi: 10.1002/oby.20502. [DOI] [PubMed] [Google Scholar]
- 24.Gebreab SY, Davis SK, Symanzik J, Mensah GA, Gibbons GH, Diez-Roux AV. Geographic variations in cardiovascular health in the United States: contributions of state- and individual-level factors. J Am Heart Assoc. 2015;4:e001673. doi: 10.1161/JAHA.114.001673. [DOI] [PMC free article] [PubMed] [Google Scholar]
- 25.Ford ES, Mokdad AH, Giles WH, Galuska DA, Serdula MK. Geographic variation in the prevalence of obesity, diabetes, and obesity-related behaviors. Obes Res. 2005;13:118–122. doi: 10.1038/oby.2005.15. [DOI] [PubMed] [Google Scholar]
- 26.Aleem S, Lasky R, Brooks WB, Batsis JA. Obesity perceptions and documentation among primary care clinicians at a rural academic health center. Obes Res Clin Pract. 2015;9:408–415. doi: 10.1016/j.orcp.2015.08.014. [DOI] [PubMed] [Google Scholar]
- 27.Diabetes Prevention Program Research G. Crandall J, Schade D, Ma Y, Fujimoto WY, Barrett-Connor E, et al. The influence of age on the effects of lifestyle modification and metformin in prevention of diabetes. J Gerontol A Biol Sci Med Sci. 2006;61:1075–1081. doi: 10.1093/gerona/61.10.1075. [DOI] [PMC free article] [PubMed] [Google Scholar]
- 28.Espeland MA, Rejeski WJ, West DS, Bray GA, Clark JM, Peters AL, et al. Intensive weight loss intervention in older individuals: results from the Action for Health in Diabetes Type 2 diabetes mellitus trial. J Am Geriatr Soc. 2013;61:912–922. doi: 10.1111/jgs.12271. [DOI] [PMC free article] [PubMed] [Google Scholar]
- 29.Knowler WC, Barrett-Connor E, Fowler SE, Hamman RF, Lachin JM, Walker EA, et al. Reduction in the incidence of type 2 diabetes with lifestyle intervention or metformin. N Engl J Med. 2002;346:393–403. doi: 10.1056/NEJMoa012512. [DOI] [PMC free article] [PubMed] [Google Scholar]
- 30.Look_Ahead_Research_Group Eight-year weight losses with an intensive lifestyle intervention: the look AHEAD study. Obesity (Silver Spring) 2014;22:5–13. doi: 10.1002/oby.20662. [DOI] [PMC free article] [PubMed] [Google Scholar]
- 31.Yaari S, Goldbourt U. Voluntary and involuntary weight loss: associations with long term mortality in 9,228 middle-aged and elderly men. Am J Epidemiol. 1998;148:546–555. doi: 10.1093/oxfordjournals.aje.a009680. [DOI] [PubMed] [Google Scholar]
- 32.Sorensen TI, Rissanen A, Korkeila M, Kaprio J. Intention to lose weight, weight changes, and 18-y mortality in overweight individuals without comorbidities. PLoS Med. 2005;2:e171. doi: 10.1371/journal.pmed.0020171. [DOI] [PMC free article] [PubMed] [Google Scholar]
- 33.Knudtson MD, Klein BE, Klein R, Shankar A. Associations with weight loss and subsequent mortality risk. Ann Epidemiol. 2005;15:483–491. doi: 10.1016/j.annepidem.2004.12.003. [DOI] [PubMed] [Google Scholar]
- 34.Johnell O, Kanis JA. An estimate of the worldwide prevalence and disability associated with osteoporotic fractures. Osteoporos Int. 2006;17:1726–1733. doi: 10.1007/s00198-006-0172-4. [DOI] [PubMed] [Google Scholar]
- 35.Schaap LA, Koster A, Visser M. Adiposity, Muscle Mass, and Muscle Strength in Relation to Functional Decline in Older Persons. Epidemiol Rev. 2012 doi: 10.1093/epirev/mxs006. [DOI] [PubMed] [Google Scholar]
- 36.Rodin J. Determinants of body fat and its implications for health. Ann Behav Med. 1992;14:275–281. [Google Scholar]
- 37.Linne Y, Hemmingsson E, Adolfsson B, Ramsten J, Rossner S. Patient expectations of obesity treatment-the experience from a day-care unit. Int J Obes Relat Metab Disord. 2002;26:739–741. doi: 10.1038/sj.ijo.0801969. [DOI] [PubMed] [Google Scholar]
Associated Data
This section collects any data citations, data availability statements, or supplementary materials included in this article.