

Abstract
This research describes a rapid solubility classification approach that could be used in the discovery and development of new molecular entities. Compounds (N = 635) were divided into two groups based on information available in the literature: high solubility (BDDCS/BCS 1/3) and low solubility (BDDCS/BCS 2/4). We established decision rules for determining solubility classes using measured log solubility in molar units (MLogSM) or measured solubility (MSol) in mg/ml units. ROC curve analysis was applied to determine statistically significant threshold values of MSol and MLogSM. Results indicated that NMEs with MLogSM >−3.05 or MSol >0.30 mg/mL will have ≥85% probability of being highly soluble and new molecular entities with MLogSM ≤−3.05 or MSol ≤0.30 mg/mL will have ≥85% probability of being poorly soluble. When comparing solubility classification using the threshold values of MLogSM or MSol with BDDCS, we were able to correctly classify 85% of compounds. We also evaluated solubility classification of an independent set of 108 orally administered drugs using MSol (0.3 mg/mL) and our method correctly classified 81% and 95% of compounds into high and low solubility classes, respectively. The high/low solubility classification using MLogSM or MSol is novel and independent of traditionally used dose number criteria.
Keywords: Solubility, High throughput technologies, Analytical chemistry, Computational ADME, In silico modeling, Computer aided drug design, ROC curve analysis
Graphical Abstract
1. Introduction
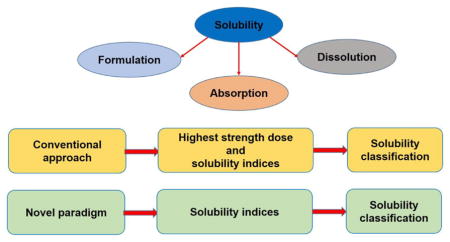
The solubility of compounds impacts formulation, dissolution, and absorption from the gastrointestinal tract. Extensive research has been conducted to develop in silico quantitative structure pharmacokinetic relationships and in vitro assays to predict the solubility of compounds in the early phases of the drug discovery process (Balakin et al., 2006; Dearden, 2006; Hughes et al., 2008; Kerns et al., 2008). The Biopharmaceutics Classification System (BCS) and Biopharmaceutics Drug Disposition Classification System (BDDCS) have classified compounds according to their extent of solubility (high or low) using the rate and the extent of dissolution (Amidon et al., 1995; Yu et al., 2002) and/or dose number (Benet et al., 2011; Dahan et al., 2013). Dose number (D0) is defined as (Amidon et al., 1995; Benet et al., 2011):
where compounds with D0 ≤ 1 and D0 > 1 are considered to have high and low solubility.
About 10% and 90% of new molecular entities have been proposed to have high and low solubility, respectively (Benet et al., 2011). An in silico/in vitro method for the determination of solubility for classification by BCS and BDDCS was recently reported (Dahan et al., 2013). This method predicted the dose number of 185 orally administered compounds by first using the reference solubility reported in the literature or by several regression models for predicting in silico solubility and then determining D0, as described above (Dahan et al., 2013). Benet et al., (2011) also predicted the BDDCS solubility classes of over 900 compounds using the dose number criteria (Benet et al., 2011). However, these in silico approaches require the knowledge of the highest strength dose of compounds, which is available only at the later phases of the drug development process. In this research, we propose a method for the rapid determination of the solubility class of compounds in early drug discovery and development, with statistically significant threshold values determined using Receiver Operating Characteristic (ROC) curve analysis.
ROC curve analysis is a robust and reliable statistical method that is highly sensitive and specific, and minimizes the probability of false positive and false negative predictions. ROC curve analysis was originally developed to accurately differentiate signal from noise in radar technology (Lusted, 1971). Owing to its accuracy, several clinical areas routinely use ROC curve analysis in screening and diagnostic tests (Zou et al., 2007), including laboratory testing (Campbell, 1994), radiology (Obuchowski, 2003; Omalley et al., 2001), bioinformatics (Lasko et al., 2005), and diagnosis of several disease states such as Sjogren Syndrome (Vitali et al., 2002) and insulin resistance (Keskin et al., 2005). In brief, given two predefined categories of response variables, ROC curve analysis computes potential threshold (cut-off) values (TV) with certain degree of sensitivity and specificity. The threshold value with the highest sensitivity and specificity can then be used to differentiate between the two response variables with significant statistical accuracy. Usefulness and unique advantages of ROC curve analysis have been extensively reported (Hajian-Tilaki, 2013; Park et al., 2004; Zou et al., 2007). ROC curve analysis (1) is not a single point analysis method, but utilizes all data to compute a wide range of potential threshold values, (2) is independent of the frequency of the observations in the two response variables with unique values of sensitivity and specificity, and (3) can be used for data with covariance and non-normal distribution unlike the conventional parametric methods. Our laboratory has previously demonstrated the use of ROC curve analysis to determine a quantitative molecular weight threshold for compounds undergoing biliary excretion in rats, dogs, and humans (Yang et al., 2009; Yang et al., 2010).
The overall objective of the present study is to determine a threshold value of MLogSM and MSol using ROC curve analysis to accurately classify compounds into high/low solubility classes. We also compared the performance of this method with BCS and BDDCS solubility classification of compounds available in the literature.
2. Materials and Methods
2.1 Acquisition and processing of data
Using the data from Benet et al., (2011), we obtained the BDDCS classification of 635 compounds and associated available solubility data (water as media) on measured solubility (MSol) (N = 635) at pH 7.4 and measured Log10 solubility in molar units (MLogSM) (N=634). We also obtained the data available for ALOGPS 2.1 Log10S (cLogS), and minimum Log10S (cLogS) between pH values of 3 – 7.5 calculated using VolSurf+ (minVSLgS 3–7.5).
Binning of compounds #1
For analysis of all solubility indices (cLogS, MSol, MLogSM, and minVSLgS 3–7.5), data for compounds in BDDCS classes 0, 1 and 3 (high solubility) were combined and those in BDDCS classes 2 and 4 (low solubility), were combined. The resulting two groups were (1) BDDCSHS and (2) BDDCSLS, respectively. pDose (−Log10 highest strength dose in molar units) data was obtained (Benet et al., 2011) for the compounds in these groups. The highest strength dose values were obtained either from the product label or from the reported values in literature (Benet et al., 2011).
2.2 Receiver operating characteristic (ROC) curve analysis
ROC curve analysis was used to determine a statistically significant threshold value for all solubility related parameters that would distinguish the compounds in the BDDCSHS group from those in the BDDCSLS group, using the ROC curve toolbox in SigmaPlot 11.0 (Systat Software, San Jose, CA). ROC curve analysis is a statistical method that computes a sensitivity and a specificity value for each potential TV where sensitivity is defined as the ratio of positives selected by the test for the true positives and specificity is defined as the ratio of negatives selected by the test for the true negatives (Bewick et al., 2004). The ROC curve is a plot of all potential threshold values where sensitivity values are plotted against the respective values of 1 – specificity (Hanley and McNeil, 1982). If the area under the curve (AUC) of the ROC curve is 1, then there is 100% sensitivity and specificity, whereas AUC < 0.5 is considered as the result of chance and statistical randomness. The generally accepted criteria for the selection of a statistically significant TV is when sensitivity, specificity, and AUC values are greater than 0.8 (Galley, 2004; Yang et al., 2009; Yang et al., 2010). The most optimal TV is the one closest to the top left corner of the ROC curve, which has the highest sensitivity and specificity values.
For the purpose of the present study, the BDDCSHS group represented the true positives (P+) and the BDDCSLS group represented the true negatives (P−). Positives according to the test (T+) refer to the compounds having a value greater than a certain threshold value for the test parameter, whereas negatives according to the test (T−) refer to compounds having a certain parameter value less than a certain threshold value for the test parameter.
For a given TV, sensitivity, specificity, and AUC values greater than 0.8 implies that a probability for the occurrence of true positives is greater than 80 % and a probability for the occurrence of false positives and false negatives is less than 20 %. Thus, in 80 % of cases true positives will be distinguished from the true negatives (Yang et al., 2009; Yang et al., 2010). Standard error of the test and 95 % confidence interval about sensitivity, specificity, and AUC values were also computed.
2.3 Comparison of the proposed methods with BDDCS and BCS
Binning of compounds #2
Once the TV of MLogSM and MSol were determined using ROC analysis for the compounds in the BDDCSHS and BDDCSLS groups, four new groups were created:
Compounds with MLogSM > TV (MLogSM_HS)
Compounds with MLogSM ≤ TV (MLogSM_LS)
Compounds with MSol > TV (MSol_HS)
Compounds with MSol ≤ TV (MSol_LS)
Percent of correctly classified compounds in all four groups were determined by comparing the results with BDDCSHS and BDDCSLS classification data to determine the performance of our proposed methods, namely:
Percent of correctly classified compounds in MLogSM_HS compared with BDDCSHS
Percent of correctly classified compounds in MLogSM_LS compared with BDDCSLS
Percent of correctly classified compounds in MSol_HS compared with BDDCSHS
Percent of correctly classified compounds in MSol_LS compared with BDDCSLS
2.4 External Validation of Methods
We obtained a second database of 185 orally administered drugs from the literature (Dahan et al., 2013). We excluded 77 compounds that were present in both datasets and used an independent set of 108 compounds for external validation of our method. In their study, Dahan et al. had predicted solubility (mg/mL) values using several regression models consisting of in silico and/or in vitro properties such as cLogP and melting point (Dahan et al., 2013). Moreover, the BCS solubility classification was then carried out using the dose number criteria (dose number equation) (Dahan et al., 2013) similar to the BDDCS method (Benet et al., 2011). Of all in silico methods evaluated, solubility classification using cLogP (calculated using BioLoom 5.0), experimental melting point, and reported highest strength dose (in silico method, ISM) was in closest agreement with the solubility classification using the reference solubility (RFS) (Dahan et al., 2013).
Binning of compounds #3
For external validation of our method (MSol), 108 compounds were divided into following groups:
Compounds with high solubility according to reference solubility (RFSHS)
Compounds with low solubility according to reference solubility (RFSLS)
Compounds with high solubility according to in silico method (ISMHS)
Compounds with low solubility according to in silico method (ISMLS)
Binning of compounds #4
108 compounds were divided into two groups:
-
(1)
Compounds with MSol > threshold value – Validation MSol_HS
-
(2)
Compounds with MSol ≤ threshold value – Validation MSol_LS
The following comparisons were also made to evaluate the performance for our method:
-
(5)
Percent of correctly classified compounds in ISMHS compared with RFSHS
-
(6)
Percent of correctly classified compounds in ISMLS compared with RFSLS
-
(7)
Percent of correctly classified compounds in Validation MSol_HS compared with RFSHS
-
(8)
Percent of correctly classified compounds in Validation MSol_LS compared with RFSLS
Hypothesis testing
We further computed descriptive statistics for pDose, MLogSM, and MSol of compounds in groups BDDCSHS and BDDCSLS. We compared means and medians using a two-sample t-test and Mann-Whitney rank test for medians, respectively, to test the hypothesis that the respective means and medians of BDDCSHS are statistically significantly greater than BDDCSLS using in Minitab® 16 Statistical Software (Minitab Inc., State College, PA).
3. Results
3.1 Receiver operating characteristic (ROC) curve analysis
Using ROC curve analysis, we determined statistically significant threshold values for MLogSM and MSol to distinguish compounds with high solubility (BDDCSHS; N MLogSM = 433 and NMSol = 433) from compounds with low solubility (BDDCSLS; N MLogSM = 201 and N MSol = 202). The threshold values of MLogSM and MSol with highest values of sensitivity and specificity are: −3.05 (SE = 0.008; P–value < 0.0001) and 0.3 mg/mL (SE = 0.008 and p–value < 0.0001), respectively. The ROC curve of MLogSM exhibited a threshold value of −3.05 (Figure 1A), sensitivity = 0.86 (95% CI = 0.83 – 0.89), specificity = 0.84 (95 % CI = 0.81 – 0.87), and AUC = 0.93 (95 % CI = 0.89 – 0.97). ROC curve analysis of MSol provided a threshold value of 0.3 mg/ml (Figure 1B) with a sensitivity = 0.86 (95 % CI = 0.83 – 0.89), specificity = 0.84 (95 % CI = 0.81 – 0.87), and AUC = 0.93 (95 % CI = 0.89 – 0.97). Using ROC curve analysis, statistically significant threshold values for minVSLgS 3–7.5 and cLogS could not be determined (not shown). MSol was also log-transformed (MLogS), but unlike MLogSM, a statistically significant threshold value could not be computed for MLogS.
Figure 1.

Receiver operating characteristic (ROC) curve (Sensitivity vs. 1 – Specificity) of potential threshold values of (A) MLogSM [AUC = 0.93, sensitivity = 0.86, specificity = 0.84, P–value < 0.0001] and (B) MSol [AUC = 0.93, sensitivity = 0.86, specificity = 0.84, P–value < 0.0001].
3.2 Comparison of the proposed methods with BDDCS and BCS
Using the MLogSM threshold value of −3.05 for the solubility classification and comparing the results with the reported BDDCSHS and BDDCSLS solubility classes of compounds, it was found that 86% of compounds were correctly classified in MLogSM_HS (N = 408) and MLogSM_LS (N = 226) groups. Similarly, using the MSol threshold value of 0.3 mg/mL, 86% and 84% of compounds were correctly classified in MSol_HS (N = 401) and MSol_LS (N = 234) groups, respectively. Table 1 lists results of all 635 compounds. Moreover, TV of MLogSM and MSol predicted solubility classes of 617 (97.4%) compounds identically (Table 1). Seventeen compounds for which the predicted solubility classes by the two methods were different are listed in table 2. Of these, 10 and 7 compounds, respectively, were predicted correctly by threshold values of MSol and MLogSM. Potential reasons for this differences can be attributed to (1) poor correlation between MSol and MLogSM (Pearson’s correlation coefficient, r = 0.3) and (2) absence of correlation between molecular weight and solubility of compounds. These results indicate that both solubility indices (MLogSM or MSol) have equally strong prediction power and either can be used for solubility classification of new molecular entities.
Table 1.
Solubility classification of compounds according to BDDCS (BDDCSHS/BDDCSLS) (from Benet et al, 2011) and ROC curve threshold values (TV) of MSol and MLogSM. (H is high solubility and L is low solubility)
| Generic Name | BDDCS Solubility Class a | MSol a (mg/mL) | ROC TV (0.3 mg/mL) | MLogSM a | ROC TV (−3.05) |
|---|---|---|---|---|---|
| 10-Hydroxy-Carbamazepine | L | 0.045 | L | −3.75 | L |
| Abacavir Sulfate | H | 77 | H | −0.57 | H |
| Acecainide; N-Acetyl Procainamide | H | 50 | H | −0.74 | H |
| Acetaminophen; Paracetamol | H | 23.7 | H | −0.80 | H |
| Acetazolamide | L | 0.64 | H | −2.54 | H |
| Acetohexamide | H | 3.43 | H | −1.98 | H |
| Acetylsalicylic Acid; Aspirin | H | 10 | H | −1.26 | H |
| Acrivastine | H | 0.7 | H | −2.70 | H |
| Acyclovir | L | 2.5 | H | −1.95 | H |
| Adefovir Dipivoxil | H | 0.4 | H | −2.92 | H |
| Adenosine | H | 5 | H | −1.73 | H |
| Aliskiren | H | 350 | H | −0.20 | H |
| Allopurinol | L | 0.569 | H | −2.38 | H |
| Alosetron | H | 61 | H | −0.68 | H |
| Alprazolam | H | 0.073 | L | −3.63 | L |
| Alprenolol | H | 50 | H | −0.70 | H |
| Alvimopan | H | 0.1 | L | −3.63 | L |
| Amantadine | H | 50 | H | −0.48 | H |
| Ambrisentan | H | 0.06 | L | −3.80 | L |
| Ambroxol | H | 10.9 | H | −1.52 | H |
| Amiloride | H | 50 | H | −0.66 | H |
| Aminocaproic Acid | H | 333 | H | 0.40 | H |
| Aminophenazone; Aminopyrine | H | 55.55 | H | −0.62 | H |
| Amiodarone Hydrochloride | L | 0.7 | H | −2.96 | H |
| Amitriptyline Hydrochloride | H | 1000 | H | 0.50 | H |
| Amoxicillin | H | 3.5 | H | −2.02 | H |
| Amphetamine Sulfate | H | 30 | H | −0.65 | H |
| Amphotericin B | L | 0.1 | L | −3.97 | L |
| Ampicillin | H | 7.8 | H | −1.65 | H |
| Amprenavir | L | 0.04 | L | −4.10 | L |
| Anastrozole | H | 0.5 | H | −2.77 | H |
| Anhydrovinblastine; Anhydrovincaleukoblastine | H | 10 | H | −1.90 | H |
| Anidulafungin | L | 0.05 | L | −4.36 | L |
| Antipyrine; Phenazone | H | 1700 | H | 0.96 | H |
| Apomorphine | H | 20 | H | −1.13 | H |
| Aripiprazole | L | 0.0001 | L | −6.65 | L |
| Atenolol | H | 24.8 | H | −1.03 | H |
| Atomoxetine | H | 27.8 | H | −0.96 | H |
| Atorvastatin Calcium | L | 0.0000204 | L | −7.44 | L |
| Atropine (DL) | H | 0.002 | L | −5.16 | L |
| Azacitidine | H | 89 | H | −0.44 | H |
| Azapropazone; Apazone | L | 0.0615 | L | −3.69 | L |
| Azathioprine | H | 10 | H | −1.44 | H |
| Azithromycin | H | 39 | H | −1.28 | H |
| Azlocillin | H | 50 | H | −0.97 | H |
| Aztreonam | H | 10 | H | −1.64 | H |
| Baclofen | H | 2.1 | H | −2.01 | H |
| Bambuterol | H | 33 | H | −1.05 | H |
| Benazepril | H | 78 | H | −0.74 | H |
| Bendroflumethiazide | H | 0.108 | L | −3.59 | L |
| Benidipine | H | 1.9 | H | −2.45 | H |
| Benznidazole | H | 0.4 | H | −2.81 | H |
| Bepridil | H | 5 | H | −1.87 | H |
| Beraprost | H | 19 | H | −1.32 | H |
| Betamethasone | H | 0.066 | L | −3.77 | L |
| Betaxolol | H | 0.451 | H | −2.83 | H |
| Bevantolol | L | 0.1843 | L | −3.27 | L |
| Bicalutamide | L | 0.005 | L | −4.93 | L |
| Bimatoprost | H | 0.8 | H | −2.72 | H |
| Biotin | H | 0.22 | L | −3.05 | L |
| Biperiden | H | 1 | H | −2.49 | H |
| Bleomycin A2 | H | 20 | H | −1.85 | H |
| Bopindolol | H | 3.3 | H | −2.06 | H |
| Bortezomib | H | 3.3 | H | −2.07 | H |
| Bosentan | L | 0.001 | L | −5.74 | L |
| Bretylium | H | 50 | H | −0.69 | H |
| Brimonidine | H | 1.5 | H | −2.29 | H |
| Bromazepam | H | 0.17 | L | −3.27 | L |
| Bromocriptine | H | 0.8 | H | −2.91 | H |
| Bromperidol | H | 0.09 | L | −3.67 | L |
| Budesonide | H | 0.02 | L | −4.33 | L |
| Bumetanide | H | 0.1 | L | −3.56 | L |
| Bupivacaine | H | 0.17 | L | −3.23 | L |
| Buprenorphine Hydrochloride | H | 17 | H | −1.47 | H |
| Bupropion | H | 312 | H | 0.11 | H |
| Buspirone | L | 0.0214 | L | −4.26 | L |
| Busulfan (Busulphan) | H | 0.1 | L | −3.39 | L |
| Butorphanol | H | 2 | H | −2.21 | H |
| Cadralazine | H | 1.3 | H | −2.34 | H |
| Caffeine | H | 21.5 | H | −0.96 | H |
| Candesartan Cilexetil | L | 0.05 | L | −4.09 | L |
| Capecitabine | H | 26 | H | −1.14 | H |
| Capsaicin | L | 0.06 | L | −3.71 | L |
| Captopril | H | 160 | H | −0.13 | H |
| Carbamazepine | L | 0.256 | L | −2.97 | H |
| Carbamazepine 10,11Epoxide | L | 0.1 | L | −3.40 | L |
| Carbenicillin | H | 50 | H | −0.88 | H |
| Carbidopa | H | 2.5 | H | −1.96 | H |
| Carboplatin | H | 14 | H | −1.42 | H |
| Carmustine | H | 3.8 | H | −1.75 | H |
| Carvedilol | L | 0.01 | L | −4.61 | L |
| Cefaclor | H | 8.59 | H | −1.63 | H |
| Cefadroxil | H | 14.2 | H | −1.41 | H |
| Cefamandole | H | 333 | H | −0.14 | H |
| Cefazolin | H | 33 | H | −1.14 | H |
| Cefditoren Pivoxil | L | 0.08 | L | −3.89 | L |
| Cefixime | L | 0.05511 | L | −3.92 | L |
| Cefmetazole Sodium | H | 0.0942 | L | −3.70 | L |
| Cefodizime | H | 270 | H | −0.34 | H |
| Cefoxitin | H | 1000 | H | 0.37 | H |
| Cefpodoxime Proxetil | L | 0.3 | L | −3.27 | L |
| Cefprozil | L | 0.055 | L | −3.85 | L |
| Cefsulodin | H | 50 | H | −1.03 | H |
| Ceftazidime | H | 5 | H | −2.04 | H |
| Ceftibuten | L | 0.08 | L | −3.71 | L |
| Ceftriaxone | H | 400 | H | −0.14 | H |
| Cefuroxime | H | 200 | H | −0.33 | H |
| Celecoxib | L | 0.005 | L | −4.88 | L |
| Celiprolol | H | 151 | H | −0.40 | H |
| Cephalexin | H | 12 | H | −1.46 | H |
| Cephalothin Sodium | H | 50 | H | −0.92 | H |
| Cephradine | H | 26 | H | −1.13 | H |
| Cerivastatin | H | 195 | H | −0.37 | H |
| Cetirizine | H | 0.101 | L | −3.59 | L |
| Cetrorelix | H | 8 | H | −2.25 | H |
| Chloral Hydrate | H | 8300 | H | 1.70 | H |
| Chlorambucil | H | 12 | H | −1.40 | H |
| Chloramphenicol | H | 2.5 | H | −2.11 | H |
| Chlordiazepoxide | H | 2 | H | −2.18 | H |
| Chlormethiazole; Clomethiazole | H | 10 | H | −1.21 | H |
| Chloroquine | H | 100 | H | −0.50 | H |
| Chlorothiazide | L | 0.52 | H | −2.75 | H |
| Chlorpromazine | H | 400 | H | 0.10 | H |
| Chlorpropamide | H | 2.2 | H | −2.10 | H |
| Chlorthalidone | L | 0.27 | L | −3.10 | L |
| Chlorzoxazone | L | 0.25 | L | −2.83 | H |
| Ciclesonide | L | 0.0002 | L | −6.43 | L |
| Cidofovir | H | 170 | H | −0.22 | H |
| Cilastatin | H | 25 | H | −1.16 | H |
| Cilazapril | H | 1 | H | −2.62 | H |
| Cilostazol | L | 0.003 | L | −5.09 | L |
| Cimetidine | H | 6.2 | H | −1.61 | H |
| Cinacalcet | L | 0.1 | L | −3.55 | L |
| Ciprofloxacin | L | 0.15 | L | −3.34 | L |
| Cisapride | L | 0.0027 | L | −5.24 | L |
| Cisplatin | H | 2.53 | H | −2.07 | H |
| Citalopram | L | 0.031 | L | −4.02 | L |
| Clarithromycin | H | 2 | H | −2.57 | H |
| Clemastine | H | 2.3 | H | −2.17 | H |
| Clindamycin Hydrochloride Hydrate | H | 40 | H | −1.08 | H |
| Clobazam | H | 0.188 | L | −3.20 | L |
| Clodronic Acid | L | 0.395 | H | −2.79 | H |
| Clofarabine | H | 1 | H | −2.48 | H |
| Clofazimine | L | 0.001 | L | −5.68 | L |
| Clofibric Acid | H | 45 | H | −0.68 | H |
| Clomiphene Citrate | H | 1.11 | H | −2.73 | H |
| Clonazepam | H | 0.1 | L | −3.50 | L |
| Clopidogrel Bisulfate | L | 0.05078 | L | −3.80 | L |
| Clotrimazole | L | 0.003 | L | −5.06 | L |
| Cloxacillin | L | 0.0139 | L | −4.50 | L |
| Clozapine | L | 0.0118 | L | −4.44 | L |
| Cocaine | H | 1.6 | H | −2.28 | H |
| Codeine Monohydrate | H | 435 | H | 0.14 | H |
| Colchicine | H | 45 | H | −0.95 | H |
| Conivaptan Hydrochloride | L | 0.15 | L | −3.55 | L |
| Cortisone | H | 0.28 | L | −3.11 | L |
| Cromolyn | H | 210 | H | −0.35 | H |
| Cyanocobalamin (Vitamin B12) | H | 12.5 | H | −2.04 | H |
| Cyclizine | H | 8.7 | H | −1.49 | H |
| Cyclobenzaprine | H | 200 | H | −0.14 | H |
| Cyclophosphamide | H | 40 | H | −0.81 | H |
| Cycloserine | H | 100 | H | −0.01 | H |
| Cyclosporine | L | 0.008 | L | −5.18 | L |
| Cyproheptadine | H | 3.636 | H | −1.90 | H |
| Cyproterone Acetate | L | 0.0021 | L | −5.30 | L |
| Dabigatran Etexilate | H | 1.8 | H | −2.54 | H |
| Dacarbazine | H | 4.2 | H | −1.64 | H |
| Dactinomycin (Actinomycin D) | H | 0.5 | H | −3.40 | L |
| Danazol | L | 0.0009 | L | −5.57 | L |
| Dantrolene | H | 2 | H | −2.20 | H |
| Dapsone | L | 0.2 | L | −3.09 | L |
| Daptomycin | H | 1000 | H | −0.21 | H |
| Darunavir | L | 0.15 | L | −3.56 | L |
| Daunorubicin | L | 0.0392 | L | −4.13 | L |
| Debrisoquine | H | 29 | H | −0.78 | H |
| Delavirdine | L | 0.00081 | L | −5.75 | L |
| Demeclocycline | H | 1.5 | H | −2.49 | H |
| Desloratadine | L | 0.000077 | L | −6.61 | L |
| Desmethyldiazepam (Nordazepam) | H | 0.057 | L | −3.68 | L |
| Desogestrel | H | 0.32 | H | −2.99 | H |
| Desvenlafaxine | H | 572 | H | 0.34 | H |
| Dexamethasone | H | 0.092 | L | −3.63 | L |
| Dexrazoxane | H | 11 | H | −1.39 | H |
| Dextroamphetamine | H | 1 | H | −2.13 | H |
| Dextromethorphan Hydrobromide | H | 15 | H | −1.26 | H |
| Dezocine | H | 20 | H | −1.09 | H |
| Diazepam | H | 0.057 | L | −3.70 | L |
| Diazoxide | L | 0.15 | L | −3.19 | L |
| Diclofenac | H | 9 | H | −1.52 | H |
| Dicoumarol | L | 0.128 | L | −3.42 | L |
| Didanosine | H | 27.3 | H | −0.94 | H |
| Diethylcarbamazine Citrate | H | 63.7 | H | −0.50 | H |
| Digitoxin | H | 0.01 | L | −4.88 | L |
| Digoxin | H | 0.986 | H | −2.90 | H |
| Dihydroquinidine; Hydroquinidine | H | 11.1 | H | −1.51 | H |
| Dilevalol | H | 16 | H | −1.31 | H |
| Diphenhydramine | H | 1000 | H | 0.59 | H |
| Dipyridamole | L | 0.007 | L | −4.86 | L |
| Disopyramide | H | 1 | H | −2.53 | H |
| Disulfiram | L | 0.2 | L | −3.17 | L |
| Docetaxel | L | 0.0065 | L | −5.09 | L |
| Domperidone | L | 0.006 | L | −4.85 | L |
| Donepezil | L | 0.0029 | L | −5.12 | L |
| Dorzolamide Hydrochloride | H | 3.9 | H | −1.92 | H |
| Dosulepin; Dothiepin | H | 500 | H | 0.23 | H |
| Doxorubicin | H | 10 | H | −1.74 | H |
| Dronedarone | L | 0.5 | H | −3.05 | L |
| Edetate Calcium Disodium | H | 91 | H | −0.51 | H |
| Efavirenz | L | 0.005 | L | −4.80 | L |
| Eletriptan Hydrobromide | H | 4 | H | −1.98 | H |
| Emtricitabine | H | 112 | H | −0.34 | H |
| Enalapril | H | 25 | H | −1.18 | H |
| Enfuvirtide | H | 1000 | H | −0.65 | H |
| Enoxacin | L | 0.6 | H | −2.73 | H |
| Entacapone | L | 0.0166 | L | −4.26 | L |
| Entecavir | H | 2.4 | H | −2.06 | H |
| Eprosartan | L | 0.08 | L | −3.72 | L |
| Eptifibatide | H | 65 | H | −1.11 | H |
| Ergonovine; Ergometrine | H | 10 | H | −1.51 | H |
| Ergotamine Tartrate | H | 2 | H | −2.82 | H |
| Erlotinib Hydrochloride | L | 0.4 | H | −2.99 | H |
| Erythromycin (Base) | H | 2.1 | H | −2.54 | H |
| Erythromycin Lactobionate | H | 20 | H | −1.73 | H |
| Erythromycin Stearate | L | 0.33 | H | −3.49 | L |
| Esmolol | H | 20 | H | −1.17 | H |
| Esomeprazole Magnesium | H | 0.5 | H | −2.84 | H |
| Estazolam | L | 0.0015 | L | −5.29 | L |
| Estradiol | H | 0.09 | L | −3.48 | L |
| Ethosuximide | H | 39.2 | H | −0.56 | H |
| Etodolac | L | 0.01 | L | −4.46 | L |
| Etomidate | L | 0.045 | L | −3.73 | L |
| Etonogestrel | H | 0.51 | H | −2.80 | H |
| Etoposide | H | 0.22 | L | −3.43 | L |
| Etoricoxib; Arcoxia | L | 0.14 | L | −3.41 | L |
| Everolimus | H | 0.01 | L | −4.98 | L |
| Exenatide | H | 25 | H | −2.22 | H |
| Famciclovir | H | 250 | H | −0.11 | H |
| Febuxostat | L | 0.013 | L | −4.39 | L |
| Felbamate | L | 0.7 | H | −2.53 | H |
| Felodipine | L | 0.001 | L | −5.58 | L |
| Fenofibrate | L | 0.0008 | L | −5.65 | L |
| Fentanyl | H | 25 | H | −1.13 | H |
| Ferrous Sulfate | H | 570 | H | 0.57 | H |
| Fesoterodine | H | 256 | H | −0.21 | H |
| Finasteride | H | 0.043 | L | −3.94 | L |
| Flecainide | H | 48.4 | H | −0.93 | H |
| Fleroxacin | L | 0.87 | H | −2.63 | H |
| Fluconazole | H | 1 | H | −2.49 | H |
| Flucytosine | H | 15 | H | −0.93 | H |
| Fludarabine 5′-Monophosphate | H | 3.53 | H | −2.01 | H |
| Fludrocortisone Acetate | H | 0.14 | L | −3.48 | L |
| Flufenamic Acid | L | 0.0265 | L | −4.03 | L |
| Flumazenil | H | 0.128 | L | −3.37 | L |
| Flunarizine | L | 0.0165 | L | −4.39 | L |
| Flunitrazepam | H | 0.004 | L | −4.89 | L |
| Fluorouracil | H | 12.2 | H | −1.03 | H |
| Fluoxetine | H | 15.2 | H | −1.31 | H |
| Fluphenazine Hydrochloride | L | 0.031 | L | −4.22 | L |
| Flurazepam | H | 500 | H | 0.11 | H |
| Flutamide | L | 0.0095 | L | −4.46 | L |
| Fluticasone Propionate | L | 0.00051 | L | −5.99 | L |
| Fluvastatin Sodium | H | 50 | H | −0.92 | H |
| Fluvoxamine | H | 14.869 | H | −1.33 | H |
| Folic Acid | L | 0.0016 | L | −5.44 | L |
| Formoterol Fumarate | H | 0.66 | H | −2.72 | H |
| Fosamprenavir Calcium | L | 0.31 | H | −3.28 | L |
| Fosfomycin Tromethamine | H | 50 | H | −0.44 | H |
| Fosinopril | L | 0.022 | L | −4.41 | L |
| Fosinoprilat | L | 0.01 | L | −4.64 | L |
| Fulvestrant | L | 0.001 | L | −5.78 | L |
| Gabapentin | H | 10 | H | −1.23 | H |
| Galantamine | H | 10 | H | −1.46 | H |
| Ganciclovir Sodium | H | 6 | H | −1.66 | H |
| Gefitinib | L | 0.0017 | L | −5.42 | L |
| Gemcitabine Hydrochloride | H | 15 | H | −1.24 | H |
| Gemfibrozil | L | 0.019 | L | −4.12 | L |
| Gentamicin C1 Sulfate | H | 50 | H | −0.98 | H |
| Glibornuride | H | 0.2 | L | −3.26 | L |
| Gliclazide | L | 0.0039 | L | −4.92 | L |
| Glimepiride | L | 0.0012 | L | −5.61 | L |
| Glyburide (Glibenclamide) | L | 0.004 | L | −5.09 | L |
| Granisetron | H | 100 | H | −0.49 | H |
| Guanabenz | H | 11 | H | −1.32 | H |
| Guanfacine Hydrochloride | H | 1 | H | −2.39 | H |
| Haloperidol | L | 0.037 | L | −4.01 | L |
| Heparin; Enoxaparin | H | 50 | H | −1.36 | H |
| Hexobarbital | H | 640 | H | 0.43 | H |
| Hydralazine Hydrochloride | H | 44.2 | H | −0.65 | H |
| Hydrochlorothiazide | H | 0.6 | H | −2.70 | H |
| Hydrocodone | H | 62.5 | H | −0.68 | H |
| Hydrocortisone; Cortisol | H | 0.42 | H | −2.94 | H |
| Hydroflumethiazide | H | 0.3 | L | −3.04 | H |
| Hydromorphone | H | 10 | H | −1.46 | H |
| Hydroxychloroquine Sulfate | H | 200 | H | −0.23 | H |
| Hydroxyurea | H | 50 | H | −0.18 | H |
| Hydroxyzine | H | 700 | H | 0.27 | H |
| Hyoscyamine; L-Atropine | H | 3.56 | H | −1.91 | H |
| Ibuprofen | L | 0.038 | L | −3.73 | L |
| Ibutilide | H | 100 | H | −0.58 | H |
| Ifosfamide | H | 100 | H | −0.42 | H |
| Iloperidone | L | 0.03 | L | −4.15 | L |
| Iloprost | H | 1 | H | −2.56 | H |
| Imatinib Mesylate | L | 1 | H | −2.69 | H |
| Imipenem | H | 10 | H | −1.48 | H |
| Imiquimod | H | 0.6 | H | −2.60 | H |
| Inamrinone; Amrinone Lactate | H | 0.9 | H | −2.49 | H |
| Indapamide | H | 0.59 | H | −2.79 | H |
| Indinavir Sulfate | L | 0.015 | L | −4.61 | L |
| Indomethacin | L | 0.0025 | L | −5.16 | L |
| Iopanoic Acid; Iodopanoic Acid | L | 0.015 | L | −4.58 | L |
| Irbesartan | L | 0.08 | L | −3.73 | L |
| Irinotecan | H | 10 | H | −1.77 | H |
| Isoniazid | H | 153 | H | 0.05 | H |
| Isosorbide 2-Mononitrate | H | 1.1 | H | −2.24 | H |
| Isosorbide 5-Mononitrate | H | 1.1 | H | −2.24 | H |
| Isosorbide Dinitrate | H | 1.089 | H | −2.34 | H |
| Isradipine | L | 0.008 | L | −4.67 | L |
| Itraconazole | L | 0.000001 | L | −8.85 | L |
| Ivermectin | H | 4 | H | −2.34 | H |
| Ketamine | H | 200 | H | −0.08 | H |
| Ketanserin | L | 0.05 | L | −3.90 | L |
| Ketoconazole | L | 0.0069 | L | −4.89 | L |
| Ketoprofen | L | 0.18 | L | −3.15 | L |
| Ketorolac | H | 200 | H | −0.11 | H |
| Labetalol | H | 16 | H | −1.31 | H |
| Lacosamide; Erlosamide | H | 2 | H | −2.10 | H |
| Lamivudine | H | 70 | H | −0.52 | H |
| Lamotrigine | L | 0.17 | L | −3.18 | L |
| Lansoprazole | L | 0.00097 | L | −5.58 | L |
| Lapatinib Ditosylate | L | 0.001 | L | −5.76 | L |
| Latamoxef; Moxalactam | H | 50 | H | −1.02 | H |
| Latanoprost | L | 0.05 | L | −3.94 | L |
| Leflunomide | L | 0.023 | L | −4.07 | L |
| Lenalidomide | L | 0.00045 | L | −5.76 | L |
| Letrozole | H | 0.041 | L | −3.84 | L |
| Leucovorin; Folinic Acid | H | 500 | H | 0.02 | H |
| Leuprolide | H | 250 | H | −0.68 | H |
| Levalbuterol | H | 180 | H | −0.12 | H |
| Levetiracetam | H | 1040 | H | 0.79 | H |
| Levobupivacaine | H | 0.17 | L | −3.23 | L |
| Levocetirizine | H | 0.101 | L | −3.59 | L |
| Levodopa | H | 1.65 | H | −2.08 | H |
| Levofloxacin | H | 50 | H | −0.86 | H |
| Levonorgestrel | L | 0.0014 | L | −5.35 | L |
| Lidocaine | H | 3.58 | H | −1.82 | H |
| Lincomycin | H | 50 | H | −0.91 | H |
| Linezolid | H | 8 | H | −1.62 | H |
| Lisinopril | H | 97 | H | −0.62 | H |
| Lithium Carbonate | H | 13 | H | −0.75 | H |
| Lomefloxacin | H | 1.64 | H | −2.33 | H |
| Loperamide | H | 1.4 | H | −2.53 | H |
| Loracarbef | H | 41 | H | −0.93 | H |
| Loratadine | L | 0.005 | L | −4.88 | L |
| Lorazepam | H | 0.08 | L | −3.60 | L |
| Lorcainide Hydrochloride | H | 2.4 | H | −2.19 | H |
| Losartan Potassium | L | 0.048 | L | −3.98 | L |
| Lovastatin | L | 0.0004 | L | −6.00 | L |
| Maprotiline | H | 3.134 | H | −1.95 | H |
| Mecamylamine | H | 212 | H | 0.10 | H |
| Medroxyprogesterone Acetate | L | 0.022 | L | −4.24 | L |
| Mefenamic Acid | L | 0.08 | L | −3.48 | L |
| Megestrol Acetate | L | 0.002 | L | −5.28 | L |
| Melatonin | H | 0.1 | L | −3.37 | L |
| Meloxicam | L | 0.012 | L | −4.47 | L |
| Melphalan | H | 0.1 | L | −3.48 | L |
| Meperidine; Pethidine | H | 3.22 | H | −1.89 | H |
| Mepivacaine | H | 2.4 | H | −2.01 | H |
| Meprobamate | H | 3.4 | H | −1.81 | H |
| Mesalamine; Mesalazine | L | 1 | H | −2.19 | H |
| Metaxalone | L | 0.3 | L | −2.87 | H |
| Methadone | H | 120 | H | −0.41 | H |
| Methamphetamine | H | 1000 | H | 0.83 | H |
| Methaqualone | L | 0.3 | L | −2.92 | H |
| Methazolamide | H | 0.704 | H | −2.53 | H |
| Methicillin | H | 300 | H | −0.10 | H |
| Methohexital | H | 100 | H | −0.42 | H |
| Methotrexate | H | 0.45 | H | −3.00 | H |
| Methyldopa | H | 10 | H | −1.32 | H |
| Methylprednisolone | H | 0.3236 | H | −3.06 | L |
| Metoclopramide | H | 0.2 | L | −3.18 | L |
| Metocurine Iodide | H | 3 | H | −2.34 | H |
| Metoprolol | H | 1000 | H | 0.57 | H |
| Metronidazole | H | 10 | H | −1.23 | H |
| Mianserin | H | 3.4 | H | −1.89 | H |
| Miconazole | L | 0.89 | H | −2.67 | H |
| Midazolam Hydrochloride | H | 10.3 | H | −1.55 | H |
| Miglustat | H | 1000 | H | 0.66 | H |
| Milrinone | H | 1 | H | −2.32 | H |
| Minocycline Hydrochloride | H | 50 | H | −0.96 | H |
| Minoxidil | H | 2.2 | H | −1.98 | H |
| Mirtazapine | H | 0.5 | H | −2.72 | H |
| Mitoxantrone | H | 7.5 | H | −1.77 | H |
| Mizolastine | L | 0.013 | L | −4.52 | L |
| Morphine 6-Glucuronide | H | 1000 | H | 0.34 | H |
| Morphine hydrochloride | H | 57.14 | H | −0.75 | H |
| Moxifloxacin Hydrochloride | H | 27.5 | H | −1.20 | H |
| Mycophenolate Mofetil | L | 0.043 | L | −4.00 | L |
| Nabumetone | L | 0.015 | L | −4.18 | L |
| Nadolol | H | 30.4 | H | −1.01 | H |
| Nafarelin | H | 1 | H | −3.12 | L |
| Nalbuphine Hydrochloride | H | 35.5 | H | −1.00 | H |
| Nalidixic Acid | L | 0.054 | L | −3.63 | L |
| Nalmefene Hydrochloride | H | 124 | H | −0.44 | H |
| Naltrexone | H | 100 | H | −0.53 | H |
| Naproxen | L | 0.115 | L | −3.30 | L |
| Naratriptan | H | 35 | H | −0.98 | H |
| Nateglinide | L | 0.322 | H | −2.99 | H |
| Nefopam | H | 34 | H | −0.87 | H |
| Nelarabine | L | 1 | H | −2.47 | H |
| Neomycin B Sulfate | H | 6.3 | H | −2.05 | H |
| Neostigmine | H | 100 | H | −0.35 | H |
| Nevirapine | L | 0.1 | L | −3.43 | L |
| Niacin; Nicotinic Acid | H | 16.66 | H | −0.87 | H |
| Niacinamide; Nicotinamide | H | 1000 | H | 0.91 | H |
| Nicardipine | H | 7.9 | H | −1.78 | H |
| Niclosamide | L | 0.013 | L | −4.40 | L |
| Nicorandil | H | 4.2 | H | −1.70 | H |
| Nifedipine | L | 0.006 | L | −4.76 | L |
| Nilvadipine | L | 0.0013 | L | −5.47 | L |
| Nimesulide | L | 0.014 | L | −4.34 | L |
| Nimodipine | L | 0.0025 | L | −5.22 | L |
| Nitrazepam | L | 0.0254 | L | −4.04 | L |
| Nitrendipine | L | 0.0022 | L | −5.21 | L |
| Nitrofurantoin | L | 0.19 | L | −3.10 | L |
| Nitroglycerin | H | 0.8 | H | −2.45 | H |
| Nizatidine | H | 21.65 | H | −1.18 | H |
| Norethindrone | H | 0.01 | L | −4.47 | L |
| Norethindrone Acetate | L | 0.005 | L | −4.83 | L |
| Norfloxacin | L | 0.75 | H | −2.63 | H |
| Norgestimate | H | 0.02 | L | −4.27 | L |
| Norgestrel | H | 0.002 | L | −5.19 | L |
| Nystatin | H | 4 | H | −2.36 | H |
| Ofloxacin | H | 3.54 | H | −2.01 | H |
| Olanzapine | L | 0.01 | L | −4.49 | L |
| Olmesartan Medoxomil | H | 2 | H | −2.45 | H |
| Olopatadine Hydrochloride | H | 2 | H | −2.23 | H |
| Omeprazole | H | 0.5 | H | −2.84 | H |
| Ondansetron | H | 5.7 | H | −1.71 | H |
| Orphenadrine | H | 10 | H | −1.43 | H |
| Oxaliplatin | H | 6 | H | −1.82 | H |
| Oxaprozin | L | 1.7 | H | −2.24 | H |
| Oxatomide | L | 0.043 | L | −4.00 | L |
| Oxazepam | L | 0.045 | L | −3.80 | L |
| Oxcarbazepine | L | 0.085 | L | −3.47 | L |
| Oxprenolol | H | 30.86 | H | −0.93 | H |
| Oxybutynin Hydrochloride | H | 0.8 | H | −2.69 | H |
| Oxycodone | H | 100 | H | −0.50 | H |
| Oxymorphone | H | 24 | H | −1.10 | H |
| Paliperidone | L | 0.01125 | L | −4.58 | L |
| P-Aminosalicylic Acid (PAS) | H | 142.85 | H | −0.03 | H |
| Paroxetine | H | 5.4 | H | −1.79 | H |
| Pefloxacin | H | 11.4 | H | −1.47 | H |
| Pemetrexed Disodium | H | 90 | H | −0.68 | H |
| Penciclovir | H | 170 | H | −0.17 | H |
| Penicillin V; Phenoxymethylpenicillin | L | 0.25 | L | −3.15 | L |
| Pentamidine | H | 100 | H | −0.53 | H |
| Pentazocine | L | 0.0449 | L | −3.80 | L |
| Pentostatin | H | 30 | H | −0.95 | H |
| Pentoxifylline | H | 191 | H | −0.16 | H |
| Perhexiline | L | 0.00006 | L | −6.67 | L |
| Phenacetin | L | 0.73 | H | −2.39 | H |
| Phenmetrazine | H | 2.5 | H | −1.85 | H |
| Phenobarbital | H | 1 | H | −2.37 | H |
| Phenylbutazone | H | 0.7 | H | −2.64 | H |
| Phenytoin Sodium | L | 0.02 | L | −4.14 | L |
| Pimozide | H | 0.008 | L | −4.76 | L |
| Pindolol | H | 7.9 | H | −1.50 | H |
| Piperacillin | H | 714.3 | H | 0.14 | H |
| Piperazine | H | 260 | H | 0.48 | H |
| Pirenzepine | H | 50 | H | −0.85 | H |
| Piroxicam | L | 0.0073 | L | −4.66 | L |
| Plerixafor | H | 10 | H | −1.70 | H |
| Posaconazole | L | 0.00005 | L | −7.15 | L |
| Potassium Chloride | H | 333.3 | H | 0.65 | H |
| Pramipexole | H | 0.2 | L | −3.02 | H |
| Pravastatin | H | 300 | H | −0.15 | H |
| Prazepam | L | 0.004 | L | −4.91 | L |
| Praziquantel | L | 0.4 | H | −2.89 | H |
| Prazosin | H | 1.4 | H | −2.44 | H |
| Prednisolone | H | 0.38 | H | −2.98 | H |
| Prednisone | L | 0.133 | L | −3.43 | L |
| Pregabalin | H | 33 | H | −0.68 | H |
| Primidone | L | 0.6 | H | −2.56 | H |
| Procainamide | H | 4 | H | −1.77 | H |
| Prochlorperazine | H | 0.1 | L | −3.57 | L |
| Progesterone | L | 0.007 | L | −4.65 | L |
| Proguanil | H | 9.09 | H | −1.45 | H |
| Promazine | H | 333.33 | H | 0.07 | H |
| Propafenone Hydrochloride | L | 0.093 | L | −3.56 | L |
| Propantheline Bromide | H | 50 | H | −0.87 | H |
| Propofol | L | 0.164 | L | −3.04 | H |
| Propoxyphene Napsylate | L | 0.0196 | L | −4.27 | L |
| Propranolol Hydrochloride | H | 50 | H | −0.71 | H |
| Propylthiouracil | H | 1.2 | H | −2.15 | H |
| Protriptyline | H | 50 | H | −0.72 | H |
| Pyrantel Pamoate | L | 0.5 | H | −2.62 | H |
| Pyrazinamide | H | 15 | H | −0.91 | H |
| Pyridostigmine | H | 100 | H | −0.26 | H |
| Pyrimethamine | H | 0.121 | L | −3.31 | L |
| Quetiapine Fumarate | H | 94 | H | −0.97 | H |
| Quinacrine; Mepacrine | H | 28.57 | H | −1.15 | H |
| Quinapril | L | 0.001 | L | −5.64 | L |
| Quinidine Sulfate Dihydrate | H | 11.1 | H | −1.85 | H |
| Quinine Bisulfate Heptahydrate | H | 111.1 | H | −0.69 | H |
| Raloxifene; Keoxifene | L | 0.013 | L | −4.56 | L |
| Ranitidine | H | 555 | H | 0.25 | H |
| Reboxetine | H | 8 | H | −1.59 | H |
| Regadenoson | H | 0.05 | L | −3.89 | L |
| Reserpine | H | 0.01 | L | −4.78 | L |
| Ribavirin | H | 142 | H | −0.24 | H |
| Ridogrel | H | 0.02 | L | −4.26 | L |
| Rifabutin | L | 0.19 | L | −3.65 | L |
| Rifaximin | L | 0.001 | L | −5.90 | L |
| Rimantadine Hydrochloride | H | 50 | H | −0.55 | H |
| Risperidone | H | 0.25 | L | −3.22 | L |
| Rizatriptan | H | 42 | H | −0.81 | H |
| Rofecoxib | L | 0.1 | L | −3.50 | L |
| Rolitetracycline | H | 1250 | H | 0.37 | H |
| Ropinirole | H | 133 | H | −0.29 | H |
| Ropivacaine | H | 53.8 | H | −0.71 | H |
| Rosiglitazone Maleate | H | 0.04 | L | −3.95 | L |
| Rotigotine | H | 5.6 | H | −1.75 | H |
| Roxithromycin | L | 0.1 | L | −3.92 | L |
| Rufinamide | L | 0.059 | L | −3.61 | L |
| Salicylic Acid | H | 2.51 | H | −1.74 | H |
| Saquinavir Methanesulfonate | L | 0.08 | L | −3.98 | L |
| Saxagliptin | H | 17.6 | H | −1.25 | H |
| Scopolamine | H | 666.67 | H | 0.34 | H |
| Secobarbital (Quinalbarbitone) | H | 1.1 | H | −2.34 | H |
| Sertraline Hydrochloride | H | 3.8 | H | −1.91 | H |
| Sibutramine | H | 2.9 | H | −1.98 | H |
| Sildenafil | H | 3.5 | H | −2.13 | H |
| Simvastatin | L | 0.03 | L | −4.14 | L |
| Sotalol | H | 137 | H | −0.30 | H |
| Sparfloxacin | H | 1.1 | H | −2.55 | H |
| Spectinomycin | H | 7.5 | H | −1.65 | H |
| Spironolactone | L | 0.022 | L | −4.28 | L |
| Stavudine | H | 83 | H | −0.43 | H |
| Streptomycin | H | 20 | H | −1.46 | H |
| Sulfadiazine | L | 0.13 | L | −3.28 | L |
| Sulfamethizole | L | 0.25 | L | −3.03 | H |
| Sulfamethoxazole | L | 0.392 | H | −2.81 | H |
| Sulfasalazine | L | 0.0024 | L | −5.22 | L |
| Sulfinpyrazone | L | 0.031 | L | −4.12 | L |
| Sulfisoxazole | L | 0.13 | L | −3.31 | L |
| Sulindac | L | 0.0028 | L | −5.10 | L |
| Sulindac Sulfide | L | 0.0028 | L | −5.08 | L |
| Sulpiride | H | 2.28 | H | −2.18 | H |
| Sumatriptan Succinate | H | 21.4 | H | −1.14 | H |
| Sunitinib Malate | H | 25 | H | −1.20 | H |
| Tacrolimus | L | 0.008 | L | −5.00 | L |
| Talinolol | H | 1.23 | H | −2.47 | H |
| Tamoxifen | H | 0.5 | H | −2.87 | H |
| Tazobactam Sodium | H | 50 | H | −0.78 | H |
| Telithromycin | L | 0.8 | H | −3.01 | H |
| Temazepam | H | 0.604 | H | −2.70 | H |
| Temsirolimus | H | 0.01 | L | −5.01 | L |
| Teniposide | L | 0.025 | L | −4.42 | L |
| Tenofovir Disoproxil | H | 13.4 | H | −1.59 | H |
| Tenoxicam | H | 0.803 | H | −2.62 | H |
| Terazosin | H | 24.2 | H | −1.20 | H |
| Terbutaline | H | 213 | H | −0.02 | H |
| Terfenadine | L | 0.006 | L | −4.90 | L |
| Testolactone | L | 0.027 | L | −4.05 | L |
| Testosterone | L | 0.0234 | L | −4.09 | L |
| Tetracycline | H | 1.7 | H | −2.42 | H |
| Tetracycline Hydrochloride | H | 10.9 | H | −1.64 | H |
| Thalidomide | L | 0.0525 | L | −3.69 | L |
| Theophylline | H | 8.3 | H | −1.34 | H |
| Thiabendazole | L | 0.05 | L | −3.60 | L |
| Thioguanine | H | 0.2 | L | −2.92 | H |
| Thiopental | H | 50 | H | −0.69 | H |
| Thioridazine | H | 1 | H | −2.57 | H |
| Thyroxine; Levothyroxine | L | 0.000585 | L | −6.12 | L |
| Tiagabine Hydrochloride | L | 0.03 | L | −4.10 | L |
| Ticarcillin | H | 1000 | H | 0.42 | H |
| Tigecycline | H | 295 | H | −0.29 | H |
| Timolol | H | 2.74 | H | −2.06 | H |
| Tinidazole | H | 20 | H | −1.09 | H |
| Tobramycin | H | 1000 | H | 0.33 | H |
| Tocainide | H | 10 | H | −1.28 | H |
| Tolazamide | L | 0.278 | L | −3.05 | L |
| Tolbutamide | L | 0.109 | L | −3.39 | L |
| Tolmetin | L | 0.22 | L | −3.07 | L |
| Tolterodine | H | 12 | H | −1.43 | H |
| Tolvaptan | L | 0.0005 | L | −5.95 | L |
| Topiramate | H | 9.8 | H | −1.54 | H |
| Topotecan | H | 1 | H | −2.62 | H |
| Toremifene | H | 0.38 | H | −3.03 | H |
| Torsemide; torasemide | L | 0.16 | L | ||
| Tranylcypromine Sulfate | H | 48 | H | −0.44 | H |
| Trazodone | L | 0.2 | L | −3.27 | L |
| Triamcinolone | H | 0.08 | L | −3.69 | L |
| Triamcinolone Acetonide | H | 0.114 | L | −3.58 | L |
| Triamterene | L | 0.029 | L | −3.94 | L |
| Triazolam | H | 0.045 | L | −3.88 | L |
| Triclabendazole | L | 0.0002 | L | −6.25 | L |
| Trifluoperazine | H | 50 | H | −0.91 | H |
| Trihexyphenidyl (Benzhexol) | H | 10 | H | −1.48 | H |
| Trimethoprim | H | 1.37 | H | −2.33 | H |
| Trimetrexate Glucuronate | H | 50 | H | −0.87 | H |
| Tropisetron | H | 11 | H | −1.41 | H |
| Trospium Chloride | H | 500 | H | 0.11 | H |
| Tubocurarine | H | 50 | H | −1.09 | H |
| Urapidil | H | 19 | H | −1.31 | H |
| Valacyclovir | H | 174 | H | −0.27 | H |
| Valganciclovir; Valcyte | H | 70 | H | −0.70 | H |
| Valproic Acid | H | 1.3 | H | −2.05 | H |
| Valsartan | L | 0.18 | L | −3.38 | L |
| Vancomycin | H | 50 | H | −1.46 | H |
| Vardenafil | H | 0.11 | L | −3.65 | L |
| Varenicline Tartrate | H | 0.2 | L | −3.02 | H |
| Vasopressin | H | 0.1 | L | −4.04 | L |
| Venlafaxine Hydrochloride | H | 572 | H | 0.31 | H |
| Verapamil Hydrochloride | H | 0.75 | H | −3.05 | L |
| Vinblastine | H | 10 | H | −1.91 | H |
| Vincristine | H | 10 | H | −1.92 | H |
| Vinorelbine Tartrate | H | 1000 | H | 0.11 | H |
| Vitamin A (Retinol) | L | 0.044 | L | −3.81 | L |
| Vitamin B1 (Thiamine) | H | 27 | H | −0.99 | H |
| Vitamin B2 (Riboflavin) | L | 0.11 | L | −3.53 | L |
| Vitamin B6 (Pyridoxine) | H | 222 | H | 0.12 | H |
| Vitamin C; Ascorbic Acid | H | 333 | H | 0.28 | H |
| Vitamin D3 | H | 0.1 | L | −3.59 | L |
| Voriconazole | L | 0.39 | H | −2.95 | H |
| Warfarin | L | 0.018 | L | −4.23 | L |
| Zalcitabine | H | 76.4 | H | −0.44 | H |
| Zanamivir | H | 18 | H | −1.27 | H |
| Zidovudine | H | 25 | H | −1.03 | H |
| Zileuton | L | 0.5 | H | −2.67 | H |
| Ziprasidone Hydrochloride | L | 0.00043 | L | −5.98 | L |
| Zolmitriptan | H | 20 | H | −1.16 | H |
| Zolpidem Tartrate | H | 23 | H | −1.13 | H |
| Zonisamide | H | 0.8 | H | −2.42 | H |
| Zopiclone | H | 0.12 | L | −3.51 | L |
Note:
Data was obtained from Benet et al. (Benet et al., 2011)
Table 2.
List of compounds with different solubility class when predicted by TV of MSol and MLogSM compared between the two proposed methods
| Generic Name | BDDCS Solubility Classification a | ROC TV MSol | ROC TV MLogSM |
|---|---|---|---|
| Carbamazepine | L | L | H |
| Chlorzoxazone | L | L | H |
| Dactinomycin | H | H | L |
| Dronedarone | L | H | L |
| Erythromycin Stearate | L | H | L |
| Fosamprenavir Calcium | L | H | L |
| Hydroflumethiazide | H | L | H |
| Metaxalone | L | L | H |
| Methaqualone | L | L | H |
| Methylprednisolone | H | H | L |
| Nafarelin | H | H | L |
| Pramipexole | H | L | H |
| Propofol | L | L | H |
| Sulfamethizole | L | L | H |
| Thioguanine | H | L | H |
| Varenicline Tartrate | H | L | H |
| Verapamil Hydrochloride | H | H | L |
Note: TV of MSol and MLogSM identically predicted the solubility class of the compounds that are not listed in this table and are listed in Table 1.
Data was obtained from Benet et al.(Benet et al., 2011).
Table 3 lists results of comparison of solubility classes with the two BCS solubility classification methods: (1) BCS according to literature reference solubility and (2) BCS using in silico solubility obtained from cLogP and experimental melting point, and reported highest strength dose of compounds (in silico approach). For 108 compounds that were evaluated, it was found that Dahan et al, (2013) had correctly classified 73% and 63% of compounds in ISMHS and ISMLS groups compared with the RFSHS and RFSLS groups. Using MSol of 0.3 mg/mL, we were able to correctly classify 81% and 95% of compounds in the validation MSol_HS and validation MSol_LS groups, respectively, when comparing with RFSHS and RFSLS groups. Moreover, our method was independent of the traditionally used dose number criteria.
Table 3.
Solubility classifications of 108 orally administered compounds from Dahan et al, 2013 according to literature reference solubility (RFSHS/ RFSLS), in silico solubility prediction (ISMHS/ ISMLS,utilizing cLogP, measured melting point, and highest strength dose), and ROC curve TV of MSol.
| Generic Name | MSol (mg/mL) | RFS solubility prediction | in Silico Solubility prediction | ROC TV MSol |
|---|---|---|---|---|
| Aceclofenac | 0.01 | L | L | L |
| Acetaminophen | 0.1 | L | H | L |
| Albendazole | 0.01 | L | L | L |
| Alibendol | 10 | H | H | H |
| Amiloride hydrochloride | 1 | H | H | H |
| Atropine sulfate | 1 | H | H | H |
| Azithromycin hydrate | 0.01 | L | L | L |
| Azulene sulfonate | 10 | H | H | H |
| Benazepril hydrochloride | 33 | H | H | H |
| Biperiden hydrochloride | 0.01 | H | H | L |
| Bisacodyl | 0.01 | L | H | L |
| Brotizolam | 0.01 | H | H | L |
| Cabergoline | 0.01 | L | L | L |
| Cetirizine hydrochloride | 33 | H | H | H |
| Chloroquine phosphate | 0.1 | L | L | L |
| Clonidine hydrochloride | 33 | H | H | H |
| Codeine phosphate | 1 | H | H | H |
| Cyclosporin A | 0.01 | L | L | L |
| Dapsone | 0.01 | L | H | L |
| Diazepam | 0.01 | L | H | L |
| Diclofenac sodium | 0.1 | H | L | L |
| Diloxanide furoate | 0.1 | L | L | L |
| Domperidone maleate | 0.1 | H | L | L |
| Doxifluridine | 33 | H | H | H |
| Epalrestat | 0.01 | L | L | L |
| Epinastine hydrochloride | 100 | H | L | H |
| Eprosartan mesylate | 0.01 | L | L | L |
| Ergometrine maleate | 1 | H | H | H |
| Erythromycin ethylsuccinate | 0.01 | L | H | L |
| Ethambutol hydrochloride | 10 | H | H | H |
| Ethinyl estradiol | 0.01 | H | H | L |
| Etizolam | 0.01 | H | H | L |
| Ezetimibe | 0.01 | L | L | L |
| Famotidine | 0.1 | L | H | L |
| Fexofenadine hydrochloride | 1 | H | L | H |
| Flurbiprofen | 0.01 | L | L | L |
| Furosemide | 0.01 | L | L | L |
| Glipizide | 0.01 | L | H | L |
| Glyburide | 0.01 | L | L | L |
| Griseofulvin | 0.01 | L | L | L |
| Hydrochlorothiazide | 0.01 | L | H | L |
| Imidapril hydrochloride | 33 | H | H | H |
| Isotretinoin | 0.01 | L | L | L |
| Ketotifen fumarate | 1 | H | H | H |
| L-carbocysteine | 0.1 | L | H | L |
| Levamisole hydrochloride | 33 | H | H | H |
| Levodopa | 1 | L | H | H |
| Levosulpiride | 0.01 | L | H | L |
| Limaprost alfadex | 100 | H | H | H |
| Linezolid | 1 | L | H | H |
| Lopinavir | 0.01 | L | L | L |
| Lorazepam | 0.08 | H | H | L |
| Losartan potassium | 100 | H | L | H |
| Loxoprofen sodium | 1000 | H | H | H |
| Manidipine hydrochloride | 0.01 | L | L | L |
| Mebendazole (chewable) | 0.01 | L | L | L |
| Metoclopramide hydrochloride | 0.01 | L | H | L |
| Metronidazole | 1 | L | H | H |
| Modafinil | 0.01 | L | H | L |
| Morphine sulfate | 33 | H | H | H |
| Mosapride citrate | 0.01 | L | L | L |
| Nicergoline | 0.01 | L | L | L |
| Niclosamide (chewable) | 0.01 | L | L | L |
| Nicotinamide | 100 | H | H | H |
| Nifurtimox | 33 | H | H | H |
| Nilvadipine | 0.01 | L | H | L |
| Norethindrone (norethisterone) | 0.01 | H | H | L |
| Ondansetron hydrochloride | 10 | H | L | H |
| Orlistat | 0.01 | L | L | L |
| Oxycodone hydrochloride | 0.01 | L | H | L |
| Penicillamine | 100 | H | H | H |
| Pergolide mesylate | 0.01 | H | H | L |
| Phenobarbital | 0.1 | L | H | L |
| Phenytoin (chewable) | 0.01 | L | L | L |
| Pioglitazone hydrochloride | 0.01 | L | L | L |
| Pranlukast hydrate | 0.01 | L | L | L |
| Promethazine hydrochloride | 100 | H | L | H |
| Propranolol hydrochloride | 33 | H | L | H |
| Pseudoephedrine hydrochloride | 10 | H | H | H |
| Pyrantel embonate | 0.01 | L | L | L |
| Pyridostigmine bromide | 100 | H | H | H |
| Pyridoxine hydrochloride | 100 | H | H | H |
| Raloxifene hydrochloride | 0.1 | L | L | L |
| Ramipril | 10 | H | H | H |
| Ranitidine hydrochloride | 100 | H | H | H |
| Rizatriptan benzoate | 33 | H | H | H |
| Sildenafil citrate | 1 | H | L | H |
| Spironolactone | 0.01 | L | H | L |
| Sulfadiazine | 0.01 | L | L | L |
| Sultamicillin tosilate | 0.1 | L | L | L |
| Tacrolimus | 0.01 | L | L | L |
| Taltirelin hydrate | 33 | H | H | H |
| Tamoxifen citrate | 0.01 | L | L | L |
| Tegafur | 10 | H | H | H |
| Telmisartan | 0.01 | L | L | L |
| Temocapril hydrochloride | 0.1 | H | H | L |
| Tenofovir disoproxil fumarate | 13.4 | H | L | H |
| Terazosin hydrochloride | 100 | H | L | H |
| Terbinafine hydrochloride | 1 | H | L | H |
| Toremifene citrate | 0.63 | H | L | H |
| Triflusal | 0.01 | L | L | L |
| Trimebutin maleate | 1 | H | L | H |
| Trimethoprim | 0.1 | L | H | L |
| Tulobuterol hydrochloride | 100 | H | H | H |
| Ursodeoxycholic acid (ursodiol) | 0.01 | L | L | L |
| Voglibose | 1000 | H | H | H |
| Warfarin sodium | 0.01 | L | H | L |
| Zaltoprofen | 0.01 | L | L | L |
3.3 Hypothesis testing
Descriptive statistics and the summary of hypothesis testing (BDDCSHS, high solubility > BDDCSLS, low solubility) of means and medians of MLogSM, MSol, and pDose are presented in table 4 and the boxplots for the three parameters are illustrated in figure 2 to aid visual comparison. There are three important findings to note: (1) hypothesis testing of MLogSM and MSol indicated the means and medians of BDDCSHS are statistically significantly greater than those of BDDCSLS (Table 4), (2) despite a slight overlap in the ranges of MLogSM (Figure 2A) and MSol (Figure 2B), for BDDCSHS and BDDCSLS groups, 85% of compounds were correctly classified in MLogSM_HS/ MSol_HS and MLogSM_LS/ MSol_LS groups using the TV from the ROC curve analysis (Table 1), and (3) although means and medians of pDose values in BDDCSHS are significantly greater than those in BDDCSLS (Table 4), a significant overlap in ranges of pDose between the two groups is observed (Figure 2C), indicating that the highest dose strength of compounds with high and low solubility fell within a similar range.
Table 4.
Descriptive statistics of means and medians of MLogSM, MSol (mg/mL), and pDose of compounds in BDDCSHS (high solubility, H) and BDDCSLS (low solubility, L).
| Category | N | Mean ± SD | Summarya | Median | Summaryb | Range |
|---|---|---|---|---|---|---|
| MLogSM (H) | 433 | −1.62 (1.25) | t-stat = 26 p-value < 0.0001 |
−1.47 | W-stat = 175503 p-value < 0.0001 |
−5.19, 1.70 |
| MLogSM (L) | 201 | −4.19 (1.11) | −4.07 | −8.84, −1.95 | ||
| MSol (H) | 433 | 113 (454) | t-stat = 5.17 p-value < 0.0001 |
10 | W-stat = 176234 p-value < 0.0001 |
0, 8300 |
| MSol (L) | 202 | 0.15 (0.29) | 0.03 | 0, 2.5 | ||
| pDose (H) | 460 | 3.96 (1.07) | t-stat = 3.25 p-value = 0.001 |
3.83 | W-stat = 180475 p-value < 0.0001 |
1.37, 8.60 |
| pDose (L) | 280 | 3.70 (0.96) | 3.47 | 2.10, 8.90 |
– Two-sample t-test for means (Testing mean of H > L)
– Mann-Whitney rank test for medians (Testing median of H > L)
Figure 2.

Boxplot of compounds in BDDCSHS (high solubility) and BDDCSLS (low solubility): (A) MLogSM, (B) MSol, and (C) pDose; the box itself (from top-to-bottom) represents 75th-, median, 25th-percentiles, the whiskers are 10th and 90th percentiles, and close black circles are outliers.
4. Discussion
In the present study, we evaluated MLogSM and MSol as indices of solubility using ROC curve analysis. On average, the results show 85% statistical confidence that compounds with MLogSM > −3.05 or MSol > 0.3 mg/mL will have high solubility and compounds with MLogSM ≤ −3.05 or MSol ≤ 0.3 mg/mL will have low solubility. Although the values of MLogSM or MSol for compounds were not significantly correlated, ~97% of compounds were classified identically by these two methods, indicating that either method can be used to classify new molecular entities. The application of our findings in the determination of the extent of solubility is illustrated in figure 3. ROC curve analysis has also been used for the qualitative prediction of human oral bioavailability from animal data, although in that analysis solubility was determined by the D0 equation (Olivares-Morales et al., 2014). Solubility is only one of the determinants of oral bioavailability of compounds and the present study focused on the rapid determination of solubility classes of compounds, which is applicable in early drug discovery.
Figure 3.

Decision tree for the determination of the extent of solubility in humans
FDA and EMA guidelines recommend the use of minimum Log solubility (cLogS) between pH of 1–7.5 for solubility determination of new molecular entities (CDER/FDA, 2000; EMA, 2010); however, we could not determine a statistically significant threshold value for minVSLgS 3–7.5 parameter as discussed above. Varma et al., have reported pH-dependent solubility and permeability criteria for provisional biopharmaceutics classification (BCS and BDDCS) where pH dependent solubility was evaluated for a set of 49 compounds (Varma et al., 2012). For the measured solubility (MSol), a threshold value of 0.2 mg/mL with 93 % sensitivity and 86 % specificity was reported to classify compounds according to BCS and BDDCS (Varma et al., 2012). In our analysis, MSol value of 0.2 mg/mL had the sensitivity and specificity values of 0.88 (95 % CI = 0.84 – 0.91) and 0.79 (95 % CI = 0.75 – 0.85); therefore, specificity was not statistically significant based on generally accepted criterion, albeit the value is close to being statistically significant. Broccatell et al., (2012) developed a model using 17 VolSurf+ descriptors to predict extent of metabolism and FDA solubility with >75 % accuracy on average using a training set of 300 oral drugs and a test set of 379 oral drugs (Broccatelli et al., 2012). Although, this model had fair predictive power, it required the calculation of 17 physicochemical descriptors, making its application less parsimonious (Broccatelli et al., 2012). Dahan et al., (2013) reported in silico/ in vitro methods to classify 185 compounds into BCS and BDDCS solubility classes by first using cLogP, KLogP (molecule contribution to LogP), ALogP (atomic contribution to LogP), and melting point of compounds to predict their solubility (Dahan et al., 2013). The authors then used the dose number equation (ratio of the highest strength dose and the predicted solubility) for their classification (Dahan et al., 2013). Utilizing this dataset as a validation dataset after excluding all compounds present in our experimental dataset, for an independent set of 108 compounds that we evaluated for external validation, we were able to correctly classify 81% and 95% of these compounds in high and low solubility groups, compared with respective RFS groups.
As discussed previously, the highest strength dose of new molecular entities is not available until the later phases of the drug development making the D0 approach less feasible for implementation in the early drug discovery process. Benet et al. (2011) observed that values of pDose were highest for BDDCS class 1 compared to other classes and the converse was true for BDDCS class 4, whereas BDDCS classes 2 and 3 were in the intermediate range (Benet et al., 2011). In terms of means and medians, our evaluation of pDose for compounds with high (BDDCSHS) and low (BDDCSLS) solubility demonstrated significant overlap (figure 2C); whereas, the ranges of both groups have minimal overlap for MLogSM (figure 2A) and MSol (figure 2B). This clearly illustrates that solubility class determination depends predominantly on the actual solubility indices (i.e. MLogSM or MSol) and not on the highest strength dose as these are very similar for both groups of compounds. Additionally, solubility classification can be determined based on our proposed methods without knowledge of highest strength dose. One limitation and consideration for using this approach is the knowledge of solubility value of a NME at physiological pH in water (media). It is important to note that solubility of compounds is sensitive to pH and media, which could potentially be a source of variability in the reported experimental solubility values. For example, solubility of alvimopan between pH 3–9 is <1 mg/mL (in water), 1–5 mg/mL at pH 1.2 (in water), and 10–25 mg/mL in aqueous 0.1 N sodium hydroxide (ENTEREG®, alvimopan FDA label).
5. Conclusion
In conclusion, we propose the use of statistically significant threshold values for two in vitro parameters, MLogSM (−3.05) and MSol (0.3 mg/ml), where either can be used to distinguish between new molecular entities with high and low solubility with ≥85% statistical confidence. This method has the advantages of not requiring knowledge of the highest strength dose and has high throughput screening capacity.
Acknowledgments
This work was supported by the National Institutes of Health National Institute on Drug Abuse [grant R01DA023223].
Footnotes
Publisher's Disclaimer: This is a PDF file of an unedited manuscript that has been accepted for publication. As a service to our customers we are providing this early version of the manuscript. The manuscript will undergo copyediting, typesetting, and review of the resulting proof before it is published in its final citable form. Please note that during the production process errors may be discovered which could affect the content, and all legal disclaimers that apply to the journal pertain.
References
- Amidon GL, Lennernas H, Shah VP, Crison JR. A theoretical basis for a biopharmaceutic drug classification: the correlation of in vitro drug product dissolution and in vivo bioavailability. Pharm Res. 1995;12:413–420. doi: 10.1023/a:1016212804288. [DOI] [PubMed] [Google Scholar]
- Balakin KV, Savchuk NP, Tetko IV. In silico approaches to prediction of aqueous and DMSO solubility of drug-like compounds: trends, problems and solutions. Curr Med Chem. 2006;13:223–241. doi: 10.2174/092986706775197917. [DOI] [PubMed] [Google Scholar]
- Benet LZ, Broccatelli F, Oprea TI. BDDCS applied to over 900 drugs. AAPS J. 2011;13:519–547. doi: 10.1208/s12248-011-9290-9. [DOI] [PMC free article] [PubMed] [Google Scholar]
- Bewick V, Cheek L, Ball J. Statistics review 13: receiver operating characteristic curves. Crit Care. 2004;8:508–512. doi: 10.1186/cc3000. [DOI] [PMC free article] [PubMed] [Google Scholar]
- Broccatelli F, Cruciani G, Benet LZ, Oprea TI. BDDCS class prediction for new molecular entities. Mol Pharm. 2012;9:570–580. doi: 10.1021/mp2004302. [DOI] [PMC free article] [PubMed] [Google Scholar]
- Campbell G. Advances in statistical methodology for the evaluation of diagnostic and laboratory tests. Stat Med. 1994;13:499–508. doi: 10.1002/sim.4780130513. [DOI] [PubMed] [Google Scholar]
- CDER/FDA; Research, C.f.D.E.a, editor Guidance for industry: Waiver of in vivo bioavailability and bioequivalence studies for imidiate-release solid oral dosage forms based on a biopharmaceutics classification system. 2000. [Google Scholar]
- Dahan A, Wolk O, Kim YH, Ramachandran C, Crippen GM, Takagi T, Bermejo M, Amidon GL. Purely in silico BCS classification: science based quality standards for the world’s drugs. Mol Pharm. 2013;10:4378–4390. doi: 10.1021/mp400485k. [DOI] [PubMed] [Google Scholar]
- Dearden JC. In silico prediction of aqueous solubility. Expert Opin Drug Discov. 2006;1:31–52. doi: 10.1517/17460441.1.1.31. [DOI] [PubMed] [Google Scholar]
- EMA; Agency, E.M, editor. APPENDIX III- BCS-based Biowaiver, Guideline on the investigation of bioequivalence. London: 2010. pp. 26–26. [Google Scholar]
- Galley HF. Editorial II: Solid as a ROC. Br J Anaesth. 2004;93:623–626. doi: 10.1093/bja/aeh247. [DOI] [PubMed] [Google Scholar]
- Hajian-Tilaki K. Receiver Operating Characteristic (ROC) Curve Analysis for Medical Diagnostic Test Evaluation. Caspian J Intern Med. 2013;4:627–635. [PMC free article] [PubMed] [Google Scholar]
- Hanley JA, McNeil BJ. The meaning and use of the area under a receiver operating characteristic (ROC) curve. Radiology. 1982;143:29–36. doi: 10.1148/radiology.143.1.7063747. [DOI] [PubMed] [Google Scholar]
- Hughes LD, Palmer DS, Nigsch F, Mitchell JB. Why are some properties more difficult to predict than others? A study of QSPR models of solubility, melting point, and Log P. J Chem Inf Model. 2008;48:220–232. doi: 10.1021/ci700307p. [DOI] [PubMed] [Google Scholar]
- Kerns EH, Di L, Carter GT. In vitro solubility assays in drug discovery. Curr Drug Metab. 2008;9:879–885. doi: 10.2174/138920008786485100. [DOI] [PubMed] [Google Scholar]
- Keskin M, Kurtoglu S, Kendirci M, Atabek ME, Yazici C. Homeostasis model assessment is more reliable than the fasting glucose/insulin ratio and quantitative insulin sensitivity check index for assessing insulin resistance among obese children and adolescents. Pediatrics. 2005;115:e500–503. doi: 10.1542/peds.2004-1921. [DOI] [PubMed] [Google Scholar]
- Lasko TA, Bhagwat JG, Zou KH, Ohno-Machado L. The use of receiver operating characteristic curves in biomedical informatics. J Biomed Inform. 2005;38:404–415. doi: 10.1016/j.jbi.2005.02.008. [DOI] [PubMed] [Google Scholar]
- Lusted LB. Signal detectability and medical decision-making. Science. 1971;171:1217–1219. doi: 10.1126/science.171.3977.1217. [DOI] [PubMed] [Google Scholar]
- Obuchowski NA. Receiver operating characteristic curves and their use in radiology. Radiology. 2003;229:3–8. doi: 10.1148/radiol.2291010898. [DOI] [PubMed] [Google Scholar]
- Olivares-Morales A, Hatley OJ, Turner D, Galetin A, Aarons L, Rostami-Hodjegan A. The use of ROC analysis for the qualitative prediction of human oral bioavailability from animal data. Pharm Res. 2014;31:720–730. doi: 10.1007/s11095-013-1193-2. [DOI] [PMC free article] [PubMed] [Google Scholar]
- Omalley AJ, Zou KH, Fielding JR, Tempany CM. Bayesian regression methodology for estimating a receiver operating characteristic curve with two radiologic applications: prostate biopsy and spiral CT of ureteral stones. Acad Radiol. 2001;8:713–725. doi: 10.1016/s1076-6332(03)80578-0. [DOI] [PubMed] [Google Scholar]
- Park SH, Goo JM, Jo CH. Receiver operating characteristic (ROC) curve: practical review for radiologists. Korean J Radiol. 2004;5:11–18. doi: 10.3348/kjr.2004.5.1.11. [DOI] [PMC free article] [PubMed] [Google Scholar]
- Varma MV, Gardner I, Steyn SJ, Nkansah P, Rotter CJ, Whitney-Pickett C, Zhang H, Di L, Cram M, Fenner KS, El-Kattan AF. pH-Dependent solubility and permeability criteria for provisional biopharmaceutics classification (BCS and BDDCS) in early drug discovery. Mol Pharm. 2012;9:1199–1212. doi: 10.1021/mp2004912. [DOI] [PubMed] [Google Scholar]
- Vitali C, Bombardieri S, Jonsson R, Moutsopoulos HM, Alexander EL, Carsons SE, Daniels TE, Fox PC, Fox RI, Kassan SS, Pillemer SR, Talal N, Weisman MH European Study Group on Classification Criteria for Sjogren’s S. Classification criteria for Sjogren’s syndrome: a revised version of the European criteria proposed by the American-European Consensus Group. Ann Rheum Dis. 2002;61:554–558. doi: 10.1136/ard.61.6.554. [DOI] [PMC free article] [PubMed] [Google Scholar]
- Yang X, Gandhi YA, Duignan DB, Morris ME. Prediction of biliary excretion in rats and humans using molecular weight and quantitative structure-pharmacokinetic relationships. AAPS J. 2009;11:511–525. doi: 10.1208/s12248-009-9124-1. [DOI] [PMC free article] [PubMed] [Google Scholar]
- Yang X, Gandhi YA, Morris ME. Biliary excretion in dogs: evidence for a molecular weight threshold. Eur J Pharm Sci. 2010;40:33–37. doi: 10.1016/j.ejps.2010.02.005. [DOI] [PubMed] [Google Scholar]
- Yu LX, Amidon GL, Polli JE, Zhao H, Mehta MU, Conner DP, Shah VP, Lesko LJ, Chen ML, Lee VH, Hussain AS. Biopharmaceutics classification system: the scientific basis for biowaiver extensions. Pharm Res. 2002;19:921–925. doi: 10.1023/a:1016473601633. [DOI] [PubMed] [Google Scholar]
- Zou KH, O’Malley AJ, Mauri L. Receiver-operating characteristic analysis for evaluating diagnostic tests and predictive models. Circulation. 2007;115:654–657. doi: 10.1161/CIRCULATIONAHA.105.594929. [DOI] [PubMed] [Google Scholar]